
Market Overview
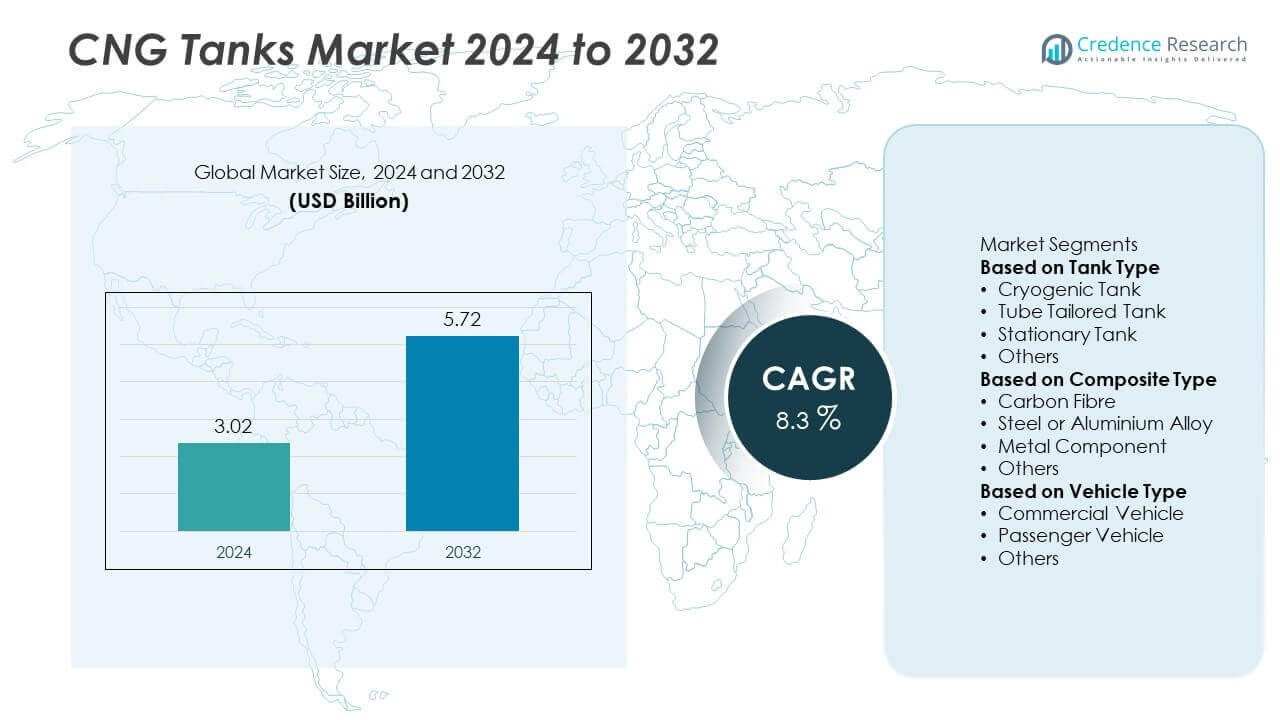
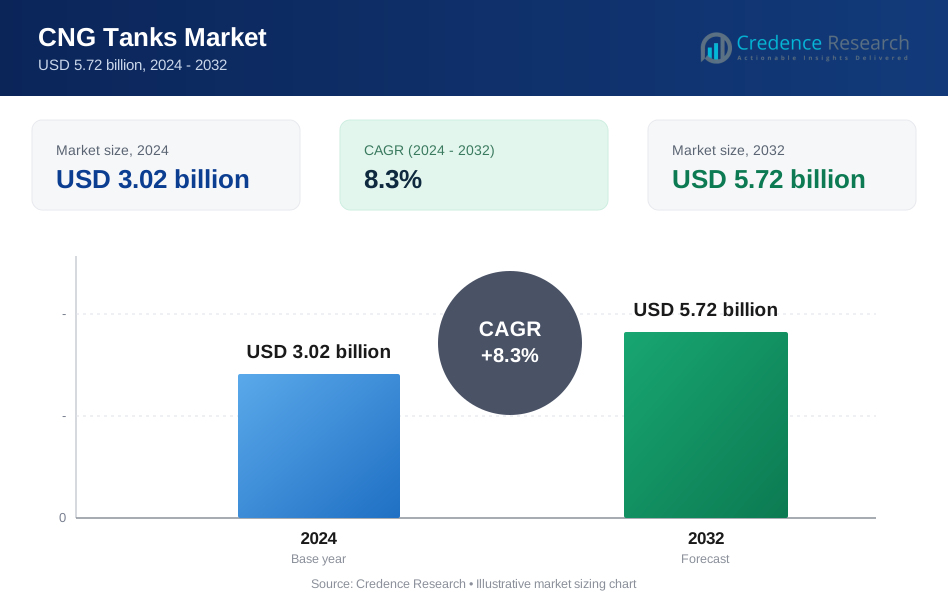
CNG Tanks Market size was valued at USD 3.02 billion in 2024 and is projected to reach USD 5.72 billion by 2032, growing at a CAGR of 8.3% during the forecast period.
| REPORT ATTRIBUTE | DETAILS |
|---|---|
| Historical Period | 2020-2023 |
| Base Year | 2024 |
| Forecast Period | 2025-2032 |
| CNG Tanks Market Size 2024 | USD 3.02 Billion |
| CNG Tanks Market, CAGR | 8.3% |
| CNG Tanks Market Size 2032 | USD 5.72 Billion |
Top players in the CNG Tanks market include Everest Kanto Cylinders Ltd., Luxfer Group, Praxair Technologies Inc., Ullit SA, Maruti Koatsu Cylinders Ltd., NGV Technologies Inc., Worthington Industries, Plastic Omnium, Anhui Clean Energy Co., Ltd., and Hexagon Composites ASA. These companies focus on developing lightweight composite tanks, expanding production capacity, and partnering with OEMs to support clean mobility adoption. Asia-Pacific leads the market with 34% share, driven by rapid adoption of CNG buses, trucks, and passenger vehicles supported by government incentives. Europe follows with 28% share, led by strong emission regulations and biogas integration, while North America holds 26% share, supported by fleet conversion programs and well-developed CNG refueling infrastructure.
Market Insights
- CNG Tanks market was valued at USD 3.02 billion in 2024 and is projected to reach USD 5.72 billion by 2032, growing at a CAGR of 8.3% during the forecast period.
- Rising demand for low-emission and cost-efficient transportation drives market growth, with cryogenic tanks holding the largest share and commercial vehicles contributing the majority of installations worldwide.
- Technological advancements in Type III and Type IV carbon fibre composite tanks improve fuel capacity, reduce weight, and enhance vehicle efficiency, making them preferred solutions for fleets.
- The market is competitive with key players such as Everest Kanto Cylinders Ltd., Luxfer Group, and Hexagon Composites ASA focusing on R&D, capacity expansion, and strategic partnerships with OEMs to strengthen market presence.
- Asia-Pacific leads with 34% share, followed by Europe at 28% and North America at 26%, driven by infrastructure development, government incentives, and growing adoption of CNG-powered fleets.
Market Segmentation Analysis:
By Tank Type
Cryogenic tanks dominate the CNG tanks market with over 60% share, driven by their ability to store natural gas at extremely low temperatures, ensuring higher energy density and extended vehicle range. They are widely used in heavy-duty trucks, buses, and industrial applications where large storage capacity is required. Tube tailored tanks are gaining traction in light commercial fleets due to their modular design and flexibility, while stationary tanks serve as storage solutions at refueling stations and industrial sites. Rising demand for alternative fuel infrastructure is boosting adoption across all tank categories.
- For instance, Inox Air Products in India operates 54 specialized cryogenic tankers with a combined trunking capacity of 380,000 liters of oxygen to supply hospitals during demand surges
By Composite Type
Carbon fibre composite tanks lead the market with more than 50% share due to their lightweight construction, superior strength, and ability to withstand high pressures. These tanks improve vehicle efficiency by reducing weight, which is critical for commercial fleets seeking better fuel economy. Steel or aluminium alloy tanks remain relevant in cost-sensitive applications where weight reduction is less critical, while glass fibre and metal component composites are used in niche segments that require a balance between cost and performance. Growing investment in Type IV carbon fibre tanks continues to strengthen this segment’s dominance.
- For instance, the Toray Group is expanding its annual global carbon fiber production capacity to 35,000 metric tons, with new production starting in 2025 at its factories in the U.S. (South Carolina) and South Korea, complementing existing facilities in France and elsewhere. The expansion is in response to rising demand for composite pressure vessels for clean energy applications like hydrogen and natural gas storage.
By Vehicle Type
Commercial vehicles account for over 70% share of the CNG tank market, as fleet operators adopt CNG systems to reduce fuel costs and comply with emission regulations. Buses, trucks, and delivery vans widely integrate high-capacity CNG tanks to ensure longer operating ranges and minimize downtime. Passenger vehicles form a growing segment driven by consumer preference for economical and environmentally friendly fuel options, while off-road vehicles and specialty fleets are adopting CNG for sustainability goals. Expansion of CNG refueling infrastructure continues to drive adoption across all vehicle categories.
Key Growth Drivers
Rising Demand for Low-Emission Vehicles
The CNG tanks market is growing as governments and fleet operators push for cleaner transportation. Compressed natural gas offers lower CO₂ and NOx emissions compared to diesel and petrol, making it a preferred fuel for public transport and logistics fleets. Incentives such as tax benefits, purchase subsidies, and access to low-emission zones are encouraging adoption of CNG-powered vehicles. This rising shift toward alternative fuels is increasing the demand for high-capacity, lightweight CNG tanks that enhance vehicle range and efficiency while meeting stringent global emission regulations.
- For instance, the Delhi Transport Corporation (DTC) of India deployed 3,109 CNG buses by March 2025 in its total fleet of 4,359 buses.
Expansion of CNG Refueling Infrastructure
Growth in CNG refueling stations globally is a major driver for the CNG tanks market. Governments and private companies are investing heavily in expanding CNG distribution networks to support adoption across commercial and passenger vehicles. This improved accessibility reduces range anxiety and encourages fleet operators to convert vehicles to CNG. The availability of fast-fill and time-fill station technology further supports adoption. This infrastructure growth directly boosts demand for CNG storage tanks, both onboard vehicles and at fueling stations, creating a positive market outlook.
- For instance, Bengal Gas Company Ltd (BGCL) commissioned seven more CNG stations during the 2024-2025 financial year, increasing its total to 27 stations in the Kolkata geographical area. The company has a longer-term goal of setting up around 90 CNG stations across West Bengal.
Technological Advancements in Composite Tanks
Advancements in lightweight composite tank technology are fueling market growth by improving safety and efficiency. Type IV carbon fibre tanks offer superior pressure resistance, corrosion protection, and weight reduction, allowing vehicles to carry more fuel without compromising payload. These innovations are particularly attractive to commercial fleets, where fuel efficiency and operating costs are critical. Continuous R&D efforts are reducing manufacturing costs, making composite tanks more accessible for mass adoption. This technological progress enhances performance and drives higher adoption rates across automotive and industrial applications.
Key Trends & Opportunities
Growing Adoption of Type IV Tanks
The shift toward Type IV carbon fibre composite tanks is a significant trend, driven by their lightweight design and high durability. These tanks improve fuel economy, increase vehicle range, and support compliance with strict emission norms. Adoption is particularly strong in long-haul trucks, buses, and high-pressure storage applications. Manufacturers are focusing on reducing production costs through automation and material optimization, creating opportunities for wider market penetration. Partnerships between tank manufacturers and OEMs are expected to accelerate commercialization and expand global deployment.
- For instance, NPROXX introduced its Type IV tanks AH710-70 and AH620-70 designed for long-haul trucks; these tanks draw on its 20 years of experience and are built for demanding pressure vessel performance.
Integration of CNG in Hybrid and Dual-Fuel Vehicles
The increasing use of hybrid and dual-fuel systems presents new opportunities for the CNG tanks market. These configurations allow vehicles to switch between conventional fuel and CNG, improving operational flexibility and reducing emissions. Fleet operators prefer such systems to ensure range security while benefiting from cost savings associated with CNG. OEMs are developing factory-fitted dual-fuel solutions that require advanced tank designs with optimized weight and capacity. This trend is likely to drive demand for innovative tank solutions compatible with next-generation vehicle platforms.
- For instance, in the U.S. and Canada, roughly 50 different manufacturers produce about 100 models of light-, medium-, and heavy-duty natural gas vehicles and engines. These include dedicated and dual-fuel systems, with options available from original equipment manufacturers and qualified system retrofitters.
Key Challenges
High Initial Costs of Composite Tanks
The adoption of advanced composite CNG tanks is limited by their higher upfront cost compared to traditional steel tanks. Type IV carbon fibre tanks require complex manufacturing processes, driving up capital investment for fleets and vehicle buyers. For cost-sensitive markets, this becomes a major barrier despite long-term operational savings. Manufacturers are focusing on process improvements and material sourcing to reduce costs and make lightweight tanks more affordable, but price remains a key challenge slowing widespread adoption in developing regions.
Limited CNG Infrastructure in Emerging Markets
Despite growing investments, many emerging economies still lack adequate CNG refueling infrastructure, which restricts market growth. Sparse availability of stations leads to range anxiety for drivers, especially in rural areas. This infrastructure gap discourages adoption of CNG vehicles and reduces demand for onboard tanks. Expanding the refueling network requires high capital expenditure and long lead times, slowing adoption rates. Collaborative efforts between governments, energy providers, and OEMs will be crucial to overcome this challenge and unlock market potential in underserved regions.
Regional Analysis
North America
North America holds 26% market share, driven by the adoption of CNG-powered commercial fleets and strong government support for clean energy initiatives. The United States leads with investments in public transportation projects and fleet conversion programs, boosting demand for high-capacity CNG tanks. Canada contributes steadily with growing adoption in municipal bus fleets and logistics vehicles. The region benefits from a well-developed CNG refueling infrastructure and stringent emission regulations that encourage fleet operators to switch from diesel to CNG. Technological advancements and incentives for low-emission vehicles continue to fuel market expansion across the region.
Europe
Europe accounts for 28% market share, supported by strict emission norms under Euro 6 and strong focus on decarbonizing transport. Italy, Germany, and Spain lead CNG adoption with extensive refueling networks and supportive government subsidies. The demand for lightweight composite tanks is rising as OEMs and fleet operators seek to optimize fuel efficiency and reduce vehicle weight. Growing use of CNG in buses, light commercial vehicles, and municipal fleets drives steady growth. The European market is also witnessing increased investment in biogas and renewable natural gas integration, further enhancing demand for advanced storage solutions.
Asia-Pacific
Asia-Pacific leads with 34% market share, making it the largest and fastest-growing region. China and India dominate demand due to government policies promoting alternative fuels, large population density, and expansion of public transport systems. The rapid rise of CNG-powered buses, trucks, and passenger vehicles drives significant consumption of onboard tanks. Local manufacturing capacity expansion and cost-competitive production support large-scale adoption. Japan and South Korea focus on high-pressure, lightweight tank technologies for clean mobility solutions. The region’s strong government incentives, combined with expanding CNG refueling infrastructure, position Asia-Pacific as the primary growth engine for the market.
Latin America
Latin America holds 7% market share, with Brazil, Argentina, and Colombia as leading adopters of CNG technology. High fuel prices and favorable government policies encourage vehicle owners and fleet operators to convert to CNG, driving demand for tanks. The region has a well-developed conversion market, particularly for passenger vehicles and taxis. Growth is supported by expanding CNG station networks and partnerships between energy companies and governments. However, economic volatility and infrastructure gaps in rural areas pose challenges. Continued investment in fueling infrastructure and public awareness campaigns are expected to sustain steady market growth.
Middle East & Africa
Middle East & Africa represent 5% market share, with increasing focus on diversifying energy sources and reducing oil dependence. Countries such as Iran and Egypt are actively promoting CNG adoption in public and private fleets. GCC nations are expanding CNG and LNG infrastructure to support cleaner transportation. Africa’s adoption is led by South Africa, where logistics companies are shifting to alternative fuels to control operating costs. Limited infrastructure remains a challenge, but government initiatives and partnerships with global energy companies are driving progress. The region shows potential for long-term growth as clean mobility efforts accelerate.
Market Segmentations:
By Tank Type
- Cryogenic Tank
- Tube Tailored Tank
- Stationary Tank
- Others
By Composite Type
- Carbon Fibre
- Steel or Aluminium Alloy
- Metal Component
- Others
By Vehicle Type
- Commercial Vehicle
- Passenger Vehicle
- Others
By Geography
- North America
- The U.S.
- Canada
- Mexico
- Europe
- Germany
- France
- The U.K.
- Italy
- Spain
- Rest of Europe
- Asia Pacific
- China
- Japan
- India
- South Korea
- South-east Asia
- Rest of Asia Pacific
- Latin America
- Brazil
- Argentina
- Rest of Latin America
- Middle East & Africa
- GCC Countries
- South Africa
- Rest of the Middle East and Africa
Competitive Landscape
The competitive landscape of the CNG Tanks market is shaped by key players such as Everest Kanto Cylinders Ltd., Luxfer Group, Praxair Technologies Inc., Ullit SA, Maruti Koatsu Cylinders Ltd., NGV Technologies Inc., Worthington Industries, Plastic Omnium, Anhui Clean Energy Co., Ltd., and Hexagon Composites ASA. These companies focus on producing high-strength, lightweight tanks that meet global safety standards and deliver superior fuel efficiency. Leading players invest in research and development to advance Type III and Type IV composite tank technology, improving durability and reducing weight. Strategic partnerships with OEMs and government-backed clean mobility programs help strengthen market penetration, particularly in Asia-Pacific and Europe. Companies are also expanding manufacturing capacity and optimizing supply chains to meet rising demand from commercial fleets and public transportation projects. Competitive differentiation is driven by innovation, cost-effectiveness, regulatory compliance, and the ability to provide customized solutions for diverse automotive and industrial applications.
Key Player Analysis
- Everest Kanto Cylinders Ltd.
- Luxfer Group
- Praxair Technologies Inc
- Ullit SA
- Maruti Koatsu Cylinders Ltd
- NGV Technologies Inc
- Worthington Industries
- Plastic Omnium
- Anhui Clean Energy Co., Ltd.
- Hexagon Composites ASA
Recent Developments
- In September 2025, Hexagon Composites ASA (through its Hexagon Agility unit) received a new wave of orders for natural gas fuel systems for North American heavy-duty trucks.
- In July 2025, Everest Kanto Cylinder Ltd. announced exit from its Hungary project: EKC FZE sold its 80% shareholding in the joint venture EKC Europe Zrt. to its JV partner and associated entities.
- In July 2025, Everest Kanto Cylinder Ltd. published its Business Responsibility & Sustainability Report for FY 2024-25, disclosing that it operates 7 plants internationally
- In May 2025, Hexagon Agility reached a milestone by gaining additional fuel system orders supporting X15-N natural gas-powered trucks from more than 20 Class 8 fleets.
Report Coverage
The research report offers an in-depth analysis based on Tank Type, Composite Type, Vehicle Type and Geography. It details leading market players, providing an overview of their business, product offerings, investments, revenue streams, and key applications. Additionally, the report includes insights into the competitive environment, SWOT analysis, current market trends, as well as the primary drivers and constraints. Furthermore, it discusses various factors that have driven market expansion in recent years. The report also explores market dynamics, regulatory scenarios, and technological advancements that are shaping the industry. It assesses the impact of external factors and global economic changes on market growth. Lastly, it provides strategic recommendations for new entrants and established companies to navigate the complexities of the market.
Future Outlook
- Demand for CNG tanks will rise as governments promote low-emission transportation solutions.
- Adoption of Type IV carbon fibre composite tanks will increase due to their lightweight and high capacity.
- Expansion of CNG refueling infrastructure will encourage fleet conversions and boost tank demand.
- Commercial vehicles will remain the dominant segment as logistics and public transport fleets switch to CNG.
- Passenger vehicle adoption will grow with factory-fitted CNG models from major automakers.
- Manufacturers will invest in automation and advanced materials to reduce production costs and improve performance.
- Strategic collaborations between tank producers and OEMs will accelerate market penetration globally.
- Integration of CNG tanks in hybrid and dual-fuel systems will create new opportunities.
- Asia-Pacific will remain the fastest-growing region, supported by large-scale public transport projects.
- Strict emission regulations will continue to drive innovation and adoption of high-pressure, safe, and efficient CNG storage solutions.
Request a Free Sample
Fill in your details and we'll send you a free sample report.
- Sample data tables & charts
- Research methodology
Need a Custom Version of This Report?
Tailor the scope, geography, or segments to your exact requirements.
- Custom geography or segment scope
- Direct access to our analyst team
Frequently Asked Questions
What is the current market size for CNG Tanks market, and what is its projected size in 2032?
At what Compound Annual Growth Rate is the CNG Tanks market projected to grow between 2025 and 2032?
Which CNG Tanks market segment held the largest share in 2024?
What are the primary factors fueling the growth of the CNG Tanks market?
Who are the leading companies in the CNG Tanks market?
Which region commanded the largest share of the CNG Tanks market in 2024?
Table of Content
Chapter 1. Report Introduction
- 1.1 Report Description & Purpose
- 1.1.1 Report Title & Market Definition
- 1.1.2 Unique Selling Propositions (USP) & Key Differentiators
- 1.1.3 Value Proposition for Stakeholders
- 1.2 Research Objectives
- 1.2.1 Market Sizing Objectives (Volume & Revenue)
- 1.2.2 Segmentation Objectives
- 1.2.3 Competitive Intelligence Objectives
- 1.2.4 Forecast & Scenario Objectives
- 1.3 Report Scope
- 1.3.1 CNG Tanks Scope – Types & Subtypes Covered
- 1.3.2 Geographic Scope – Regions & Countries Covered
- 1.3.3 Historical Period, Base Year & Forecast Period (2024; forecast to 2032)
- 1.3.4 Inclusions & Exclusions
- 1.4 HS Code & Classification Framework
- 1.5 Currency, Units & Pricing Basis
- 1.6 Target Stakeholders
- 1.7 Limitations & Assumptions
Chapter 2. Executive Summary
- 2.1 Global CNG Tanks Market Snapshot
- 2.1.1 Market Size – Historical (2024) & Forecast (2024-2032) (2024: USD 3.02 billion → 2032: USD 5.72 billion)
- 2.1.2 Volume & Revenue – Global Totals
- 2.1.3 Key Market Highlights – Top Five Facts
- 2.2 CNG Tanks Market Segmentation Snapshot
- 2.2.1 Market Split by Region – 2024 vs. 2032
- 2.3 Competitive Snapshot
- 2.3.1 Top 10 Players by Revenue Share – 2024
- 2.3.2 Top 10 Players by Volume Share – 2024
- 2.3.3 Recent Strategic Developments (18-Month Summary)
- 2.4 Key Investment Highlights & Strategic Conclusions
Chapter 3. CNG Tanks Market Dynamics & Industry Analysis
- 3.1 Market Overview & Context
- 3.1.1 CNG Tanks Market Position in the Broader Automotive Value Chain
- 3.1.2 OEM vs. Replacement Market Dynamics
- 3.1.3 Market Maturity & Development Stage by Region
- 3.2 CNG Tanks Market Drivers
- 3.3 CNG Tanks Market Restraints & Challenges
- 3.4 CNG Tanks Market Opportunities
- 3.5 Porter's Five Forces Analysis
- 3.5.1 Threat of New Entrants
- 3.5.2 Bargaining Power of Suppliers
- 3.5.3 Bargaining Power of Buyers
- 3.5.4 Threat of Substitutes
- 3.5.5 Competitive Rivalry – Intensity Assessment
- 3.6 CNG Tanks Value Chain Analysis
- 3.6.1 Upstream – Raw Material/Input Suppliers
- 3.6.1.1 Raw Material/Input 1
- 3.6.1.2 Raw Material/Input 2
- 3.6.1.3 Raw Material/Input 3
- 3.6.2 Midstream – Production/Manufacturing/Service Delivery
- 3.6.2.1 Production/Process Overview
- 3.6.2.2 Key Facility Locations & Capacity by Manufacturer
- 3.6.3 Downstream – Distribution & End Consumer
- 3.6.3.1 Primary Channel – B2B/OEM
- 3.6.3.2 Secondary Channels – Dealer, Retail, Online, Direct
- 3.6.4 Value Chain Profitability Analysis
- 3.6.1 Upstream – Raw Material/Input Suppliers
- 3.7 PESTEL Analysis
- 3.7.1 Political Factors
- 3.7.2 Economic Factors
- 3.7.3 Social Factors
- 3.7.4 Technological Factors
- 3.7.5 Environmental Factors
- 3.7.6 Legal Factors
- 3.8 CNG Tanks Supply Chain Analysis
- 3.8.1 Raw Material/Input Supply Risk Assessment
- 3.8.2 Manufacturing Concentration Risk (Geographic Exposure)
- 3.8.3 Trade Disruption Impact Analysis
- 3.9 Regulatory & Policy Landscape
Note: The regulatory and policy landscape section covers regulations based on their applicability to the market, CNG Tanks category, geography, and scope of the study. Only regulatory frameworks with a material impact on operations, compliance, trade, sustainability, or market access are analyzed in detail.
Chapter 4. Key Investment Pockets & Opportunity Analysis
- 4.1 CNG Tanks Market Attractiveness Analysis
- 4.1.1 By Region – Investment Attractiveness Matrix (Volume × CAGR)
- 4.2 Absolute Revenue Growth Opportunity
- 4.2.1 By Region – Absolute USD Growth Through 2032
- 4.3 Incremental Volume Opportunity
- 4.3.1 By Region – Incremental Volume Through 2032
- 4.3.2 Segment – Incremental Volume
- 4.4 Emerging Submarket Opportunity Deep Dive (Subject to Applicability)
- 4.5 Emerging Market Opportunity Scorecards
- 4.5.1 United States
- 4.5.2 Europe
- 4.5.3 Asia
- 4.5.4 Middle East & Africa
Note: Emerging Market Opportunity Scorecards will be included based on relevance and strategic importance. Regions listed are indicative and may vary depending on data availability and market dynamics.
Chapter 5. CNG Tanks Import-Export Analysis & Trade Flows
- 5.1 Global Trade Overview
- 5.1.1 Global Export Value by Country (2024)
- 5.1.2 Global Export Volume by Country (2024)
- 5.1.3 Global Import Value by Country (2024)
- 5.1.4 Global Import Volume by Country (2024)
- 5.1.5 Net Trade Balance by Country (2024)
- 5.2 Export Analysis – Segment
- 5.2.1 Type 1 (HS Code)
- 5.2.2 Type 2 (HS Code)
- 5.2.3 Type 3 (HS Code)
- 5.2.4 Type 4 (HS Code)
- 5.2.5 Type 5 (HS Code)
- 5.3 Import Analysis – Segment
- 5.3.1 Type 1 (HS Code)
- 5.3.2 Type 2 (HS Code)
- 5.3.3 Type 3 (HS Code)
- 5.3.4 Type 4 (HS Code)
- 5.3.5 Type 5 (HS Code)
- 5.4 Average Unit Trade Prices
- 5.4.1 Average Export Price – Segment & Country
- 5.4.2 Average Import Price – Segment & Source Country
- 5.4.3 Price Trends (2024)
- 5.5 Key Trade Route Analysis
- 5.5.1 Trade Route 1
- 5.5.2 Trade Route 2
- 5.5.3 Trade Route 3
- 5.5.4 Trade Route 4
- 5.5.5 Trade Route 5
- 5.6 Trade Policy Impact Assessment
- 5.6.1 US Anti-Dumping & Section 301 Tariffs
- 5.6.2 EU Customs Union Impact
- 5.6.3 Major Free Trade Agreements
- 5.6.4 USMCA Rules of Origin
Note: Trade policy analysis will be included only where relevant to the CNG Tanks market.
Chapter 6. Competitive Landscape & Company Benchmarking
- 6.1 CNG Tanks Market Concentration & Structure
- 6.1.1 Herfindahl-Hirschman Index (HHI) – vs. 2024
- 6.1.2 Tier 1, Tier 2 & Tier 3 Market Structure
- 6.1.3 Global, Regional & Local Player Dynamics
- 6.2 CNG Tanks Market Share Analysis – 2024
- 6.2.1 Global Revenue Share by Company
- 6.2.2 Global Volume Share by Company
- 6.2.3 Regional Revenue Share
- 6.2.4 Market Share Evolution ( vs. 2024)
- 6.2.5 OEM Segment Share by Company
- 6.2.6 Replacement Segment Share by Company
- 6.3 Production/Delivery Capacity & Facility Analysis
- 6.3.1 Global Installed Capacity
- 6.3.2 Capacity Utilization Rates
- 6.3.3 Production/Output Volume
- 6.3.4 Facility Locations & Capacity Map
- 6.3.5 Planned Capacity Additions
- 6.4 CNG Tanks Competitive Benchmarking Matrix
- 6.4.1 Revenue, Volume, CAGR & Profitability Comparison
- 6.4.2 Channel Revenue Mix
- 6.4.3 Geographic Revenue Exposure
- 6.4.4 R&D Intensity
- 6.4.5 Sustainability Maturity
- 6.5 Strategic Developments in CNG Tanks (Last 24 Months)
- 6.5.1 Mergers, Acquisitions & Divestments
- 6.5.2 New CNG Tanks Launches
- 6.5.3 Facility Expansions
- 6.5.4 Strategic Alliances, Joint Ventures & Partnerships
- 6.5.5 Distribution Expansion & Market Entry
- 6.5.6 Sustainability & ESG Initiatives
- 6.6 Competitive Strategy Mapping
- 6.6.1 Leader, Challenger, Follower & Niche Classification
- 6.6.2 Pricing Strategy Comparison
- 6.6.3 Channel Strategy Matrix
Note: Strategic developments are included based on their materiality and the availability of reliable information.
Chapter 7. Global CNG Tanks Market – By Distribution Channel
- 7.1 Segment Overview
- 7.1.1 Volume & Revenue Split by Channel (2024 & 2032)
- 7.1.2 Channel Mix Evolution (2024-2032)
Chapter 8. Regional Market Analysis – Global Overview
- 8.1 Global Regional Overview
- 8.1.1 Regional Volume Share
- 8.1.2 Regional Revenue Share
- 8.1.3 Regional Volume by Region
- 8.1.4 Regional Revenue by Region
- 8.1.5 Regional Forecast Through 2032
- 8.2 Cross-Regional Segment Analysis
- 8.2.1 By Distribution Channel
- 8.2.2 By Brand/Price Tier
Chapter 9. North America CNG Tanks Market
- 9.1 United States
- 9.2 Canada
- 9.3 Mexico
Chapter 10. Europe CNG Tanks Market
- 10.1 Germany
- 10.2 France
- 10.3 Italy
- 10.4 United Kingdom
- 10.5 Spain
- 10.6 Poland
- 10.7 Russia
- 10.8 Netherlands
- 10.9 Belgium
- 10.10 Sweden
- 10.11 Denmark
- 10.12 Norway
- 10.13 Rest of Europe
Chapter 11. Asia Pacific CNG Tanks Market
- 11.1 China
- 11.2 India
- 11.3 Japan
- 11.4 South Korea
- 11.5 Thailand
- 11.6 Indonesia
- 11.7 Vietnam
- 11.8 Malaysia
- 11.9 Australia
- 11.10 Rest of Asia Pacific
Chapter 12. Latin America CNG Tanks Market
- 12.1 Brazil
- 12.2 Argentina
- 12.3 Colombia
- 12.4 Chile
- 12.5 Rest of Latin America
Chapter 13. Middle East CNG Tanks Market
- 13.1 Saudi Arabia
- 13.2 United Arab Emirates
- 13.3 Turkey
- 13.4 Israel
- 13.5 Iran
- 13.6 Rest of the Middle East
Chapter 14. Africa CNG Tanks Market
- 14.1 South Africa
- 14.2 Egypt
- 14.3 Nigeria
- 14.4 Morocco
- 14.5 Rest of Africa
Chapter 15. CNG Tanks Company Profiles
- 15.1 [Company 01]
- 15.1.1 Company Overview
- 15.1.2 Key Management Personnel
- 15.1.3 Products & Services Portfolio
- 15.1.4 Financial Performance
- 15.1.5 Key Market Focus & Geographic Presence
- 15.1.6 Recent Developments & Strategic Initiatives
Note: The company profile list is preliminary and may change based on research findings, market developments, data availability, and client requirements.
Chapter 16. Appendices
- Appendix A – List of Abbreviations & Acronyms
- Appendix B – Industry Classification Code Reference – Full Series
- Appendix C – Production & Capacity Data Tables
- Appendix D – End-Use & Demand Base Tables
- Appendix E – Consumption & Replacement Rate Assumptions
- Appendix F – ASP Reference Tables
- Appendix G – Manufacturing & Facility Database
- Appendix H – Import-Export Data Tables
- Appendix I – Regulatory Summary Tables
- Appendix J – Primary Research Participant List (Anonymized)
- Appendix K – Primary Research Questionnaire Framework
- Appendix L – Data Sources & Bibliography
- Appendix M – Market Size Divergence & Source Comparison
Chapter 17. Research Methodology
- 17.1 Research Framework & Philosophy
- 17.2 Secondary Research – Sources, Hierarchy & Data Extraction
- 17.3 Data Modeling – Bottom-Up & Top-Down Market Sizing
- 17.4 Primary Research – Stakeholder Framework, LOI & Sample Sizes
- 17.5 Forecast Methodology – Regression, Scenario & Sensitivity Analysis
- 17.6 Quality Control – Four-Layer Validation Framework
- 17.7 Limitations & Standard Assumptions
- 17.8 Disclaimer
