
Asia Pacific power billing rests on China and rising load
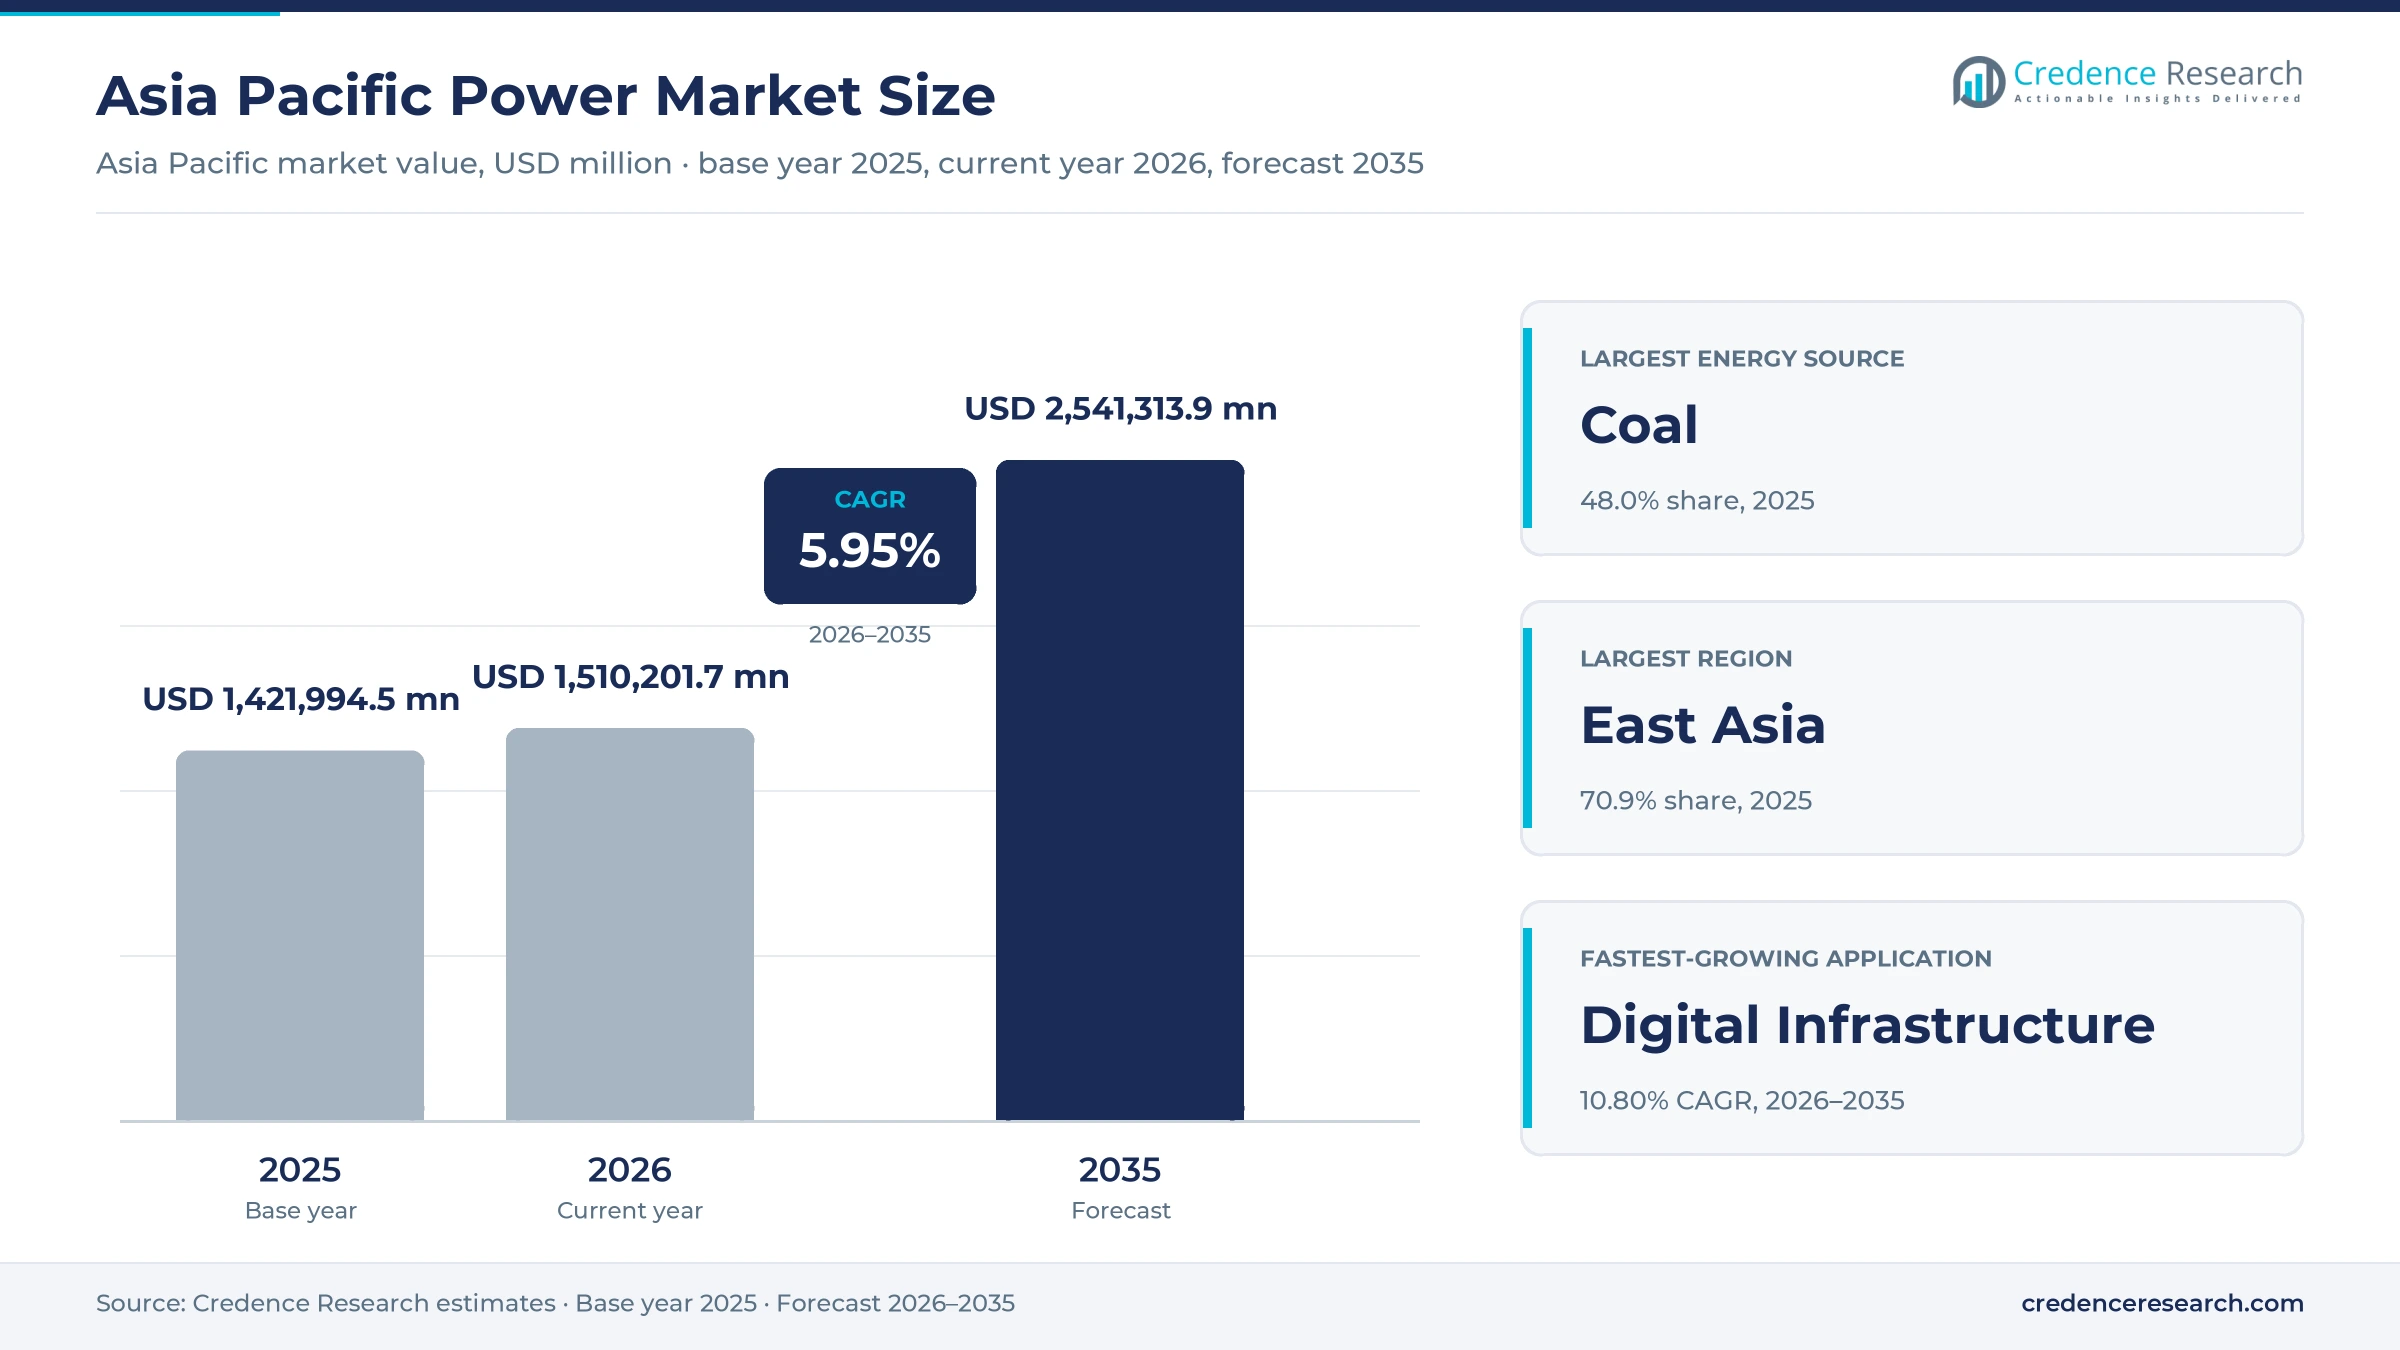
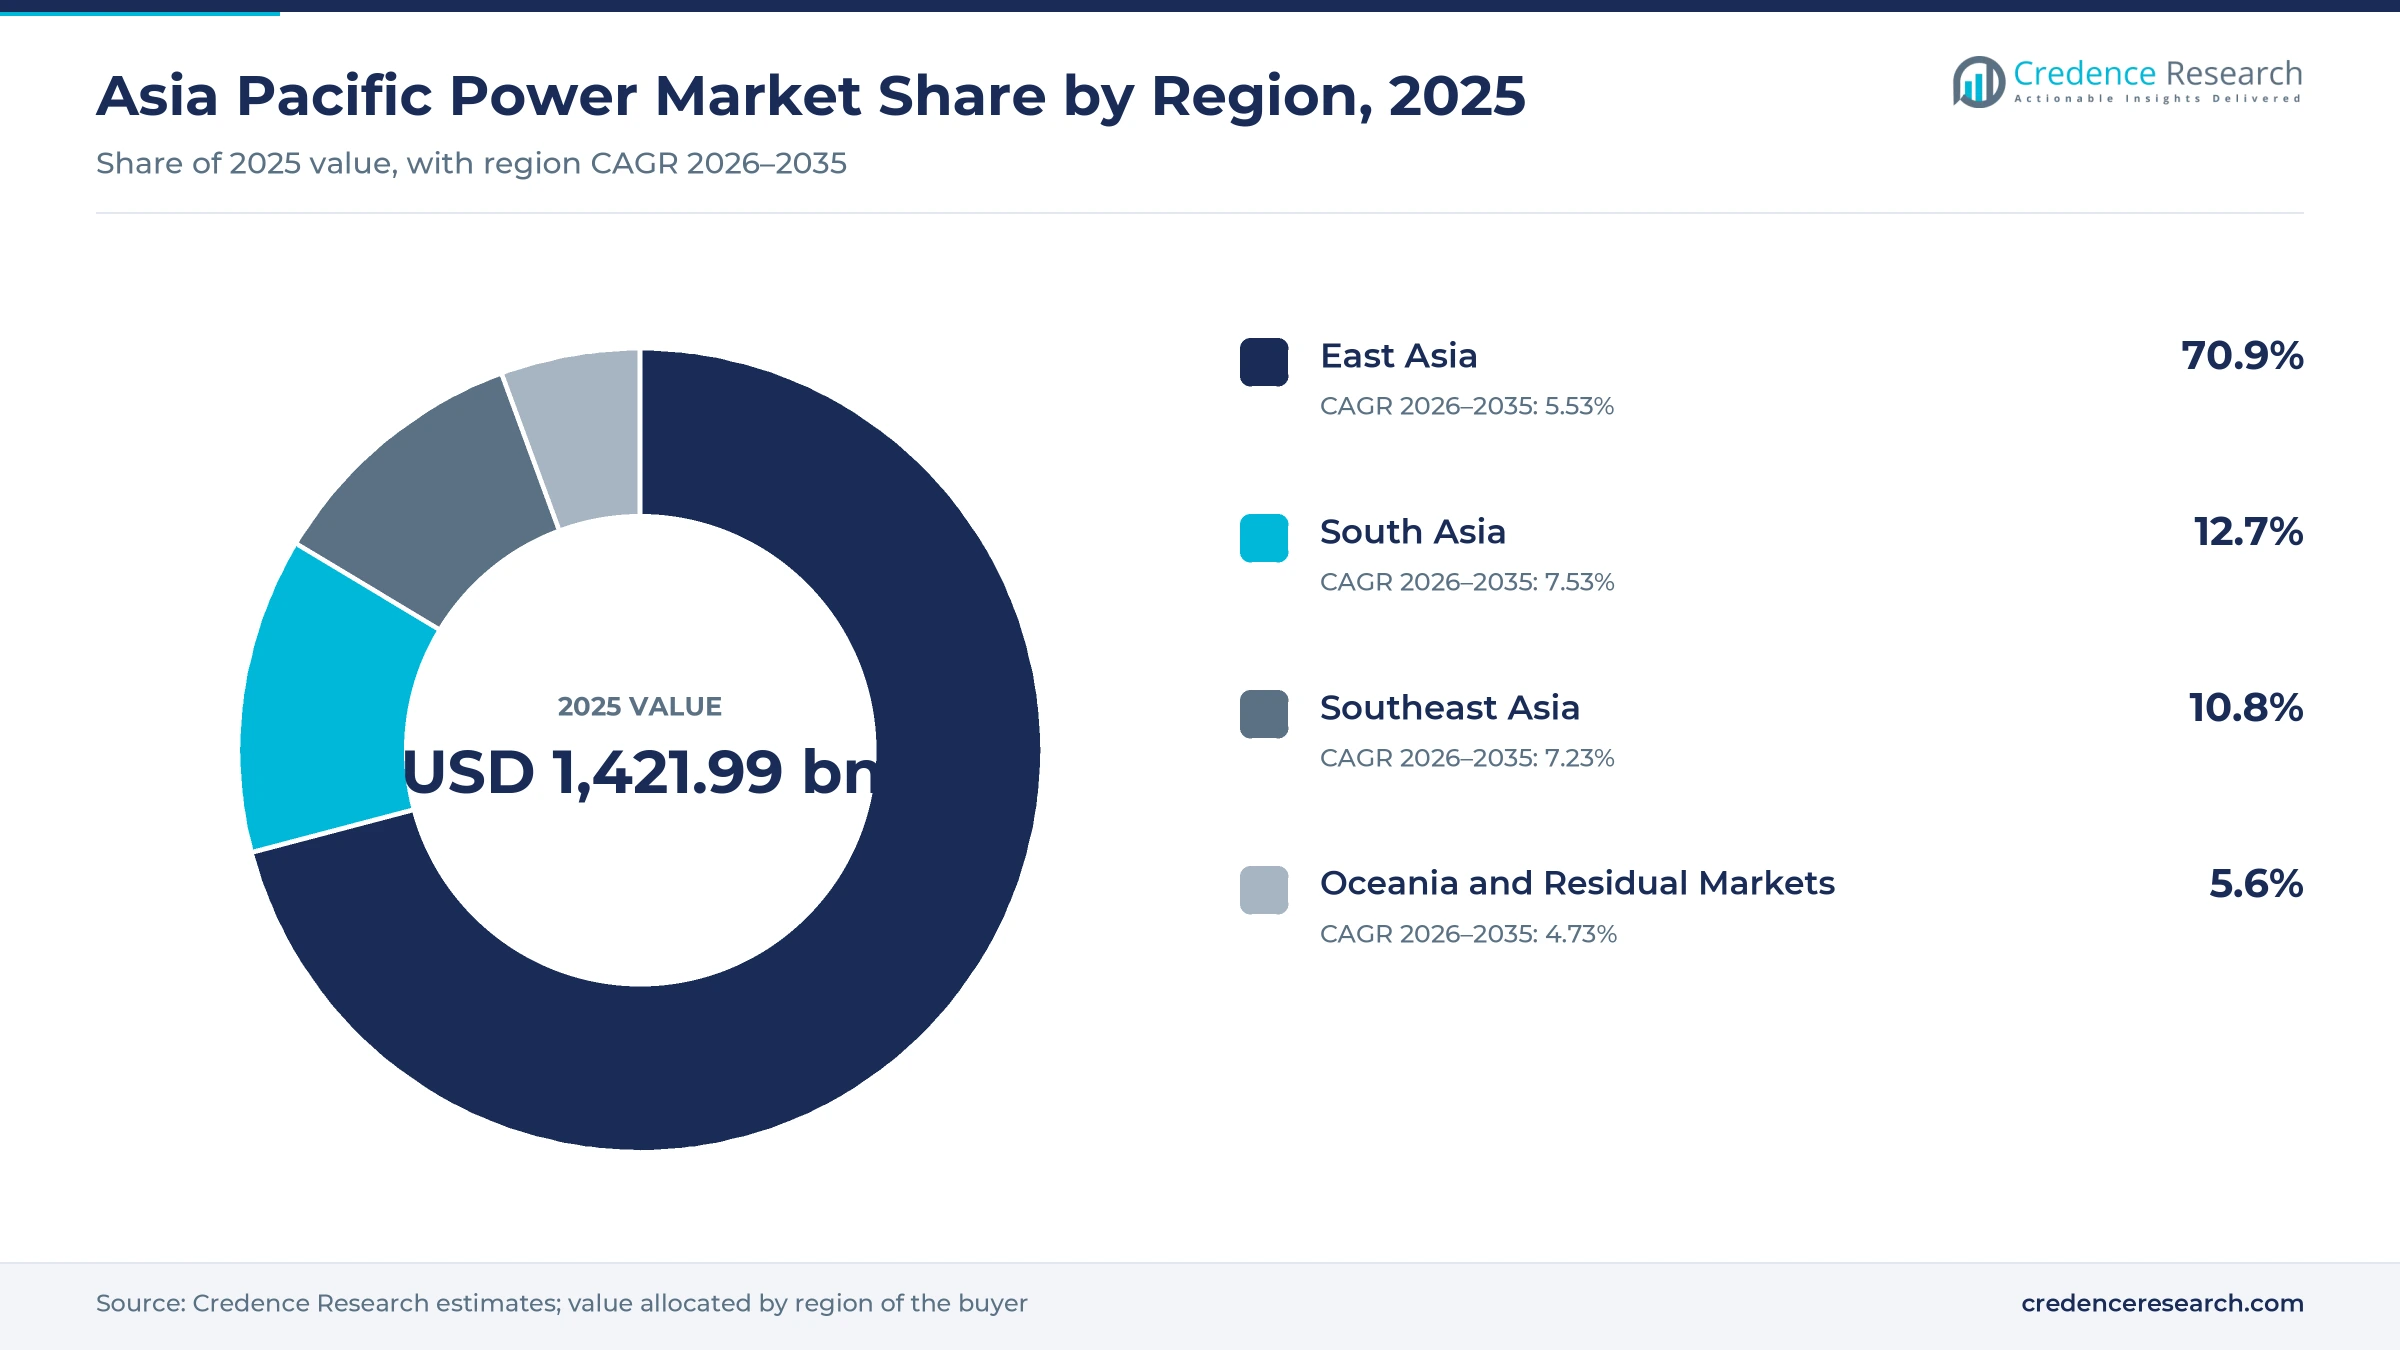
The Asia Pacific power market was valued at USD 1,421.99 billion in 2025 and is projected to increase from USD 1,510.20 billion in 2026 to USD 2,541.31 billion by 2035, registering a CAGR of 5.95% during 2026–2035. Demand comes from factories, air conditioning, service buildings, electric vehicles and data centers, and suppliers recover generation, network and retail costs through tariffs. East Asia held the largest share, 70.9% in 2025, because China alone used more than 10 trillion kWh that year. South Asia is the fastest-growing region at 7.53% a year, as India reached a record peak load during the 2026 heat season. State Grid Corporation of China has planned up to 4 trillion yuan of grid investment for 2026 to 2030, which marks a major commercial change in the region. As a result, network capacity and tariff policy now shape supplier returns as much as generation costs do.
What does the Asia Pacific power market measure and who pays for it?
The market measures the value of electricity delivered to industrial enterprises, households and non-industrial customers across East Asia, South Asia, Southeast Asia, Oceania and smaller residual markets. Buyers pay through regulated tariffs, negotiated industrial contracts and, in some systems, retail competition and those payments recover generation, network and retail supply costs.
The scope excludes the sale of generators, transformers, cables and other equipment, which sit upstream as supplier spending. It also excludes behind-the-meter self-generation that never passes through a supplier bill, although rooftop solar and home batteries affect the volumes that suppliers sell to customers.
Asia Pacific Power Market Insights
- The Asia Pacific power market grows from USD 1,421.99 billion in 2025 to USD 2,541.31 billion by 2035, a 5.95% CAGR, as electricity use outpaces wider energy demand.
- East Asia held 70.9% of 2025 value because China used about one-third of global electricity, while South Asia grows fastest at 7.53% a year.
- Coal led energy sources with 48.0% of 2025 value, even though Chinese coal generation fell by 71 TWh during that same year.
- State Grid Corporation of China planned up to 4 trillion yuan of investment for 2026 to 2030, about 40% above its previous five-year plan period.
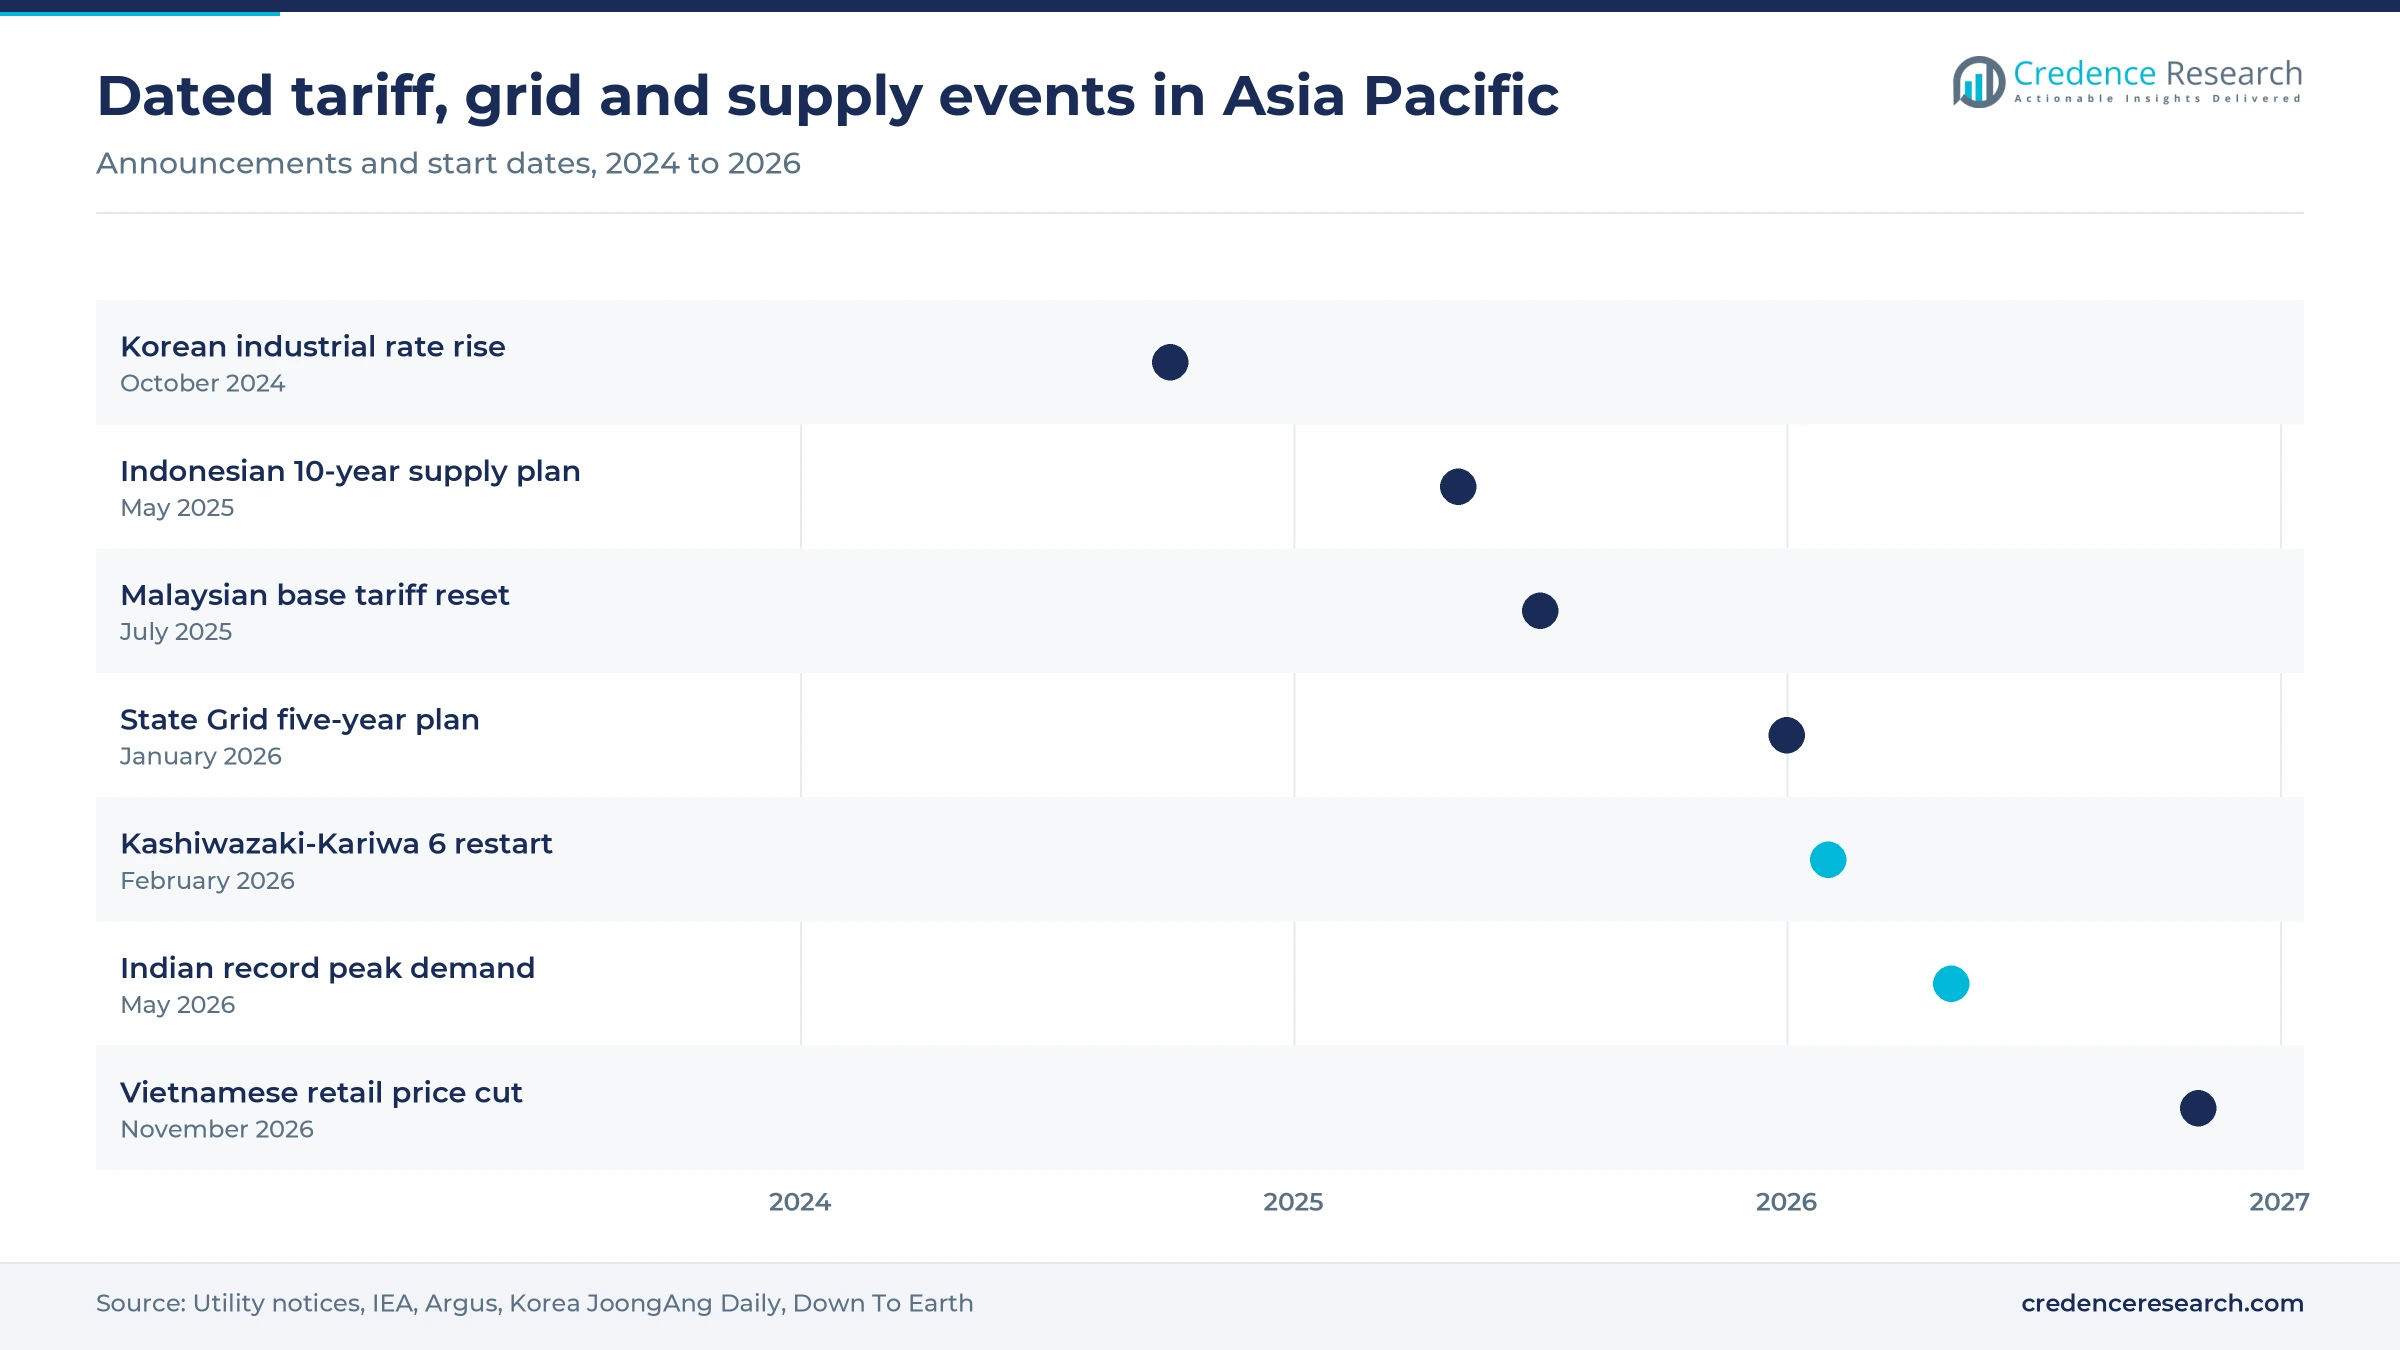
- In May 2025, Indonesia said independent producers should build about 73% of the 69.5 GW in its 10-year plan, widening private roles in Southeast Asia.
Coal and factories still anchor electricity billing
Why coal leads while renewables grow fastest
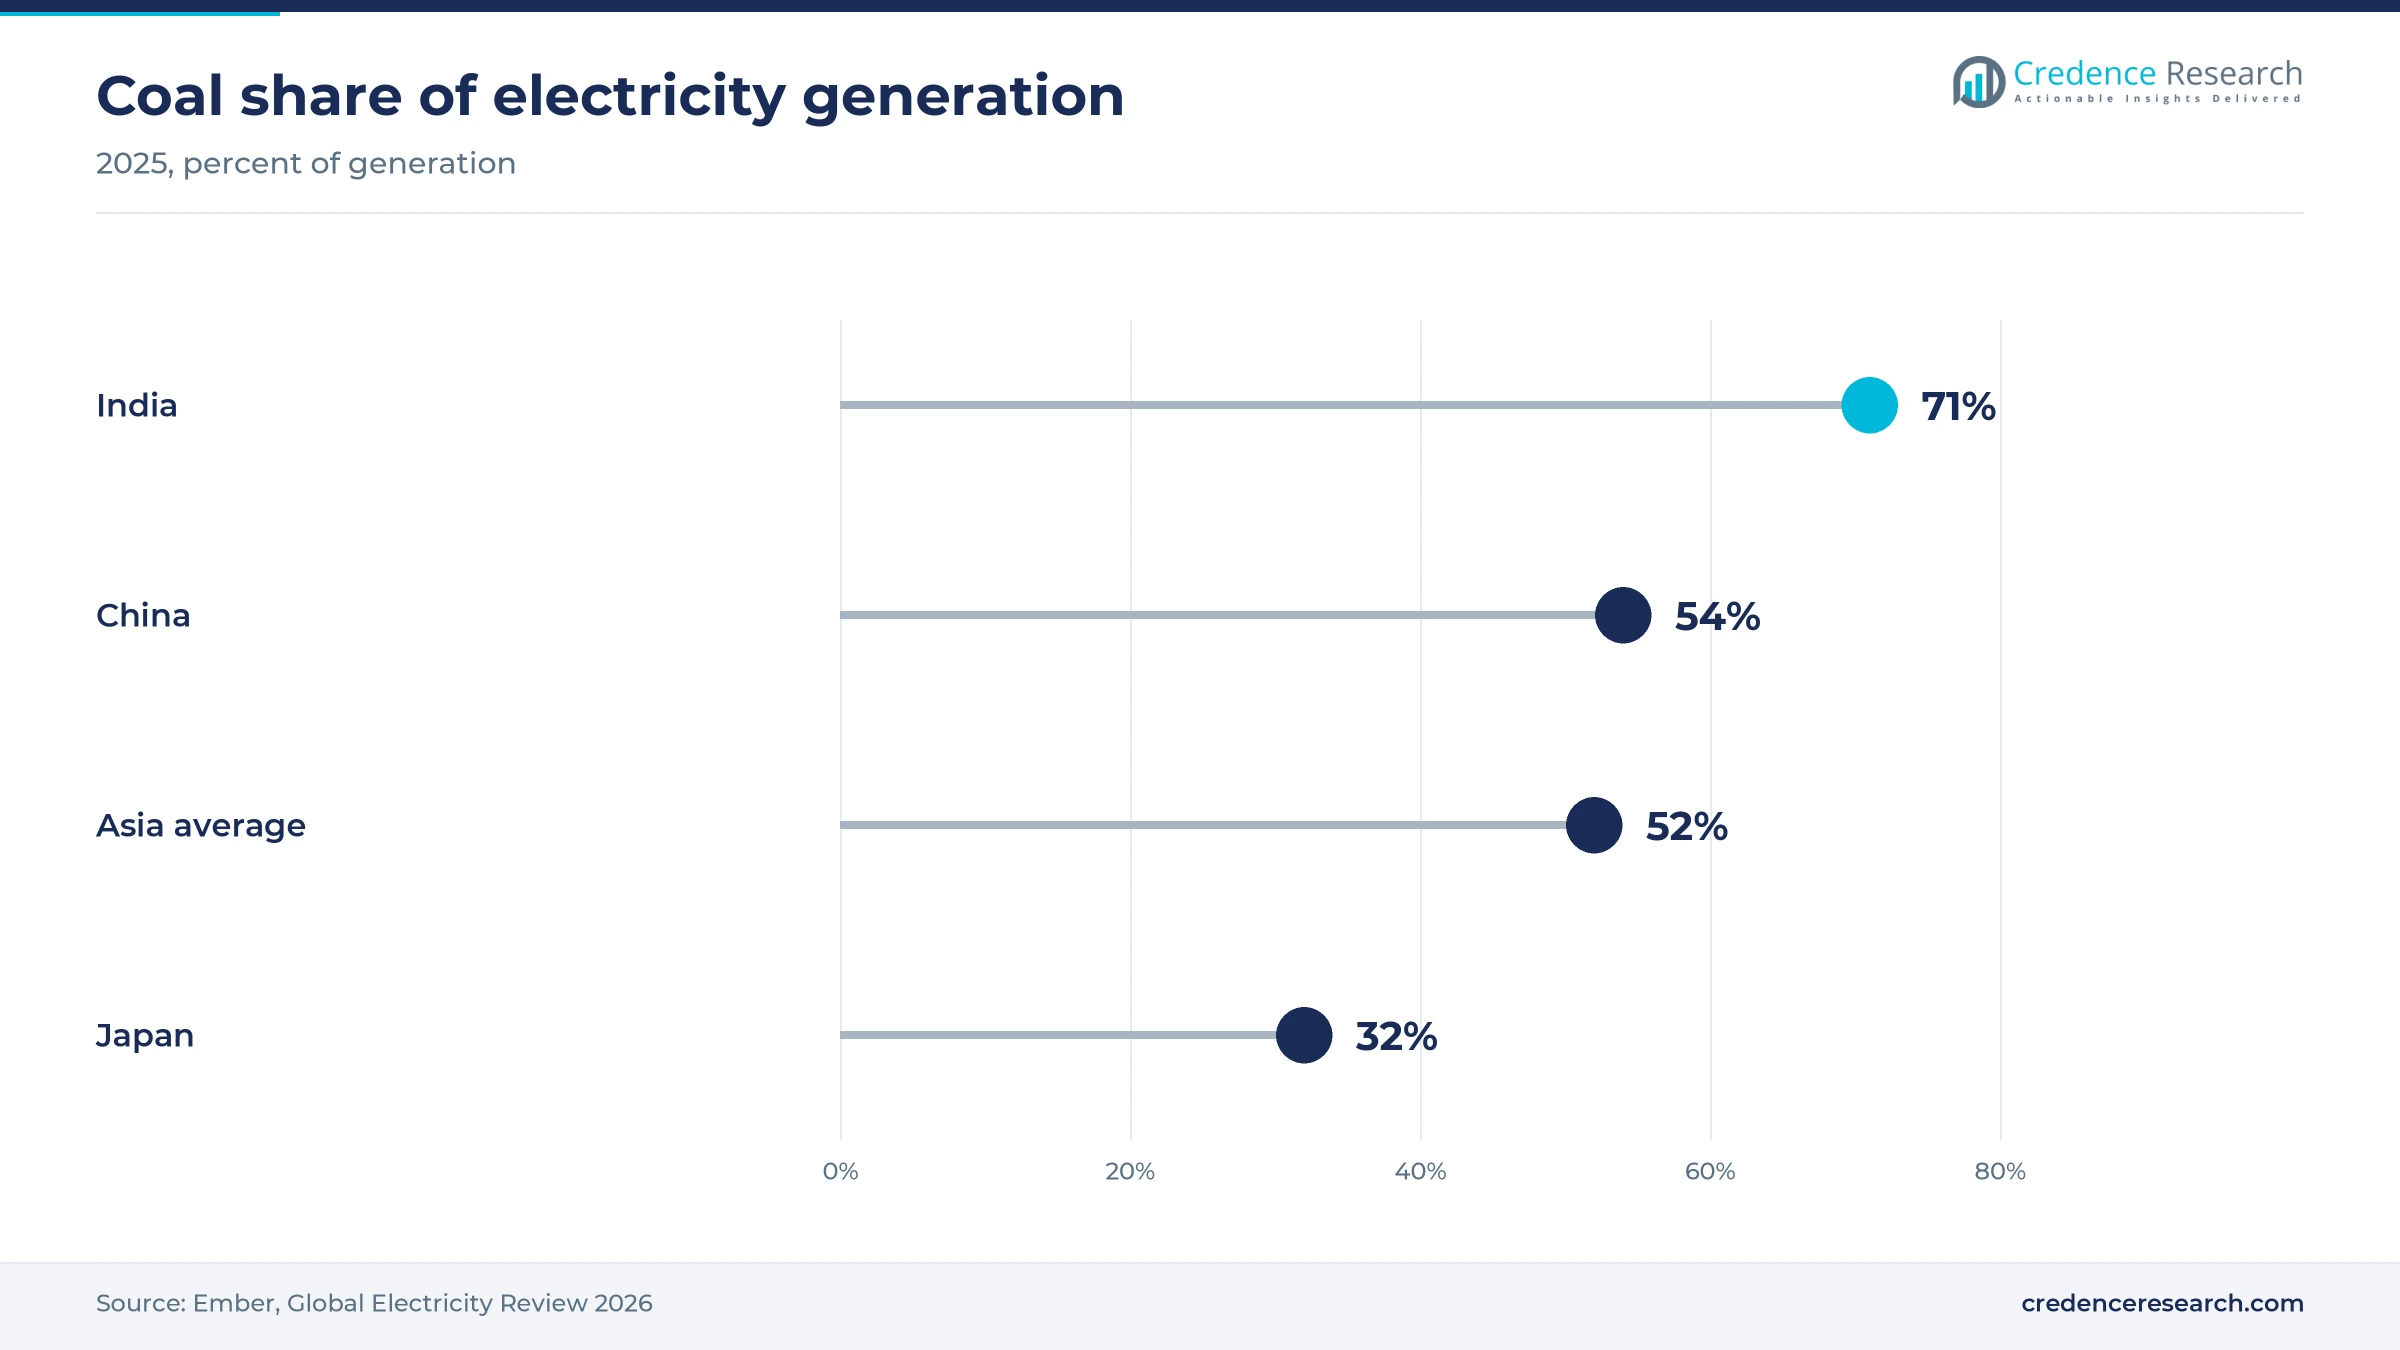
Based on energy source, the market is categorized into coal, gaseous and liquid fuels, renewables and nuclear. Coal led with 48.0% of 2025 value because coal still supplied 52% of Asian electricity that year, according to Ember, including 5,757 TWh in China. Renewables grow fastest at 8.87% a year as Chinese solar output reached 1,175 TWh, an 11.1% share of generation, and Indian solar output rose 37% to 196 TWh in 2025. Gaseous and liquid fuels remain a costly balancing source, while nuclear gains from a 10.8% rise in Japanese reactor output during 2025.
Why production processes hold the largest load
Based on application, the market is categorized into production processes, building services, digital infrastructure and mobility and agricultural operations. Production Processes led with 54.0% of 2025 value because China's secondary sector consumed 6,636.6 TWh in 2025, or 64% of national use, according to National Energy Administration data reported by S&P Global. Digital Infrastructure grows fastest at 10.80% a year as Malaysia's energy ministry expects data centers to rise from 7% of national consumption in 2026 to as much as 31% by 2035. Building services follow, while mobility benefits from a 48.8% jump in Chinese charging and battery-swapping demand.
How industrial buyers shape tariff revenue
Based on end user, the market is categorized into industrial enterprises, residential households and non-industrial customers. Industrial Enterprises led with 56.0% of 2025 value because large buyers concentrate demand, and Korea JoongAng Daily reported in October 2024 that just 1.7% of Korean users accounted for 53.2% of electricity demand. Non-industrial Customers grow fastest at 7.14% a year as Chinese tertiary-sector use climbed 8.2% to 1,994.2 TWh in 2025, according to S&P Global. Residential households also expand, since Chinese household consumption rose 6.3% to 1,588 TWh over the same period.
Why public suppliers dominate as private capacity expands
Based on ownership model, the market is categorized into public-controlled, private-controlled and community-controlled suppliers. Public-controlled Suppliers led with 74.0% of 2025 value because state-owned utilities run the largest networks, and China Southern Power Grid alone planned 180 billion yuan of investment for 2026, according to Shanghai Metals Market. Private-controlled Suppliers grow fastest at 7.05% a year as Argus reported that independent producers should deliver about 73% of Indonesia's planned capacity. Community-controlled supply stays small, and Australia's regulator found that distributors owned 189 of the 244 community batteries connected to its networks.
| Segment Group | Leading Sub-segment | Share, 2025 | Fastest-growing Sub-segment | CAGR, 2026–2035 |
|---|---|---|---|---|
| By Energy Source | Coal | 48.0% | Renewables | 8.87% |
| By Application | Production Processes | 54.0% | Digital Infrastructure | 10.80% |
| By End User | Industrial Enterprises | 56.0% | Non-industrial Customers | 7.14% |
| By Ownership Model | Public-controlled Suppliers | 74.0% | Private-controlled Suppliers | 7.05% |
Request a Free Sample
Fill in your details and we'll send you a free sample report.
- Sample data tables & charts
- Research methodology
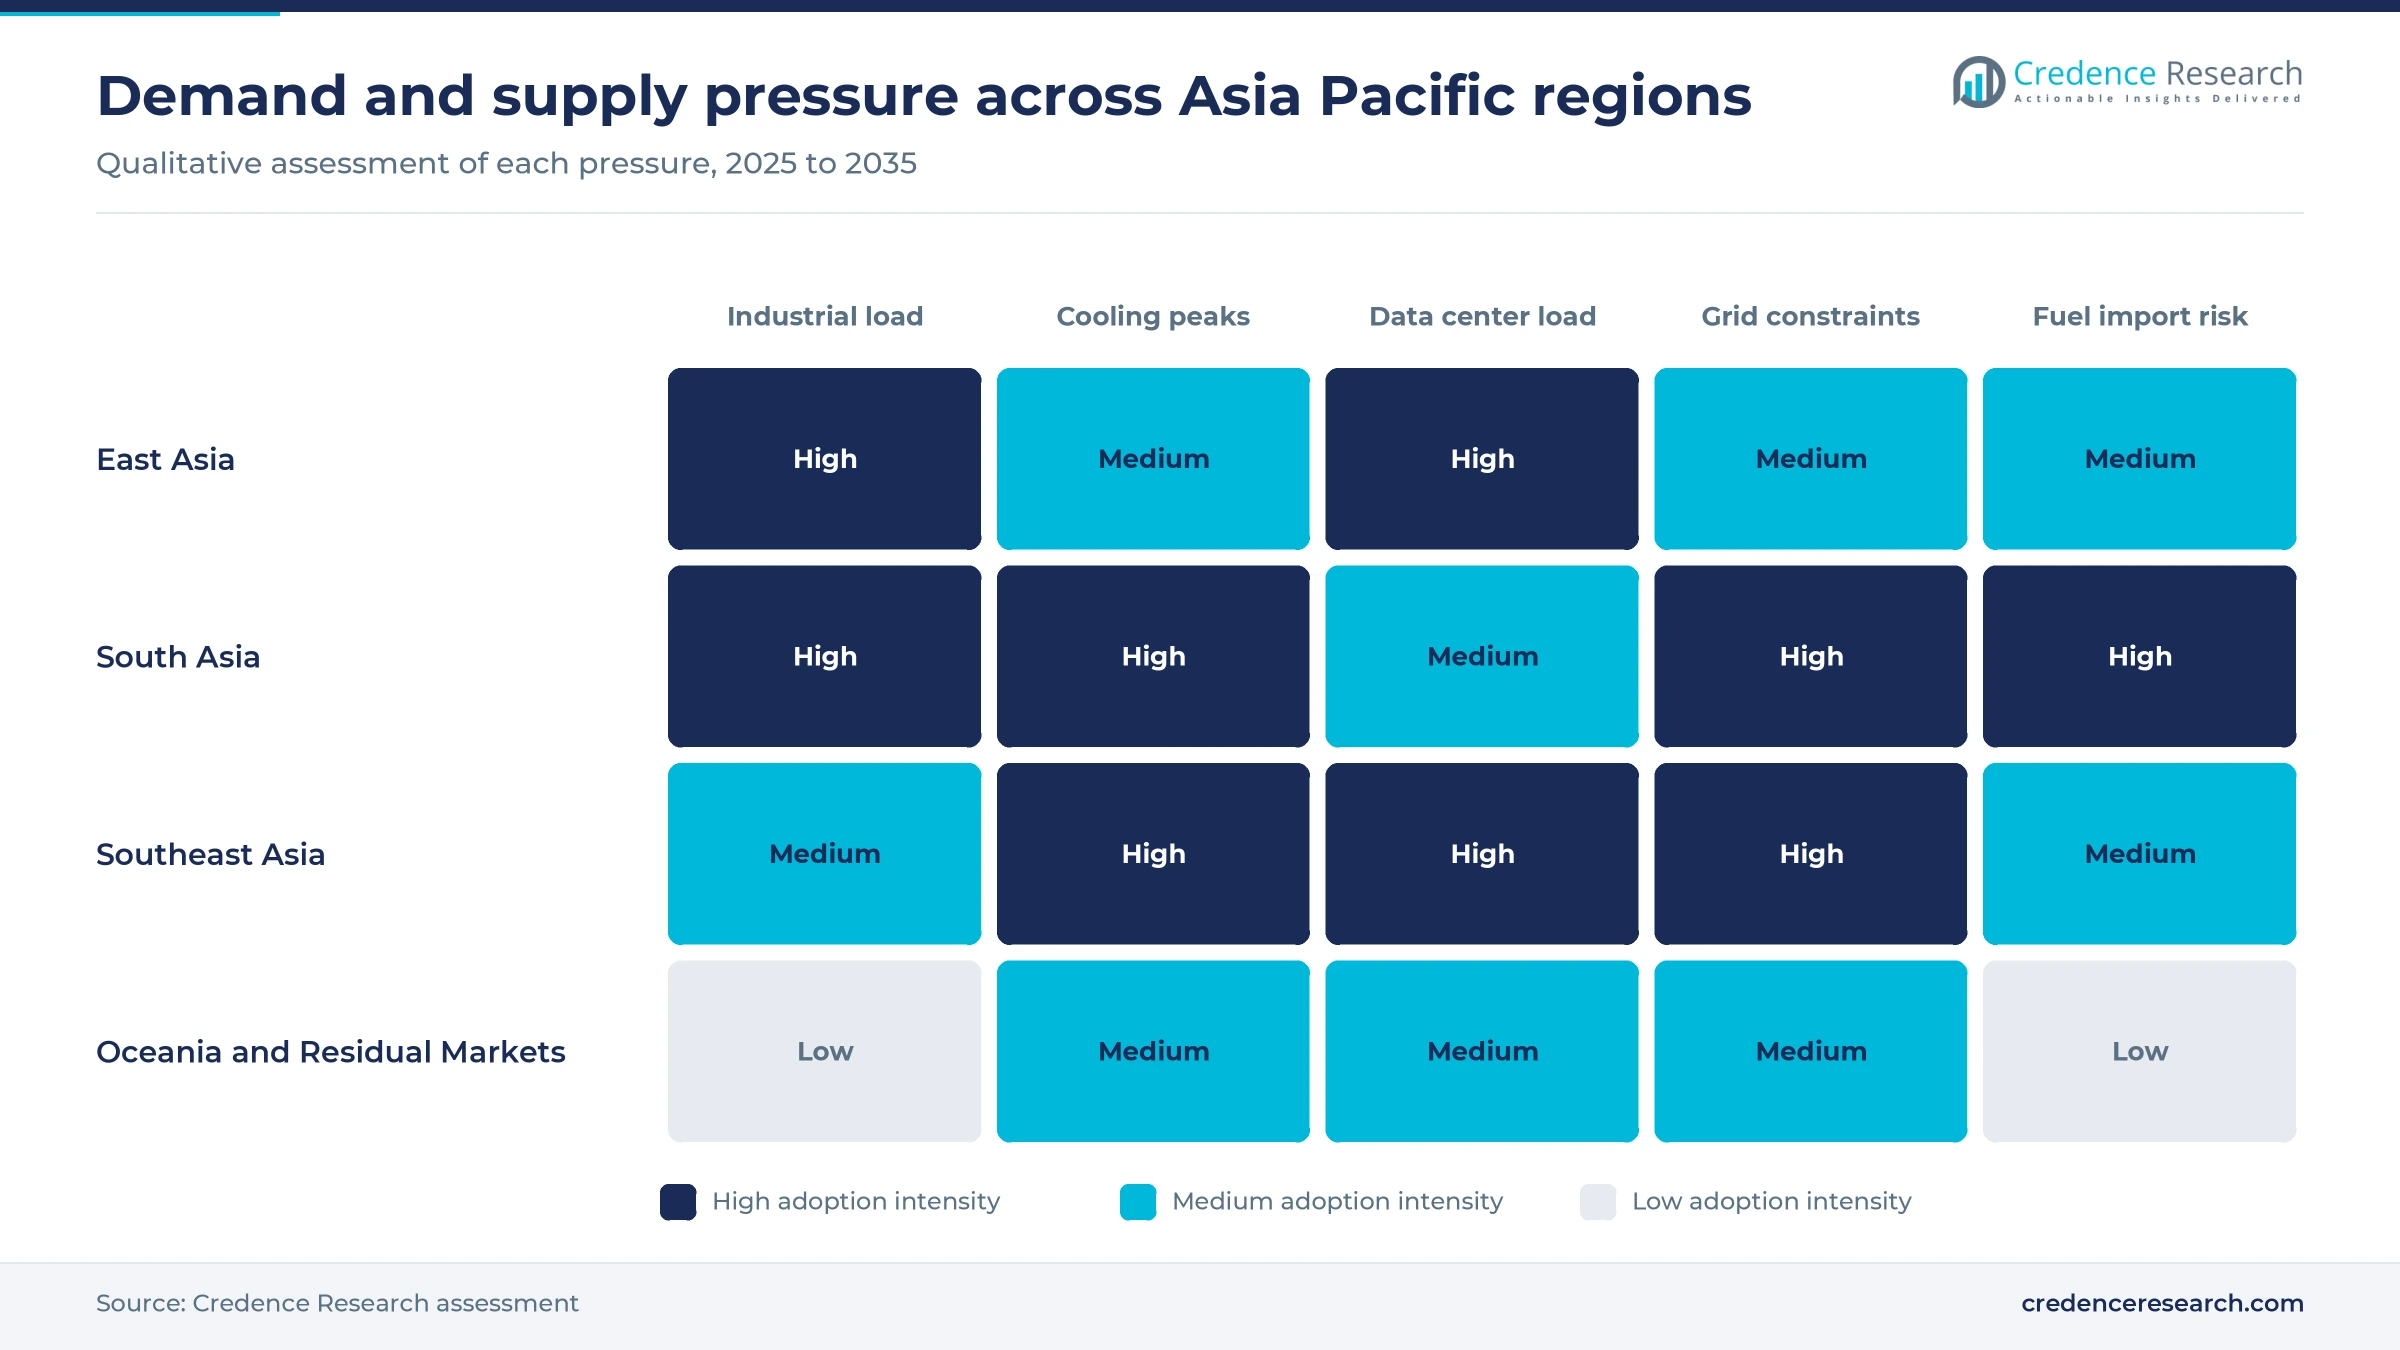
Factories, cooling and data centers are lifting load
Industrial and transport electrification adds firm load
Factories and vehicles are moving more energy use onto the grid, which lifts volumes that suppliers can bill all year. China's National Energy Administration reported total 2025 consumption of 10,368.2 TWh, up 5%, and S&P Global noted that manufacturing-linked use made up most of that total. The International Energy Agency expects industry to deliver about one-third of Indian demand growth through 2030, when national demand should be rising 6.4% a year. Transport adds a smaller but quicker stream, because demand from electric vehicle charging stations and battery-swapping sites in China climbed sharply in 2025. As a result, Production Processes keeps 54.0% of value even as newer loads gain ground.
Cooling and service-sector load expansion raises peaks
Hotter summers and larger service economies are raising peak demand faster than total consumption, and suppliers must fund capacity for those hours. India reached a record 270.8 GW on May 21, 2026, according to the Union Ministry of Power, with demand staying above 260 GW for about three afternoon hours. That peak followed a 256.1 GW record on April 25, as reported by Renewable Watch. The International Energy Agency expects air conditioning to drive more than 20% of Indian demand growth through 2030. In China, S&P Global reported that services and households together delivered half of the 2025 increase, and this supports growth in Non-industrial Customers.
Data center connections and firm supply lift contracted load
Data centers and chip plants need large, steady supply, so they give utilities long-term contracted volumes. Malaysia's energy ministry said in a July 6, 2026, written answer that national peak demand should rise from 21.3 GW in 2026 to 33.5 GW by 2035. RHB analysts, reported by Business Today, said Tenaga Nasional Berhad holds supply agreements for 59 data center projects totaling 8.3 GW, on five-year take-or-pay terms. In Taiwan, a Taipower assessment sees semiconductor use growing from about 52 billion kWh in 2026 to about 110 billion kWh in 2035. This load also drives spending on data center load management at each site.
Multi-year grid and capacity programs expand the asset base
National capital programs enlarge the regulated assets that tariffs must recover, which supports network revenue across the forecast. The International Energy Agency records State Grid's plan of up to 4 trillion yuan for 2026 to 2030, a 40% increase over the prior five-year period. Indonesia's 2025 to 2034 plan adds 69.5 GW, about 76% from renewables and storage, with investment of up to 2,967 trillion rupiah across plants, lines and village electrification. Tenaga Nasional Berhad also plans 11.8 GW of new capacity by 2033, according to RHB analysts. These programs keep orders flowing for high-voltage transformer suppliers and lift network charges over time.
Solar growth and tariff resets are reshaping supply
Shift toward solar and wind displaces coal growth
Solar and wind are now covering much of the new demand in the two largest Asian systems, which changes the value mix inside the market. Ember's Global Electricity Review 2026 shows China adding 336 TWh of solar and 138 TWh of wind in 2025, while its coal generation fell 1.2%. India added 53 TWh of solar and 22 TWh of wind, and its coal generation dropped by 44 TWh. However, the International Energy Agency expects worldwide coal generation to rise 1.4% in 2026, so the transition is not linear. In turn, Renewables expands at 8.87% a year while coal keeps its lead.
Rise of cost-reflective tariffs tests political limits
Regulators are moving tariffs closer to supply costs, although each increase meets political resistance. Vietnam Electricity raised its average retail price 4.8% to VND 2,204.07 per kWh on May 10, 2025, then cut it 2% to VND 2,159.90 on Nov. 1, 2026, according to company notices. Malaysia lifted its peninsular base tariff from 39.96 sen to 45.62 sen per kWh on July 1, 2025, as reported by W.Media. Taiwan took the opposite course in March 2026, when its electricity price review committee held the average rate at NT$3.78 per kWh, the Taipei Times reported. As a result, revenue per kWh now varies widely by country, and supplier returns depend on the regulatory calendar as much as on volumes.
Opportunity in home batteries and rooftop solar services
Households that add solar and storage still need grid supply, so suppliers can sell them new tariffs, aggregation and backup services. India's Ministry of New and Renewable Energy said more than 5 million households joined PM Surya Ghar by July 2026, with about 14.8 GW installed and a target of 10 million homes by March 2027, according to Mercom India. Australia passed 400,000 subsidized home battery energy storage systems in May 2026, totaling 11.2 GWh, Energy-Storage.news reported. The Australian Energy Regulator also counts 244 connected community batteries. These programs create an opening for retailers that can pay customers for flexibility and reduce peak network costs.
Opportunity in Southeast Asian transmission and connections
Southeast Asia offers a clear investment opening because its network build lags its generation plans. PV Tech, citing Ember in May 2025, reported that the region needs about 100,000 km of new transmission lines by 2030 and is on track to add less than half. Indonesia has announced just over 20,000 km of lines, while Vietnam has just over 11,000 km in its pipeline, according to the same report. Ember also estimated that wider grids could unlock 24 GW of solar and 5.6 GW of wind capacity. The International Energy Agency separately sees battery storage in the region rising from just over 1 GW to more than 60 GW by 2035 under announced pledges, which favors network operators and storage developers.
Debt, grid queues and fuel costs restrain suppliers
Utility debt limits room for investment
Accumulated utility debt restricts how quickly state-owned suppliers can fund new networks. Korea Electric Power Corporation carried debt of 202.9 trillion won in June 2024, Korea JoongAng Daily reported, and it responded with an average 9.7% rise in industrial rates on Oct. 24, 2024, while keeping household bills unchanged. Large businesses faced a 10.2% increase, while small and medium-sized companies faced 5.2%. Similar tariff restraint can delay grid spending elsewhere, so regulators may need phased increases and clearer cost-recovery rules to protect investment.
Grid connection queues delay new supply
Connection delays hold back generation that is already financed or planned. The International Energy Agency said in February 2026 that more than 2,500 GW of projects worldwide were stuck in grid queues, and that annual grid spending must reach about USD 600 billion by 2030, according to Down To Earth. Southeast Asia shows the same gap, since PV Tech, citing Ember in May 2025, reported that the region is on track to add less than half of the 100,000 km of lines it needs by 2030. Developers lose income, and suppliers keep buying costlier firm generation.
Imported fuel and currency swings raise supply costs
Importing countries remain exposed to fuel and exchange-rate shocks that tariffs cannot always absorb. The International Energy Agency said in July 2026 that LNG supply disruptions were weighing on consumption in Pakistan and Bangladesh, according to Engineering News. Vietnam Electricity also said in May 2025 that generation made up about 83% of its production costs, and that a volatile dollar affected those costs. Price-sensitive buyers then reduce their use, which directly hurts supplier sales volumes. Diversified contracts and domestic renewables can partly reduce this exposure over time.
Nuclear restart delays complicate firm supply plans
Japanese suppliers depend on reactor restarts for low-carbon firm capacity, yet schedules remain uncertain. Tokyo Electric Power Company Holdings restarted the 1,356 MW Kashiwazaki-Kariwa Unit 6 on Jan. 21, 2026, then halted it the next day after an alarm, according to the American Nuclear Society. Commercial operation slipped from Feb. 26 to no earlier than March 18, Nuclear Engineering International reported. Japan's regulator also suspended Chubu Electric Power's Hamaoka safety review in late December 2025, which can extend reliance on imported fuel.
East Asia dominates while South Asia grows fastest
| Region | Value, 2025 (USD billion) | Share, 2025 | CAGR, 2026–2035 |
|---|---|---|---|
| East Asia | 1,008.19 | 70.9% | 5.53% |
| South Asia | 180.59 | 12.7% | 7.53% |
| Southeast Asia | 153.58 | 10.8% | 7.23% |
| Oceania and Residual Markets | 79.63 | 5.6% | 4.73% |
East Asia holds the largest billed volume
East Asia held 70.9% of 2025 value and grows at 5.53% a year, because China, Japan, Korea and Taiwan combine heavy industry with very large billed volumes. Ember puts Chinese demand at 10,573 TWh in 2025, about one-third of the global total, after a rise of 503 TWh. Japan grew far more slowly, adding only 13.4 TWh during that year. East Asia's growth lags South Asia because these mature economies already have high per capita use, although chip plants and data centers add new contracted load.
South Asia is the fastest-growing region
South Asia held 12.7% of 2025 value and grows at 7.53% a year, the fastest pace in the report. India drives that lead, as Ember recorded demand of 2,083 TWh in 2025 and the International Energy Agency expects growth of 7% in 2026. Coal still produced 71% of Indian electricity in 2025, so fuel supply remains central. Pakistan and Bangladesh are more exposed to imported LNG, which makes their demand more sensitive to delivered prices.
Southeast Asia combines load growth and network gaps
Southeast Asia held 10.8% of 2025 value and grows at 7.23% a year, as data centers and cooling add load to systems that are still building networks. The International Energy Agency expects regional generation to rise from about 1,460 TWh in 2024 to about 2,450 TWh by 2035 under announced pledges. Malaysia's Johor state hosts 68% of Tenaga Nasional Berhad's contracted data center capacity, according to RHB analysts. Indonesia and Vietnam are also investing heavily in new lines.
Oceania and residual markets lead in customer-side supply
Oceania and residual markets held 5.6% of 2025 value and grow at 4.73% a year, the slowest pace in the report. Australia sets the direction of this group, because more than 400,000 subsidized home batteries were installed within about a year of its federal program starting. Customer-side supply reduces the volumes that retailers bill, and it raises the importance of network pricing. Smaller island and residual systems add little value, but they remain natural candidates for microgrid projects.
Grid plans, restarts and tariff moves from 2025 to 2026
| Development | Status and market relevance |
|---|---|
| In May 2025, Indonesia's energy minister announced a 2025 to 2034 supply plan for PT PLN (Persero) with 69.5 GW of new capacity. | Approved plan; about 73% is expected through private producers |
| In January 2026, State Grid Corporation of China announced fixed-asset investment of up to 4 trillion yuan for 2026 to 2030, according to Shanghai Metals Market. | Announced; enlarges the regulated network base through 2030 |
| In February 2026, Tokyo Electric Power Company Holdings restarted Kashiwazaki-Kariwa Unit 6 after an earlier January attempt ended with an alarm. | Restarted; the first restart of a company reactor since 2011 |
| In July 2026, Malaysia's energy ministry said Tenaga Nasional Berhad was supplying 36 operating data centers with about 4.5 GW of planned capacity. | Operating; a further 23 projects are under construction |
| In October 2026, Vietnam Electricity set a 2% lower average retail price, effective Nov. 1, 2026. | In force; it shows how macroeconomic goals still shape tariffs |
Storage, rooftop solar and new lines change the system
- Home batteries shift rooftop output into evening peaks, and Australian households had installed 11.2 GWh of them by May 2026.
- Rooftop solar reduces daytime grid purchases, and India's PM Surya Ghar program reached about 14.8 GW by July 2026.
- Advanced light-water reactors offer a possible firm option, as Kansai Electric Power studies a 1,200 MW SRZ-1200 unit at Mihama.
- New transmission lines connect remote renewables to load centers, and Indonesia has announced just over 20,000 km of them.
Need a Custom Version of This Report?
Tailor the scope, geography, or segments to your exact requirements.
- Custom geography or segment scope
- Direct access to our analyst team
State utilities control networks as private supply grows
Competition in this market is mostly regulated rather than head-to-head, because large state-controlled utilities own the transmission networks and much of the retail relationship. State Grid Corporation of China and China Southern Power Grid dominate Chinese network supply, while Korea Electric Power Corporation, Taiwan Power Company, Vietnam Electricity, PT PLN (Persero) and Tenaga Nasional Berhad hold central national positions. Japan has several regional utilities, and Tokyo Electric Power Company Holdings, Kansai Electric Power and Chubu Electric Power compete in regional supply and depend heavily on reactor decisions. Suppliers mainly differ through tariff settlements, capital programs and fuel strategy. Tenaga Nasional Berhad, for example, uses five-year take-or-pay contracts to protect data center investment. Meanwhile, Indonesia's reliance on independent producers shows how private capital is entering generation while the public utility keeps its grid role.
Companies profiled and their roles in this market
| Company | Type | Role in the market |
|---|---|---|
| State Grid Corporation of China | State-owned grid operator | Planned up to 4 trillion yuan of fixed-asset investment for 2026 to 2030 |
| China Southern Power Grid | State-owned grid operator | Planned 180 billion yuan of investment in 2026 for southern China |
| Korea Electric Power Corporation | National utility | Raised industrial rates an average 9.7% in October 2024 |
| Tokyo Electric Power Company Holdings | Regional utility group | Restarted Kashiwazaki-Kariwa Unit 6 during early 2026 |
| PT PLN (Persero) | State-owned national utility | Central to the 69.5 GW Indonesian supply plan for 2025 to 2034 |
| Kansai Electric Power | Regional utility | Resumed survey work for a possible new reactor at Mihama |
| Chubu Electric Power | Regional utility | Hamaoka safety review suspended by the regulator in December 2025 |
| Taiwan Power Company | State-owned national utility | Assessed rising semiconductor load through 2035 |
| Vietnam Electricity | State-owned national utility | Set a lower average retail price from Nov. 1, 2026 |
| Tenaga Nasional Berhad | National utility | Holds agreements for 59 data center projects totaling 8.3 GW |
Credence Research view on billing growth and grid risk
Credence Research's view is that this market is entering a period when network capacity matters as much as fuel. Volume growth looks secure, because India, China and Southeast Asia all have visible industrial, cooling and digital load. The harder question is who pays for the lines that connect it. Utilities that win steady tariff settlements should convert demand into returns, while those facing frozen rates may delay spending. Buyers with large, flexible loads therefore hold more bargaining power than headline consumption suggests, particularly where take-or-pay contracts and new capacity are being negotiated.
How the regional electricity value was estimated
The report uses 2025 as the base year and 2026 to 2035 as the forecast period, with market values taken from the Credence Research model. Regional, segment and growth splits are Credence Research estimates, and they were checked against public consumption and tariff data. Sources include the International Energy Agency, national energy ministries and regulators, utility notices, Ember and named trade publications. No interviews or surveys were conducted for this edition, and the most assumption-heavy estimate is the split by ownership model.
Network capacity will set the pace of growth to 2035
The market should reach USD 2,541.31 billion by 2035, as South Asia and digital load add the fastest growth while East Asia keeps the largest share. Solar and storage will take a larger part of new supply, although coal stays important in the early forecast years. Tariff decisions will decide how much of the extra demand turns into supplier value, and transmission delivery will decide how quickly cheaper renewables reach customers. Suppliers that secure long-term industrial contracts and regulatory support for network spending should be best placed through the next decade.
Frequently Asked Questions
How big is the Asia Pacific power market?
Which region leads the Asia Pacific power market?
Which region grows fastest in this market?
Which energy source holds the largest share?
How do data centers affect electricity demand in the region?
Which companies are prominent in the Asia Pacific power market?
What are the main challenges for suppliers?
Where are the main opportunities in this market?
Table of Content
Chapter 1 Market Segmentation
- 1.1 Segmentation Framework
- 1.1.1 Product and Service Classification
- 1.1.2 Application and End-Use Classification
- 1.1.3 Technology and Solution Classification
- 1.1.4 Customer and Distribution Channel Classification
- 1.1.5 Geographic Segmentation
- 1.1.6 Market Segment Definitions and Boundaries
- 1.2 By Energy Source
- 1.2.1 Coal
- 1.2.2 Gaseous and Liquid Fuels
- 1.2.3 Renewables
- 1.2.4 Nuclear
- 1.3 By Application
- 1.3.1 Production Processes
- 1.3.2 Building Services
- 1.3.3 Digital Infrastructure
- 1.3.4 Mobility and Agricultural Operations
- 1.4 By End User
- 1.4.1 Industrial Enterprises
- 1.4.2 Residential Households
- 1.4.3 Non-industrial Customers
- 1.5 By Ownership Model
- 1.5.1 Public-controlled Suppliers
- 1.5.2 Private-controlled Suppliers
- 1.5.3 Community-controlled Suppliers
Chapter 2 Introduction
- 2.1 Report Objectives and Scope
- 2.2 Product Definition and Industry Terminology
- 2.3 Market Inclusions and Exclusions
- 2.4 Research Process
- 2.4.1 Primary Research and Expert Interviews
- 2.4.2 Secondary Research and Source Review
- 2.4.3 Top-Down and Bottom-Up Estimation
- 2.4.4 Data Triangulation and Verification
- 2.5 Market Size Measurement Basis
- 2.5.1 2025: USD 1,421.99 billion → 2035: USD 2,541.31 billion
- 2.6 Historical and Forecast Reference Periods
- 2.6.1 Historical Period: 2018-2025
- 2.6.2 Base Year: 2025
- 2.6.3 Forecast Period: 2025-2035
- 2.7 Research Assumptions and Limitations
Chapter 3 Executive Summary
- 3.1 Market Snapshot and Key Findings
- 3.2 Base-Year Market Size, 2025
- 3.3 Forecast Market Size, 2035
- 3.4 Revenue and Volume Growth Outlook
- 3.5 Key Demand and Supply Indicators
- 3.6 Leading Market Segments
- 3.7 Fastest-Growing Market Opportunities
- 3.8 Regional Performance Highlights
- 3.9 Technology and Industry Transformation
- 3.10 Competitive Landscape Summary
- 3.11 Analyst View and Strategic Implications
Chapter 4 Asia Pacific Power Market Trends and Developments
- 4.1 Historical Industry Development, 2018-2025
- 4.2 Recent Market Trends and Developments
- 4.3 Demand and Customer Behavior Trends
- 4.4 Technology and Product Innovation
- 4.5 Artificial Intelligence, Automation and Digitalization
- 4.6 Local Manufacturing and Supply Chain Realignment
- 4.7 Industry Partnerships, Mergers and Acquisitions
- 4.8 Sustainability and Circular Economy Developments
- 4.9 Government and Private Sector Investment Trends
- 4.10 Emerging Business Models and Commercialization
- 4.11 Industry Developments and Announcements
Chapter 5 Asia Pacific Power Market Production, Supply and Demand Analysis
- 5.1 Demand Trend and Consumption Analysis, 2018-2025
- 5.2 Demand Forecast, 2025-2035
- 5.3 Production and Output Trend, 2018-2025
- 5.4 Production and Output Forecast, 2025-2035
- 5.5 Installed Capacity and Capacity Utilization
- 5.6 Company-Wise Production Plants and Statistics
- 5.6.1 Installed Production Capacity
- 5.6.2 Actual Production
- 5.6.3 Planned Capacity and Expansion Targets
- 5.7 Supply Chain Structure and Procurement Trends
- 5.8 Supply-Demand Gap and Bottlenecks
- 5.9 Import Dependence and Sourcing Structure
- 5.10 Contract Manufacturing and Outsourcing
- 5.11 Regional Supply and Demand Concentration
Chapter 6 Asia Pacific Power Market Pricing Analysis
- 6.1 Pricing Structure and Measurement
- 6.2 Historical Pricing Trends, 2018-2025
- 6.3 Pricing Outlook, 2025-2035
- 6.4 Average Selling Price and Unit Economics
- 6.5 Pricing by Product and Market Segment
- 6.6 Geographic Pricing Differences
- 6.7 Key Input, Energy, Labor and Logistics Costs
- 6.8 Contract Pricing and Purchasing Models
- 6.9 Pricing Sensitivity and Competitive Positioning
- 6.10 Price, Margin and Profitability Implications
Chapter 7 Asia Pacific Power Market Dynamics
- 7.1 Market Growth Drivers
- 7.1.1 Demand-Side Drivers
- 7.1.2 Technology and Innovation Drivers
- 7.1.3 Infrastructure and Investment Drivers
- 7.1.4 Regulatory and Policy Drivers
- 7.2 Market Restraints
- 7.2.1 Cost and Affordability Constraints
- 7.2.2 Technology and Adoption Barriers
- 7.2.3 Supply Chain and Operational Constraints
- 7.3 Market Challenges
- 7.3.1 Competitive Pressure and Margin Erosion
- 7.3.2 Skills, Infrastructure and Implementation Gaps
- 7.4 Emerging Market Opportunities
- 7.5 Market Dynamics Impact and Time-Horizon Assessment
Chapter 8 Asia Pacific Power Value Chain Analysis
- 8.1 Industry Value Chain Overview
- 8.2 Upstream Suppliers and Critical Inputs
- 8.3 Technology and Component Providers
- 8.4 Manufacturing or Service Delivery
- 8.5 Distribution, Channel Partners and Integrators
- 8.6 Downstream Applications and End Users
- 8.7 Value Addition and Profit Pools
- 8.8 Vertical Integration and Outsourcing
- 8.9 Supplier Concentration and Risk
- 8.10 Supply Chain Localization and Resilience
Chapter 9 Asia Pacific Power Market Regulations and Policies
- 9.1 Relevant Laws, Standards and Compliance Frameworks
- 9.2 Product, Service, Safety and Quality Requirements
- 9.3 Government Policies, Incentives and Subsidies
- 9.4 Imports, Exports and Trade Barriers
- 9.5 Public Procurement and Local Content Requirements
- 9.6 Environmental and Sustainability Compliance
- 9.7 Upcoming Policy Changes and Market Implications
Chapter 10 Asia Pacific Power Market Hotspots and Opportunities
- 10.1 Market Opportunity Mapping and Growth Hotspots
- 10.2 High-Growth Applications and Customer Groups
- 10.3 Underserved Markets and White-Space Opportunities
- 10.4 Emerging Technology and Product Opportunities
- 10.5 New Capacity and Investment Hotspots
- 10.6 Market Entry and Expansion Opportunities
- 10.7 Distribution and Partnership Opportunities
- 10.8 Near-Term and Long-Term Commercial Potential
- 10.9 Opportunity Attractiveness and Execution Risks
Chapter 11 Asia Pacific Power Market Outlook, 2025-2035
- 11.1 Market Size and Analysis
- 11.1.1 Revenue (Market Measurement: 2025: USD 1,421.99 billion → 2035: USD 2,541.31 billion)
- 11.1.2 Market Volume and Quantity Sold
- 11.1.3 Historical Market Size, 2018-2025
- 11.1.4 Base-Year Market Size, 2025
- 11.2 Market Forecast, 2025-2035
- 11.2.1 Revenue Forecast to 2035
- 11.2.2 Volume Forecast to 2035
- 11.2.3 CAGR and Year-on-Year Growth
- 11.2.4 Incremental Revenue Opportunity
- 11.3 Forecast Assumptions and Scenario Analysis
- 11.3.1 Base-Case Forecast
- 11.3.2 Optimistic and Conservative Scenarios
- 11.3.3 Technology, Pricing and Policy Sensitivities
- 11.4 Market Attractiveness and Growth Outlook
Chapter 12 Asia Pacific Power Market Segmentation and Outlook
- 12.1 Segmentation Summary and Market Shares, 2025
- 12.2 Largest and Fastest-Growing Segments
- 12.3 By Energy Source - Market Size and Forecast, 2025-2035
- 12.3.1 Segment Definition and Scope
- 12.3.2 Historical Market Size, 2018-2025
- 12.3.3 Revenue Forecast, 2025-2035
- 12.3.4 Volume Forecast, 2025-2035
- 12.3.5 Base-Year Market Share, 2025
- 12.3.6 Segment CAGR and Growth Drivers
- 12.3.7 Subsegment Market Size and Forecast
- 12.3.7.1 Coal
- 12.3.7.2 Gaseous and Liquid Fuels
- 12.3.7.3 Renewables
- 12.3.7.4 Nuclear
- 12.3.8 Subsegment Pricing and Adoption Trends
- 12.3.9 Leading Suppliers and Competition
- 12.3.10 Regional Demand and Opportunities
- 12.4 By Application - Market Size and Forecast, 2025-2035
- 12.4.1 Segment Definition and Scope
- 12.4.2 Historical Market Size, 2018-2025
- 12.4.3 Revenue Forecast, 2025-2035
- 12.4.4 Volume Forecast, 2025-2035
- 12.4.5 Base-Year Market Share, 2025
- 12.4.6 Segment CAGR and Growth Drivers
- 12.4.7 Subsegment Market Size and Forecast
- 12.4.7.1 Production Processes
- 12.4.7.2 Building Services
- 12.4.7.3 Digital Infrastructure
- 12.4.7.4 Mobility and Agricultural Operations
- 12.4.8 Subsegment Pricing and Adoption Trends
- 12.4.9 Leading Suppliers and Competition
- 12.4.10 Regional Demand and Opportunities
- 12.5 By End User - Market Size and Forecast, 2025-2035
- 12.5.1 Segment Definition and Scope
- 12.5.2 Historical Market Size, 2018-2025
- 12.5.3 Revenue Forecast, 2025-2035
- 12.5.4 Volume Forecast, 2025-2035
- 12.5.5 Base-Year Market Share, 2025
- 12.5.6 Segment CAGR and Growth Drivers
- 12.5.7 Subsegment Market Size and Forecast
- 12.5.7.1 Industrial Enterprises
- 12.5.7.2 Residential Households
- 12.5.7.3 Non-industrial Customers
- 12.5.8 Subsegment Pricing and Adoption Trends
- 12.5.9 Leading Suppliers and Competition
- 12.5.10 Regional Demand and Opportunities
- 12.6 By Ownership Model - Market Size and Forecast, 2025-2035
- 12.6.1 Segment Definition and Scope
- 12.6.2 Historical Market Size, 2018-2025
- 12.6.3 Revenue Forecast, 2025-2035
- 12.6.4 Volume Forecast, 2025-2035
- 12.6.5 Base-Year Market Share, 2025
- 12.6.6 Segment CAGR and Growth Drivers
- 12.6.7 Subsegment Market Size and Forecast
- 12.6.7.1 Public-controlled Suppliers
- 12.6.7.2 Private-controlled Suppliers
- 12.6.7.3 Community-controlled Suppliers
- 12.6.8 Subsegment Pricing and Adoption Trends
- 12.6.9 Leading Suppliers and Competition
- 12.6.10 Regional Demand and Opportunities
- 12.7 Segment Growth Comparison
- 12.8 Segment Attractiveness and Priority Matrix
Chapter 13 Asia Pacific Power End-Use and Application Market Outlook
- 13.1 End-Use Industry and Customer Demand Structure
- 13.2 Leading Applications and Customer Groups
- 13.3 End-Use Market Size, Share and Forecast
- 13.4 Major End-Use Industry Deep Dives
- 13.4.1 Customer Requirements and Use Cases
- 13.4.2 Demand and Replacement Cycles
- 13.4.3 Technical and Regulatory Considerations
- 13.4.4 Purchasing and Procurement Models
- 13.4.5 Leading Vendors and Distribution Channels
- 13.4.6 Forecast and Commercial Opportunities
- 13.5 Emerging Applications and Cross-Segment Demand
- 13.6 End-Use Industry Investment Priorities
Chapter 14 Asia Pacific Power Geographic Market Outlook, 2025-2035
- 14.1 Regional Market Size and Country-Level Shares, 2025
- 14.2 Country Market Size Comparison, 2025
- 14.3 Country Market Forecasts, 2025-2035
- 14.4 Subregional Industrial and Demand Clusters
- 14.5 Intra-Regional Pricing and Cost Differences
- 14.6 Cross-Border Trade and Supply Networks
- 14.7 Regional Supply and Demand Balances
- 14.8 Country Opportunity Comparison and Prioritization
Note: Every listed country is covered on the structure shown under the first country.
Chapter 15 Asia Pacific Power Technology, Innovation and Sustainability Outlook
- 15.1 Technology Landscape and Maturity
- 15.2 Product, Process and Service Innovation
- 15.3 AI, Automation and Digital Tools in the Industry
- 15.4 Technology Adoption and Performance Benchmarking
- 15.5 Innovation Pipeline and R&D Investment
- 15.6 Patent and Intellectual Property Trends
- 15.7 Energy Efficiency and Resource Management
- 15.8 Sustainability, Recycling and Circularity
- 15.9 Technology Roadmap, 2025-2035
- 15.10 Risks of Obsolescence and Technology Substitution
Chapter 16 Asia Pacific Power Market Key Strategic Imperatives
- 16.1 Growth and Market Entry Priorities
- 16.2 High-Return Products and Segments
- 16.3 Pricing, Profitability and Cost Optimization
- 16.4 Technology Investment and Product Differentiation
- 16.5 Supply Chain Localization and Resilience
- 16.6 Distribution and Customer Acquisition
- 16.7 Partnership, Acquisition and Capacity Strategy
- 16.8 Regional Expansion Priorities
- 16.9 Short-, Medium- and Long-Term Actions
Chapter 17 Competition Outlook
- 17.1 Industry Competition Characteristics
- 17.2 Market Structure and Concentration
- 17.3 Market Share and Competitive Positioning, 2025
- 17.4 Company-Wise Revenue and Product Benchmarking
- 17.5 Production and Service Capacity Benchmarking
- 17.6 Technology, Pricing and Differentiation
- 17.7 Regional Footprint and Distribution Strength
- 17.8 Mergers, Acquisitions and Strategic Alliances
- 17.9 New Entrants and Competitive Threats
- 17.10 Porter's Five Forces and Industry Attractiveness
- 17.11 Competitive Outlook, 2025-2035
Chapter 18 Company Profiles
- 18.1 Company Coverage and Selection Criteria
- 18.2 State Grid Corporation of China
- 18.2.1 Business Description
- 18.2.2 Company Ownership and Geographic Presence
- 18.2.3 Product and Service Portfolio
- 18.2.4 Manufacturing and Operating Footprint
- 18.2.5 Production Capacity and Expansion Plans
- 18.2.6 Financial Performance and Investment
- 18.2.7 Market Share and Competitive Position
- 18.2.8 Technology and Innovation Capabilities
- 18.2.9 Strategic Alliances or Partnerships
- 18.2.10 Recent Developments
- 18.2.11 Growth Strategy and Outlook
- 18.3 China Southern Power Grid
- 18.4 Korea Electric Power Corporation
- 18.5 Tokyo Electric Power Company Holdings
- 18.6 PT PLN (Persero)
- 18.7 Kansai Electric Power
- 18.8 Chubu Electric Power
- 18.9 Taiwan Power Company
- 18.10 Vietnam Electricity
- 18.11 Tenaga Nasional Berhad
- 18.12 Other Relevant Market Participants
Note: Every listed company is profiled on the structure shown under the first company. The company list is preliminary and may change based on research findings, market developments, data availability and client requirements.
Chapter 19 Disclaimer
- 19.1 Research and Forecast Disclaimer
- 19.2 Data Source and Estimation Limitations
Note: The depth of individual sections depends on data availability for this market. Volume, capacity, trade and other unit-based metrics are included where applicable.

