
Bundled feeders spread as utilities cut losses and theft
The APAC power distribution twisted cables market was valued at USD 7.99 billion in 2025 and is projected to increase from USD 8.62 billion in 2026 to USD 16.60 billion by 2035, registering a CAGR of 7.55% during 2026–2035. Demand comes from distribution utilities, industrial sites, solar developers and charging operators that string insulated bundles on poles or lay twisted cores to cut faults, theft and technical losses. China held the largest share, 53.9% in 2025, because State Grid and China Southern Power Grid run the largest distribution networks in the region. India is the fastest-growing country at 9.62% a year, as its distribution reform program replaces bare low-voltage lines and adds metered service connections. Technology is also changing, because utilities now specify XLPE-insulated aluminum conductors that carry more current at a lower metal cost. As a result, value per kilometer is rising even where line lengths grow slowly.
Which insulated feeder products are counted?
The estimate measures the value of new twisted and bundled distribution cables sold in China, India, Japan and South Korea and Southeast Asia, Oceania and Additional Asian Markets. It covers aerial bundled cables, medium-voltage twisted cores, low-voltage service cables, high-voltage twisted designs and short submarine links to islands, sold directly, through contractors or through distributors.
The estimate excludes bare overhead conductors, extra-high-voltage transmission cables, building wire, control and data cables and accessories sold separately. The value chain runs from copper and aluminum rod, XLPE and EPR compounds through cable makers and contractors to utilities, factories, solar plants and charging operators.
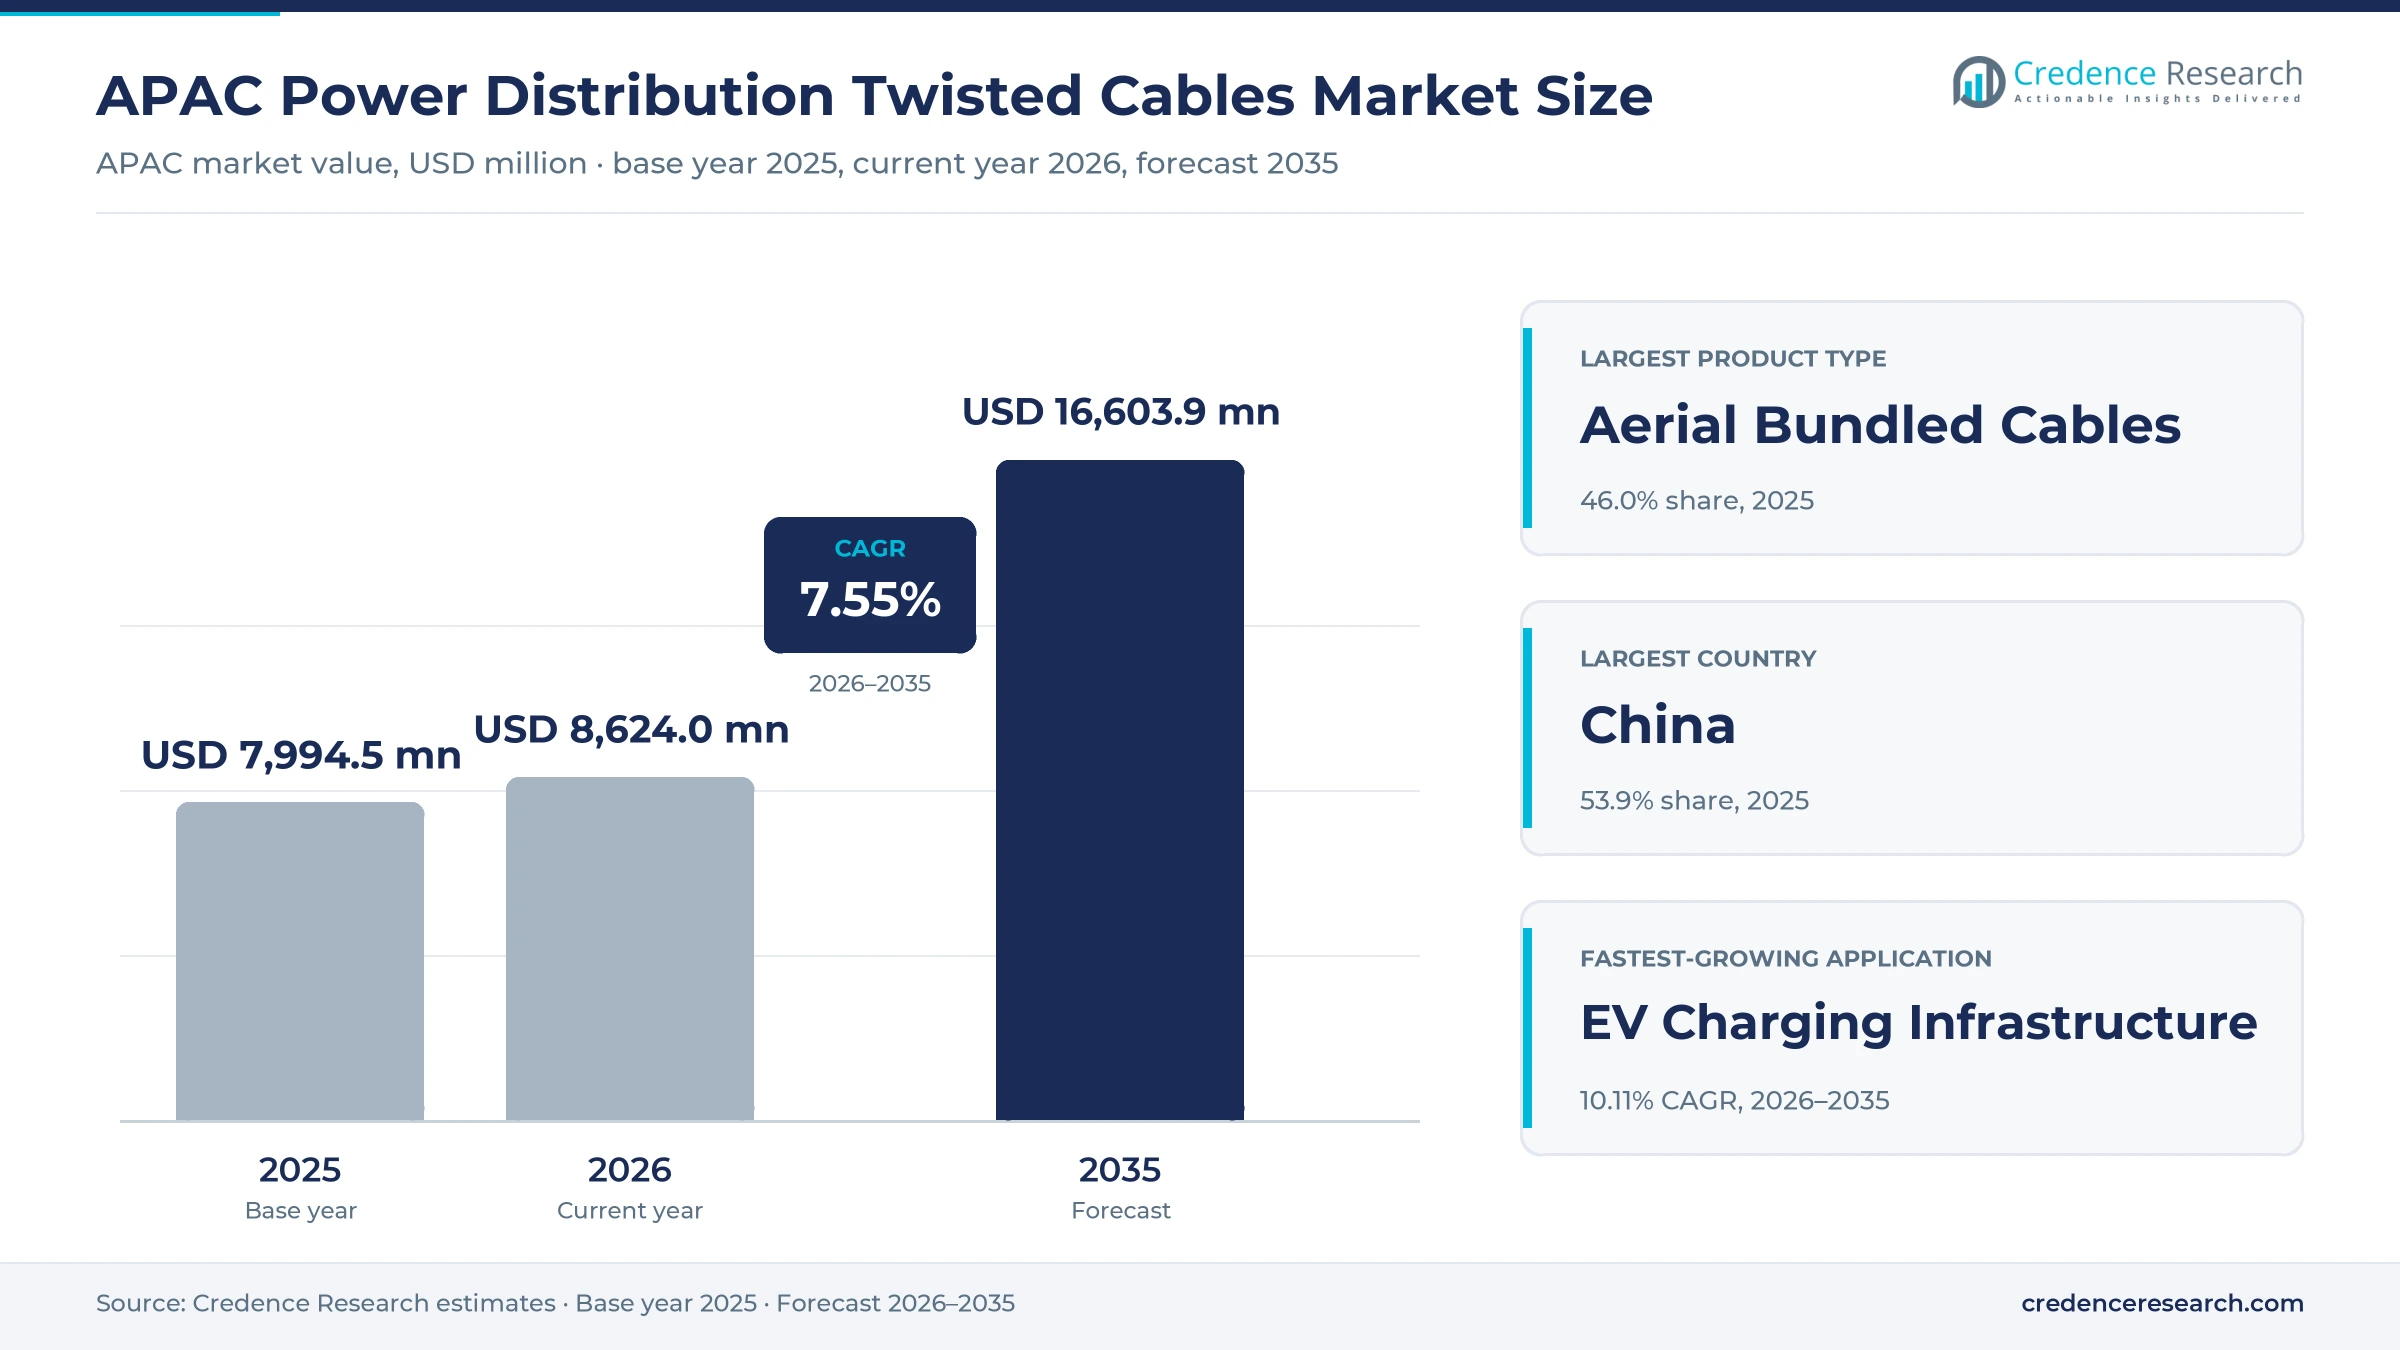
APAC Power Distribution Twisted Cables Market Insights
- The APAC power distribution twisted cables market was valued at USD 7.99 billion in 2025 and is projected to reach USD 16.60 billion by 2035, registering a CAGR of 7.55% during 2026–2035.
- China held 53.9% of 2025 value, because State Grid lifted fixed-asset investment to a record of about 650 billion yuan in 2025.
- Aerial bundled cables led product types with 46.0% of 2025 value, as utilities replace bare low-voltage lines to cut theft and faults.
- KEI Industries began commercial production of LT and HT cables at its Sanand plant in Gujarat on Dec. 10, 2025.
- EV charging infrastructure is the fastest-growing application at 10.11% a year, as China passed 20 million charging points in 2025.
Aerial bundles, utility networks and XLPE insulation lead
Why do aerial bundles carry the most value?
Based on product type, the market is categorized into Aerial Bundled Cables, Medium-Voltage Twisted Cables, Low-Voltage Non-ABC Twisted Cables, High-Voltage Twisted Cables and Submarine Distribution Twisted Cables. Aerial Bundled Cables led with 46.0% of 2025 value, because crews can string them on existing poles without new structures. Medium-Voltage Twisted Cables grow fastest at 8.31% a year, as solar parks and urban feeders need covered cores.
How do utility feeders and chargers shape demand?
Based on application, the market is categorized into Utility Distribution Networks, Industrial and Commercial Distribution, Renewable Energy Integration, Rural Electrification and EV Charging Infrastructure. Utility Distribution Networks led with 52.0% of 2025 value, because loss reduction programs replace millions of kilometers of service lines. EV Charging Infrastructure grows fastest at 10.11% a year, as fast chargers need dedicated feeders and new service connections.
Why do distribution utilities buy most cable?
Based on end user, the market is categorized into Distribution Utilities, Industrial and Commercial Asset Owners, Renewable Energy Developers and Charging Network Operators. Distribution Utilities led with 60.0% of 2025 value, because state utilities own most low- and medium-voltage lines in the region. Charging Network Operators grow fastest at 9.96% a year, as public charging networks move from pilot sites to large commercial operations.
How quickly is XLPE replacing older insulation?
Based on technology, the market is categorized into XLPE Insulation, EPR Insulation and Thermoplastic Insulation. XLPE Insulation led with 68.0% of 2025 value, because cross-linked polyethylene carries higher operating temperatures and resists sunlight on aerial bundles. XLPE Insulation grows fastest at 7.95% a year, as utilities phase out PVC-insulated service cables on new feeders and specify longer service lives.
| Segment Group | Leading Sub-segment | Share, 2025 | Fastest-growing Sub-segment | CAGR, 2026–2035 |
|---|---|---|---|---|
| By Product Type | Aerial Bundled Cables | 46.0% | Medium-Voltage Twisted Cables | 8.31% |
| By Application | Utility Distribution Networks | 52.0% | EV Charging Infrastructure | 10.11% |
| By End User | Distribution Utilities | 60.0% | Charging Network Operators | 9.96% |
| By Technology | XLPE Insulation | 68.0% | XLPE Insulation | 7.95% |
Request a Free Sample
Fill in your details and we'll send you a free sample report.
- Sample data tables & charts
- Research methodology
Loss cuts, rooftop solar and chargers lift feeder demand
How do loss reduction programs lift bundled cable demand?
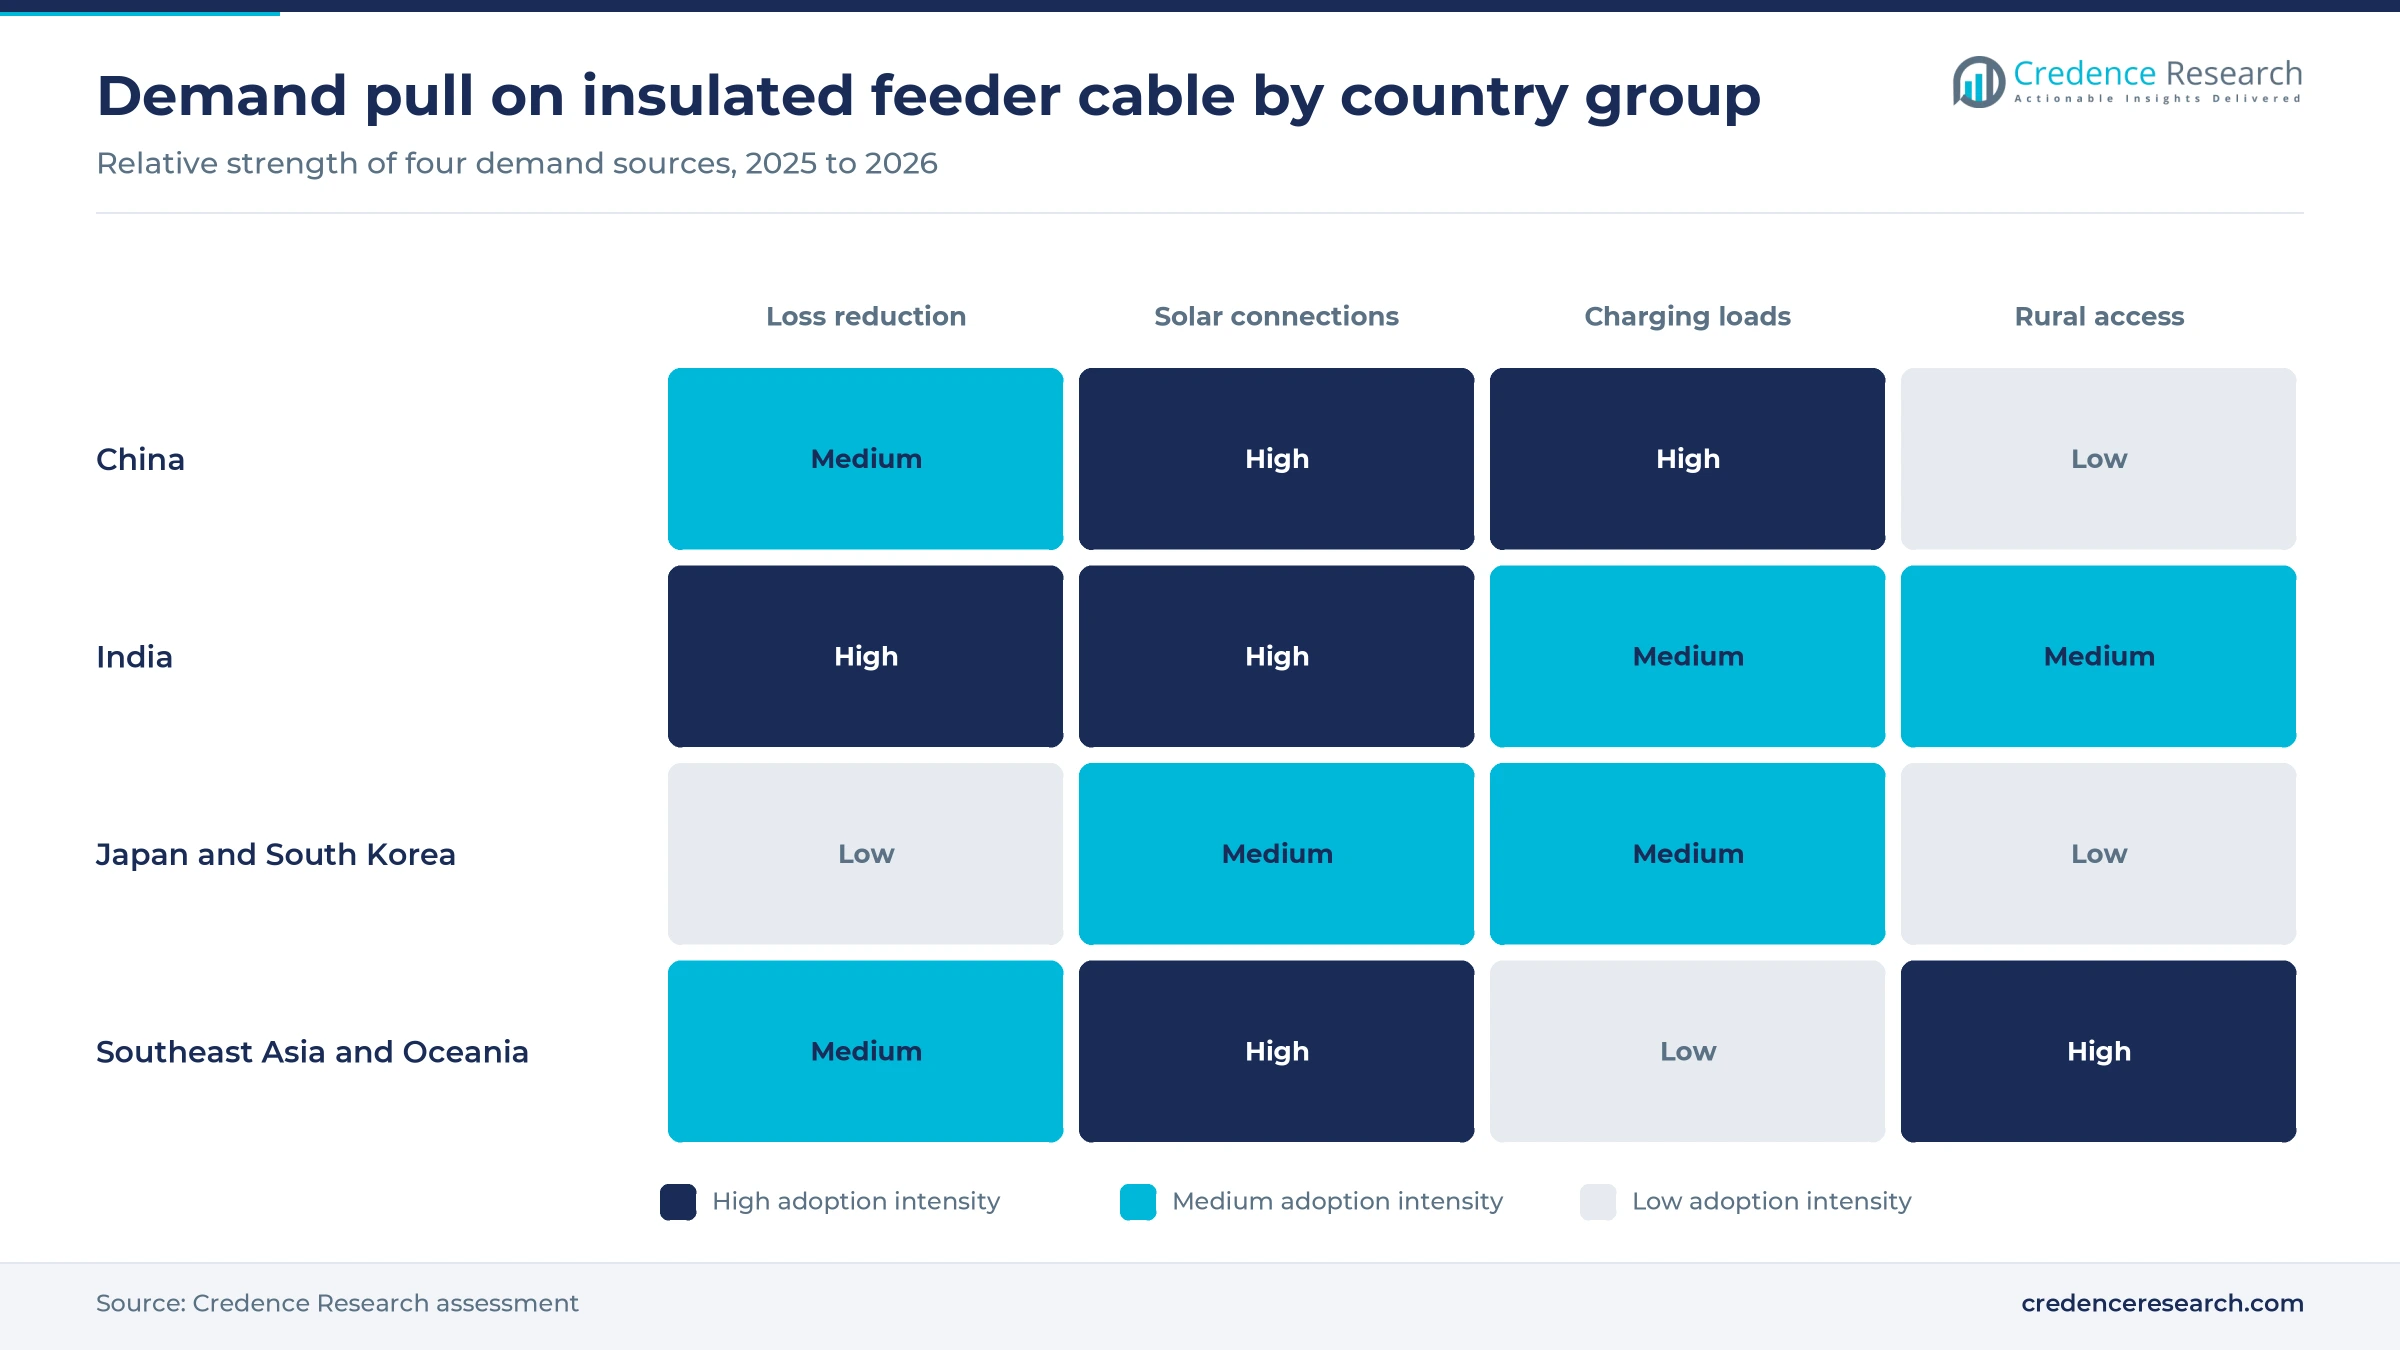
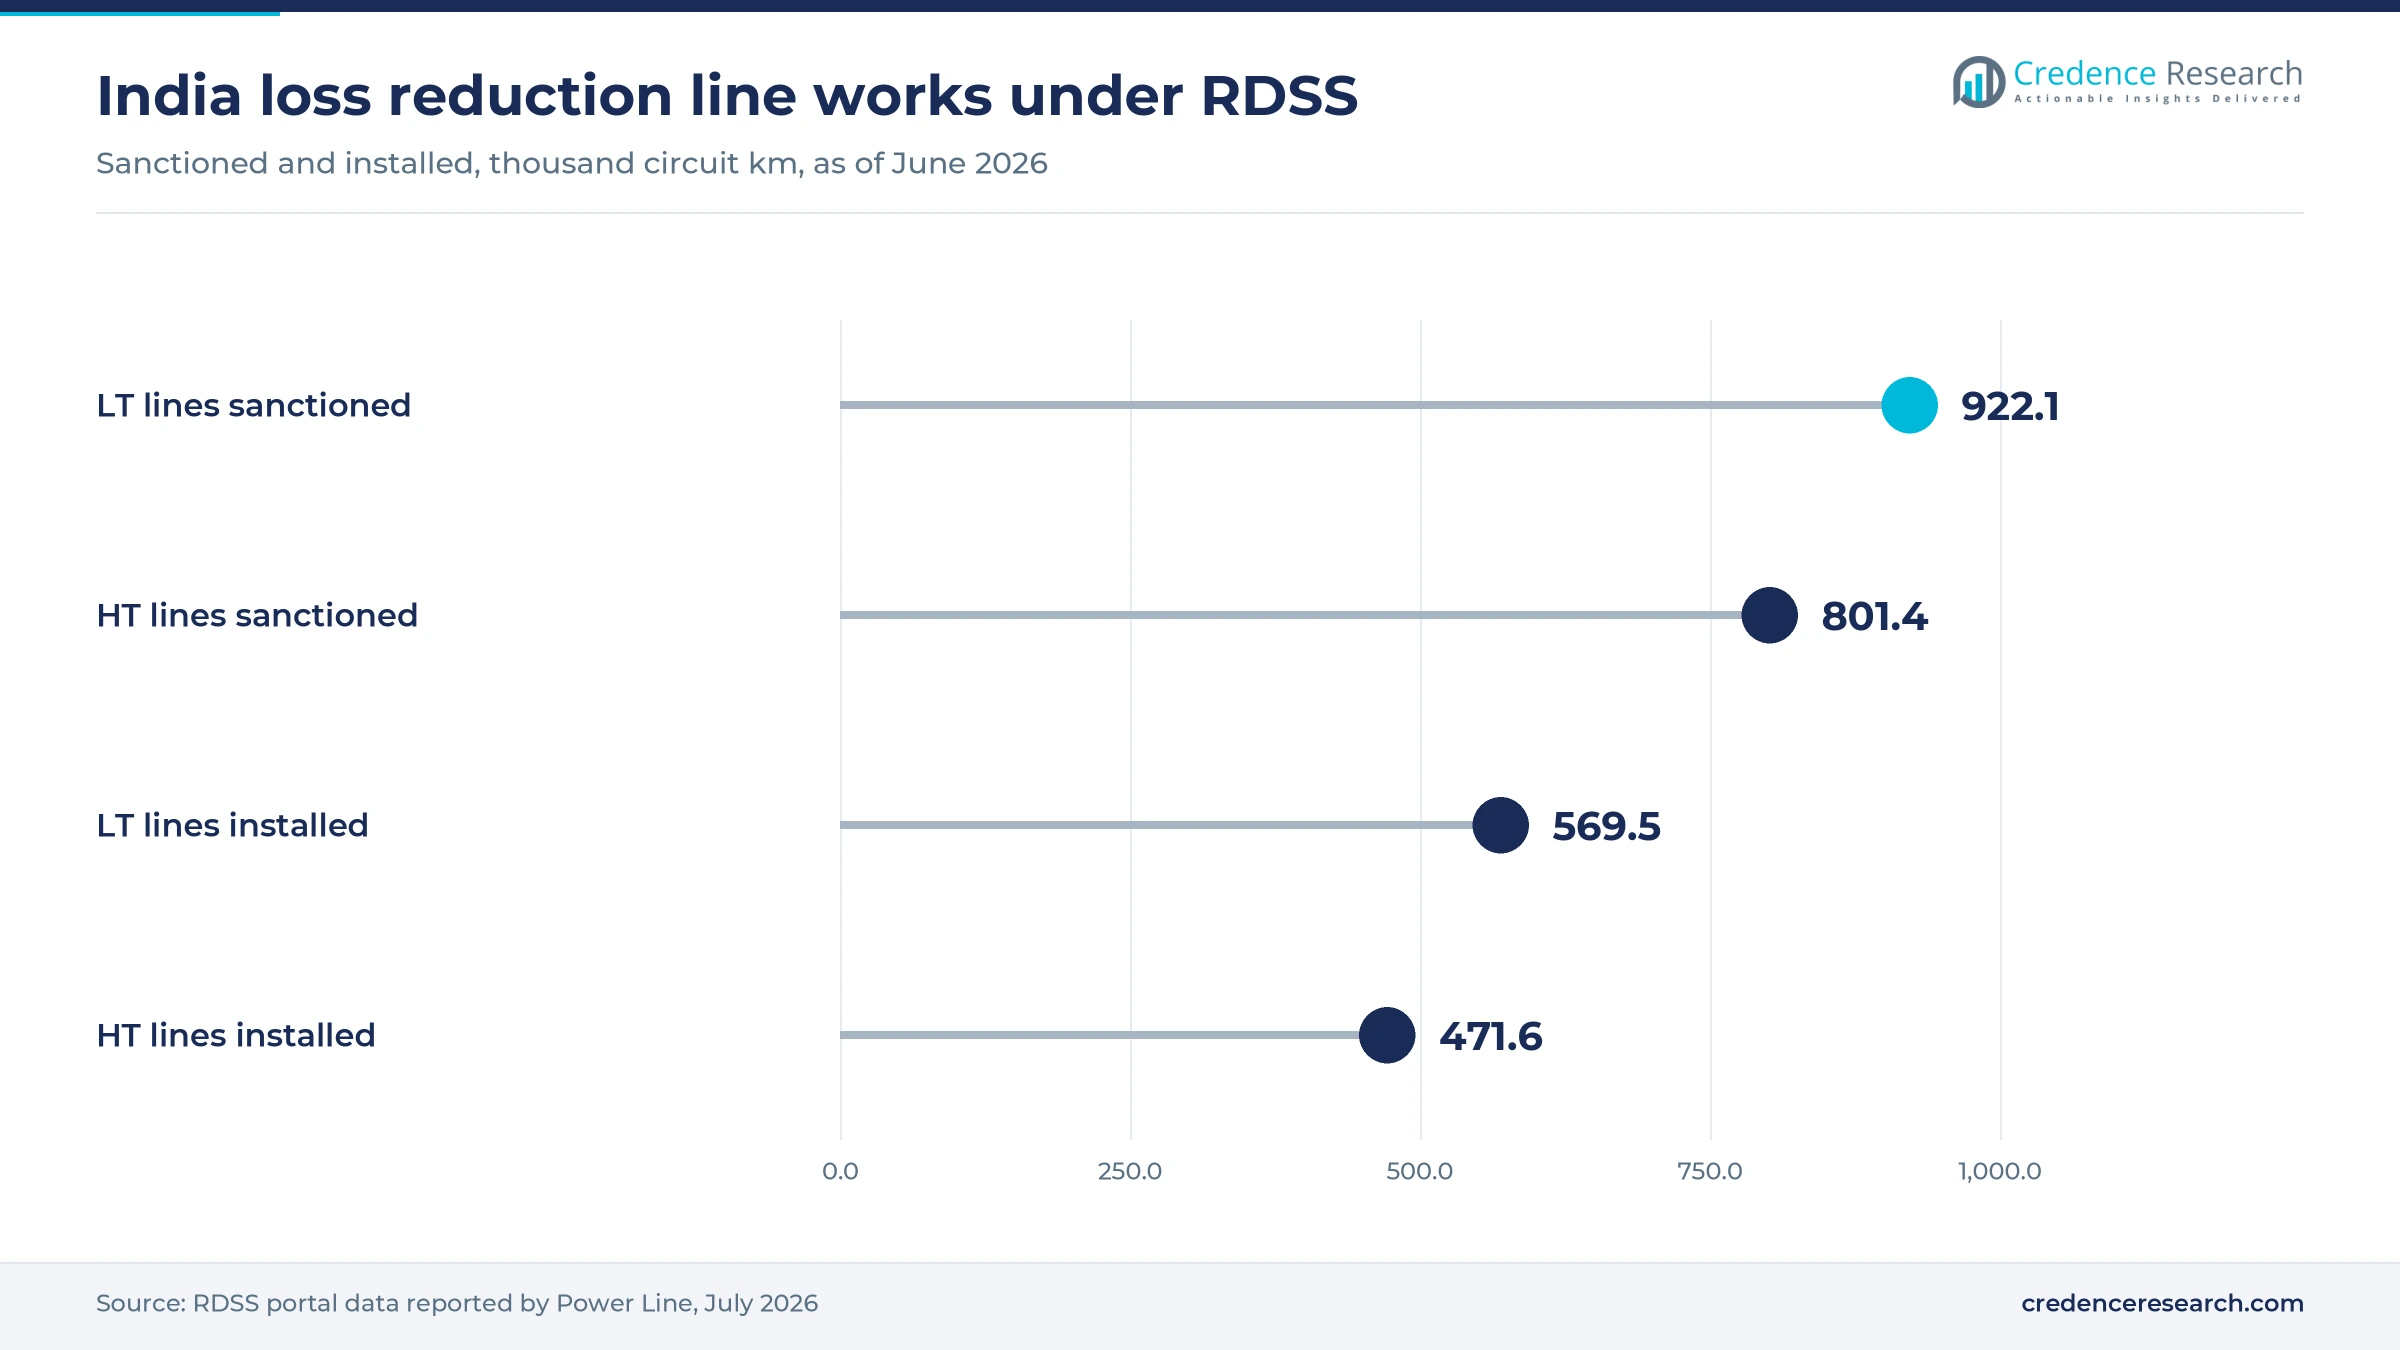
Utilities replace bare low-voltage conductors with insulated twisted bundles because covered lines cut theft, faults and technical losses on crowded feeders. India's Revamped Distribution Sector Scheme had sanctioned 922,116 circuit km of LT lines and 801,400 circuit km of HT lines for loss reduction works, according to Power Line in July 2026. Aggregate technical and commercial losses fell from 21.91% in FY2020-21 to 15.04% in FY2024-25, the same publication reported. In Karnataka, BESCOM cabling works covering more than 12,800 km helped lower its distribution losses from 12.27% in 2019-20 to 8.44% in 2024-25, Power Peak Digest reported. As a result, aerial bundled cables led product demand with 46.0% of 2025 value.
How do distributed solar connections strain local feeders?
Rooftop and commercial solar plants connect at medium and low voltage, so each new cluster needs fresh feeders, service drops and reinforced lines. China's combined wind and solar capacity passed 2,000 GW, and wind and solar output met 64% of new electricity use from January to September 2026, the National Energy Administration said on Oct. 30, 2026. The International Energy Agency has estimated that about 1,500 GW of renewable projects in advanced development were waiting for grid connections worldwide. In Australia, rooftop solar capacity reached 28.3 GW, pv magazine reported on Feb. 4, 2026, which keeps network owners busy with hosting upgrades. Therefore, Medium-Voltage Twisted Cables grow fastest by product type at 8.31% a year through 2035.
Why does charging network reinforcement need new feeders?
Fast chargers draw heavy loads at depots, highways and parking hubs, so utilities and operators must lay new feeders and service connections. China had 20.092 million charging points at the end of 2025, up 49.7%, including 4.717 million public connectors, according to National Energy Administration data reported by CnEVPost. India's Ministry of Heavy Industries issued guidelines in September 2025 for about 72,300 public charging stations under the PM E-DRIVE scheme with a 2,000 crore rupee outlay. Those guidelines cover 80% of upstream infrastructure costs, such as transformers and cables, at many public sites, the Free Press Journal reported. As a result, EV Charging Infrastructure is the fastest-growing application at 10.11% a year.
How do record utility budgets support cable orders?
Large state-owned utilities are lifting grid budgets, and a share of every program funds the distribution layer where twisted cables sit. State Grid Corp of China raised fixed-asset investment to a record of about 650 billion yuan in 2025, China Daily reported on Jan. 7, 2026. South Korea's 11th long-term transmission and substation plan sets 72.8 trillion won for 2024 to 2038, up 28.8% from the previous plan, according to Asia Economy. Indonesia's PLN business plan for 2025 to 2034, announced on May 26, 2025, foresees 47,758 km of transmission lines, Mondaq reported. Because new substations need outgoing feeders, China remains the anchor of regional demand for insulated feeder cable.
Aluminum conductors, buried lines and rural grid openings
Shift toward aluminum conductors as copper climbs
Cable makers are shifting toward aluminum conductors in low- and medium-voltage lines because copper prices kept setting records. Copper rose as high as USD 11,705 a metric ton on the London Metal Exchange on Dec. 5, 2025, an all-time peak, RTE reported. Polycab India invested about 1,500 crore rupees in capacity in FY2025-26, its annual report states, which gives Indian utilities more local sources of LT and HT cable. The World Bank expects copper to reach new nominal record highs in 2026 and 2027, Recycling Today reported. As a result, aluminum aerial bundles keep their cost edge on rural and suburban feeders, while buyers sign more metal-indexed supply contracts with producers.
Rise of buried and covered lines in dense cities
Utilities in dense cities are moving more lines underground or into covered designs to cut outages, wildfire risk and visual clutter. KEPCO standard costs put a 154 kV underground line at about 10 billion won per km against 1.52 billion won for an overhead line, Asia Economy reported on Sept. 21, 2026. That gap pushes Korean planners to bury lines only in selected sections, while lower-voltage feeders keep relying on covered and twisted designs on poles. Sumitomo Electric states on its power cable business page that XLPE cable is now dominant in new high-voltage lines. Consequently, XLPE insulation led technology with 68.0% of 2025 value across the region.
Opportunity in rural and island electrification
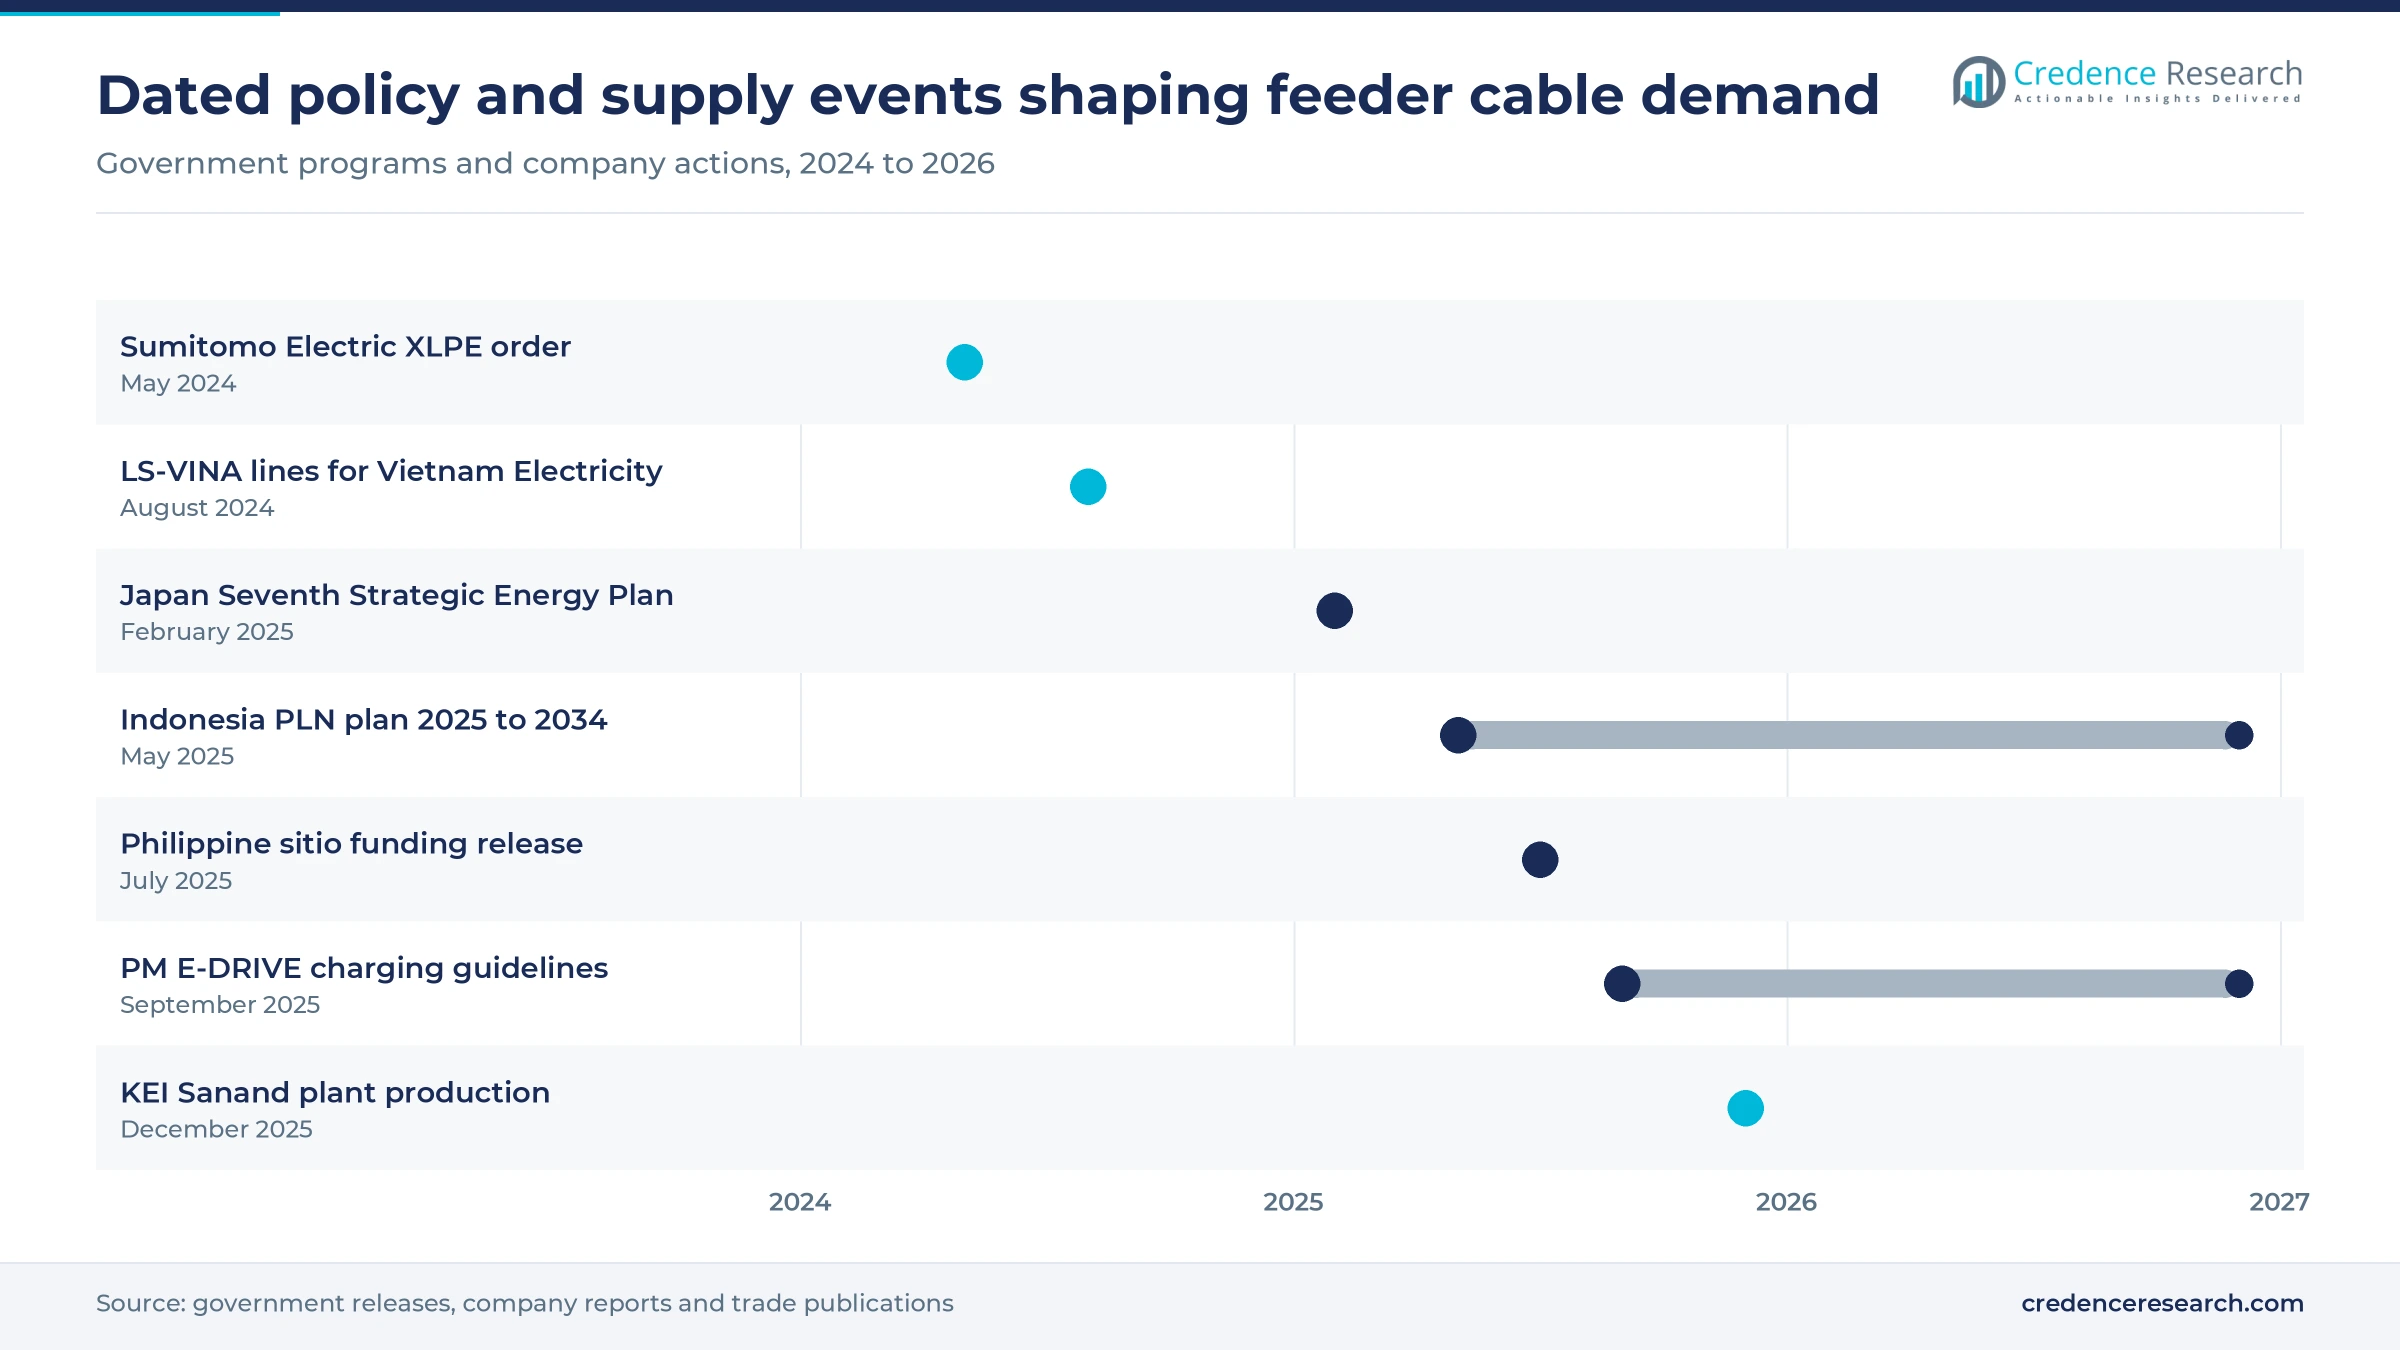
Rural and island electrification opens a large opportunity for low-cost aerial bundles that crews can string on existing poles. The Philippine budget department released more than 3.627 billion pesos to the National Electrification Administration on July 1, 2025, including 3.439 billion pesos to energize 1,752 sitios, according to the Department of Budget and Management. The same release said 9,622 targeted sitios remain unenergized and are slated for funding through 2028. LS-VINA, the Vietnamese unit of LS Eco Energy, supplied about 2,000 km of overhead lines to Vietnam Electricity for its northern-central backbone, The Investor reported in August 2024. Therefore, Southeast Asia, Oceania and Additional Asian Markets grow at 8.82% a year.
Opportunity for local makers in India's grid program
India offers a growing opportunity for local producers that can deliver aluminum bundles and medium-voltage cores at scale and on short lead times. KEI Industries began commercial production of LT and HT cables at its Sanand plant in Gujarat on Dec. 10, 2025, and the project will add 60,732 km of yearly capacity, according to Wire & Cable India. Polycab India invested about 1,500 crore rupees under its Project Spring program in FY2025-26 and is executing RDSS projects, its annual report states. Smart metering under the same scheme had reached 52.56 million consumer meters by June 2026, Power Line reported, which exposes weak service lines. As a result, Indian utilities will keep ordering bundled service cable through 2035.
Metal prices, tight tenders and utility finances weigh
Volatile copper and aluminum prices squeeze margins
Metal accounts for most of the cost of a twisted feeder cable, so sharp swings in copper and aluminum prices hit cable makers that bid fixed prices months ahead. Utilities then delay awards or rebid packages when metal rises, which leaves plants underused and pushes back deliveries. Producers that use metal-linked price clauses, hedging and aluminum designs reduce this risk, although smaller regional makers often lack the balance sheet to do so.
Lowest-price tenders invite quality failures
Many utility tenders still award contracts mainly on price, which lets thin insulation, poor stranding or uncured XLPE reach the field. Early failures then raise outage minutes and repair costs for distribution companies that already run tight budgets. Type testing, factory audits and longer warranty terms help screen weak suppliers, although they lengthen approval cycles for new entrants and smaller plants seeking utility listings.
Utility finances limit the pace of upgrades
State-owned distribution companies across South and Southeast Asia often recover less than their full supply cost, which limits how much network renewal they can fund from their own cash. Indian distribution utilities posted a combined loss of 25,553 crore rupees in FY2023-24 before a small profit in FY2024-25, The Tribune reported. Because central grants depend on loss targets, missed milestones can slow the release of funds and delay cable orders. Distribution utilities account for 60.0% of 2025 demand, so pressure on their budgets reaches cable makers quickly.
Installation crews and right of way slow projects
Replacing bare lines with bundled cable needs trained line crews, outage windows and access to crowded streets and rural poles. Shortages of skilled crews and local permit delays stretch project timelines, especially in fast-growing Indian and Southeast Asian cities. Utilities that award larger turnkey packages to experienced contractors and plan outages in advance finish faster, although this concentrates work among fewer firms with proven field teams.
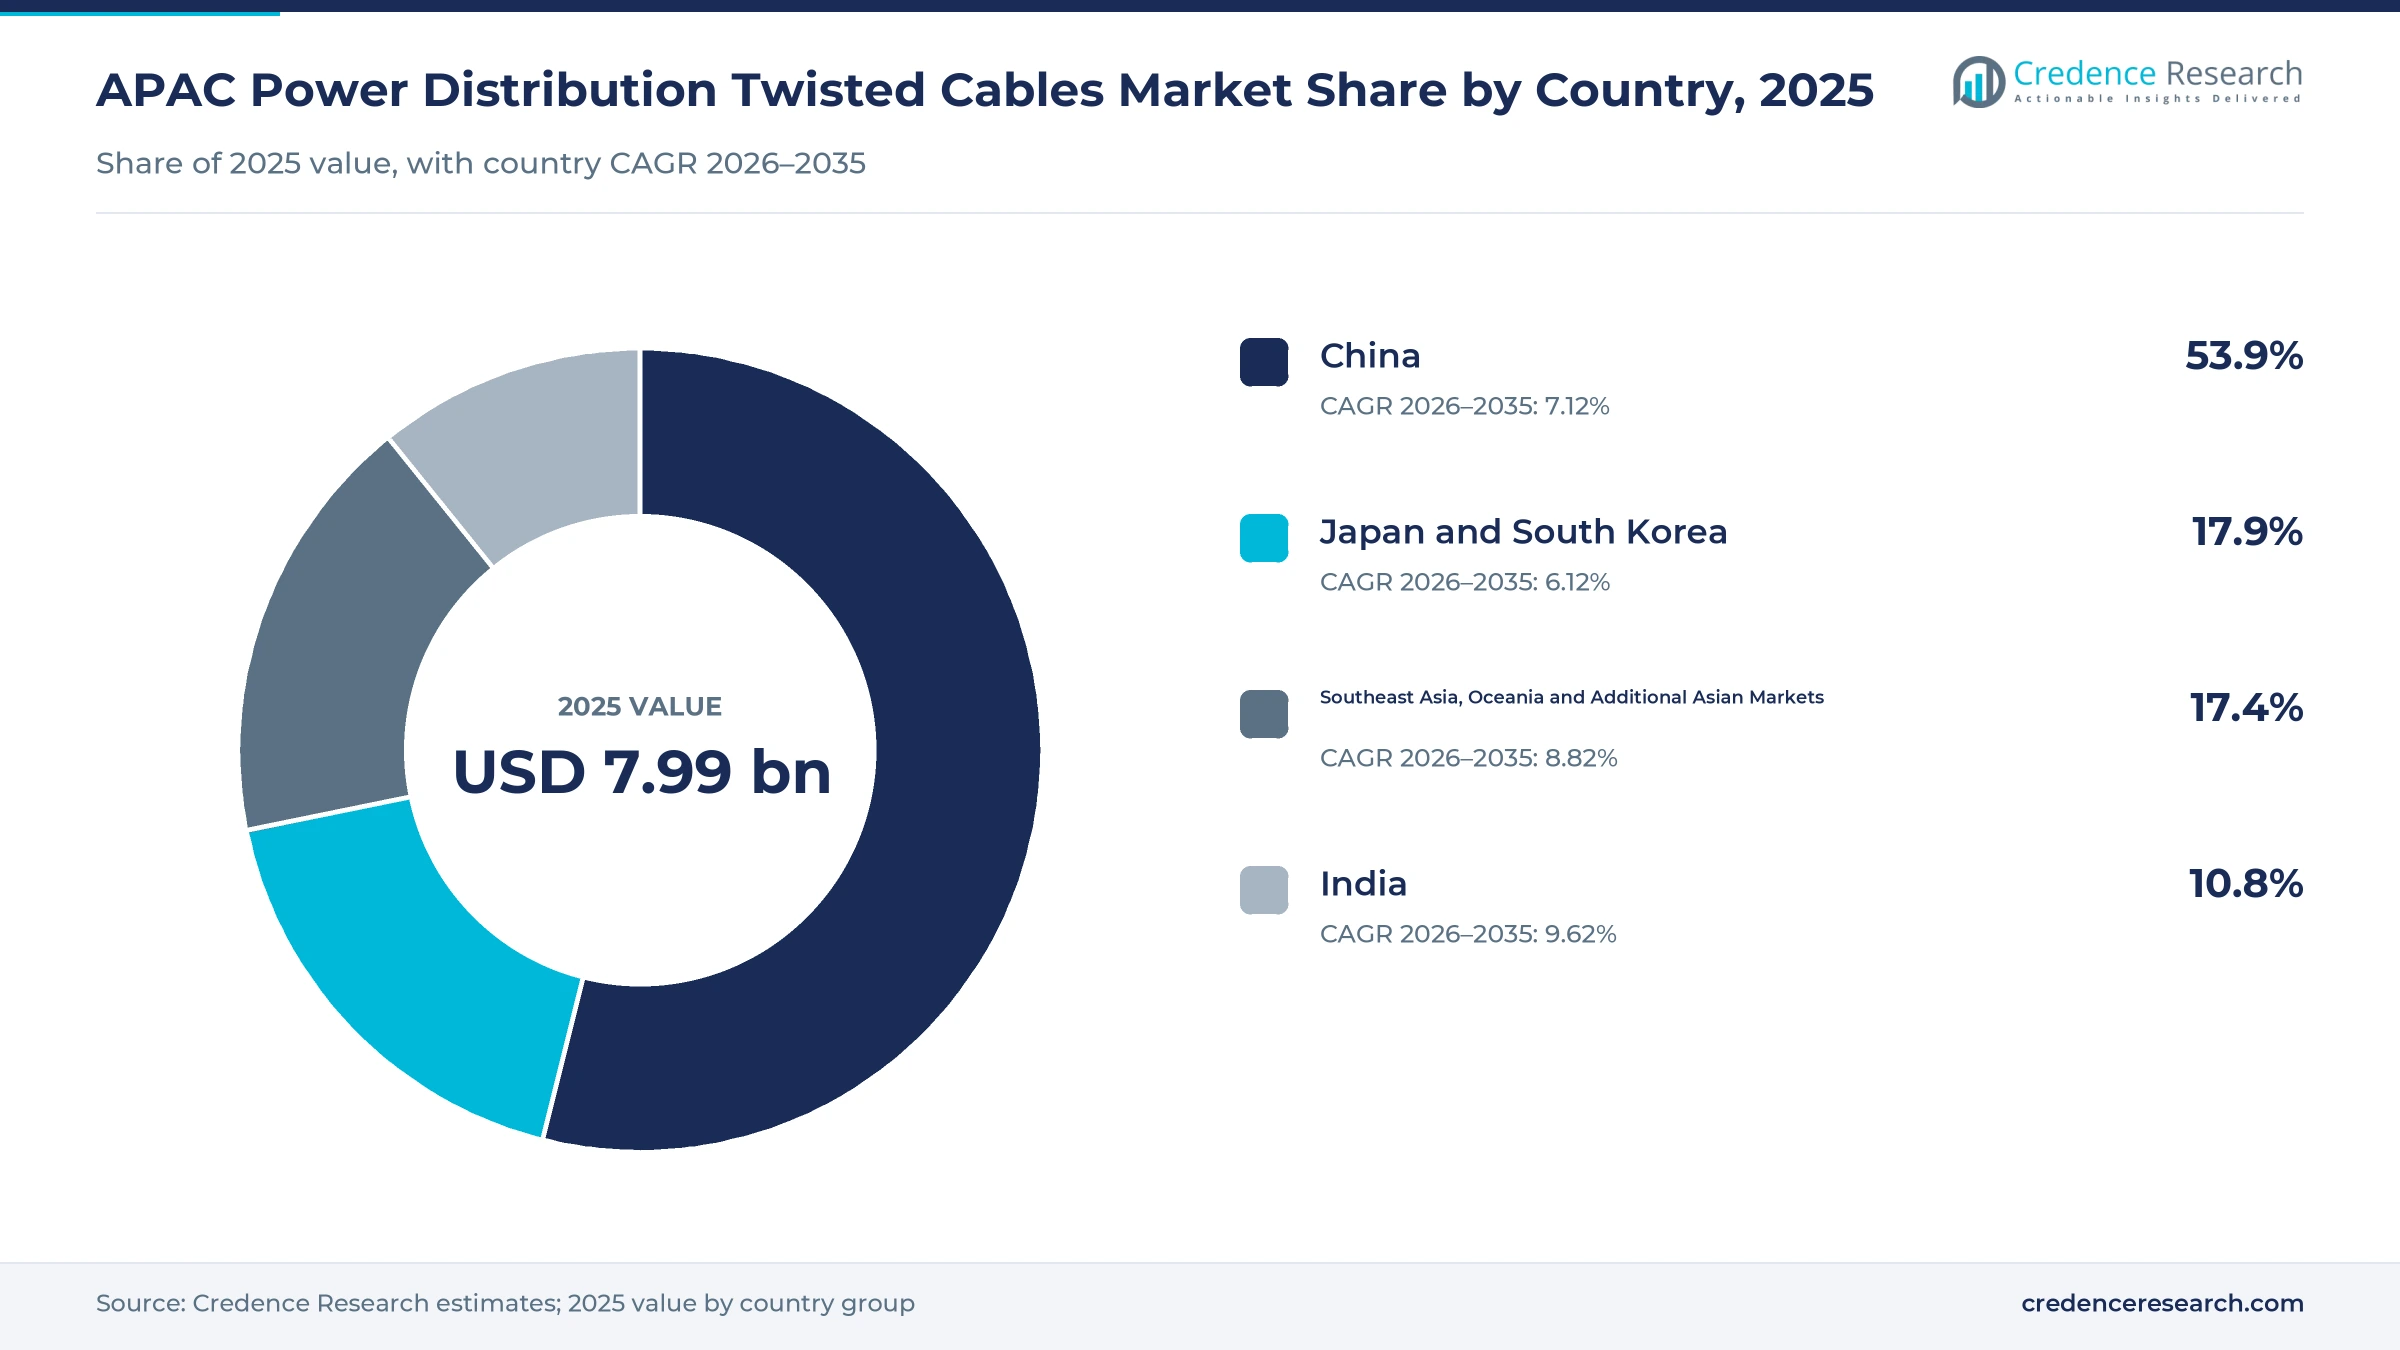
China leads while India and Southeast Asia grow fastest
| Country | Value, 2025 (USD billion) | Share, 2025 | CAGR, 2026–2035 |
|---|---|---|---|
| China | 4.31 | 53.9% | 7.12% |
| Japan and South Korea | 1.43 | 17.9% | 6.12% |
| Southeast Asia, Oceania and Additional Asian Markets | 1.39 | 17.4% | 8.82% |
| India | 0.86 | 10.8% | 9.62% |
China leads on scale of grid spending
China held 53.9% of 2025 value and grows at 7.12% a year, because State Grid and China Southern Power Grid order large volumes of insulated feeders for urban and rural networks. These orders form part of wider grid modernization programs that also fund automation and new substations. Distributed solar and charging points are expanding at record speed, so local feeders need regular reinforcement. Chinese makers also face higher copper prices, which pushes more aluminum conductors into low- and medium-voltage tenders and keeps price competition intense among domestic producers.
Japan and South Korea renew mature networks
Japan and South Korea held 17.9% of 2025 value and grow at 6.12% a year, as utilities replace aging feeders rather than build large new networks. Japan's cabinet approved the Seventh Strategic Energy Plan on Feb. 18, 2025, which supports more renewable connections on local lines. South Korea plans selective undergrounding and long-term grid expansion, while domestic makers such as LS Cable & System supply both markets and exports. Utilities in both countries also replace high-voltage transformers at aging substations, which in turn triggers new outgoing feeder work.
Southeast Asia and Oceania gain from new connections
Southeast Asia, Oceania and Additional Asian Markets held 17.4% of 2025 value and grow at 8.82% a year. Indonesia, the Philippines and Vietnam are extending networks to rural and island communities, while Australia connects large volumes of rooftop solar. Because many projects use pole-mounted bundles, aerial cables carry a high share of value in these markets. Island grids in the Philippines and Indonesia also need short submarine links, which lifts demand for specialized twisted designs over the forecast.
India grows fastest on loss reduction works
India held 10.8% of 2025 value and is the fastest-growing country at 9.62% a year, because its distribution reform program funds new LT and HT lines, feeder segregation and smart meters. Domestic makers such as KEI Industries and Polycab India are adding capacity close to utility buyers, drawing on the wider Indian electric wire industry for compounds and skilled labor. Public charging stations under PM E-DRIVE and rooftop solar connections add further feeder demand through 2035, especially in large states with high technical losses.
Plant openings, utility orders and policy moves to 2026
| Development | Status and market relevance |
|---|---|
| In December 2025, KEI Industries began commercial production of LT and HT cables at its new Sanand plant in Gujarat. | Operating; adds 60,732 km of capacity close to Indian utility and project buyers |
| In September 2025, India's Ministry of Heavy Industries issued PM E-DRIVE guidelines for about 72,300 public charging stations. | Under way; upstream feeder and cable costs are subsidized at many public sites |
| In July 2025, the Philippine budget department released over 3.627 billion pesos for rural electrification by the National Electrification Administration. | Funded; supports line extensions to 1,752 sitios in 2025 |
| In August 2024, LS-VINA, the Vietnamese unit of LS Eco Energy, supplied about 2,000 km of overhead lines to Vietnam Electricity. | Delivered; strengthens the northern-central backbone after dry-season shortages |
| In July 2026, India's RDSS program data showed 922,116 circuit km of LT lines and 801,400 circuit km of HT lines sanctioned for loss reduction. | Under way; 569,512 circuit km of LT lines had been installed, lifting bundled cable demand |
XLPE cores, aluminum conductors and covered designs
- XLPE insulation allows higher conductor temperatures than PVC, so a given conductor size carries more current on crowded feeders and lasts longer in tropical heat.
- Aluminum and aluminum alloy conductors cut metal cost and weight on aerial bundles, which matters more as copper prices stay high and poles carry heavier loads.
- Covered medium-voltage designs let utilities run medium-voltage feeders through tree-lined and narrow streets with fewer faults and fewer outages from storms.
- Smart metering and feeder monitoring show where losses occur, so utilities target cable replacement at the worst service lines first and measure the savings afterward.
Need a Custom Version of This Report?
Tailor the scope, geography, or segments to your exact requirements.
- Custom geography or segment scope
- Direct access to our analyst team
Chinese scale meets Indian, Korean and Japanese makers
Competition combines very large Chinese producers with strong national champions in India, South Korea and Japan. Far East Cable and other Chinese makers compete on scale and price in State Grid and China Southern Power Grid tenders, where aluminum designs are gaining ground. In India, Polycab India and KEI Industries compete for utility, EPC and dealer business and are adding plant capacity close to buyers. LS Cable & System serves Korea and Southeast Asia, with its Vietnamese unit supplying the national utility. Sumitomo Electric Industries focuses on high-specification XLPE products and long-standing Japanese utility relationships. Buyers judge suppliers on type-test approvals, delivery reliability and metal-linked pricing. As a result, producers with local plants, backward integration into rod and compounds, and approved designs for several utilities hold an advantage over importers and smaller regional makers.
Companies profiled and their roles in this market
| Company | Type | Role in the market |
|---|---|---|
| Sumitomo Electric Industries | Japanese cable maker | XLPE power cables and overhead conductors for Japanese utilities, with a power cable factory at Osaka Works |
| Polycab India | Indian cable maker | Wires and cables plus RDSS distribution project execution in India |
| LS Cable & System | Korean cable maker | Power cables in Korea and Vietnam through LS-VINA, a supplier to Vietnam Electricity |
| KEI Industries | Indian cable maker | LT and HT cables, with the Sanand plant in Gujarat in production since December 2025 |
| Far East Cable | Chinese cable maker | Cable network and power products for Chinese grid and industrial buyers |
Credence Research view on regional feeder demand
Credence Research's view is that the region is moving from building new lines to upgrading the lines it already has. Loss reduction in India, distributed solar in China and Australia, and charging hubs in large cities all require insulated feeders rather than bare conductors. Because metal prices remain high, the winners will be makers that offer aluminum designs, metal-linked pricing and reliable delivery to state utilities. India and Southeast Asia will add capacity fastest, while China will keep setting the price level for the region through 2035.
How the regional estimate was built
The report uses 2025 as the base year and forecasts values from 2026 to 2035 in USD million. Market values come from the Credence Research model, built from utility investment plans, program data on line lengths and smart meters, and typical cable prices per kilometer. Country, product, application, end user and technology splits are Credence Research estimates. Sources include government and utility releases, statistics offices, company annual reports and trade publications. No interviews or surveys with buyers or suppliers are claimed for this edition of the report.
India, chargers and medium voltage lead to 2035
The market is projected to reach USD 16.60 billion by 2035, as utilities keep replacing bare low-voltage lines and adding feeders for solar and charging loads. India and Southeast Asia, Oceania and Additional Asian Markets will gain share because their networks are still expanding and loss rates remain high. Medium-voltage twisted cables and charging-related cable will grow faster than aerial bundles, although bundles will remain the largest product. China will keep the largest share, while metal prices and utility finances will set the pace of yearly orders.
Frequently Asked Questions
How big is the APAC power distribution twisted cables market?
Which country leads the regional market?
Which country grows fastest?
Which product type holds the largest share?
Which application grows fastest?
Why are aluminum conductors gaining ground?
Which insulation technology leads?
Which companies are active in the market?
Table of Content
Chapter 1 Market Segmentation
- 1.1 Segmentation Framework
- 1.1.1 Product and Service Classification
- 1.1.2 Application and End-Use Classification
- 1.1.3 Technology and Solution Classification
- 1.1.4 Customer and Distribution Channel Classification
- 1.1.5 Geographic Segmentation
- 1.1.6 Market Segment Definitions and Boundaries
- 1.2 By Product Type
- 1.2.1 Aerial Bundled Cables
- 1.2.2 Medium-Voltage Twisted Cables
- 1.2.3 Low-Voltage Non-ABC Twisted Cables
- 1.2.4 High-Voltage Twisted Cables
- 1.2.5 Submarine Distribution Twisted Cables
- 1.3 By Application
- 1.3.1 Utility Distribution Networks
- 1.3.2 Industrial and Commercial Distribution
- 1.3.3 Renewable Energy Integration
- 1.3.4 Rural Electrification
- 1.3.5 EV Charging Infrastructure
- 1.4 By End User
- 1.4.1 Distribution Utilities
- 1.4.2 Industrial and Commercial Asset Owners
- 1.4.3 Renewable Energy Developers
- 1.4.4 Charging Network Operators
- 1.5 By Technology
- 1.5.1 XLPE Insulation
- 1.5.2 EPR Insulation
- 1.5.3 Thermoplastic Insulation
- 1.6 By Country
- 1.6.1 China
- 1.6.2 India
- 1.6.3 Japan and South Korea
- 1.6.4 Southeast Asia, Oceania and Additional Asian Markets
Chapter 2 Introduction
- 2.1 Report Objectives and Scope
- 2.2 Product Definition and Industry Terminology
- 2.3 Market Inclusions and Exclusions
- 2.4 Research Process
- 2.4.1 Primary Research and Expert Interviews
- 2.4.2 Secondary Research and Source Review
- 2.4.3 Top-Down and Bottom-Up Estimation
- 2.4.4 Data Triangulation and Verification
- 2.5 Market Size Measurement Basis
- 2.5.1 2025: USD 7.99 billion → 2035: USD 16.60 billion
- 2.6 Historical and Forecast Reference Periods
- 2.6.1 Historical Period: 2018-2025
- 2.6.2 Base Year: 2025
- 2.6.3 Forecast Period: 2025-2035
- 2.7 Research Assumptions and Limitations
Chapter 3 Executive Summary
- 3.1 Market Snapshot and Key Findings
- 3.2 Base-Year Market Size, 2025
- 3.3 Forecast Market Size, 2035
- 3.4 Revenue and Volume Growth Outlook
- 3.5 Key Demand and Supply Indicators
- 3.6 Leading Market Segments
- 3.7 Fastest-Growing Market Opportunities
- 3.8 Regional Performance Highlights
- 3.9 Technology and Industry Transformation
- 3.10 Competitive Landscape Summary
- 3.11 Analyst View and Strategic Implications
Chapter 4 APAC Power Distribution Twisted Cables Market Trends and Developments
- 4.1 Historical Industry Development, 2018-2025
- 4.2 Recent Market Trends and Developments
- 4.3 Demand and Customer Behavior Trends
- 4.4 Technology and Product Innovation
- 4.5 Artificial Intelligence, Automation and Digitalization
- 4.6 Local Manufacturing and Supply Chain Realignment
- 4.7 Industry Partnerships, Mergers and Acquisitions
- 4.8 Sustainability and Circular Economy Developments
- 4.9 Government and Private Sector Investment Trends
- 4.10 Emerging Business Models and Commercialization
- 4.11 Industry Developments and Announcements
Chapter 5 APAC Power Distribution Twisted Cables Market Production, Supply and Demand Analysis
- 5.1 Demand Trend and Consumption Analysis, 2018-2025
- 5.2 Demand Forecast, 2025-2035
- 5.3 Production and Output Trend, 2018-2025
- 5.4 Production and Output Forecast, 2025-2035
- 5.5 Installed Capacity and Capacity Utilization
- 5.6 Company-Wise Production Plants and Statistics
- 5.6.1 Installed Production Capacity
- 5.6.2 Actual Production
- 5.6.3 Planned Capacity and Expansion Targets
- 5.7 Supply Chain Structure and Procurement Trends
- 5.8 Supply-Demand Gap and Bottlenecks
- 5.9 Import Dependence and Sourcing Structure
- 5.10 Contract Manufacturing and Outsourcing
- 5.11 Regional Supply and Demand Concentration
Chapter 6 APAC Power Distribution Twisted Cables Market Pricing Analysis
- 6.1 Pricing Structure and Measurement
- 6.2 Historical Pricing Trends, 2018-2025
- 6.3 Pricing Outlook, 2025-2035
- 6.4 Average Selling Price and Unit Economics
- 6.5 Pricing by Product and Market Segment
- 6.6 Geographic Pricing Differences
- 6.7 Key Input, Energy, Labor and Logistics Costs
- 6.8 Contract Pricing and Purchasing Models
- 6.9 Pricing Sensitivity and Competitive Positioning
- 6.10 Price, Margin and Profitability Implications
Chapter 7 APAC Power Distribution Twisted Cables Market Dynamics
- 7.1 Market Growth Drivers
- 7.1.1 Demand-Side Drivers
- 7.1.2 Technology and Innovation Drivers
- 7.1.3 Infrastructure and Investment Drivers
- 7.1.4 Regulatory and Policy Drivers
- 7.2 Market Restraints
- 7.2.1 Cost and Affordability Constraints
- 7.2.2 Technology and Adoption Barriers
- 7.2.3 Supply Chain and Operational Constraints
- 7.3 Market Challenges
- 7.3.1 Competitive Pressure and Margin Erosion
- 7.3.2 Skills, Infrastructure and Implementation Gaps
- 7.4 Emerging Market Opportunities
- 7.5 Market Dynamics Impact and Time-Horizon Assessment
Chapter 8 APAC Power Distribution Twisted Cables Value Chain Analysis
- 8.1 Industry Value Chain Overview
- 8.2 Upstream Suppliers and Critical Inputs
- 8.3 Technology and Component Providers
- 8.4 Manufacturing or Service Delivery
- 8.5 Distribution, Channel Partners and Integrators
- 8.6 Downstream Applications and End Users
- 8.7 Value Addition and Profit Pools
- 8.8 Vertical Integration and Outsourcing
- 8.9 Supplier Concentration and Risk
- 8.10 Supply Chain Localization and Resilience
Chapter 9 APAC Power Distribution Twisted Cables Market Regulations and Policies
- 9.1 Relevant Laws, Standards and Compliance Frameworks
- 9.2 Product, Service, Safety and Quality Requirements
- 9.3 Government Policies, Incentives and Subsidies
- 9.4 Imports, Exports and Trade Barriers
- 9.5 Public Procurement and Local Content Requirements
- 9.6 Environmental and Sustainability Compliance
- 9.7 Upcoming Policy Changes and Market Implications
Chapter 10 APAC Power Distribution Twisted Cables Market Hotspots and Opportunities
- 10.1 Market Opportunity Mapping and Growth Hotspots
- 10.2 High-Growth Applications and Customer Groups
- 10.3 Underserved Markets and White-Space Opportunities
- 10.4 Emerging Technology and Product Opportunities
- 10.5 New Capacity and Investment Hotspots
- 10.6 Market Entry and Expansion Opportunities
- 10.7 Distribution and Partnership Opportunities
- 10.8 Near-Term and Long-Term Commercial Potential
- 10.9 Opportunity Attractiveness and Execution Risks
Chapter 11 APAC Power Distribution Twisted Cables Market Outlook, 2025-2035
- 11.1 Market Size and Analysis
- 11.1.1 Revenue (Market Measurement: 2025: USD 7.99 billion → 2035: USD 16.60 billion)
- 11.1.2 Market Volume and Quantity Sold
- 11.1.3 Historical Market Size, 2018-2025
- 11.1.4 Base-Year Market Size, 2025
- 11.2 Market Forecast, 2025-2035
- 11.2.1 Revenue Forecast to 2035
- 11.2.2 Volume Forecast to 2035
- 11.2.3 CAGR and Year-on-Year Growth
- 11.2.4 Incremental Revenue Opportunity
- 11.3 Forecast Assumptions and Scenario Analysis
- 11.3.1 Base-Case Forecast
- 11.3.2 Optimistic and Conservative Scenarios
- 11.3.3 Technology, Pricing and Policy Sensitivities
- 11.4 Market Attractiveness and Growth Outlook
Chapter 12 APAC Power Distribution Twisted Cables Market Segmentation and Outlook
- 12.1 Segmentation Summary and Market Shares, 2025
- 12.2 Largest and Fastest-Growing Segments
- 12.3 By Product Type - Market Size and Forecast, 2025-2035
- 12.3.1 Segment Definition and Scope
- 12.3.2 Historical Market Size, 2018-2025
- 12.3.3 Revenue Forecast, 2025-2035
- 12.3.4 Volume Forecast, 2025-2035
- 12.3.5 Base-Year Market Share, 2025
- 12.3.6 Segment CAGR and Growth Drivers
- 12.3.7 Subsegment Market Size and Forecast
- 12.3.7.1 Aerial Bundled Cables
- 12.3.7.2 Medium-Voltage Twisted Cables
- 12.3.7.3 Low-Voltage Non-ABC Twisted Cables
- 12.3.7.4 High-Voltage Twisted Cables
- 12.3.7.5 Submarine Distribution Twisted Cables
- 12.3.8 Subsegment Pricing and Adoption Trends
- 12.3.9 Leading Suppliers and Competition
- 12.3.10 Regional Demand and Opportunities
- 12.4 By Application - Market Size and Forecast, 2025-2035
- 12.4.1 Segment Definition and Scope
- 12.4.2 Historical Market Size, 2018-2025
- 12.4.3 Revenue Forecast, 2025-2035
- 12.4.4 Volume Forecast, 2025-2035
- 12.4.5 Base-Year Market Share, 2025
- 12.4.6 Segment CAGR and Growth Drivers
- 12.4.7 Subsegment Market Size and Forecast
- 12.4.7.1 Utility Distribution Networks
- 12.4.7.2 Industrial and Commercial Distribution
- 12.4.7.3 Renewable Energy Integration
- 12.4.7.4 Rural Electrification
- 12.4.7.5 EV Charging Infrastructure
- 12.4.8 Subsegment Pricing and Adoption Trends
- 12.4.9 Leading Suppliers and Competition
- 12.4.10 Regional Demand and Opportunities
- 12.5 By End User - Market Size and Forecast, 2025-2035
- 12.5.1 Segment Definition and Scope
- 12.5.2 Historical Market Size, 2018-2025
- 12.5.3 Revenue Forecast, 2025-2035
- 12.5.4 Volume Forecast, 2025-2035
- 12.5.5 Base-Year Market Share, 2025
- 12.5.6 Segment CAGR and Growth Drivers
- 12.5.7 Subsegment Market Size and Forecast
- 12.5.7.1 Distribution Utilities
- 12.5.7.2 Industrial and Commercial Asset Owners
- 12.5.7.3 Renewable Energy Developers
- 12.5.7.4 Charging Network Operators
- 12.5.8 Subsegment Pricing and Adoption Trends
- 12.5.9 Leading Suppliers and Competition
- 12.5.10 Regional Demand and Opportunities
- 12.6 By Technology - Market Size and Forecast, 2025-2035
- 12.6.1 Segment Definition and Scope
- 12.6.2 Historical Market Size, 2018-2025
- 12.6.3 Revenue Forecast, 2025-2035
- 12.6.4 Volume Forecast, 2025-2035
- 12.6.5 Base-Year Market Share, 2025
- 12.6.6 Segment CAGR and Growth Drivers
- 12.6.7 Subsegment Market Size and Forecast
- 12.6.7.1 XLPE Insulation
- 12.6.7.2 EPR Insulation
- 12.6.7.3 Thermoplastic Insulation
- 12.6.8 Subsegment Pricing and Adoption Trends
- 12.6.9 Leading Suppliers and Competition
- 12.6.10 Regional Demand and Opportunities
- 12.7 By Country - Market Size and Forecast, 2025-2035
- 12.7.1 Segment Definition and Scope
- 12.7.2 Historical Market Size, 2018-2025
- 12.7.3 Revenue Forecast, 2025-2035
- 12.7.4 Volume Forecast, 2025-2035
- 12.7.5 Base-Year Market Share, 2025
- 12.7.6 Segment CAGR and Growth Drivers
- 12.7.7 Subsegment Market Size and Forecast
- 12.7.7.1 China
- 12.7.7.2 India
- 12.7.7.3 Japan and South Korea
- 12.7.7.4 Southeast Asia, Oceania and Additional Asian Markets
- 12.7.8 Subsegment Pricing and Adoption Trends
- 12.7.9 Leading Suppliers and Competition
- 12.7.10 Regional Demand and Opportunities
- 12.8 Segment Growth Comparison
- 12.9 Segment Attractiveness and Priority Matrix
Chapter 13 APAC Power Distribution Twisted Cables End-Use and Application Market Outlook
- 13.1 End-Use Industry and Customer Demand Structure
- 13.2 Leading Applications and Customer Groups
- 13.3 End-Use Market Size, Share and Forecast
- 13.4 Major End-Use Industry Deep Dives
- 13.4.1 Customer Requirements and Use Cases
- 13.4.2 Demand and Replacement Cycles
- 13.4.3 Technical and Regulatory Considerations
- 13.4.4 Purchasing and Procurement Models
- 13.4.5 Leading Vendors and Distribution Channels
- 13.4.6 Forecast and Commercial Opportunities
- 13.5 Emerging Applications and Cross-Segment Demand
- 13.6 End-Use Industry Investment Priorities
Chapter 14 APAC Power Distribution Twisted Cables Geographic Market Outlook, 2025-2035
- 14.1 Regional Market Size and Country-Level Shares, 2025
- 14.2 Country Market Size Comparison, 2025
- 14.3 Country Market Forecasts, 2025-2035
- 14.4 Subregional Industrial and Demand Clusters
- 14.5 Intra-Regional Pricing and Cost Differences
- 14.6 Cross-Border Trade and Supply Networks
- 14.7 Regional Supply and Demand Balances
- 14.8 Country Opportunity Comparison and Prioritization
Note: Every listed country is covered on the structure shown under the first country.
Chapter 15 APAC Power Distribution Twisted Cables Technology, Innovation and Sustainability Outlook
- 15.1 Technology Landscape and Maturity
- 15.2 Product, Process and Service Innovation
- 15.3 AI, Automation and Digital Tools in the Industry
- 15.4 Technology Adoption and Performance Benchmarking
- 15.5 Innovation Pipeline and R&D Investment
- 15.6 Patent and Intellectual Property Trends
- 15.7 Energy Efficiency and Resource Management
- 15.8 Sustainability, Recycling and Circularity
- 15.9 Technology Roadmap, 2025-2035
- 15.10 Risks of Obsolescence and Technology Substitution
Chapter 16 APAC Power Distribution Twisted Cables Market Key Strategic Imperatives
- 16.1 Growth and Market Entry Priorities
- 16.2 High-Return Products and Segments
- 16.3 Pricing, Profitability and Cost Optimization
- 16.4 Technology Investment and Product Differentiation
- 16.5 Supply Chain Localization and Resilience
- 16.6 Distribution and Customer Acquisition
- 16.7 Partnership, Acquisition and Capacity Strategy
- 16.8 Regional Expansion Priorities
- 16.9 Short-, Medium- and Long-Term Actions
Chapter 17 Competition Outlook
- 17.1 Industry Competition Characteristics
- 17.2 Market Structure and Concentration
- 17.3 Market Share and Competitive Positioning, 2025
- 17.4 Company-Wise Revenue and Product Benchmarking
- 17.5 Production and Service Capacity Benchmarking
- 17.6 Technology, Pricing and Differentiation
- 17.7 Regional Footprint and Distribution Strength
- 17.8 Mergers, Acquisitions and Strategic Alliances
- 17.9 New Entrants and Competitive Threats
- 17.10 Porter's Five Forces and Industry Attractiveness
- 17.11 Competitive Outlook, 2025-2035
Chapter 18 Company Profiles
- 18.1 Company Coverage and Selection Criteria
- 18.2 Sumitomo Electric Industries
- 18.2.1 Business Description
- 18.2.2 Company Ownership and Geographic Presence
- 18.2.3 Product and Service Portfolio
- 18.2.4 Manufacturing and Operating Footprint
- 18.2.5 Production Capacity and Expansion Plans
- 18.2.6 Financial Performance and Investment
- 18.2.7 Market Share and Competitive Position
- 18.2.8 Technology and Innovation Capabilities
- 18.2.9 Strategic Alliances or Partnerships
- 18.2.10 Recent Developments
- 18.2.11 Growth Strategy and Outlook
- 18.3 Polycab India
- 18.4 LS Cable & System
- 18.5 KEI Industries
- 18.6 Far East Cable
- 18.7 Other Relevant Market Participants
Note: Every listed company is profiled on the structure shown under the first company. The company list is preliminary and may change based on research findings, market developments, data availability and client requirements.
Chapter 19 Disclaimer
- 19.1 Research and Forecast Disclaimer
- 19.2 Data Source and Estimation Limitations
Note: The depth of individual sections depends on data availability for this market. Volume, capacity, trade and other unit-based metrics are included where applicable.

