
Self-use economics now decide rooftop purchases
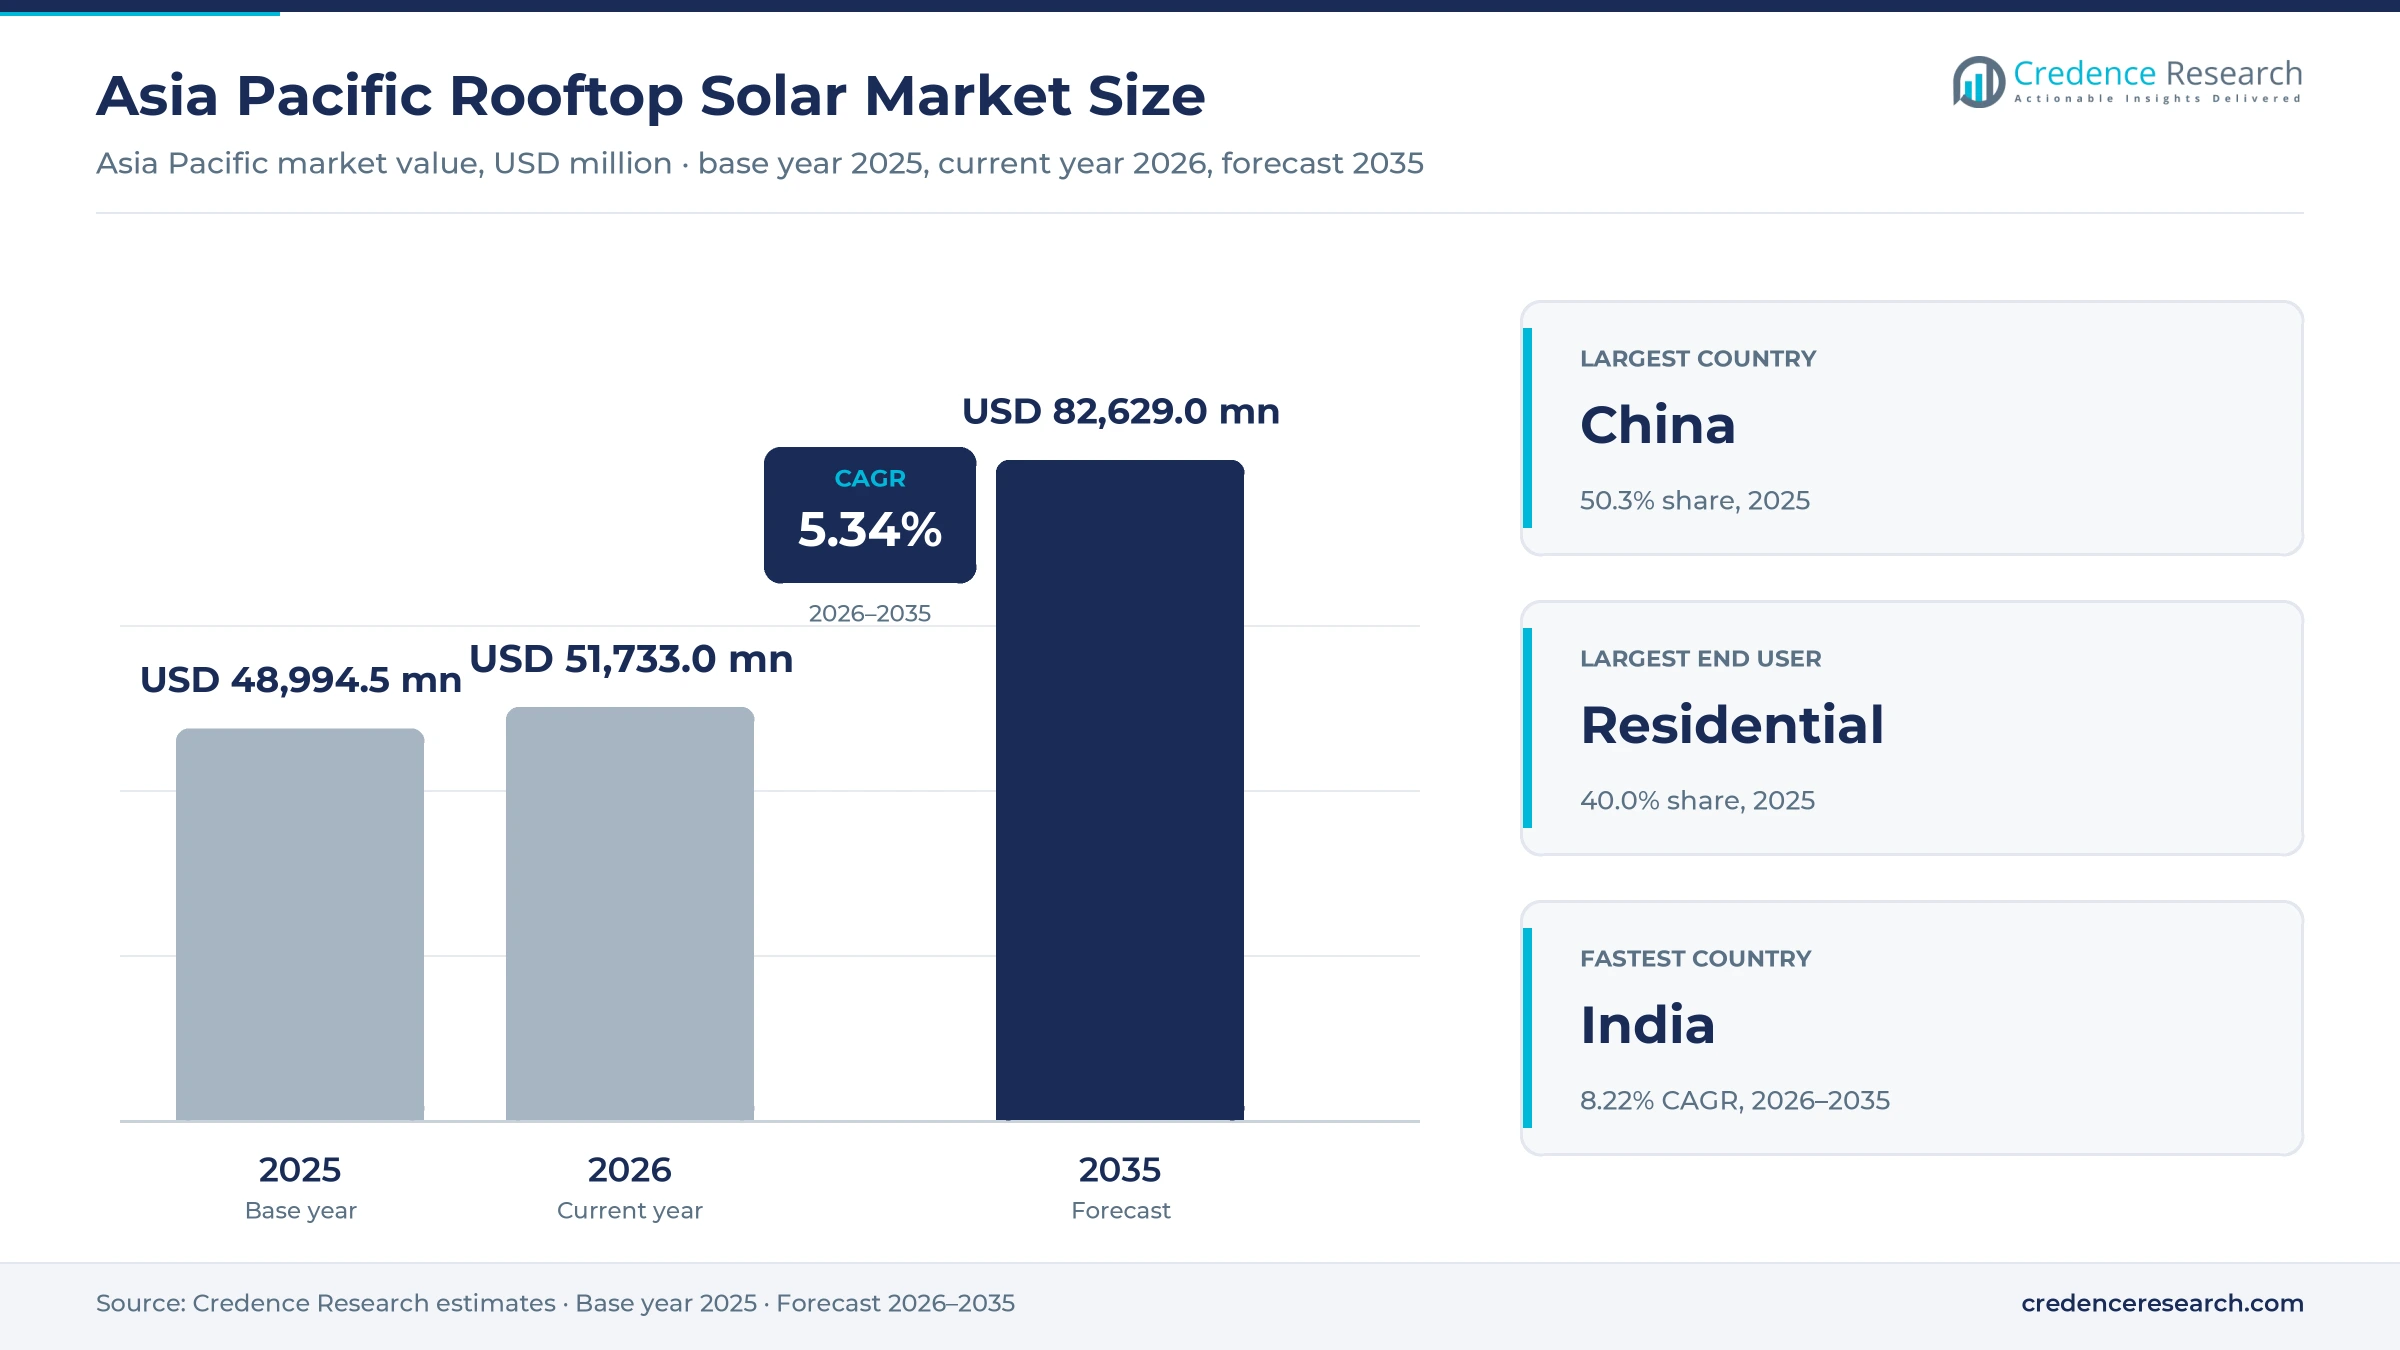
The Asia Pacific rooftop solar market was valued at USD 48.99 billion in 2025 and is projected to increase from USD 51.73 billion in 2026 to USD 82.63 billion by 2035, registering a CAGR of 5.34% during 2026–2035. Demand comes from household subsidy programs, factories and commercial buildings cutting grid purchases, and roof-owners in high-tariff countries pairing panels with batteries. China held the largest country share, 50.3% in 2025, on the scale of its distributed fleet, and India is the fastest-growing country at 8.22% a year because its national household program is adding about 16,000 systems a day. The commercial picture changed sharply when China moved new projects to market pricing on June 1, 2025, which pulled installations forward and left first-half 2026 distributed additions 62.6% lower. Value growth therefore rests less on China volume and more on self-consumption, storage and newer programs in India, Vietnam and Malaysia.
What does Asia Pacific rooftop solar spending include?
The market counts the installed value of photovoltaic systems mounted on homes, commercial buildings and industrial roofs, including modules, inverters, mounting, balance of system and installation. Buyers purchase through turnkey installers, separately procured packages or developers that own the system and sell its power to the site.
Ground-mounted utility plants, standalone batteries and electricity sold after commissioning are excluded from the count. The value chain runs from cell and module makers through distributors and installers to homeowners, building owners, leasing developers and utilities that connect and settle exported power.
Asia Pacific Rooftop Solar Market Insights
- Asia Pacific rooftop solar value moves from USD 48.99 billion in 2025 to USD 82.63 billion by 2035, a 5.34% CAGR across 2026–2035 led by self-consumption and household programs.
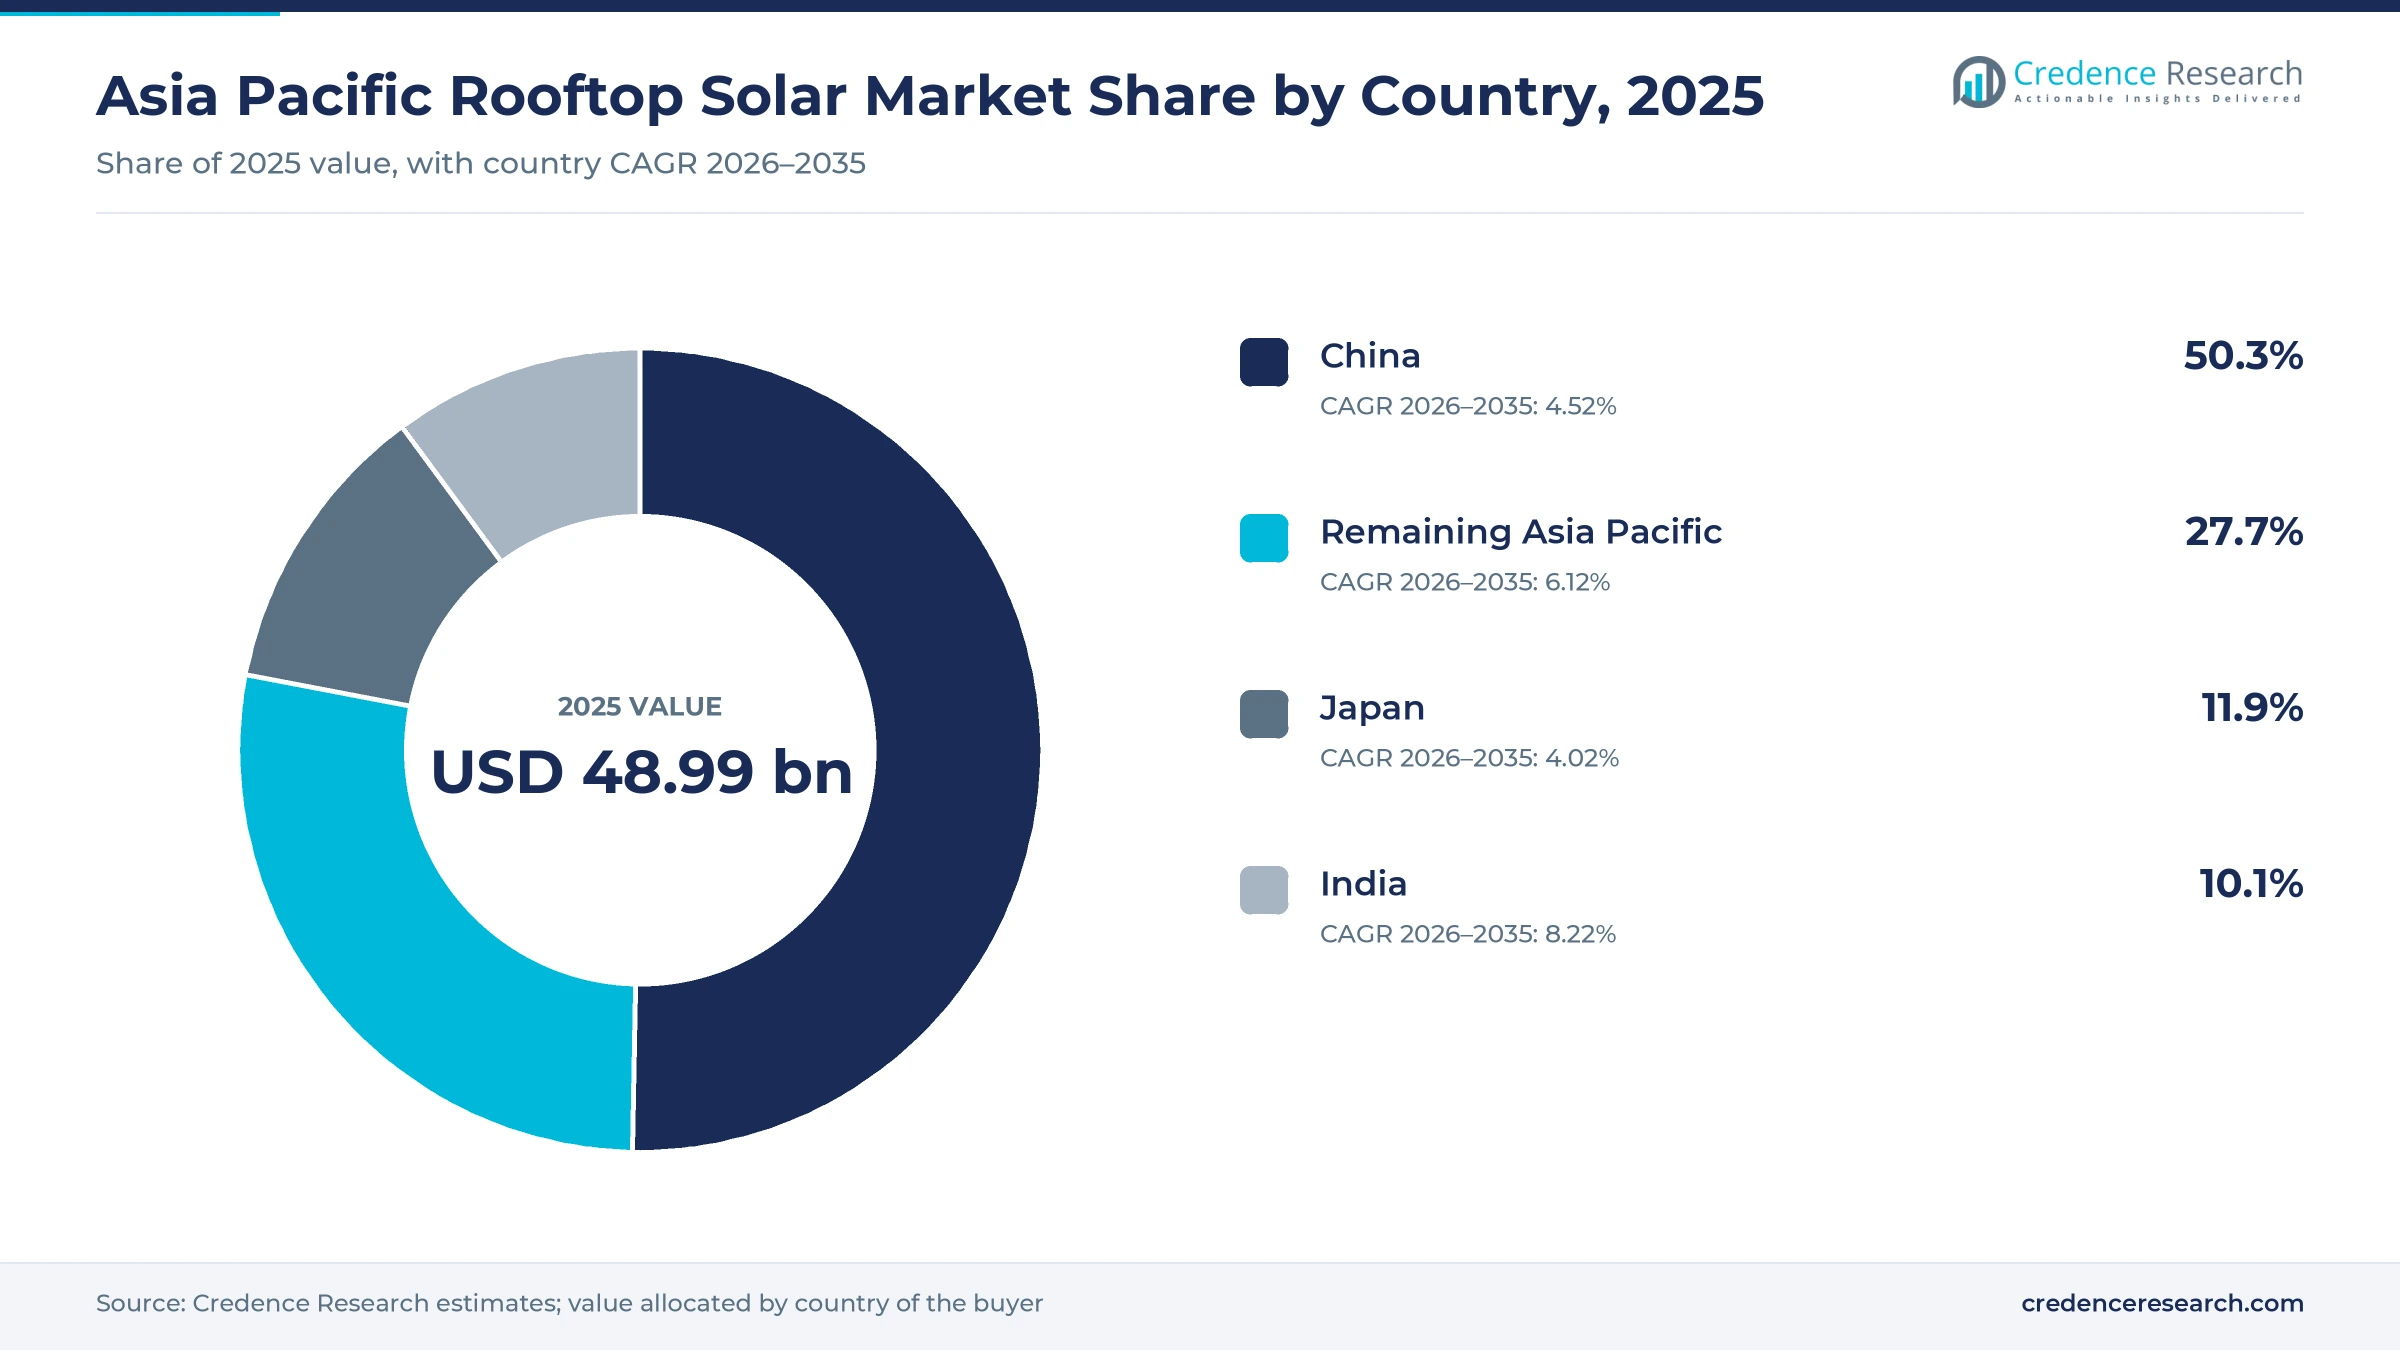
- China held 50.3% of regional value in 2025, while India grows fastest at 8.22% a year on its national household rooftop subsidy program.
- Residential buyers led with 40.0% of 2025 value, supported by subsidy channels in India and Chinese rural leasing that passed 2 million homes.
- China moved new distributed projects to market pricing on June 1, 2025, and its first-half 2026 distributed additions then fell 62.6% to 42.22 GW.
- Competition splits among Chinese leasing developers, Indian turnkey installers and module makers, with Tata Power Renewables adding over 1 GWp in nine months of fiscal 2026.
Households lead value while commercial roofs grow fastest
Why do households lead while commercial roofs grow fastest?
Based on end user, the market is categorized into residential, commercial and industrial buyers. Residential led with 40.0% of 2025 value because residential additions reached 21.83 GW of China's 42.22 GW distributed total in the first half of 2026, according to National Energy Administration data, while residential systems made up 84% of India's second-quarter 2026 rooftop additions, according to pv magazine. Commercial buyers grow fastest at 6.15% a year as Japan's Energy Conservation Act rules for schools, hospitals and local governments using over 1,500 kiloliters of crude oil equivalent a year require rooftop solar statements in plans from fiscal 2026, pushing operators to assess their roofs.
Which system sizes capture the most rooftop value?
Based on project scale, the market is categorized into below 10 kW, 10 kW to below 1 MW, and 1 MW and above. 10 kW to below 1 MW led with 52.0% of 2025 value because it holds most Chinese commercial roofs and also its rural homes, where CHINT Anneng's 2 million household systems generate about 59.30 billion kWh a year, or roughly 29,650 kWh per home, according to TaiyangNews in March 2026. Below 10 kW grows fastest at 6.23% a year as India's program, with 14.8 GW across 5 million homes, averages about 3 kW per household.
How do ownership models divide rooftop spending?
Based on ownership model, the market is categorized into customer-owned, third-party-owned and community-owned systems. Customer-owned led with 60.0% of 2025 value because capex purchases made up the majority of India's second-quarter 2026 rooftop additions, according to pv magazine, and direct subsidies of INR 28,024 crore flow to owners who buy their systems. Community-owned grows fastest at 8.29% a year from a small base, as Malaysia's Community Renewable Energy Aggregation Mechanism, introduced in March 2025, lets aggregators lease home roofs within a 2 MWp cap, according to Tenaga Nasional Berhad.
Which cell technologies dominate rooftop modules?
Based on technology, the market is categorized into passivated emitter and rear cell, tunnel oxide passivated contact and advanced cell architectures. Tunnel oxide passivated contact led with 70.0% of 2025 value because the ITRPV roadmap published in June 2026 reports that TOPCon kept market leadership in 2025 while p-type PERC continued to lose share. Advanced cell architectures grow fastest at 8.77% a year as the same roadmap projects back-contact concepts reaching up to 28% by 2036, and LONGi's EcoLife residential module, listed at 25% efficiency in April 2026, targets compact roofs.
| Segment Group | Leading Sub-segment | Share, 2025 | Fastest-growing Sub-segment | CAGR, 2026–2035 |
|---|---|---|---|---|
| By End User | Residential | 40.0% | Commercial | 6.15% |
| By Project Scale | 10 kW to below 1 MW | 52.0% | Below 10 kW | 6.23% |
| By Ownership Model | Customer-owned | 60.0% | Community-owned | 8.29% |
| By Technology | Tunnel oxide passivated contact | 70.0% | Advanced cell architectures | 8.77% |
Request a Free Sample
Fill in your details and we'll send you a free sample report.
- Sample data tables & charts
- Research methodology
Subsidies, self-use rules and bills drive rooftop additions
Household incentives and installer distribution
Household subsidies paired with installer networks turn rooftop interest into commissioned systems faster than bill savings alone would. India's PM Surya Ghar program passed 5 million households and 14.8 GW by August 2026, according to ministry figures reported by pv magazine India, compared with 794,000 installations during the preceding decade. Daily installations climbed from 5,038 in October 2025 to nearly 16,328 in July 2026, which shows how quickly a funded channel scales. Tata Power Renewables added more than 1 GWp in the nine months to December 2025, according to its Jan. 5, 2026, release. Waaree Energies also began selling boxed 3 kW to 10 kW kits in April 2025, so smaller installers can quote without sourcing separate components.
Distributed generation integrated with local demand
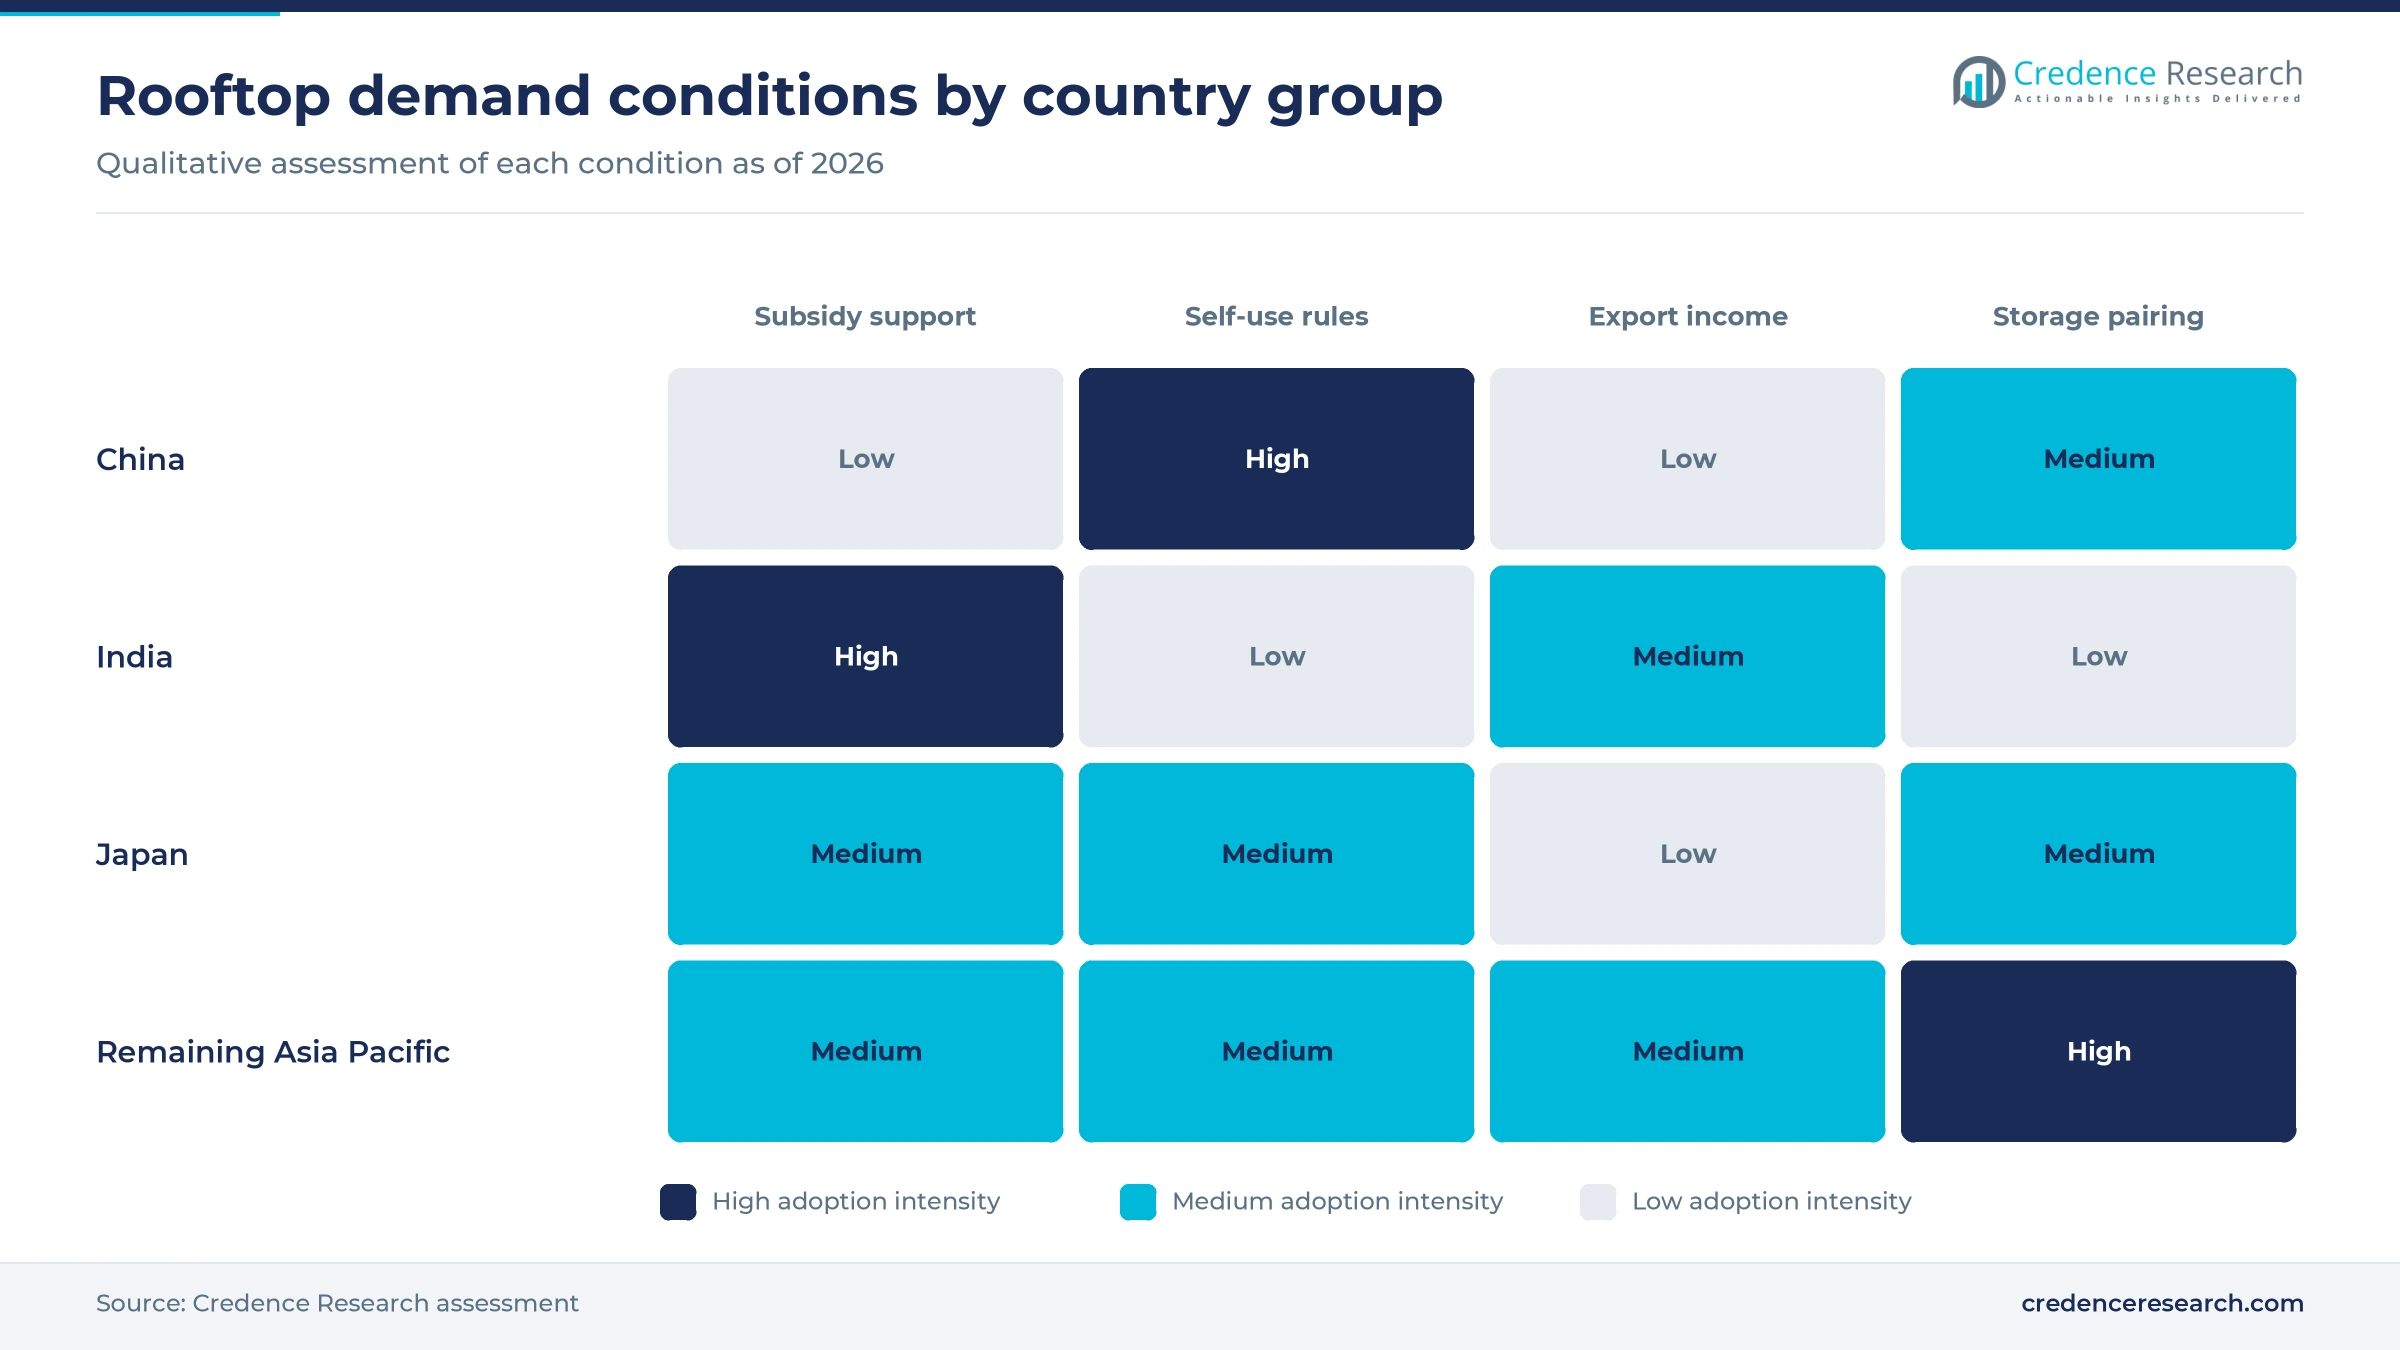
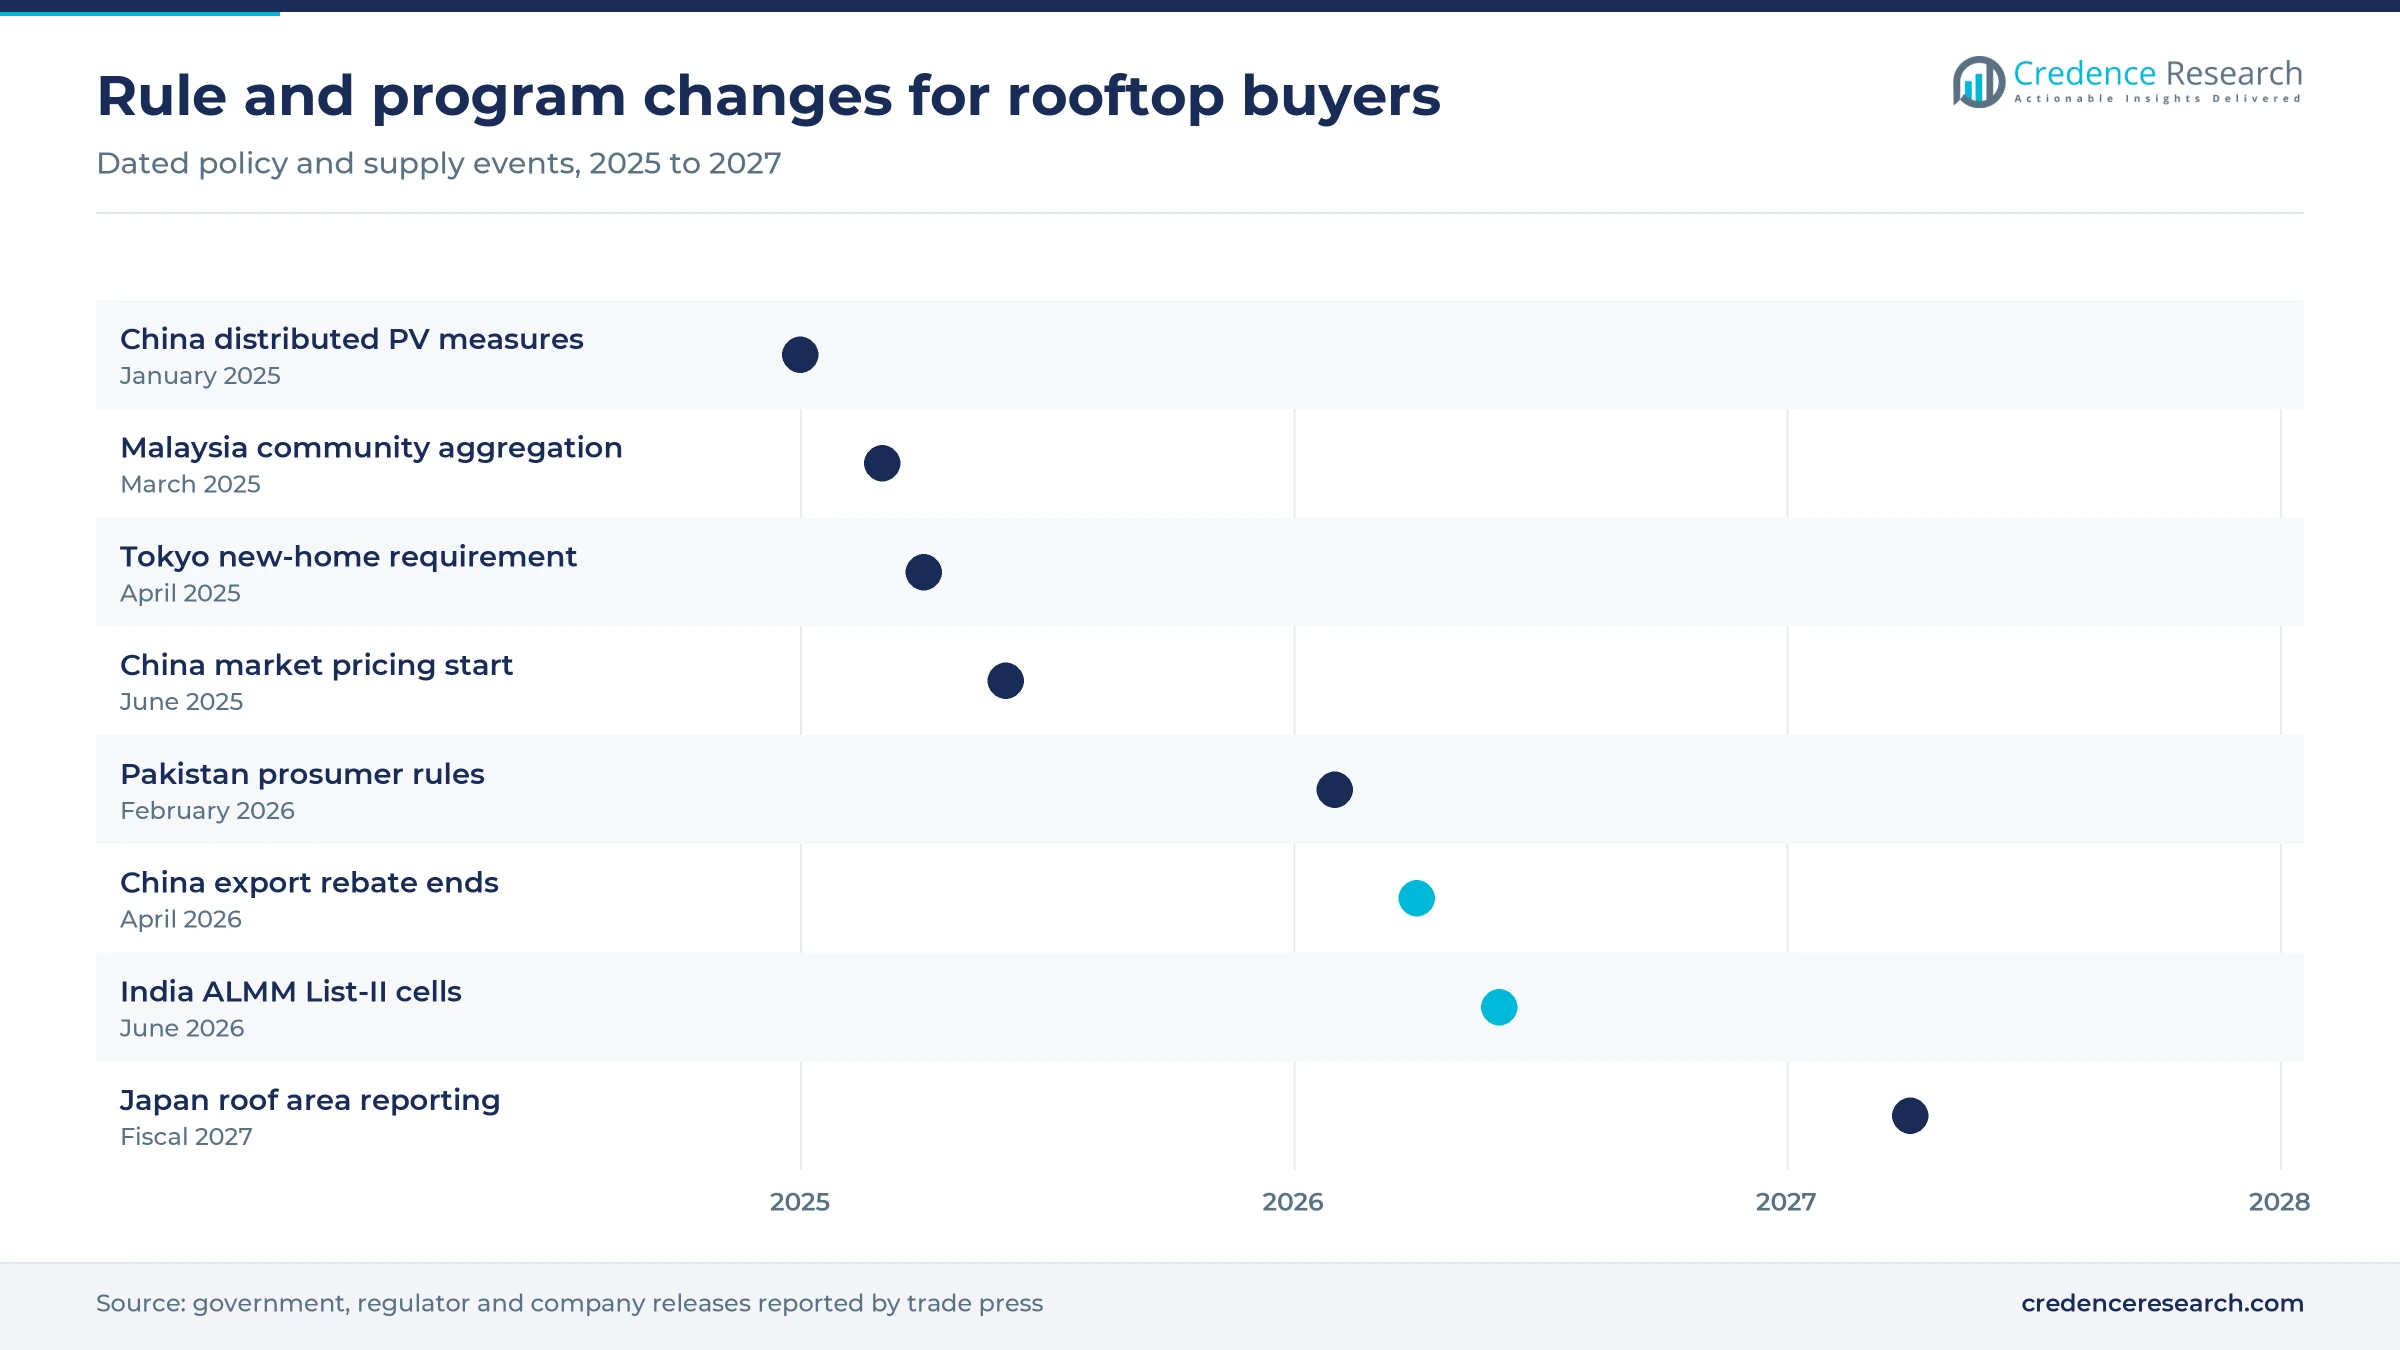
Rules across the region now reward rooftop systems that serve the load beneath them. China's National Energy Administration issued management measures on Jan. 23, 2025, that bar full feed-in for commercial and industrial projects and cap general projects at 6 MW and larger ones at 50 MW. As a result, distributed generation in China is increasingly sized against factory demand. China still added 87.18 GW of commercial and industrial capacity in the first half of 2025, according to PV Tech. Vietnam moved the same way with Decree 243 of 2026, which raised the surplus sales cap from 20% to 50% of generation, according to VietNamNet.
Established rooftop ecosystems and customer familiarity
Mature rooftop countries sell repeat and upgrade projects to customers who already understand the product, which keeps volume steady when new-build subsidies fade. Australia reached 28.3 GW across more than 4.3 million households by the end of 2025, according to the Clean Energy Council, and rooftop systems supplied 14.2% of generation in the second half of that year. The Clean Energy Regulator then reported a record 1 GW installed in the second quarter of 2026. Japan offers a similar base, with 1.6 GW of residential additions in 2025 reported by pv magazine. Tokyo's requirement for systems on newly built houses, in force since April 2025, reaches builders rather than individual buyers.
Grid tariffs and cheaper panels in import markets
Countries with expensive grid power and open panel imports show how bills alone can drive adoption without a national subsidy. Pakistan's net-metered capacity rose from 190 MW in fiscal 2020 to about 6,978 MW by fiscal 2026, according to a Power Division presentation reported by ProPakistani in July 2026. The same presentation showed tariffs up nearly 140% and imported panel prices down about 60% between fiscal 2021 and 2025. The International Energy Agency separately counted about 10 GW of Pakistani additions in 2025, almost entirely distributed systems. This demand supports the 27.7% held by Remaining Asia Pacific, where buyers respond quickly to import prices.
Storage pairing and net billing reshape rooftop returns
Shift toward solar-plus-battery rooftop purchases
Rooftop buyers increasingly evaluate panels and storage together, because battery value now offsets weaker export payments. Australia's Clean Energy Regulator reported more than 500,000 battery applications under the Cheaper Home Batteries program in August 2026, and households brought forward combined purchases ahead of the May 1 program changes. The regulator also expects small-scale additions of 3.0 GW to 3.7 GW in 2026, up from about 2.8 GW in 2025, according to pv magazine. In China, CHINT Anneng launched a virtual power plant aggregation trading platform for its fleet, according to TaiyangNews in March 2026. As a result, hybrid inverters are becoming a standard part of the rooftop quote.
Rise of net billing and market-priced exports
Export payments are moving from retail-rate credit toward market-linked prices, and that change favors systems sized for self-use. Pakistan's NEPRA notified prosumer rules in February 2026 that pay new users the national average energy purchase price under five-year agreements, according to Arab News. China took a comparable step on June 1, 2025, when new projects entered market trading under the February 2025 pricing notice from its planning and energy agencies. The International Energy Agency linked that switch to a first-half rush and a second-half slowdown in 2025. Vietnam stands apart by widening export room, since Decree 243 lets projects exceed 50% until 2030 where regional grids can absorb the power.
Opening in Japanese corporate and institutional roofs
Japan offers an opening for suppliers that can serve large building portfolios, since policy is steering new capacity off the ground and onto roofs. Rules reported by pv magazine in May 2026 require users consuming over 1,500 kiloliters of crude oil equivalent a year to report eligible roof area from fiscal 2027. The ministry's pricing committee has also proposed ending feed-in support for new ground-mounted systems of 10 kW or more from fiscal 2027, according to Shulman Advisory. Commercial and industrial additions already reached 2 GW in 2025, and the government's February 2025 energy plan sets solar at 23% to 29% of generation by 2040. Consequently, disclosure data should give installers a ready list of candidate sites.
Opening in aggregated and low-income household models
Aggregation offers an opening to reach homes that cannot fund a system or cannot use all of its output. India's Utility Led Aggregation model has completed 160,000 installations for low-income and subsidized housing categories across four states and has been sanctioned for 12 states, according to the Ministry of New and Renewable Energy. Malaysia's mechanism takes a different route, with Tenaga Nasional Berhad describing a City of Elmina pilot that offers 6 kW systems per home without upfront ownership cost. Power from those roofs goes to nearby commercial users within a 5 km radius. These models support the 8.29% annual growth of Community-owned systems, although the Malaysian cap keeps each aggregated scheme small.
Policy resets and module costs squeeze rooftop payback
China's post-rush installation slump
China's pricing reform pulled demand forward and left a sharp installation gap afterward. Distributed additions fell 62.6% to 42.22 GW in the first half of 2026, according to National Energy Administration data reported by TaiyangNews. The decline hits installers, module distributors and leasing developers that built capacity for the 2025 peak. Consequently, weaker firms face thinner order books while provincial price discovery remains unsettled. CHINT Anneng's virtual power plant platform shows one response, since aggregation income does not depend on new connections.
Lower export income and connection limits
Weaker export income lengthens payback for owners who sized systems around grid sales. Pakistani officials estimated that net metering cost the power sector Rs. 101 billion in fiscal 2024, according to ProPakistani, which led to the 2026 prosumer rules. Utilities there may also restrict connections where injections exceed 80% of a transformer's rating, according to Arab News. Households with low daytime use are hit hardest, so systems sized for daytime self-use, or paired with batteries, offer the clearest way to protect returns.
Higher module costs after China's rebate exit
Module price recovery removes some of the cost relief that made rooftop quotes attractive across import markets. China abolished its 9% export tax rebate on April 1, 2026, according to PV Tech, and Trina Solar's domestic distributed guidance rose by RMB 0.06 per watt in January 2026. Installers in import markets feel this directly, since export quotations reached US$0.09 to US$0.13 per watt that month. Shorter quote validity is the practical response for smaller installers, who hold little inventory.
Domestic content rules and installer quality
Compliance rules add cost and paperwork at the moment volumes are peaking. India applied ALMM List-II cell requirements from June 1, 2026, which increased pressure on domestic cell supply and module prices, according to pv magazine, although eligible projects received a window to Dec. 31, 2026. In Australia, the Clean Energy Regulator warned in March 2026 that unsafe installers could be removed from its scheme. Smaller installers carry most of this burden, so larger firms may gain share.
China holds half of value while India grows fastest
| Country | Value, 2025 (USD billion) | Share, 2025 | CAGR, 2026–2035 |
|---|---|---|---|
| China | 24.64 | 50.3% | 4.52% |
| Remaining Asia Pacific | 13.57 | 27.7% | 6.12% |
| Japan | 5.83 | 11.9% | 4.02% |
| India | 4.95 | 10.1% | 8.22% |
China holds half of regional rooftop value
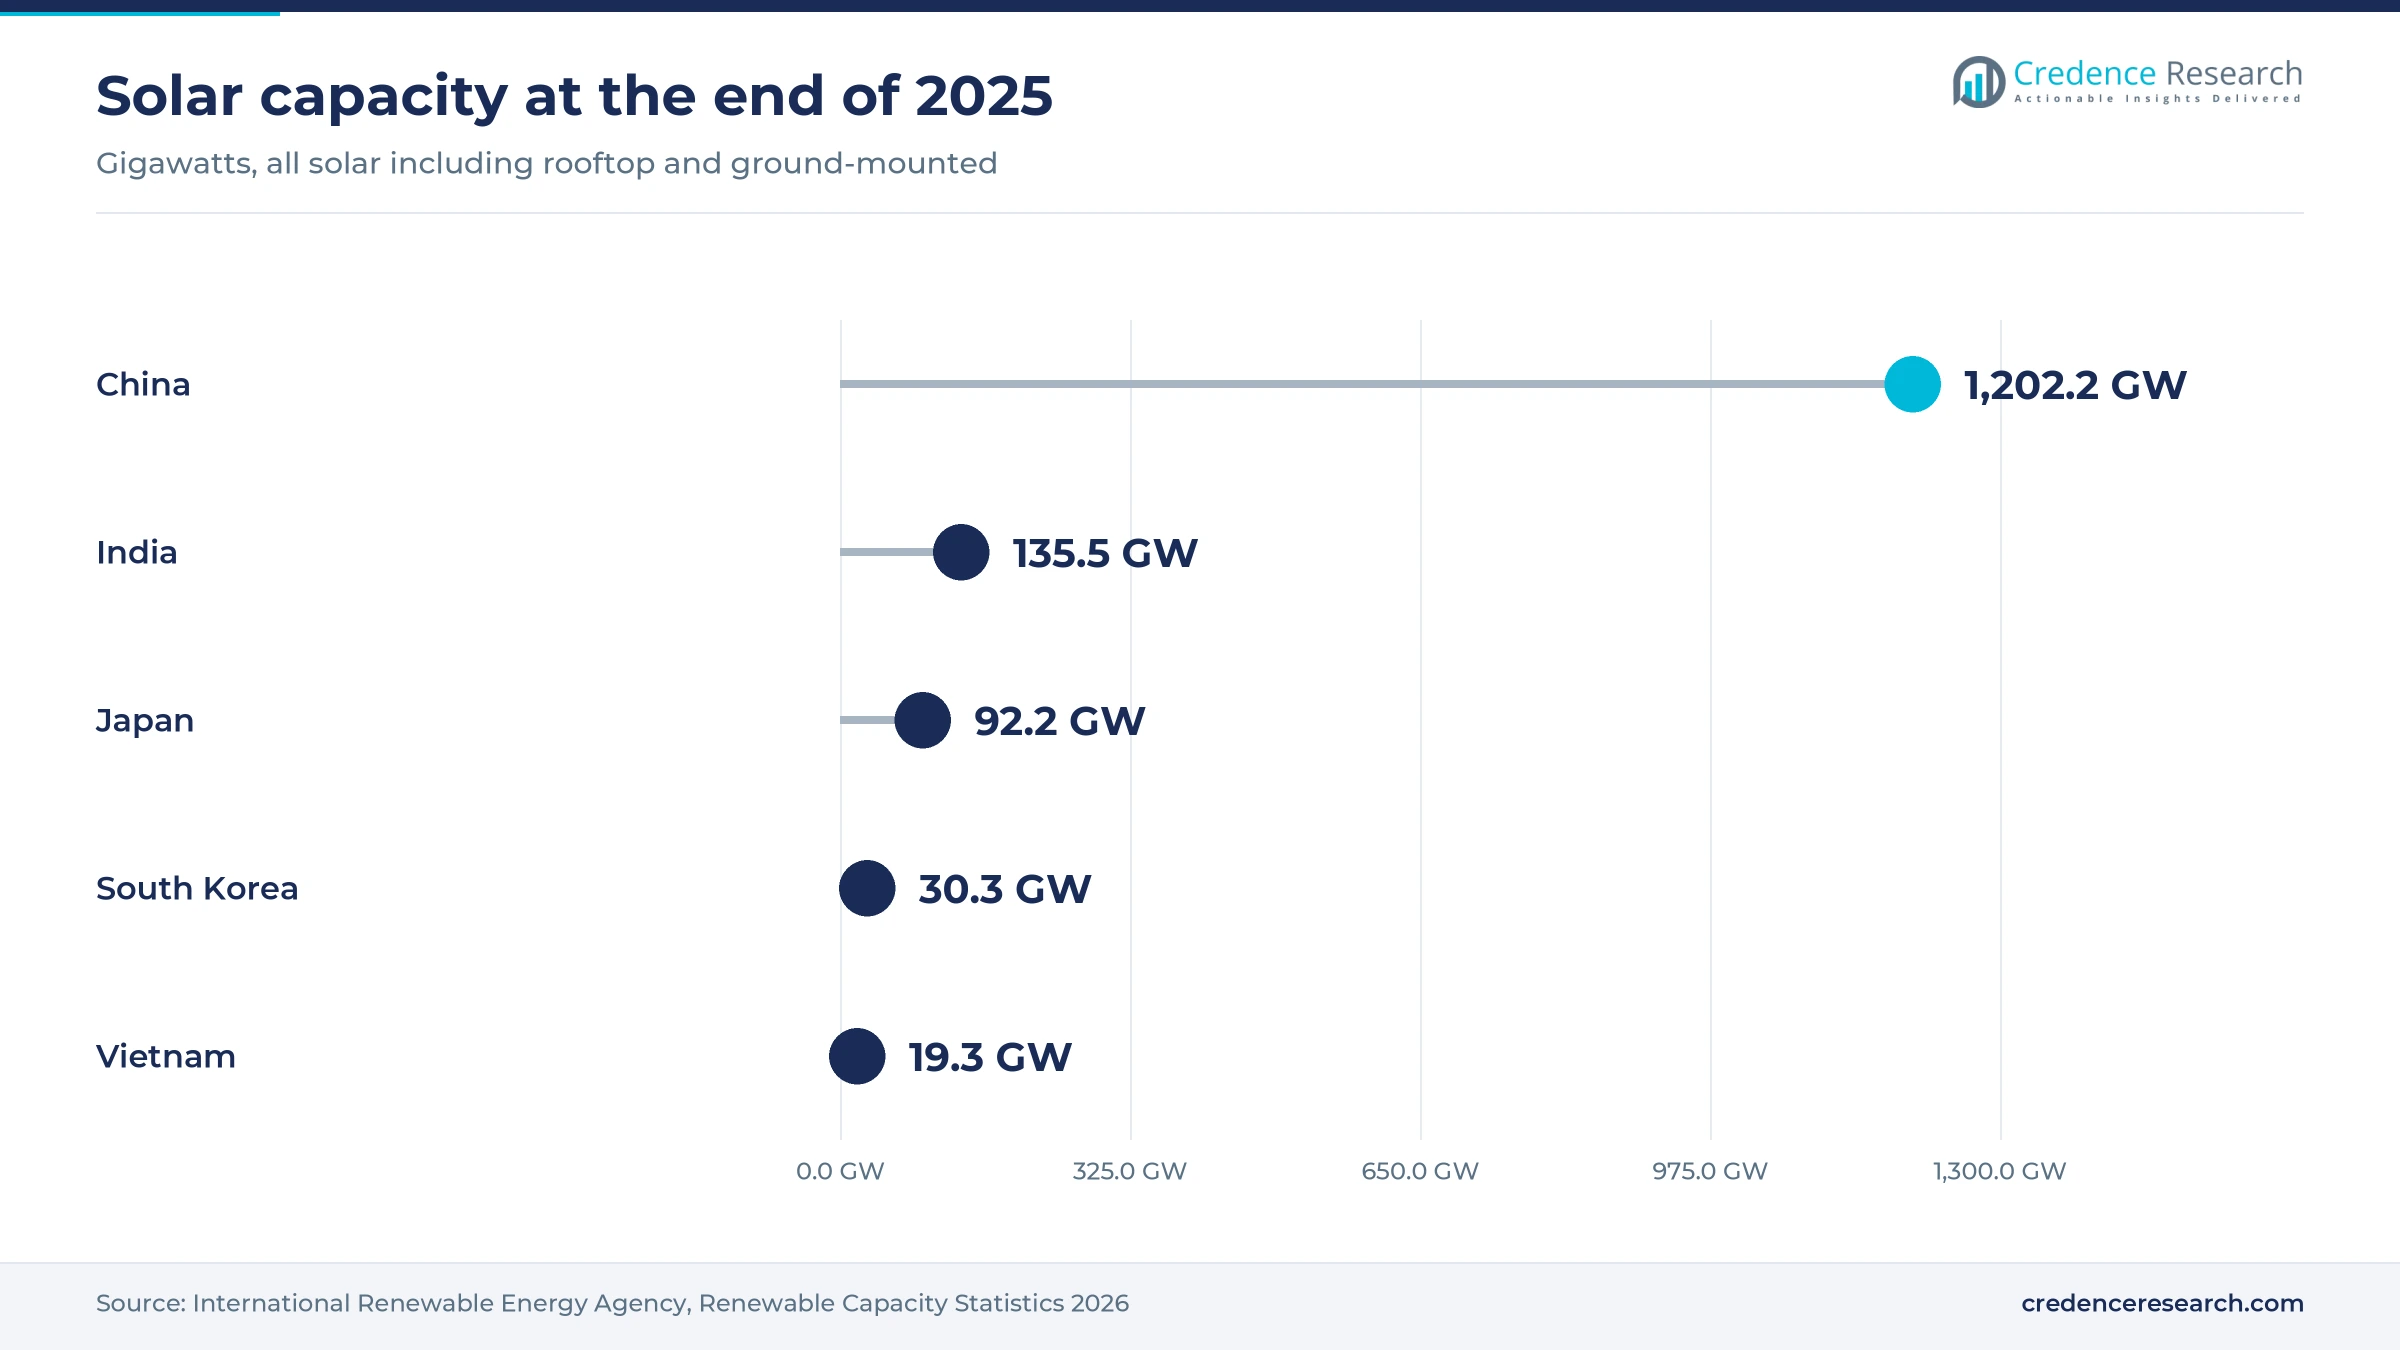
China held 50.3% of 2025 value and grows at 4.52% a year, the second-slowest pace among the four groups. National Energy Administration data show 153 GW of distributed additions in 2025 against 164 GW of centralized capacity, and the International Renewable Energy Agency counted 371.2 GW of solar additions across Asia that year. However, market pricing since June 2025 has cut volumes sharply, so value depends on factory self-consumption and leasing in rural provinces.
Remaining Asia Pacific spreads across varied programs
Remaining Asia Pacific held 27.7% of 2025 value and grows at 6.12% a year. The group's photovoltaic capacity additions span mature Australia, with 2.6 GW added in 2025 according to the Clean Energy Council, and Korea, which added 3.7 GW of solar according to the International Renewable Energy Agency. It also includes Pakistan's import-led boom and policy-driven Vietnam and Malaysia. Because rules differ by country, suppliers usually enter through local distributors, as Trina Solar did with its 600 MW Southeast Asia and Gulf agreement with Ecohope Solar in June 2026.
Japan shifts new capacity from ground sites to roofs
Japan held 11.9% of 2025 value and grows at 4.02% a year, the slowest rate among the four groups. Its value rests on a settled residential and corporate base rather than volume growth, because additions stayed near 6 GW a year. Japan added 1.6 GW of residential and 2 GW of commercial and industrial capacity in 2025, according to pv magazine. Tokyo's new-home requirement and a similar Kawasaki measure support the residential base, while reporting rules from fiscal 2027 should widen corporate demand.
India grows fastest on subsidized household demand
India held 10.1% of 2025 value and grows at 8.22% a year, the fastest pace in the region. It installed 6.6 GW of rooftop capacity in the first half of 2026, up 136% from 2.8 GW a year earlier, according to pv magazine. Program outlay of INR 75,021 crore funds much of this household demand. Gujarat, Maharashtra and Uttar Pradesh rank among Tata Power Renewables' largest states, which suggests how concentrated the installer channel remains.
Rule changes from 2025 to 2026 redrew rooftop economics
| Development | Status and market relevance |
|---|---|
| In February 2026, Pakistan's NEPRA notified prosumer rules that replace net metering with net billing for new rooftop users under five-year agreements. | In force; existing users stay on their contracts until expiry |
| In April 2026, China abolished its 9% export tax rebate on solar products, which raised export quotations for modules bound for regional rooftop buyers. | In force; export pricing resetting |
| In June 2026, India applied ALMM List-II cell requirements, with transition windows for eligible net-metering projects to December 2026. | In transition; domestic cell supply under watch |
| In June 2026, Trina Solar and Ecohope Solar announced a 600 MW agreement covering Vertex modules for residential and commercial projects, with Thailand as a key market. | Three-year distribution agreement |
| In August 2026, India's PM Surya Ghar program passed 5 million households after a record 506,000 additions in July. | Ongoing; program target is 10 million households |
TOPCon leads as back-contact modules target small roofs
- TOPCon modules remain the default rooftop product, and the ITRPV roadmap projects about 50% market share for the technology as late as 2036.
- Back-contact modules suit compact roofs, and LONGi lists its 54-cell EcoLife residential module at up to 510 W and 25% efficiency.
- Damp-heat module designs address tropical roofs, and PV Tech reported that LONGi's Hi-MO X6 line, first deployed in Japan in 2023, targets hot and humid sites.
- Virtual power plant platforms let aggregators trade flexible output from many roofs, as CHINT Anneng has begun doing with its Chinese household fleet.
Need a Custom Version of This Report?
Tailor the scope, geography, or segments to your exact requirements.
- Custom geography or segment scope
- Direct access to our analyst team
Developers, module makers and installers compete on reach
Competition divides into three groups of companies that overlap in practice. Developers such as CHINT Anneng finance and operate household systems at scale, and its Chinese fleet has passed 2 million installations. Turnkey brands and EPC contractors such as Tata Power Renewables win on customer reach, with more than 300,000 cumulative installations and 4 GWp installed by January 2026. Manufacturers including LONGi Green Energy, Trina Solar and Waaree Energies compete on watts per roof, compact formats and distributor agreements, and module suppliers increasingly bundle balance-of-system parts. Waaree's boxed kits and Trina's Vertex S+ G3 for residential and commercial roofs illustrate this approach. Local content rules favor Indian producers at home, while Chinese makers depend on distributors in Southeast Asia. Price alone therefore decides fewer contracts than before, since financing, subsidy paperwork and after-sales coverage often settle the choice of installer.
Companies active in Asia Pacific rooftop solar
| Company | Type | Role in the market |
|---|---|---|
| CHINT Anneng | Developer and operator | Chinese household rooftop developer with over 2 million commissioned systems and a virtual power plant platform |
| Tata Power Solar | Turnkey installer | Indian rooftop brand with over 4 GWp cumulative capacity through its Tata Power Renewables business |
| Waaree Energies | Module maker and kit seller | Sells 3 kW to 10 kW residential kits for buyers using India's subsidy program |
| LONGi Green Energy | Module maker | Back-contact modules for distributed roofs, including Hi-MO X6 first deployed in Japan |
| Trina Solar | Module maker | Vertex S+ G3 rooftop modules and a 600 MW distribution agreement covering Southeast Asia |
Rooftop growth is moving from China toward India
Credence Research's view is that this market should be read as two cycles rather than one. China sets the regional total but is digesting a policy-driven peak, with distributed volume falling in 2026 before self-use and leasing stabilize. India, by contrast, is in an early subsidy-funded climb at very small system sizes, which adds customers faster than value. Suppliers should therefore plan on lower Chinese volume, thinner per-home revenue in India and higher attachment of batteries in Australia and Pakistan. The most assumption-heavy estimate in this report is China's through-cycle value.
How the rooftop market estimates were built
The report uses 2025 as the base year and 2026 to 2035 as the forecast period. Market values come from the Credence Research model, while country, end user, project scale, ownership and technology splits are Credence Research estimates informed by public data. Sources include national energy agencies, the International Renewable Energy Agency, the International Energy Agency, utility and regulator publications, company releases and trade press. No interviews or surveys were conducted for this edition of the report.
Self-use and storage will shape rooftop demand to 2035
Through 2035, the market should reach USD 82.63 billion as buyers treat rooftop systems as bill management rather than export income. China will remain the largest country, although its growth will depend on self-use and storage rather than rushed connections. India should expand its share as its household program approaches 10 million homes and commercial users follow. Japan's corporate roof data and Southeast Asian aggregation rules should add further projects. Consequently, suppliers that combine modules, batteries, financing and local installation should hold the strongest position as subsidies gradually narrow.
Frequently Asked Questions
How big is the Asia Pacific rooftop solar market?
Which country leads Asia Pacific rooftop solar?
Which country grows fastest in this market?
Which end user holds the largest share?
Why did China's distributed additions fall in 2026?
Which cell technology dominates rooftop modules?
What are the main challenges for rooftop buyers?
Which companies are active in this market?
Table of Content
Chapter 1 Market Segmentation
- 1.1 Segmentation Framework
- 1.1.1 Product and Service Classification
- 1.1.2 Application and End-Use Classification
- 1.1.3 Technology and Solution Classification
- 1.1.4 Customer and Distribution Channel Classification
- 1.1.5 Geographic Segmentation
- 1.1.6 Market Segment Definitions and Boundaries
- 1.2 By End User
- 1.2.1 Residential
- 1.2.2 Commercial
- 1.2.3 Industrial
- 1.3 By Project Scale
- 1.3.1 Below 10 kW
- 1.3.2 10 kW to below 1 MW
- 1.3.3 1 MW and above
- 1.4 By Ownership Model
- 1.4.1 Customer-owned
- 1.4.2 Third-party-owned
- 1.4.3 Community-owned
- 1.5 By Technology
- 1.5.1 Passivated emitter and rear cell
- 1.5.2 Tunnel oxide passivated contact
- 1.5.3 Advanced cell architectures
- 1.6 By Country
- 1.6.1 China
- 1.6.2 India
- 1.6.3 Japan
- 1.6.4 Remaining Asia Pacific
Chapter 2 Introduction
- 2.1 Report Objectives and Scope
- 2.2 Product Definition and Industry Terminology
- 2.3 Market Inclusions and Exclusions
- 2.4 Research Process
- 2.4.1 Primary Research and Expert Interviews
- 2.4.2 Secondary Research and Source Review
- 2.4.3 Top-Down and Bottom-Up Estimation
- 2.4.4 Data Triangulation and Verification
- 2.5 Market Size Measurement Basis
- 2.5.1 2025: USD 48.99 billion → 2035: USD 82.63 billion
- 2.6 Historical and Forecast Reference Periods
- 2.6.1 Historical Period: 2018-2025
- 2.6.2 Base Year: 2025
- 2.6.3 Forecast Period: 2025-2035
- 2.7 Research Assumptions and Limitations
Chapter 3 Executive Summary
- 3.1 Market Snapshot and Key Findings
- 3.2 Base-Year Market Size, 2025
- 3.3 Forecast Market Size, 2035
- 3.4 Revenue and Volume Growth Outlook
- 3.5 Key Demand and Supply Indicators
- 3.6 Leading Market Segments
- 3.7 Fastest-Growing Market Opportunities
- 3.8 Regional Performance Highlights
- 3.9 Technology and Industry Transformation
- 3.10 Competitive Landscape Summary
- 3.11 Analyst View and Strategic Implications
Chapter 4 Asia Pacific Rooftop Solar Market Trends and Developments
- 4.1 Historical Industry Development, 2018-2025
- 4.2 Recent Market Trends and Developments
- 4.3 Demand and Customer Behavior Trends
- 4.4 Technology and Product Innovation
- 4.5 Artificial Intelligence, Automation and Digitalization
- 4.6 Local Manufacturing and Supply Chain Realignment
- 4.7 Industry Partnerships, Mergers and Acquisitions
- 4.8 Sustainability and Circular Economy Developments
- 4.9 Government and Private Sector Investment Trends
- 4.10 Emerging Business Models and Commercialization
- 4.11 Industry Developments and Announcements
Chapter 5 Asia Pacific Rooftop Solar Market Production, Supply and Demand Analysis
- 5.1 Demand Trend and Consumption Analysis, 2018-2025
- 5.2 Demand Forecast, 2025-2035
- 5.3 Production and Output Trend, 2018-2025
- 5.4 Production and Output Forecast, 2025-2035
- 5.5 Installed Capacity and Capacity Utilization
- 5.6 Company-Wise Production Plants and Statistics
- 5.6.1 Installed Production Capacity
- 5.6.2 Actual Production
- 5.6.3 Planned Capacity and Expansion Targets
- 5.7 Supply Chain Structure and Procurement Trends
- 5.8 Supply-Demand Gap and Bottlenecks
- 5.9 Import Dependence and Sourcing Structure
- 5.10 Contract Manufacturing and Outsourcing
- 5.11 Regional Supply and Demand Concentration
Chapter 6 Asia Pacific Rooftop Solar Market Pricing Analysis
- 6.1 Pricing Structure and Measurement
- 6.2 Historical Pricing Trends, 2018-2025
- 6.3 Pricing Outlook, 2025-2035
- 6.4 Average Selling Price and Unit Economics
- 6.5 Pricing by Product and Market Segment
- 6.6 Geographic Pricing Differences
- 6.7 Key Input, Energy, Labor and Logistics Costs
- 6.8 Contract Pricing and Purchasing Models
- 6.9 Pricing Sensitivity and Competitive Positioning
- 6.10 Price, Margin and Profitability Implications
Chapter 7 Asia Pacific Rooftop Solar Market Dynamics
- 7.1 Market Growth Drivers
- 7.1.1 Demand-Side Drivers
- 7.1.2 Technology and Innovation Drivers
- 7.1.3 Infrastructure and Investment Drivers
- 7.1.4 Regulatory and Policy Drivers
- 7.2 Market Restraints
- 7.2.1 Cost and Affordability Constraints
- 7.2.2 Technology and Adoption Barriers
- 7.2.3 Supply Chain and Operational Constraints
- 7.3 Market Challenges
- 7.3.1 Competitive Pressure and Margin Erosion
- 7.3.2 Skills, Infrastructure and Implementation Gaps
- 7.4 Emerging Market Opportunities
- 7.5 Market Dynamics Impact and Time-Horizon Assessment
Chapter 8 Asia Pacific Rooftop Solar Value Chain Analysis
- 8.1 Industry Value Chain Overview
- 8.2 Upstream Suppliers and Critical Inputs
- 8.3 Technology and Component Providers
- 8.4 Manufacturing or Service Delivery
- 8.5 Distribution, Channel Partners and Integrators
- 8.6 Downstream Applications and End Users
- 8.7 Value Addition and Profit Pools
- 8.8 Vertical Integration and Outsourcing
- 8.9 Supplier Concentration and Risk
- 8.10 Supply Chain Localization and Resilience
Chapter 9 Asia Pacific Rooftop Solar Market Regulations and Policies
- 9.1 Relevant Laws, Standards and Compliance Frameworks
- 9.2 Product, Service, Safety and Quality Requirements
- 9.3 Government Policies, Incentives and Subsidies
- 9.4 Imports, Exports and Trade Barriers
- 9.5 Public Procurement and Local Content Requirements
- 9.6 Environmental and Sustainability Compliance
- 9.7 Upcoming Policy Changes and Market Implications
Chapter 10 Asia Pacific Rooftop Solar Market Hotspots and Opportunities
- 10.1 Market Opportunity Mapping and Growth Hotspots
- 10.2 High-Growth Applications and Customer Groups
- 10.3 Underserved Markets and White-Space Opportunities
- 10.4 Emerging Technology and Product Opportunities
- 10.5 New Capacity and Investment Hotspots
- 10.6 Market Entry and Expansion Opportunities
- 10.7 Distribution and Partnership Opportunities
- 10.8 Near-Term and Long-Term Commercial Potential
- 10.9 Opportunity Attractiveness and Execution Risks
Chapter 11 Asia Pacific Rooftop Solar Market Outlook, 2025-2035
- 11.1 Market Size and Analysis
- 11.1.1 Revenue (Market Measurement: 2025: USD 48.99 billion → 2035: USD 82.63 billion)
- 11.1.2 Market Volume and Quantity Sold
- 11.1.3 Historical Market Size, 2018-2025
- 11.1.4 Base-Year Market Size, 2025
- 11.2 Market Forecast, 2025-2035
- 11.2.1 Revenue Forecast to 2035
- 11.2.2 Volume Forecast to 2035
- 11.2.3 CAGR and Year-on-Year Growth
- 11.2.4 Incremental Revenue Opportunity
- 11.3 Forecast Assumptions and Scenario Analysis
- 11.3.1 Base-Case Forecast
- 11.3.2 Optimistic and Conservative Scenarios
- 11.3.3 Technology, Pricing and Policy Sensitivities
- 11.4 Market Attractiveness and Growth Outlook
Chapter 12 Asia Pacific Rooftop Solar Market Segmentation and Outlook
- 12.1 Segmentation Summary and Market Shares, 2025
- 12.2 Largest and Fastest-Growing Segments
- 12.3 By End User - Market Size and Forecast, 2025-2035
- 12.3.1 Segment Definition and Scope
- 12.3.2 Historical Market Size, 2018-2025
- 12.3.3 Revenue Forecast, 2025-2035
- 12.3.4 Volume Forecast, 2025-2035
- 12.3.5 Base-Year Market Share, 2025
- 12.3.6 Segment CAGR and Growth Drivers
- 12.3.7 Subsegment Market Size and Forecast
- 12.3.7.1 Residential
- 12.3.7.2 Commercial
- 12.3.7.3 Industrial
- 12.3.8 Subsegment Pricing and Adoption Trends
- 12.3.9 Leading Suppliers and Competition
- 12.3.10 Regional Demand and Opportunities
- 12.4 By Project Scale - Market Size and Forecast, 2025-2035
- 12.4.1 Segment Definition and Scope
- 12.4.2 Historical Market Size, 2018-2025
- 12.4.3 Revenue Forecast, 2025-2035
- 12.4.4 Volume Forecast, 2025-2035
- 12.4.5 Base-Year Market Share, 2025
- 12.4.6 Segment CAGR and Growth Drivers
- 12.4.7 Subsegment Market Size and Forecast
- 12.4.7.1 Below 10 kW
- 12.4.7.2 10 kW to below 1 MW
- 12.4.7.3 1 MW and above
- 12.4.8 Subsegment Pricing and Adoption Trends
- 12.4.9 Leading Suppliers and Competition
- 12.4.10 Regional Demand and Opportunities
- 12.5 By Ownership Model - Market Size and Forecast, 2025-2035
- 12.5.1 Segment Definition and Scope
- 12.5.2 Historical Market Size, 2018-2025
- 12.5.3 Revenue Forecast, 2025-2035
- 12.5.4 Volume Forecast, 2025-2035
- 12.5.5 Base-Year Market Share, 2025
- 12.5.6 Segment CAGR and Growth Drivers
- 12.5.7 Subsegment Market Size and Forecast
- 12.5.7.1 Customer-owned
- 12.5.7.2 Third-party-owned
- 12.5.7.3 Community-owned
- 12.5.8 Subsegment Pricing and Adoption Trends
- 12.5.9 Leading Suppliers and Competition
- 12.5.10 Regional Demand and Opportunities
- 12.6 By Technology - Market Size and Forecast, 2025-2035
- 12.6.1 Segment Definition and Scope
- 12.6.2 Historical Market Size, 2018-2025
- 12.6.3 Revenue Forecast, 2025-2035
- 12.6.4 Volume Forecast, 2025-2035
- 12.6.5 Base-Year Market Share, 2025
- 12.6.6 Segment CAGR and Growth Drivers
- 12.6.7 Subsegment Market Size and Forecast
- 12.6.7.1 Passivated emitter and rear cell
- 12.6.7.2 Tunnel oxide passivated contact
- 12.6.7.3 Advanced cell architectures
- 12.6.8 Subsegment Pricing and Adoption Trends
- 12.6.9 Leading Suppliers and Competition
- 12.6.10 Regional Demand and Opportunities
- 12.7 By Country - Market Size and Forecast, 2025-2035
- 12.7.1 Segment Definition and Scope
- 12.7.2 Historical Market Size, 2018-2025
- 12.7.3 Revenue Forecast, 2025-2035
- 12.7.4 Volume Forecast, 2025-2035
- 12.7.5 Base-Year Market Share, 2025
- 12.7.6 Segment CAGR and Growth Drivers
- 12.7.7 Subsegment Market Size and Forecast
- 12.7.7.1 China
- 12.7.7.2 India
- 12.7.7.3 Japan
- 12.7.7.4 Remaining Asia Pacific
- 12.7.8 Subsegment Pricing and Adoption Trends
- 12.7.9 Leading Suppliers and Competition
- 12.7.10 Regional Demand and Opportunities
- 12.8 Segment Growth Comparison
- 12.9 Segment Attractiveness and Priority Matrix
Chapter 13 Asia Pacific Rooftop Solar End-Use and Application Market Outlook
- 13.1 End-Use Industry and Customer Demand Structure
- 13.2 Leading Applications and Customer Groups
- 13.3 End-Use Market Size, Share and Forecast
- 13.4 Major End-Use Industry Deep Dives
- 13.4.1 Customer Requirements and Use Cases
- 13.4.2 Demand and Replacement Cycles
- 13.4.3 Technical and Regulatory Considerations
- 13.4.4 Purchasing and Procurement Models
- 13.4.5 Leading Vendors and Distribution Channels
- 13.4.6 Forecast and Commercial Opportunities
- 13.5 Emerging Applications and Cross-Segment Demand
- 13.6 End-Use Industry Investment Priorities
Chapter 14 Asia Pacific Rooftop Solar Geographic Market Outlook, 2025-2035
- 14.1 Regional Market Size and Country-Level Shares, 2025
- 14.2 Country Market Size Comparison, 2025
- 14.3 Country Market Forecasts, 2025-2035
- 14.4 Subregional Industrial and Demand Clusters
- 14.5 Intra-Regional Pricing and Cost Differences
- 14.6 Cross-Border Trade and Supply Networks
- 14.7 Regional Supply and Demand Balances
- 14.8 Country Opportunity Comparison and Prioritization
Note: Every listed country is covered on the structure shown under the first country.
Chapter 15 Asia Pacific Rooftop Solar Technology, Innovation and Sustainability Outlook
- 15.1 Technology Landscape and Maturity
- 15.2 Product, Process and Service Innovation
- 15.3 AI, Automation and Digital Tools in the Industry
- 15.4 Technology Adoption and Performance Benchmarking
- 15.5 Innovation Pipeline and R&D Investment
- 15.6 Patent and Intellectual Property Trends
- 15.7 Energy Efficiency and Resource Management
- 15.8 Sustainability, Recycling and Circularity
- 15.9 Technology Roadmap, 2025-2035
- 15.10 Risks of Obsolescence and Technology Substitution
Chapter 16 Asia Pacific Rooftop Solar Market Key Strategic Imperatives
- 16.1 Growth and Market Entry Priorities
- 16.2 High-Return Products and Segments
- 16.3 Pricing, Profitability and Cost Optimization
- 16.4 Technology Investment and Product Differentiation
- 16.5 Supply Chain Localization and Resilience
- 16.6 Distribution and Customer Acquisition
- 16.7 Partnership, Acquisition and Capacity Strategy
- 16.8 Regional Expansion Priorities
- 16.9 Short-, Medium- and Long-Term Actions
Chapter 17 Competition Outlook
- 17.1 Industry Competition Characteristics
- 17.2 Market Structure and Concentration
- 17.3 Market Share and Competitive Positioning, 2025
- 17.4 Company-Wise Revenue and Product Benchmarking
- 17.5 Production and Service Capacity Benchmarking
- 17.6 Technology, Pricing and Differentiation
- 17.7 Regional Footprint and Distribution Strength
- 17.8 Mergers, Acquisitions and Strategic Alliances
- 17.9 New Entrants and Competitive Threats
- 17.10 Porter's Five Forces and Industry Attractiveness
- 17.11 Competitive Outlook, 2025-2035
Chapter 18 Company Profiles
- 18.1 Company Coverage and Selection Criteria
- 18.2 CHINT Anneng
- 18.2.1 Business Description
- 18.2.2 Company Ownership and Geographic Presence
- 18.2.3 Product and Service Portfolio
- 18.2.4 Manufacturing and Operating Footprint
- 18.2.5 Production Capacity and Expansion Plans
- 18.2.6 Financial Performance and Investment
- 18.2.7 Market Share and Competitive Position
- 18.2.8 Technology and Innovation Capabilities
- 18.2.9 Strategic Alliances or Partnerships
- 18.2.10 Recent Developments
- 18.2.11 Growth Strategy and Outlook
- 18.3 LONGi Green Energy
- 18.4 Trina Solar
- 18.5 Tata Power Solar
- 18.6 Waaree Energies
- 18.7 Other Relevant Market Participants
Note: Every listed company is profiled on the structure shown under the first company. The company list is preliminary and may change based on research findings, market developments, data availability and client requirements.
Chapter 19 Disclaimer
- 19.1 Research and Forecast Disclaimer
- 19.2 Data Source and Estimation Limitations
Note: The depth of individual sections depends on data availability for this market. Volume, capacity, trade and other unit-based metrics are included where applicable.

