
Fleet compliance and connected cars lift data services
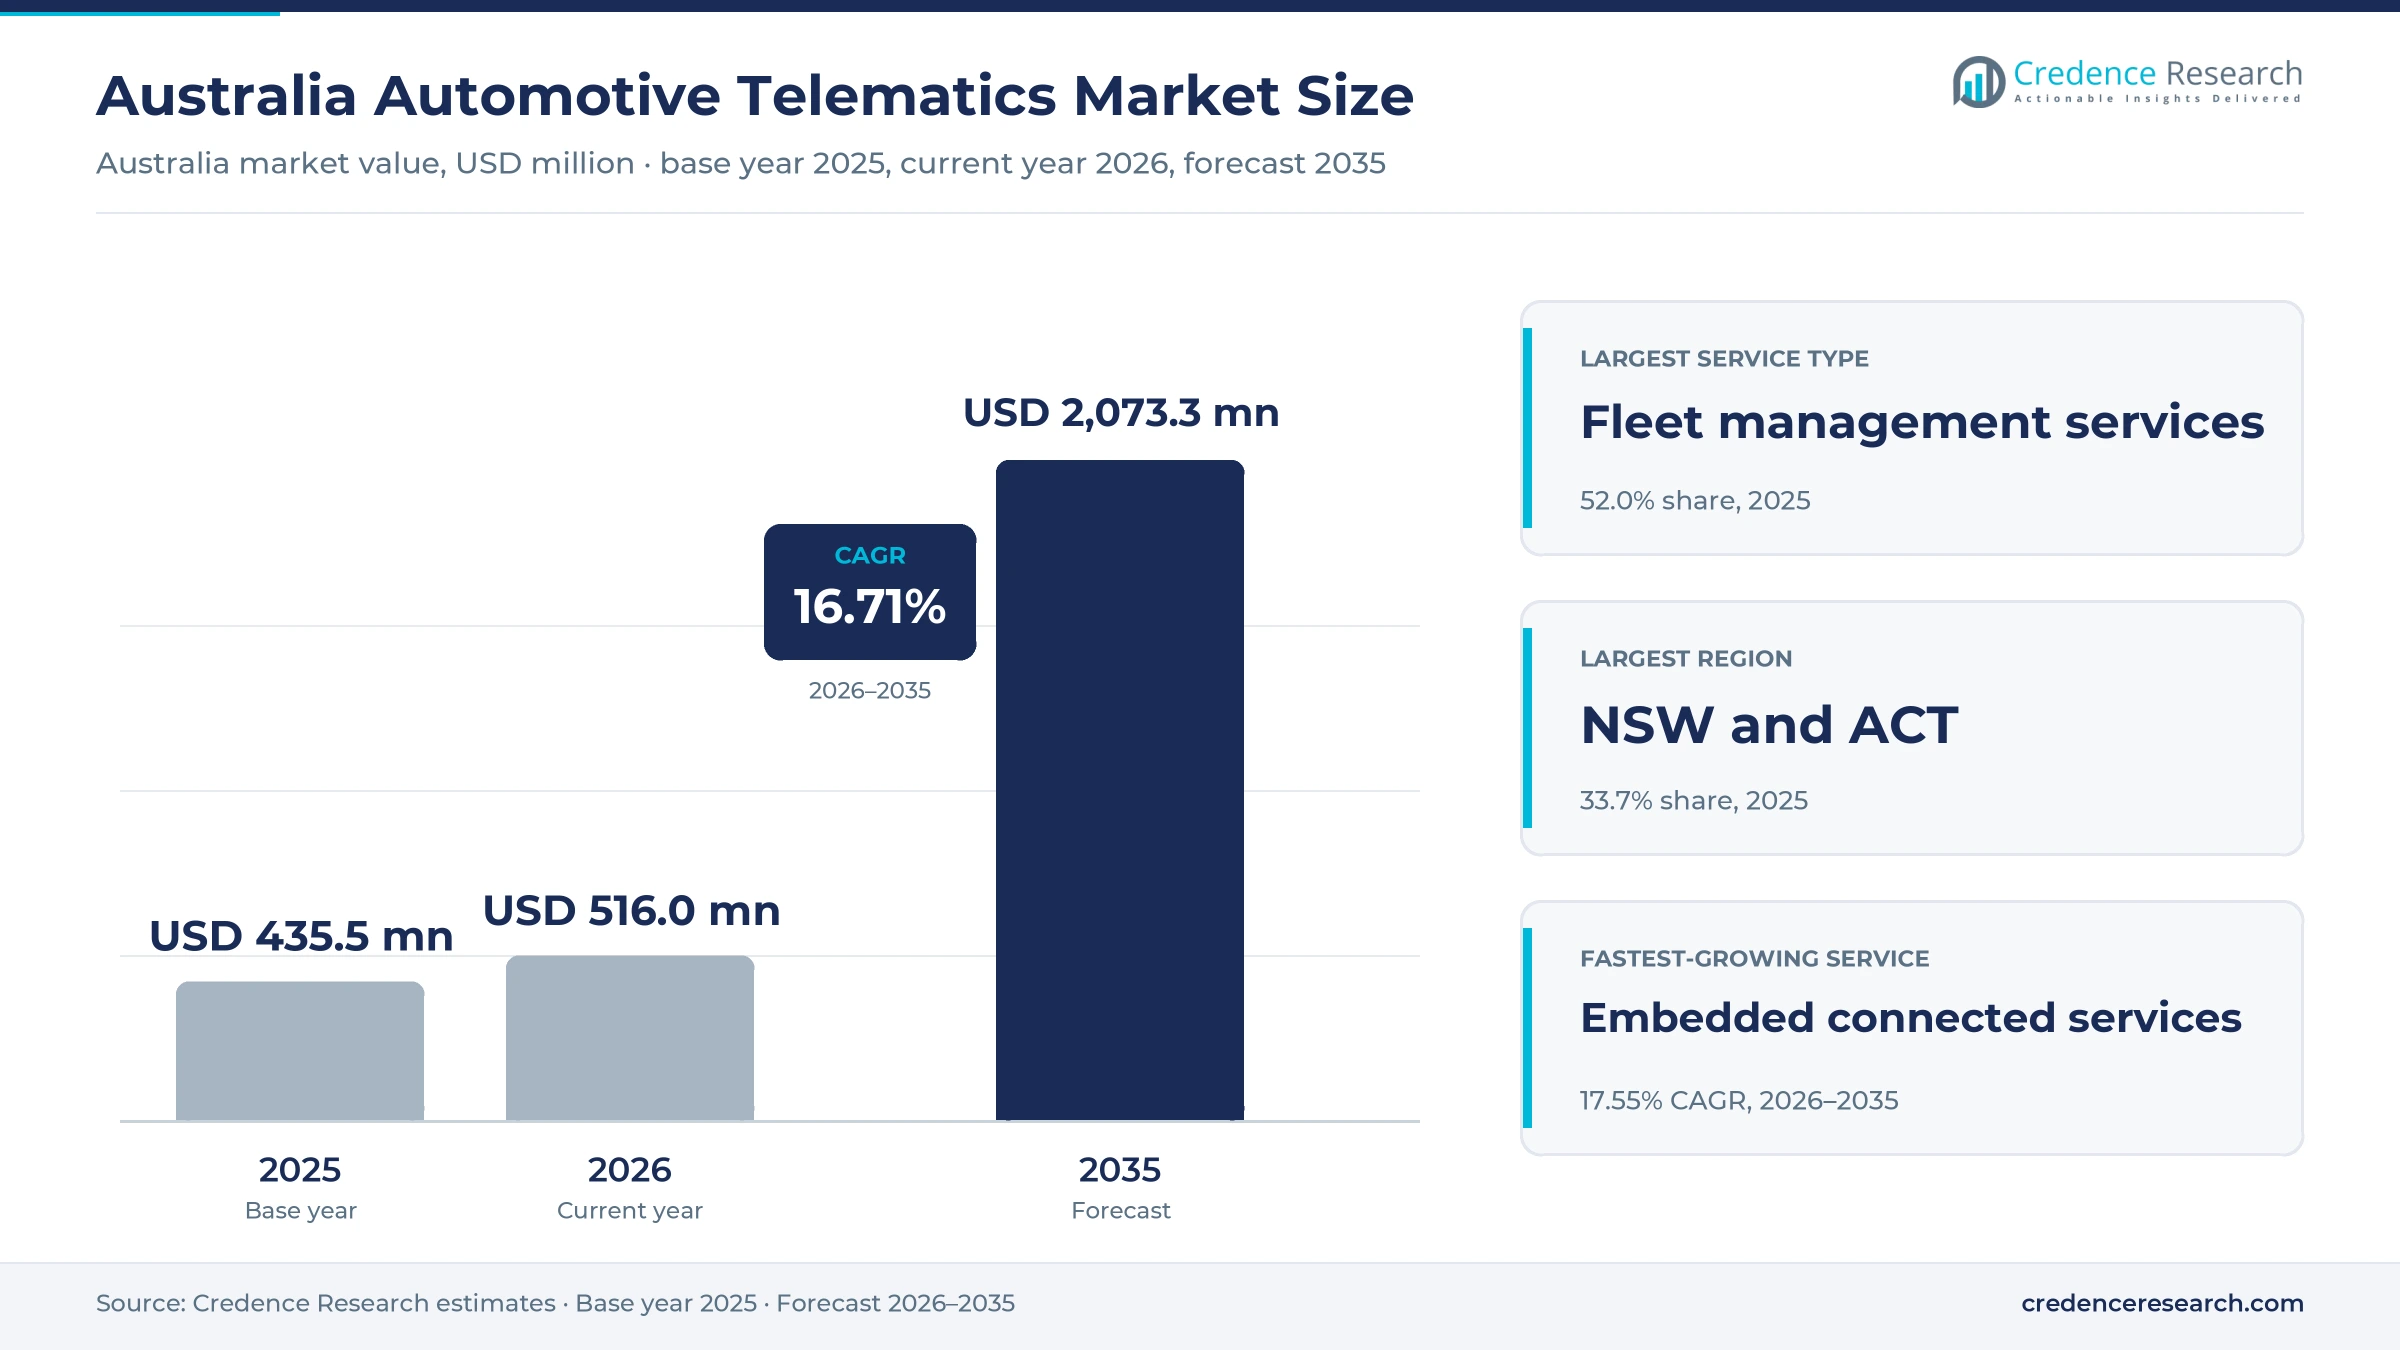
The Australia automotive telematics market was valued at USD 435.5 million in 2025 and is projected to increase from USD 516.0 million in 2026 to USD 2.07 billion by 2035, registering a CAGR of 16.71% during 2026–2035. Demand comes from trucking companies, enterprise and government fleets, insurers and car owners that use vehicle location, driver behavior and engine data to cut costs, meet fatigue rules and recover stolen vehicles. New South Wales and Australian Capital Territory held the largest regional share, 33.7% in 2025, because the zone has the most businesses, freight depots and registered vehicles. Victoria and Tasmania is the fastest-growing region at 17.01% a year, as a sharp rise in car theft lifts demand for tracking and recovery services. In turn, Telstra and Optus closed their 3G networks by Oct. 28, 2024, which pushed fleets to replace older devices with 4G units.
Which vehicle data services does the estimate cover?
The estimate measures spending on fleet management services, embedded connected services, insurance telematics services and stolen vehicle recovery services for heavy commercial, light commercial and passenger vehicles in Australia. It counts software subscriptions, bundled device subscriptions and embedded service fees paid by transport fleets, enterprise and government fleet owners and individual vehicle owners.
The estimate excludes vehicle sales, in-car entertainment content, mobile data plans sold separately and one-off installation labor. The value chain runs from device makers and car brands through platform providers, mobile networks and channel partners to fleets, insurers, road managers and drivers who use the data every day.
Australia Automotive Telematics Market Insights
- The Australia automotive telematics market was valued at USD 435.5 million in 2025 and is projected to reach USD 2.07 billion by 2035, registering a CAGR of 16.71% during 2026–2035.
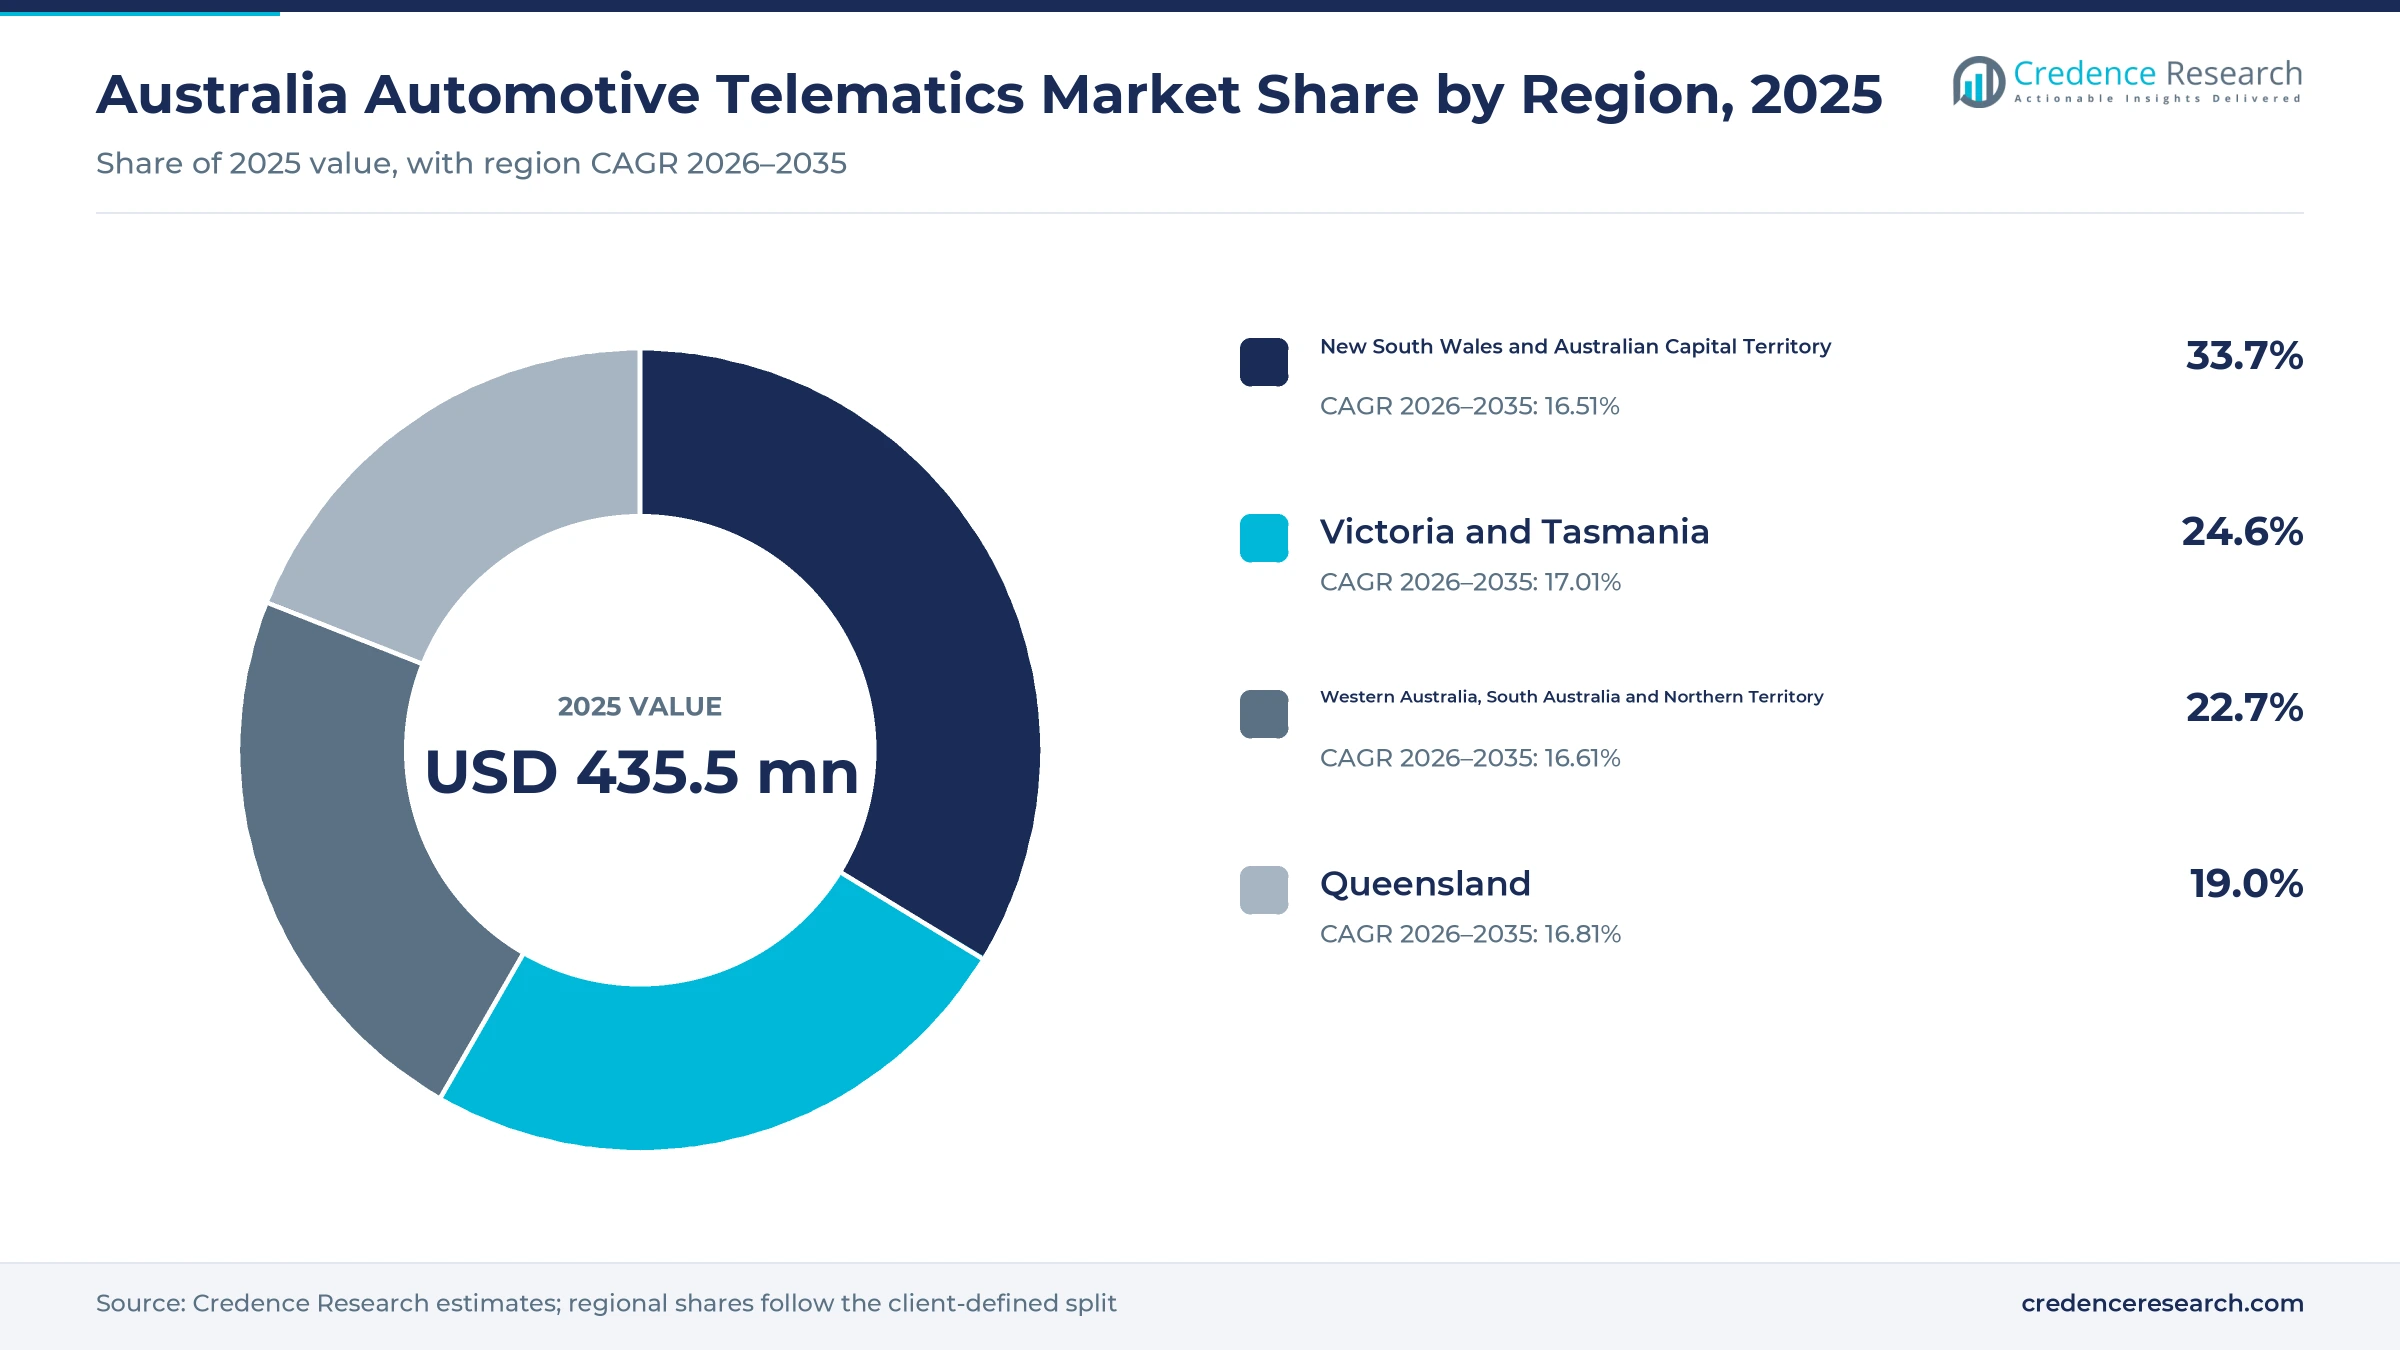
- New South Wales and Australian Capital Territory held a 33.7% share of 2025 value, because the zone has the largest base of fleets and vehicles.
- Fleet management services led with a 52.0% share of 2025 value, because trucking and service fleets use tracking, fatigue and safety tools every day.
- Transport Certification Australia reported 18,403 heavy vehicles enrolled in its schemes in 2024–25, up 14% on the previous year.
- Embedded connected services grow fastest at 17.55% a year during 2026–2035, as car brands fit built-in data modules and sell subscription features.
Fleet services lead while embedded services grow fastest
Why do fleet management services lead value?
Based on service type, the market is categorized into fleet management services, embedded connected services, insurance telematics services and stolen vehicle recovery services. Fleet Management Services led with a 52.0% share of 2025 value, because trucking and service fleets pay monthly for tracking, fatigue and safety tools. Embedded Connected Services grow fastest at 17.55% a year, as car brands add built-in data modules and paid remote features.
How do trucks, vans and cars split spending?
Based on vehicle type, the market is categorized into heavy commercial vehicles, light commercial vehicles and passenger vehicles. Heavy Commercial Vehicles led with a 38.0% share of 2025 value, because fatigue rules, access schemes and video safety systems raise spending per truck. Passenger Vehicles grow fastest at 17.26% a year, as more new cars arrive with connected services fitted at the factory.
Which buyers spend most on vehicle data?
Based on customer type, the market is categorized into transport fleet operators, enterprise fleet owners, government fleet owners and individual vehicle owners. Transport Fleet Operators led with a 42.0% share of 2025 value, because freight companies must manage driver hours and road access. Individual Vehicle Owners grow fastest at 17.40% a year, as car owners buy theft tracking and remote services.
How fast are embedded platforms gaining ground?
Based on technology, the market is categorized into aftermarket device platforms, embedded vehicle platforms and smartphone-led platforms. Aftermarket Device Platforms led with a 58.0% share of 2025 value, because fleets fit approved boxes and cameras to mixed vehicle brands. Embedded Vehicle Platforms grow fastest at 17.67% a year, as factory-fitted modules send data without extra hardware.
| Segment Group | Leading Sub-segment | Share, 2025 | Fastest-growing Sub-segment | CAGR, 2026–2035 |
|---|---|---|---|---|
| By Service Type | Fleet Management Services | 52.0% | Embedded Connected Services | 17.55% |
| By Vehicle Type | Heavy Commercial Vehicles | 38.0% | Passenger Vehicles | 17.26% |
| By Customer Type | Transport Fleet Operators | 42.0% | Individual Vehicle Owners | 17.40% |
| By Technology | Aftermarket Device Platforms | 58.0% | Embedded Vehicle Platforms | 17.67% |
Request a Free Sample
Fill in your details and we'll send you a free sample report.
- Sample data tables & charts
- Research methodology
Compliance, productivity and car connectivity drive demand
How does safety and compliance digitization lift demand?
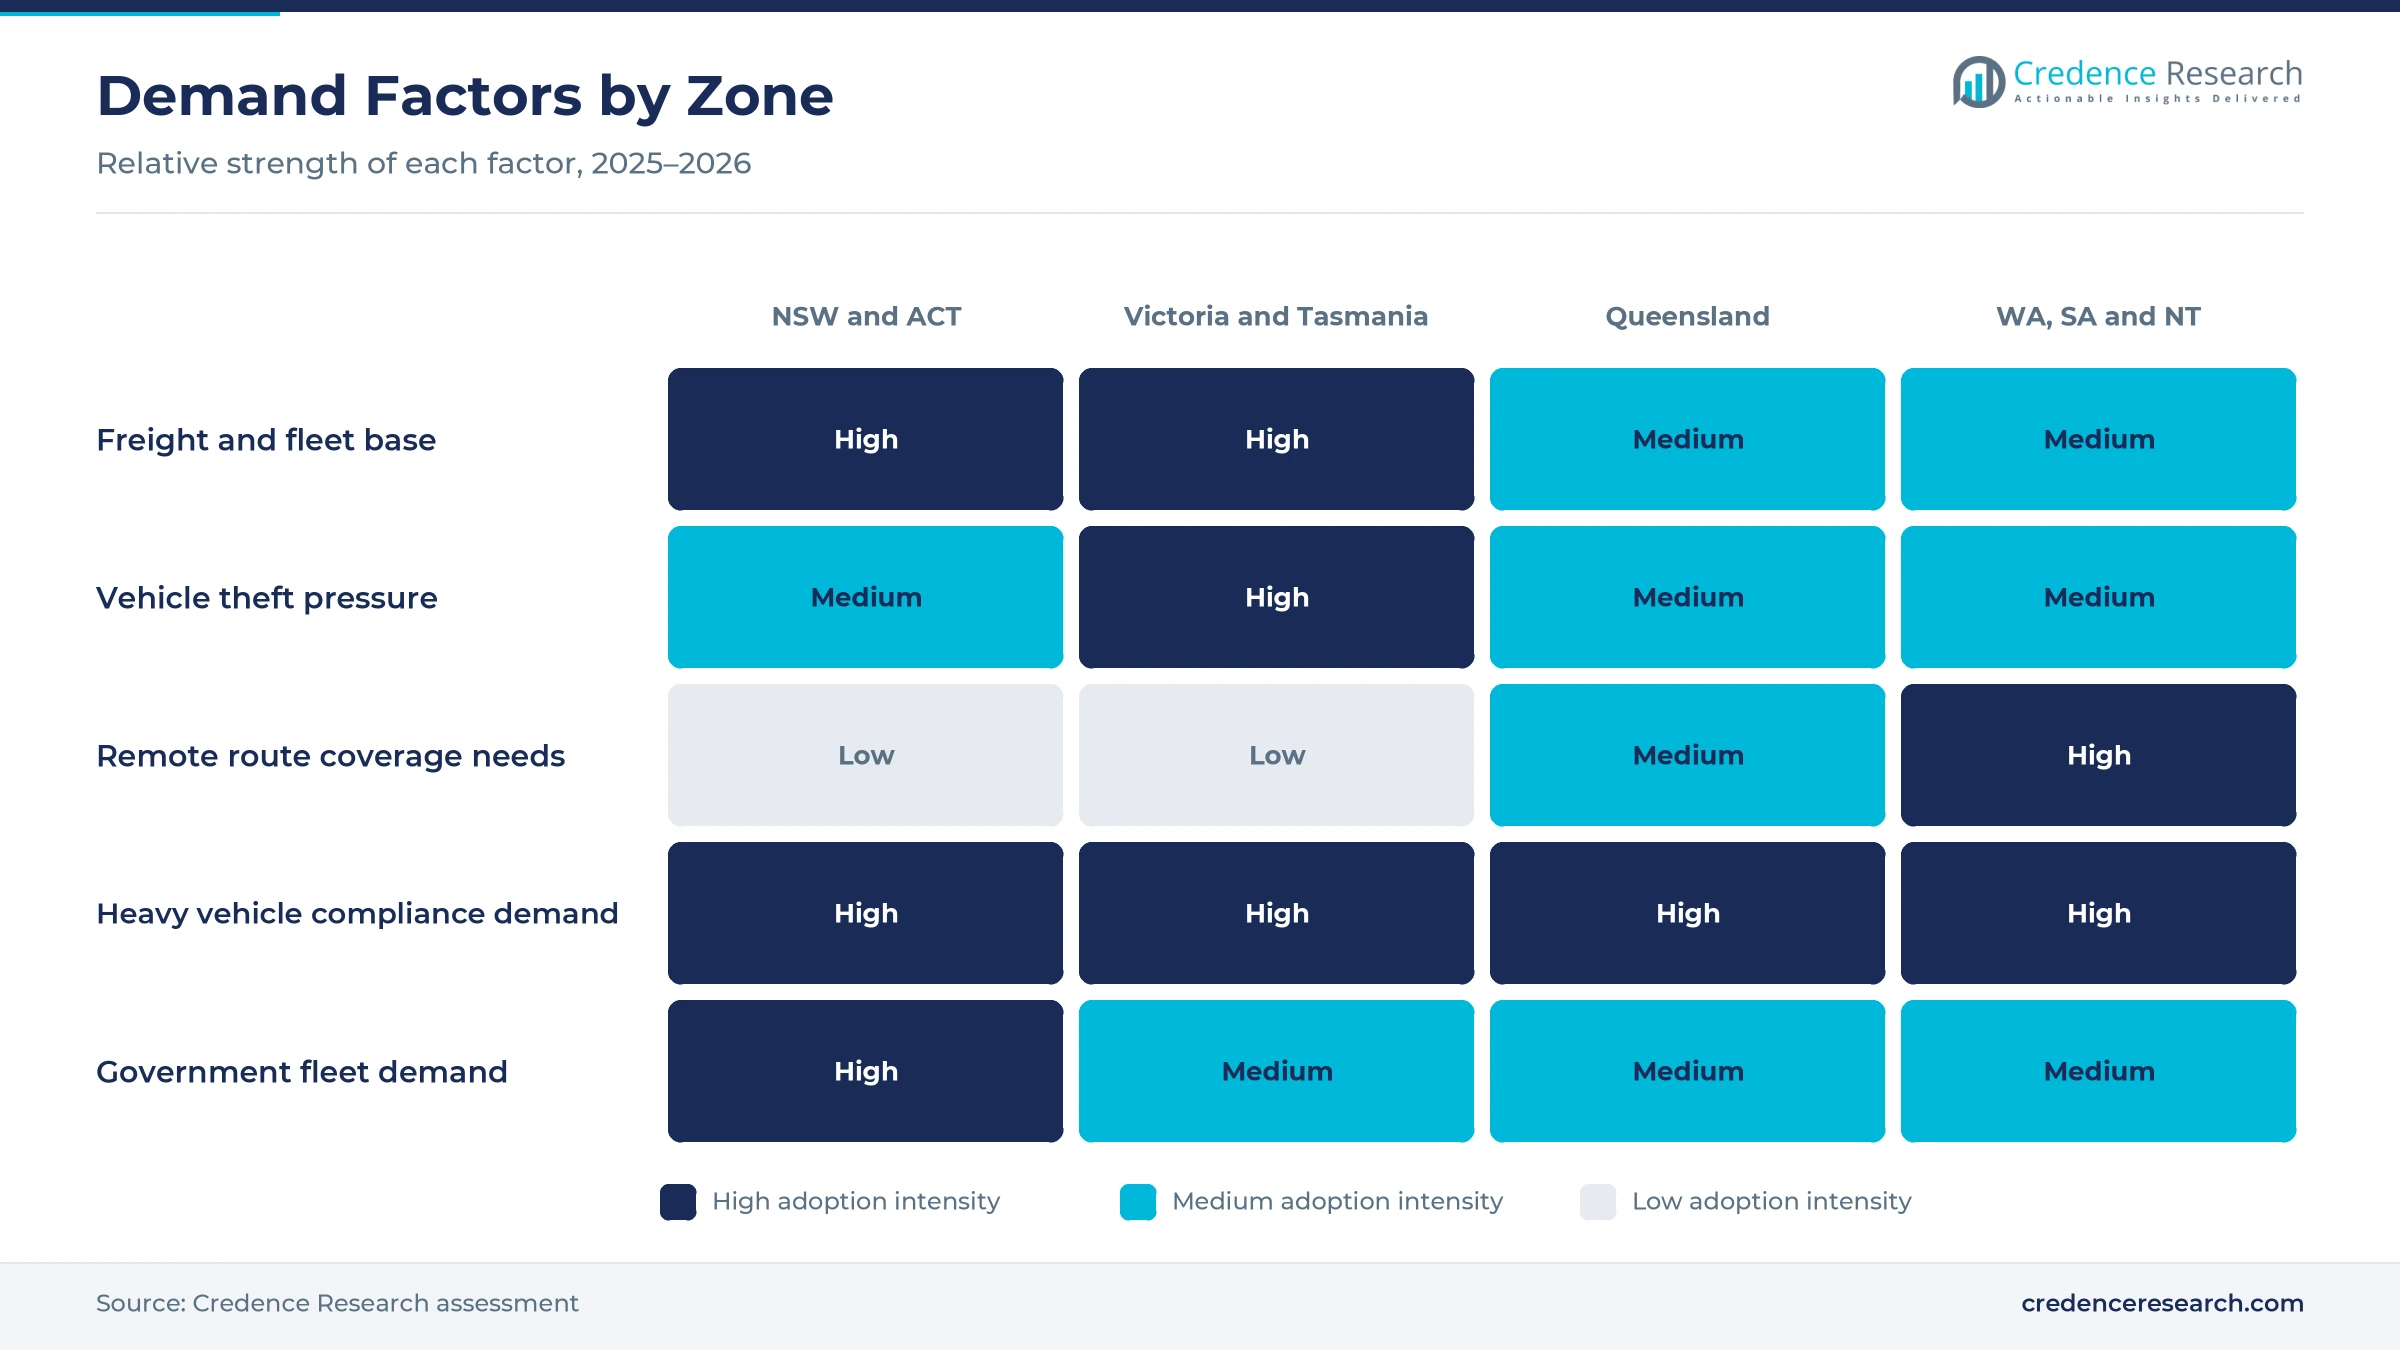
Safety and compliance digitization lifts demand, because heavy vehicle operators must record driver hours and prove road access conditions. Transport Certification Australia reported 18,403 heavy vehicles enrolled in its telematics schemes in 2024–25, up 14% on the year before, according to the Austroads and TCA annual report. The national regulator has approved eight electronic work diary providers since the first system in 2020, and these diaries do a job similar to electronic logging devices in other countries. Queensland passed national law amendments in November 2025 that cut 21 penalties and require documented safety management systems for accredited businesses. As a result, heavy commercial vehicles hold 38.0% of 2025 value.
Why does fleet productivity keep adoption rising?
Fleet productivity keeps adoption rising, because tracking, fuel and driver data cut costs for trucks, vans and service vehicles. EROAD won five-year deals with Boral and Woolworths covering 4,345 units in October 2023, which the company said would lift its Australian units by 28% with a third contract. Teletrac Navman customer Jarratt Transport Solutions reported saving about 3,000 liters of fuel a month after using AI camera coaching. Geotab launched its Ace AI assistant for all Australian customers on Oct. 8, 2025, giving managers plain-language answers from fleet data. In turn, firms that use fleet management outsourcing also expect tracking data in their service contracts.
How does embedded connectivity create new revenue?
Embedded connectivity creates new revenue, because car brands now fit data modules at the factory and charge for features after a free period. Toyota Connected Services uses a built-in module on the Telstra 4G network, with SOS calling and automatic collision notification in its Essentials package. Buyers of new models receive 12 months of full features, after which a monthly Connect+ subscription covers stolen vehicle tracking and remote locking. Australians also bought 1,220,607 new vehicles in 2024, up 0.3% on 2023, adding a large pool of connected cars each year. As a result, embedded connected services grow fastest at 17.55% a year.
Why does rising vehicle theft support recovery services?
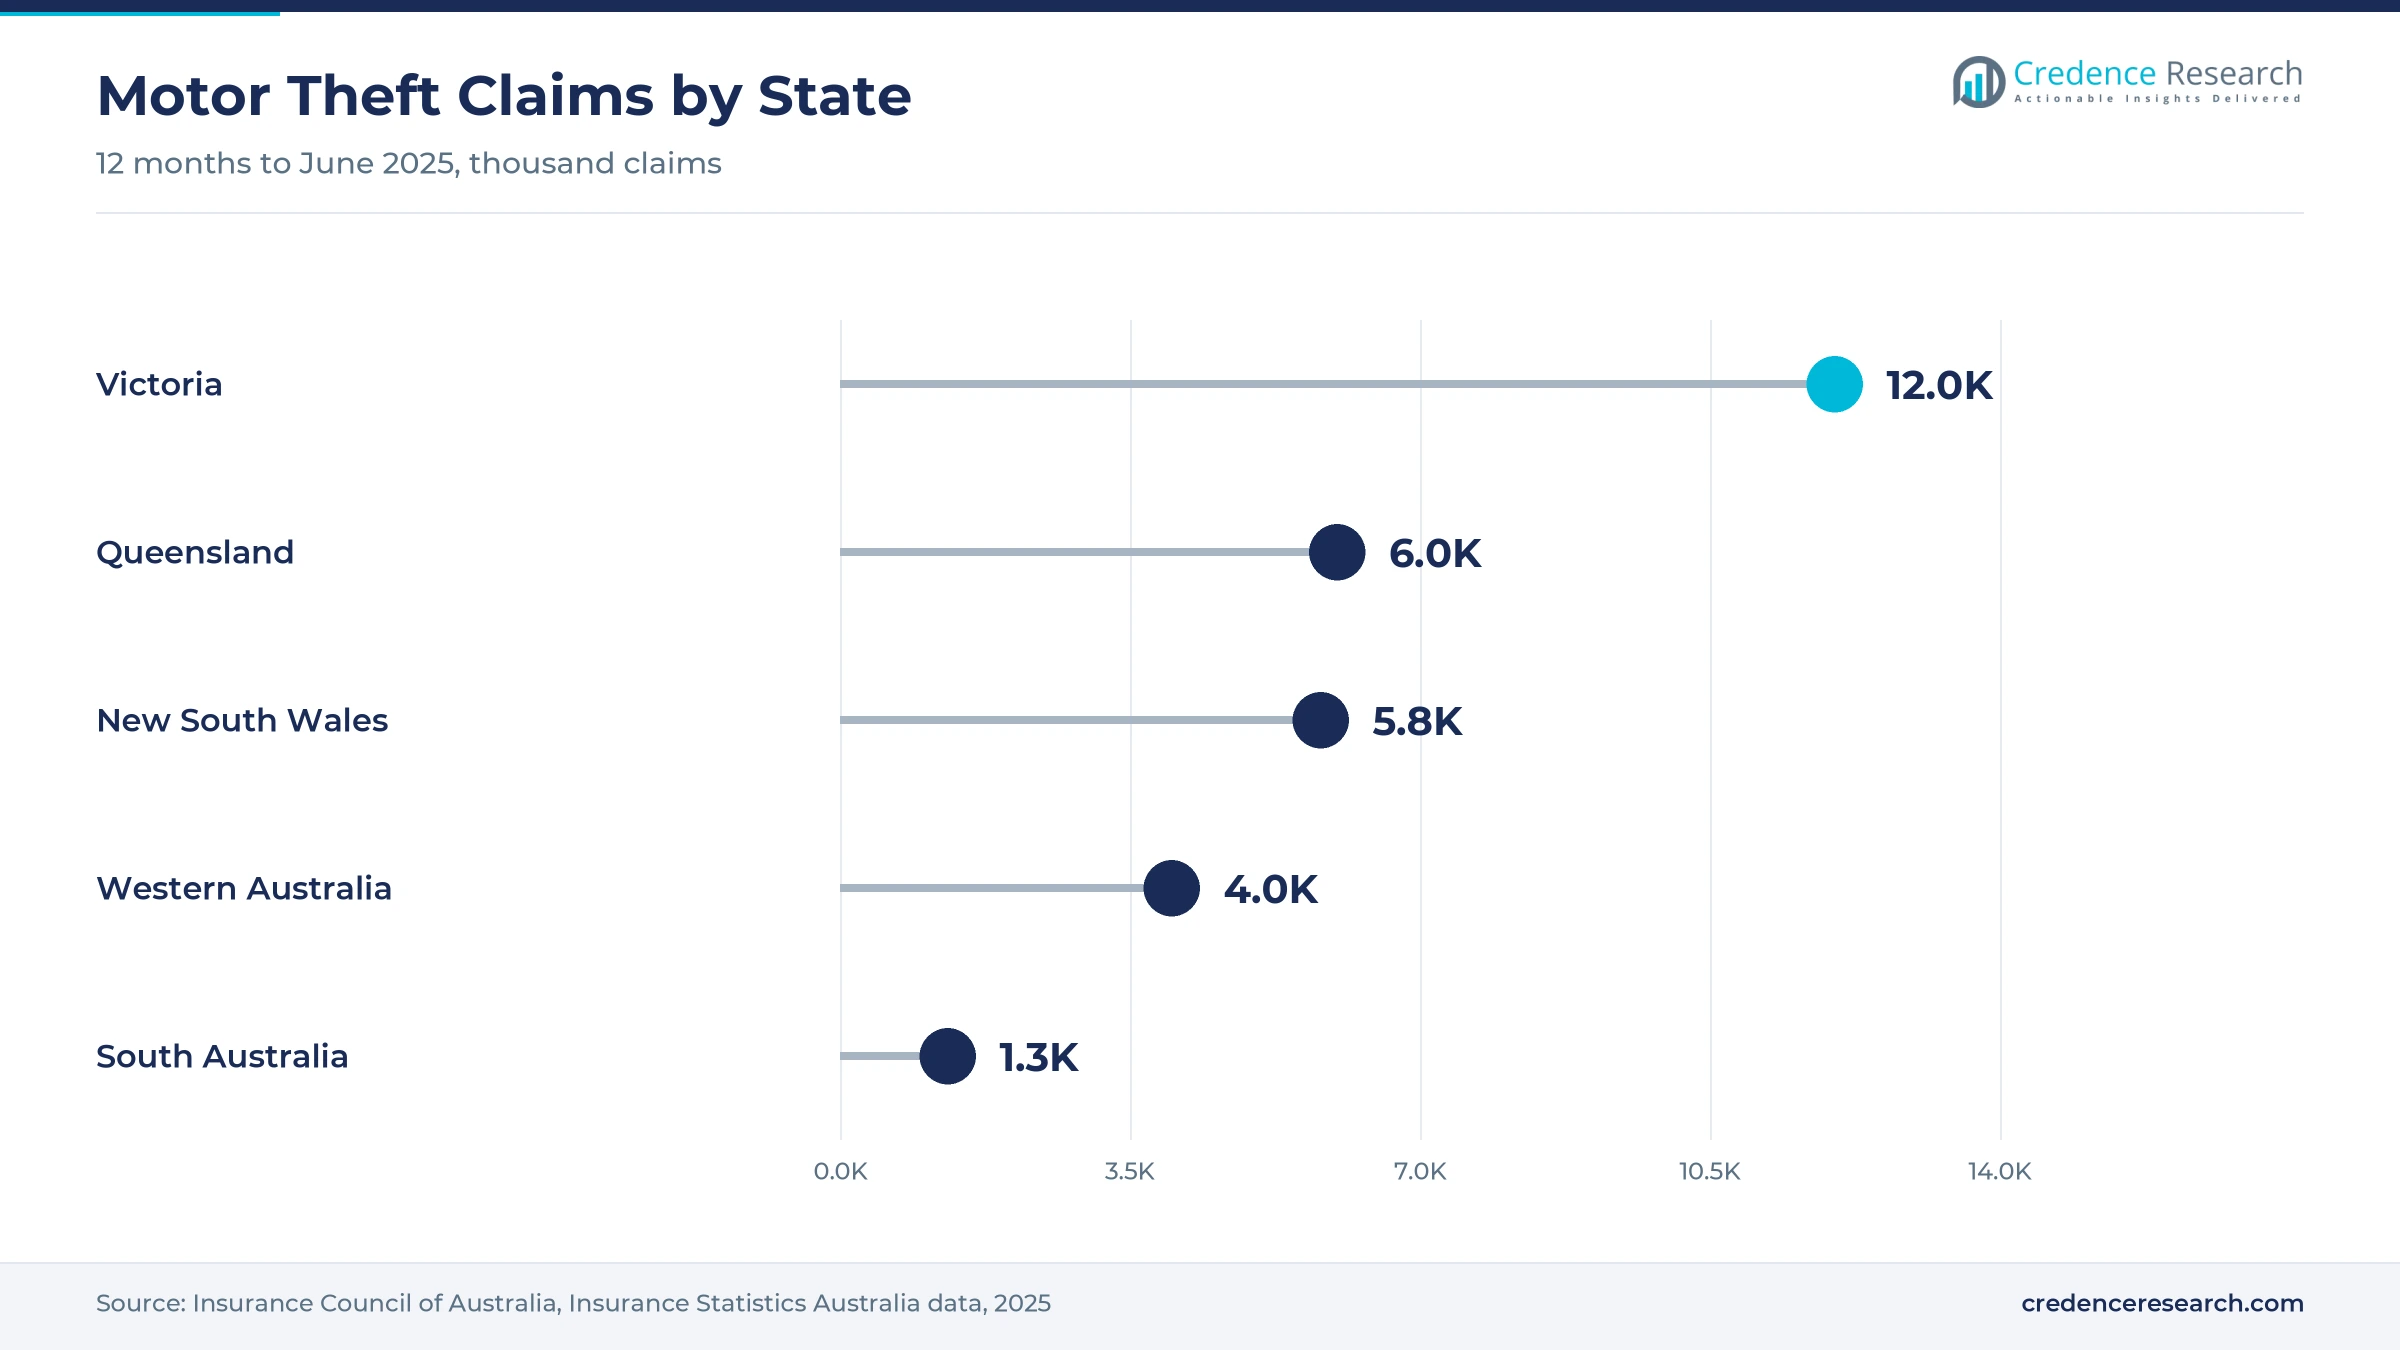
Rising vehicle theft supports recovery services, because owners and insurers want to find stolen cars quickly. Motor theft claims rose 11% to 30,000 in the 12 months to June 2025, and their cost rose 20% to A$466 million, according to the Insurance Council of Australia. Victoria recorded more than 12,000 claims, up 59%, while metropolitan theft claim frequency rose from 0.26% to 0.45% of policies. Netstar Australia launched a stolen vehicle recovery service in May 2025 with 24/7 monitoring and police alerts, and it says a vehicle is stolen about every seven minutes. In turn, individual vehicle owners grow fastest at 17.40% a year.
AI cameras, 4G devices and road data reshape the market
How is the shift to AI video telematics changing fleets?
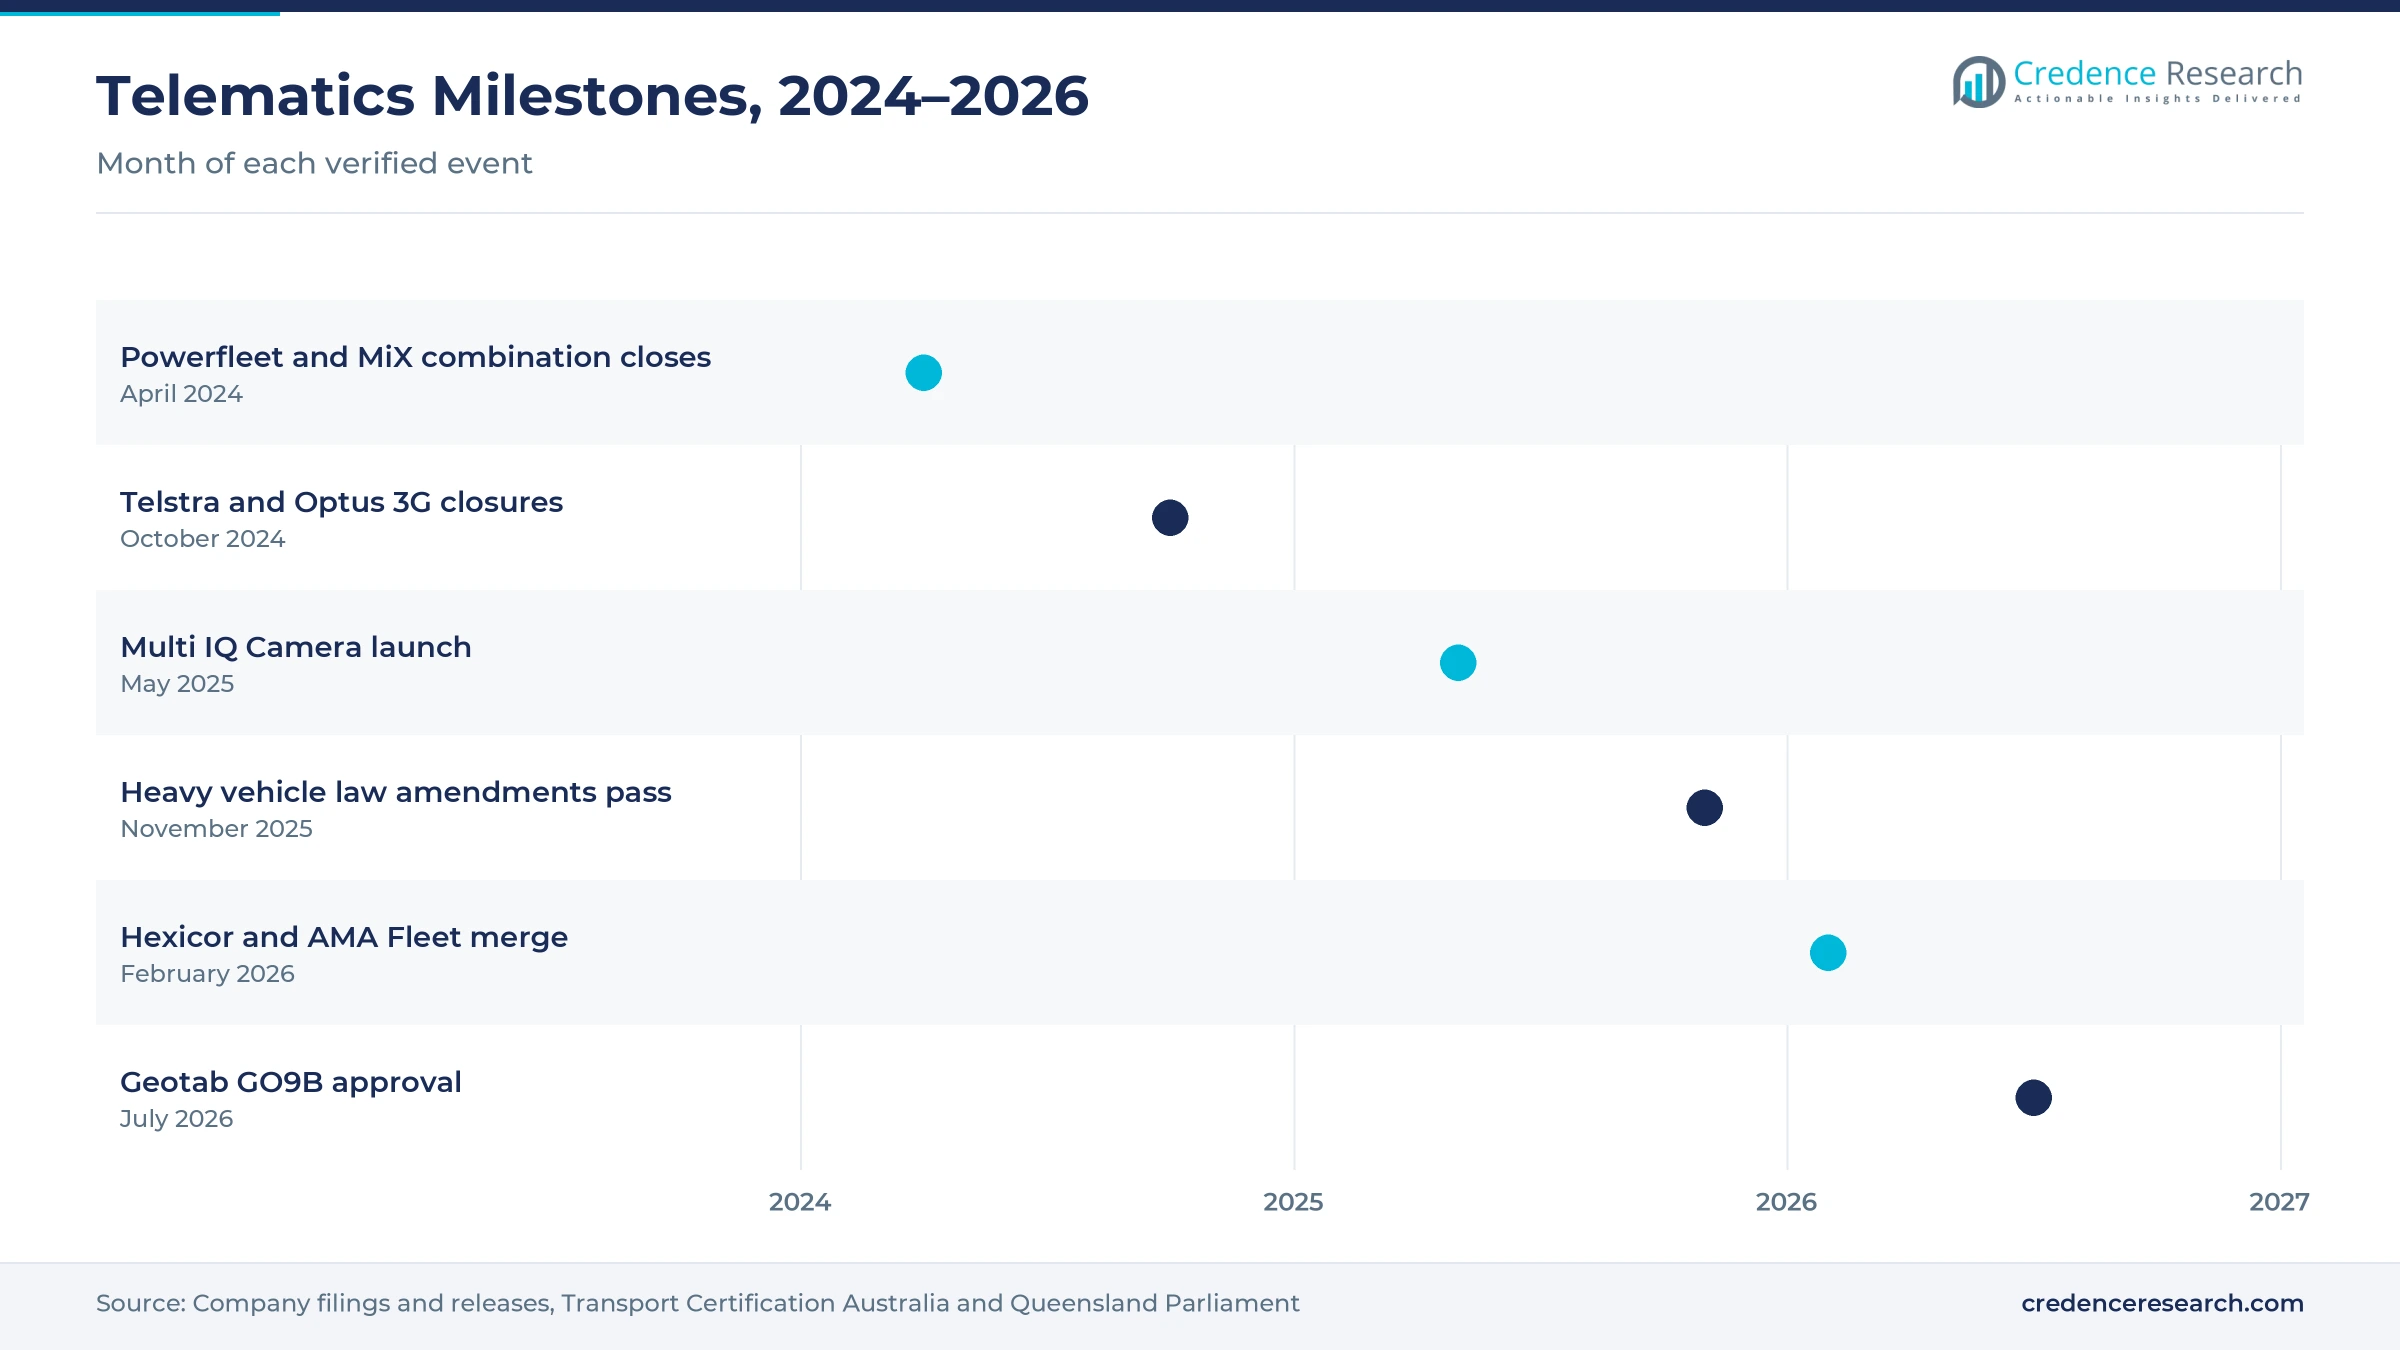
The shift to AI video telematics is changing fleets, because cameras now detect risky behavior as it happens. Teletrac Navman launched its IQ Camera in April 2024, tracking eye closure, head position and phone use to flag drowsiness and distraction. It then added the Multi IQ Camera on May 14, 2025, which connects up to five external cameras to the TN360 platform, according to IT Brief Australia. The company also reported that 70% of businesses had felt the impact of distracted driving, with 68% naming mobile phones as the main cause. As a result, fleets buy AI dashcams with tracking, which raises spending per heavy vehicle.
Why is the rise of 4G-only fleets notable?
The rise of 4G-only fleets is notable, because the 3G shutdown forced a large device replacement cycle. Vodafone closed its 3G network in December 2023, and Telstra and Optus followed by Oct. 28, 2024. Transport Certification Australia told operators to audit devices, move to approved 4G units and plan rollouts that can take months. It also certified four new application service providers and approved two new devices in 2024–25. Geotab then received approval for its GO9B device as a Level 2 assurance device in July 2026, giving operators a second approved option. In turn, aftermarket device platforms keep 58.0% of 2025 value while newer hardware lifts service fees.
Can road manager data open a new revenue stream?
Road manager data can open a new revenue stream, because state agencies now use de-identified vehicle data to plan and manage freight routes. Road Infrastructure Management collects location, time and identity data from enrolled vehicles and shares it through the Telematics Analytics Platform. A 2024–25 upgrade cut data delay on that platform from eight weeks to hours, giving road managers near real-time views. IntelliTrac, a Bundoora provider founded in 1987, was registered as a new service provider for these schemes, which had 18,403 enrolled heavy vehicles in 2024–25, up 14%. As a result, providers with certified devices can sell compliance data to fleets that operate heavy vehicles and larger pickup trucks on access-controlled routes.
Is there room to grow through platform consolidation?
Providers have room to grow through platform consolidation, because larger customer bases spread software and support costs. Powerfleet closed its combination with MiX Telematics on April 2, 2024, creating a company with more than 1.8 million subscribers and 7,500 enterprise customers, according to a filing with the SEC. MiX already had offices across Australasia before the deal was completed. In Australia, Hexicor and AMA Fleet merged on Feb. 27, 2026, forming one of the largest Teletrac Navman channel partners. Telstra also sells MTData tracking with fatigue and access compliance options on its mobile network. In turn, partner-led sales and bundled subscriptions help providers reach smaller fleets across regional Australia.
Coverage gaps, privacy and price pressure test providers
How do coverage gaps limit remote operations?
Coverage gaps limit remote operations, because mobile networks do not reach many outback freight and mining routes. As a result, devices may store data for hours before they can upload it, which slows alerts and compliance records. Providers respond with satellite add-ons, such as the optional Iridium unit offered with MTData tracking, although these units carry extra data charges that smaller operators often find hard to justify for light vehicles on short routes.
Why do privacy concerns slow driver acceptance?
Privacy concerns slow driver acceptance, because cameras and location tracking record where people go and how they behave at work. In turn, unions and drivers may resist systems that look like surveillance rather than safety support for people on the road. Providers respond with coaching tools, clear data policies and privacy settings, which help fleets explain how data is used and build trust with drivers before wider rollouts across depots and regions.
How does price competition squeeze margins?
Price competition squeezes margins, because many local and global providers sell similar tracking features to the same fleets in each city and region. As a result, small fleets often choose low-cost plans and switch providers when contracts end. Providers respond with AI video, compliance modules and integrations with payroll and maintenance systems, which help them sell on value rather than price and keep customers for longer terms across several contract renewal cycles.
Why does device replacement add cost for fleets?
Device replacement adds cost for fleets, because network changes and new certification rules can make working hardware obsolete. In turn, operators must pay for new units, installer time and vehicle downtime, as many operators did during the 3G shutdown in 2024. Providers respond with staged rollouts, trade-in offers and devices approved for several schemes, which spread costs and reduce disruption for fleets with hundreds of vehicles spread across many depots and states.
NSW and ACT lead while Victoria and Tasmania grow fastest
| Region | Value, 2025 (USD million) | Share, 2025 | CAGR, 2026–2035 |
|---|---|---|---|
| New South Wales and Australian Capital Territory | 146.8 | 33.7% | 16.51% |
| Victoria and Tasmania | 107.1 | 24.6% | 17.01% |
| Western Australia, South Australia and Northern Territory | 98.9 | 22.7% | 16.61% |
| Queensland | 82.7 | 19.0% | 16.81% |
Why do new South Wales and the ACT hold the top share?
New South Wales and Australian Capital Territory held a 33.7% share of 2025 value and grow at 16.51% a year, because Sydney is the largest base for freight, logistics and service fleets. New South Wales recorded 5,800 motor theft claims in the 12 months to June 2025, down 3%. As a result, growth relies more on fleet compliance and AI camera upgrades than on theft recovery, while government fleets in Canberra add steady demand.
Why are Victoria and Tasmania growing fastest?
Victoria and Tasmania held a 24.6% share of 2025 value and grow fastest at 17.01% a year, because Melbourne is a major freight hub with large transport and warehouse fleets. Victoria recorded more than 12,000 motor theft claims in the 12 months to June 2025, up 59%, with theft costs of A$223 million. In turn, car owners and insurers in Melbourne buy more tracking and recovery services than in other states.
What shapes demand in Queensland?
Queensland held a 19.0% share of 2025 value and grows at 16.81% a year, because long freight routes, mining supply chains and tourism fleets need tracking across large distances. Queensland recorded 6,000 motor theft claims in the 12 months to June 2025, down 11%, its largest fall in a decade. As a result, demand rests on heavy vehicle compliance and remote asset tracking more than on recovery.
How do Western Australia, South Australia and the NT perform?
Western Australia, South Australia and Northern Territory held a 22.7% share of 2025 value and grow at 16.61% a year, because mining, agriculture and long-haul freight need tracking in remote areas. Western Australia recorded 4,000 theft claims and South Australia 1,300 in the 12 months to June 2025, both down 10%. In turn, satellite-capable devices matter more in these remote zones.
Mergers, launches and law reform shape 2024–2026
| Development | Status and market relevance |
|---|---|
| In April 2024, Powerfleet closed its combination with MiX Telematics, creating a company with more than 1.8 million subscribers. | Adds scale across Australasia |
| In October 2024, Telstra and Optus completed their 3G network closures, forcing fleets to move to 4G devices. | Drives device replacement |
| In May 2025, Teletrac Navman launched the Multi IQ Camera, connecting up to five external cameras to its TN360 platform. | Expands AI video safety |
| In November 2025, the Queensland Parliament passed Heavy Vehicle National Law amendments that cut 21 penalties. | Expected to start in mid-2026 |
| In February 2026, Hexicor and AMA Fleet merged to form one of the largest Teletrac Navman channel partners in Australia. | Strengthens partner-led sales |
4G devices, AI video and embedded modules define service
- 4G telematics devices replace older 3G units and send location, engine and driver hour data to fleet platforms and certified access schemes.
- AI video cameras analyze the road and the driver in real time, flagging drowsiness, phone use and close following for coaching and evidence.
- Embedded data modules are fitted by car brands at the factory and support emergency calls, collision alerts, theft tracking and remote functions through subscriptions.
Need a Custom Version of This Report?
Tailor the scope, geography, or segments to your exact requirements.
- Custom geography or segment scope
- Direct access to our analyst team
Fleet platforms compete on compliance and safety tools
Competition is led by fleet platform providers that sell tracking, compliance and video safety tools to transport, enterprise and government fleets. Teletrac Navman sells its TN360 platform and AI cameras directly and through partners such as Hexicor Telematics. EROAD serves large Australian fleets under multi-year contracts, while Geotab offers TCA-approved devices and an AI assistant to Australian customers. MTData sells tracking with fatigue and access compliance options on the Telstra network. MiX by Powerfleet, IntelliTrac and Netstar Australia compete in tracking, road access schemes and theft recovery. Rivals compete on compliance approvals, video safety features, network coverage and partner reach. Because fleets sign contracts for several years, providers with approved devices and strong support win more renewals.
Which companies serve Australian fleets and drivers?
| Company | Type | Role in the market |
|---|---|---|
| Teletrac Navman | Fleet platform provider | TN360 platform and Multi IQ AI cameras for Australian fleets |
| EROAD | Fleet platform provider | Five-year contracts with Boral and Woolworths |
| Geotab | Fleet platform provider | TCA-approved GO9B device and Ace AI assistant in Australia |
| MTData | Fleet platform provider | Tracking with fatigue and access compliance on the Telstra network |
| MiX by Powerfleet | Fleet platform provider | Combined company with offices in Australasia |
| IntelliTrac | Tracking provider | Registered service provider for road infrastructure schemes |
| Netstar Australia | Tracking and recovery provider | Stolen vehicle recovery service and approved work diary |
Credence Research view on vehicle data services
Credence Research's view is that Australian automotive telematics spending will grow quickly because fleets, regulators, insurers and car owners all rely more on connected data. Fleet management remains the largest value pool, while embedded services add the fastest growth as car brands sell features after free periods. AI cameras and certified 4G devices raise spending per truck. Providers with compliance approvals, strong channel partners and video safety tools should gain the most, while price competition keeps margins tight in small fleets.
How the national vehicle data estimate was built
The report uses 2025 as the base year on a calendar basis, and market values come from the Credence Research model. That model combines heavy vehicle scheme data, new vehicle sales statistics, insurance theft claims data, regulator publications, company filings and provider product releases. Segment splits and zone growth rates are Credence Research estimates, while zone shares follow the client-defined split. Sources used are official statistics, regulator and industry body publications, company filings and press releases, and no interviews or surveys were used.
Embedded services and AI safety carry growth to 2035
Vehicle data spending is expected to reach USD 2.07 billion by 2035, a 16.71% CAGR during 2026–2035, as fleets digitize compliance and car brands sell more connected features. Growth should be strongest in embedded services, passenger vehicles and individual owners, because new cars arrive connected and theft concerns remain high. Heavy vehicle law reform and certified device schemes will shape fleet spending. Faster AI camera adoption would lift value further, while privacy concerns and price competition could slow it.
Frequently Asked Questions
How big is the Australia automotive telematics market?
Which service type leads Australian value?
Which region leads the Australian market?
How many heavy vehicles use certified telematics schemes?
How did the 3G shutdown affect vehicle tracking?
How does vehicle theft affect demand for tracking?
Who are the leading companies in the Australian market?
What are the main challenges for providers?
Table of Content
Chapter 1 Market Segmentation
- 1.1 Segmentation Framework
- 1.1.1 Product and Service Classification
- 1.1.2 Application and End-Use Classification
- 1.1.3 Technology and Solution Classification
- 1.1.4 Customer and Distribution Channel Classification
- 1.1.5 Geographic Segmentation
- 1.1.6 Market Segment Definitions and Boundaries
- 1.2 By Service Type
- 1.2.1 Fleet Management Services
- 1.2.2 Embedded Connected Services
- 1.2.3 Insurance Telematics Services
- 1.2.4 Stolen Vehicle Recovery Services
- 1.3 By Vehicle Type
- 1.3.1 Heavy Commercial Vehicles
- 1.3.2 Light Commercial Vehicles
- 1.3.3 Passenger Vehicles
- 1.4 By Customer Type
- 1.4.1 Transport Fleet Operators
- 1.4.2 Enterprise Fleet Owners
- 1.4.3 Government Fleet Owners
- 1.4.4 Individual Vehicle Owners
- 1.5 By Technology
- 1.5.1 Aftermarket Device Platforms
- 1.5.2 Embedded Vehicle Platforms
- 1.5.3 Smartphone-Led Platforms
Chapter 2 Introduction
- 2.1 Report Objectives and Scope
- 2.2 Product Definition and Industry Terminology
- 2.3 Market Inclusions and Exclusions
- 2.4 Research Process
- 2.4.1 Primary Research and Expert Interviews
- 2.4.2 Secondary Research and Source Review
- 2.4.3 Top-Down and Bottom-Up Estimation
- 2.4.4 Data Triangulation and Verification
- 2.5 Market Size Measurement Basis
- 2.5.1 2025: USD 435.5 million → 2035: USD 2.07 billion
- 2.6 Historical and Forecast Reference Periods
- 2.6.1 Historical Period: 2018-2025
- 2.6.2 Base Year: 2025
- 2.6.3 Forecast Period: 2025-2035
- 2.7 Research Assumptions and Limitations
Chapter 3 Executive Summary
- 3.1 Market Snapshot and Key Findings
- 3.2 Base-Year Market Size, 2025
- 3.3 Forecast Market Size, 2035
- 3.4 Revenue and Volume Growth Outlook
- 3.5 Key Demand and Supply Indicators
- 3.6 Leading Market Segments
- 3.7 Fastest-Growing Market Opportunities
- 3.8 Regional Performance Highlights
- 3.9 Technology and Industry Transformation
- 3.10 Competitive Landscape Summary
- 3.11 Analyst View and Strategic Implications
Chapter 4 Australia Automotive Telematics Market Trends and Developments
- 4.1 Historical Industry Development, 2018-2025
- 4.2 Recent Market Trends and Developments
- 4.3 Demand and Customer Behavior Trends
- 4.4 Technology and Product Innovation
- 4.5 Artificial Intelligence, Automation and Digitalization
- 4.6 Local Manufacturing and Supply Chain Realignment
- 4.7 Industry Partnerships, Mergers and Acquisitions
- 4.8 Sustainability and Circular Economy Developments
- 4.9 Government and Private Sector Investment Trends
- 4.10 Emerging Business Models and Commercialization
- 4.11 Industry Developments and Announcements
Chapter 5 Australia Automotive Telematics Market Production, Supply and Demand Analysis
- 5.1 Demand Trend and Consumption Analysis, 2018-2025
- 5.2 Demand Forecast, 2025-2035
- 5.3 Production and Output Trend, 2018-2025
- 5.4 Production and Output Forecast, 2025-2035
- 5.5 Installed Capacity and Capacity Utilization
- 5.6 Company-Wise Production Plants and Statistics
- 5.6.1 Installed Production Capacity
- 5.6.2 Actual Production
- 5.6.3 Planned Capacity and Expansion Targets
- 5.7 Supply Chain Structure and Procurement Trends
- 5.8 Supply-Demand Gap and Bottlenecks
- 5.9 Import Dependence and Sourcing Structure
- 5.10 Contract Manufacturing and Outsourcing
- 5.11 Regional Supply and Demand Concentration
Chapter 6 Australia Automotive Telematics Market Pricing Analysis
- 6.1 Pricing Structure and Measurement
- 6.2 Historical Pricing Trends, 2018-2025
- 6.3 Pricing Outlook, 2025-2035
- 6.4 Average Selling Price and Unit Economics
- 6.5 Pricing by Product and Market Segment
- 6.6 Geographic Pricing Differences
- 6.7 Key Input, Energy, Labor and Logistics Costs
- 6.8 Contract Pricing and Purchasing Models
- 6.9 Pricing Sensitivity and Competitive Positioning
- 6.10 Price, Margin and Profitability Implications
Chapter 7 Australia Automotive Telematics Market Dynamics
- 7.1 Market Growth Drivers
- 7.1.1 Demand-Side Drivers
- 7.1.2 Technology and Innovation Drivers
- 7.1.3 Infrastructure and Investment Drivers
- 7.1.4 Regulatory and Policy Drivers
- 7.2 Market Restraints
- 7.2.1 Cost and Affordability Constraints
- 7.2.2 Technology and Adoption Barriers
- 7.2.3 Supply Chain and Operational Constraints
- 7.3 Market Challenges
- 7.3.1 Competitive Pressure and Margin Erosion
- 7.3.2 Skills, Infrastructure and Implementation Gaps
- 7.4 Emerging Market Opportunities
- 7.5 Market Dynamics Impact and Time-Horizon Assessment
Chapter 8 Australia Automotive Telematics Value Chain Analysis
- 8.1 Industry Value Chain Overview
- 8.2 Upstream Suppliers and Critical Inputs
- 8.3 Technology and Component Providers
- 8.4 Manufacturing or Service Delivery
- 8.5 Distribution, Channel Partners and Integrators
- 8.6 Downstream Applications and End Users
- 8.7 Value Addition and Profit Pools
- 8.8 Vertical Integration and Outsourcing
- 8.9 Supplier Concentration and Risk
- 8.10 Supply Chain Localization and Resilience
Chapter 9 Australia Automotive Telematics Market Regulations and Policies
- 9.1 Relevant Laws, Standards and Compliance Frameworks
- 9.2 Product, Service, Safety and Quality Requirements
- 9.3 Government Policies, Incentives and Subsidies
- 9.4 Imports, Exports and Trade Barriers
- 9.5 Public Procurement and Local Content Requirements
- 9.6 Environmental and Sustainability Compliance
- 9.7 Upcoming Policy Changes and Market Implications
Chapter 10 Australia Automotive Telematics Market Hotspots and Opportunities
- 10.1 Market Opportunity Mapping and Growth Hotspots
- 10.2 High-Growth Applications and Customer Groups
- 10.3 Underserved Markets and White-Space Opportunities
- 10.4 Emerging Technology and Product Opportunities
- 10.5 New Capacity and Investment Hotspots
- 10.6 Market Entry and Expansion Opportunities
- 10.7 Distribution and Partnership Opportunities
- 10.8 Near-Term and Long-Term Commercial Potential
- 10.9 Opportunity Attractiveness and Execution Risks
Chapter 11 Australia Automotive Telematics Market Outlook, 2025-2035
- 11.1 Market Size and Analysis
- 11.1.1 Revenue (Market Measurement: 2025: USD 435.5 million → 2035: USD 2.07 billion)
- 11.1.2 Market Volume and Quantity Sold
- 11.1.3 Historical Market Size, 2018-2025
- 11.1.4 Base-Year Market Size, 2025
- 11.2 Market Forecast, 2025-2035
- 11.2.1 Revenue Forecast to 2035
- 11.2.2 Volume Forecast to 2035
- 11.2.3 CAGR and Year-on-Year Growth
- 11.2.4 Incremental Revenue Opportunity
- 11.3 Forecast Assumptions and Scenario Analysis
- 11.3.1 Base-Case Forecast
- 11.3.2 Optimistic and Conservative Scenarios
- 11.3.3 Technology, Pricing and Policy Sensitivities
- 11.4 Market Attractiveness and Growth Outlook
Chapter 12 Australia Automotive Telematics Market Segmentation and Outlook
- 12.1 Segmentation Summary and Market Shares, 2025
- 12.2 Largest and Fastest-Growing Segments
- 12.3 By Service Type - Market Size and Forecast, 2025-2035
- 12.3.1 Segment Definition and Scope
- 12.3.2 Historical Market Size, 2018-2025
- 12.3.3 Revenue Forecast, 2025-2035
- 12.3.4 Volume Forecast, 2025-2035
- 12.3.5 Base-Year Market Share, 2025
- 12.3.6 Segment CAGR and Growth Drivers
- 12.3.7 Subsegment Market Size and Forecast
- 12.3.7.1 Fleet Management Services
- 12.3.7.2 Embedded Connected Services
- 12.3.7.3 Insurance Telematics Services
- 12.3.7.4 Stolen Vehicle Recovery Services
- 12.3.8 Subsegment Pricing and Adoption Trends
- 12.3.9 Leading Suppliers and Competition
- 12.3.10 Regional Demand and Opportunities
- 12.4 By Vehicle Type - Market Size and Forecast, 2025-2035
- 12.4.1 Segment Definition and Scope
- 12.4.2 Historical Market Size, 2018-2025
- 12.4.3 Revenue Forecast, 2025-2035
- 12.4.4 Volume Forecast, 2025-2035
- 12.4.5 Base-Year Market Share, 2025
- 12.4.6 Segment CAGR and Growth Drivers
- 12.4.7 Subsegment Market Size and Forecast
- 12.4.7.1 Heavy Commercial Vehicles
- 12.4.7.2 Light Commercial Vehicles
- 12.4.7.3 Passenger Vehicles
- 12.4.8 Subsegment Pricing and Adoption Trends
- 12.4.9 Leading Suppliers and Competition
- 12.4.10 Regional Demand and Opportunities
- 12.5 By Customer Type - Market Size and Forecast, 2025-2035
- 12.5.1 Segment Definition and Scope
- 12.5.2 Historical Market Size, 2018-2025
- 12.5.3 Revenue Forecast, 2025-2035
- 12.5.4 Volume Forecast, 2025-2035
- 12.5.5 Base-Year Market Share, 2025
- 12.5.6 Segment CAGR and Growth Drivers
- 12.5.7 Subsegment Market Size and Forecast
- 12.5.7.1 Transport Fleet Operators
- 12.5.7.2 Enterprise Fleet Owners
- 12.5.7.3 Government Fleet Owners
- 12.5.7.4 Individual Vehicle Owners
- 12.5.8 Subsegment Pricing and Adoption Trends
- 12.5.9 Leading Suppliers and Competition
- 12.5.10 Regional Demand and Opportunities
- 12.6 By Technology - Market Size and Forecast, 2025-2035
- 12.6.1 Segment Definition and Scope
- 12.6.2 Historical Market Size, 2018-2025
- 12.6.3 Revenue Forecast, 2025-2035
- 12.6.4 Volume Forecast, 2025-2035
- 12.6.5 Base-Year Market Share, 2025
- 12.6.6 Segment CAGR and Growth Drivers
- 12.6.7 Subsegment Market Size and Forecast
- 12.6.7.1 Aftermarket Device Platforms
- 12.6.7.2 Embedded Vehicle Platforms
- 12.6.7.3 Smartphone-Led Platforms
- 12.6.8 Subsegment Pricing and Adoption Trends
- 12.6.9 Leading Suppliers and Competition
- 12.6.10 Regional Demand and Opportunities
- 12.7 Segment Growth Comparison
- 12.8 Segment Attractiveness and Priority Matrix
Chapter 13 Australia Automotive Telematics End-Use and Application Market Outlook
- 13.1 End-Use Industry and Customer Demand Structure
- 13.2 Leading Applications and Customer Groups
- 13.3 End-Use Market Size, Share and Forecast
- 13.4 Major End-Use Industry Deep Dives
- 13.4.1 Customer Requirements and Use Cases
- 13.4.2 Demand and Replacement Cycles
- 13.4.3 Technical and Regulatory Considerations
- 13.4.4 Purchasing and Procurement Models
- 13.4.5 Leading Vendors and Distribution Channels
- 13.4.6 Forecast and Commercial Opportunities
- 13.5 Emerging Applications and Cross-Segment Demand
- 13.6 End-Use Industry Investment Priorities
Chapter 14 Australia Automotive Telematics Geographic Market Outlook, 2025-2035
- 14.1 Domestic Market Distribution and Demand Clusters
- 14.2 State- or Province-Wise Market Size and Forecast, 2025-2035
- 14.3 City and Metropolitan Market Outlook
- 14.4 Industrial, Manufacturing and Commercial Clusters
- 14.5 Geographic Concentration of Key End Users
- 14.6 Local Pricing and Purchasing Differences
- 14.7 Domestic Production Facilities and Capacity Map
- 14.8 Local Infrastructure and Project Pipeline
- 14.9 State-Level Policy and Incentive Differences
- 14.10 Subnational Investment Hotspots and Opportunities
- 14.11 Distribution and Logistics Networks
- 14.12 Domestic Competitive Footprint
Chapter 15 Australia Automotive Telematics Technology, Innovation and Sustainability Outlook
- 15.1 Technology Landscape and Maturity
- 15.2 Product, Process and Service Innovation
- 15.3 AI, Automation and Digital Tools in the Industry
- 15.4 Technology Adoption and Performance Benchmarking
- 15.5 Innovation Pipeline and R&D Investment
- 15.6 Patent and Intellectual Property Trends
- 15.7 Energy Efficiency and Resource Management
- 15.8 Sustainability, Recycling and Circularity
- 15.9 Technology Roadmap, 2025-2035
- 15.10 Risks of Obsolescence and Technology Substitution
Chapter 16 Australia Automotive Telematics Market Key Strategic Imperatives
- 16.1 Growth and Market Entry Priorities
- 16.2 High-Return Products and Segments
- 16.3 Pricing, Profitability and Cost Optimization
- 16.4 Technology Investment and Product Differentiation
- 16.5 Supply Chain Localization and Resilience
- 16.6 Distribution and Customer Acquisition
- 16.7 Partnership, Acquisition and Capacity Strategy
- 16.8 Regional Expansion Priorities
- 16.9 Short-, Medium- and Long-Term Actions
Chapter 17 Competition Outlook
- 17.1 Industry Competition Characteristics
- 17.2 Market Structure and Concentration
- 17.3 Market Share and Competitive Positioning, 2025
- 17.4 Company-Wise Revenue and Product Benchmarking
- 17.5 Production and Service Capacity Benchmarking
- 17.6 Technology, Pricing and Differentiation
- 17.7 Regional Footprint and Distribution Strength
- 17.8 Mergers, Acquisitions and Strategic Alliances
- 17.9 New Entrants and Competitive Threats
- 17.10 Porter's Five Forces and Industry Attractiveness
- 17.11 Competitive Outlook, 2025-2035
Chapter 18 Company Profiles
- 18.1 Company Coverage and Selection Criteria
- 18.2 Teletrac Navman
- 18.2.1 Business Description
- 18.2.2 Company Ownership and Geographic Presence
- 18.2.3 Product and Service Portfolio
- 18.2.4 Manufacturing and Operating Footprint
- 18.2.5 Production Capacity and Expansion Plans
- 18.2.6 Financial Performance and Investment
- 18.2.7 Market Share and Competitive Position
- 18.2.8 Technology and Innovation Capabilities
- 18.2.9 Strategic Alliances or Partnerships
- 18.2.10 Recent Developments
- 18.2.11 Growth Strategy and Outlook
- 18.3 EROAD
- 18.4 Geotab
- 18.5 MTData
- 18.6 MiX by Powerfleet
- 18.7 IntelliTrac
- 18.8 Netstar Australia
- 18.9 Linxio
- 18.10 Ctrack
- 18.11 V-DAQ
- 18.12 Other Relevant Market Participants
Note: Every listed company is profiled on the structure shown under the first company. The company list is preliminary and may change based on research findings, market developments, data availability and client requirements.
Chapter 19 Disclaimer
- 19.1 Research and Forecast Disclaimer
- 19.2 Data Source and Estimation Limitations
Note: The depth of individual sections depends on data availability for this market. Volume, capacity, trade and other unit-based metrics are included where applicable.

