
Local carmakers and fleet renewal anchor vehicle demand
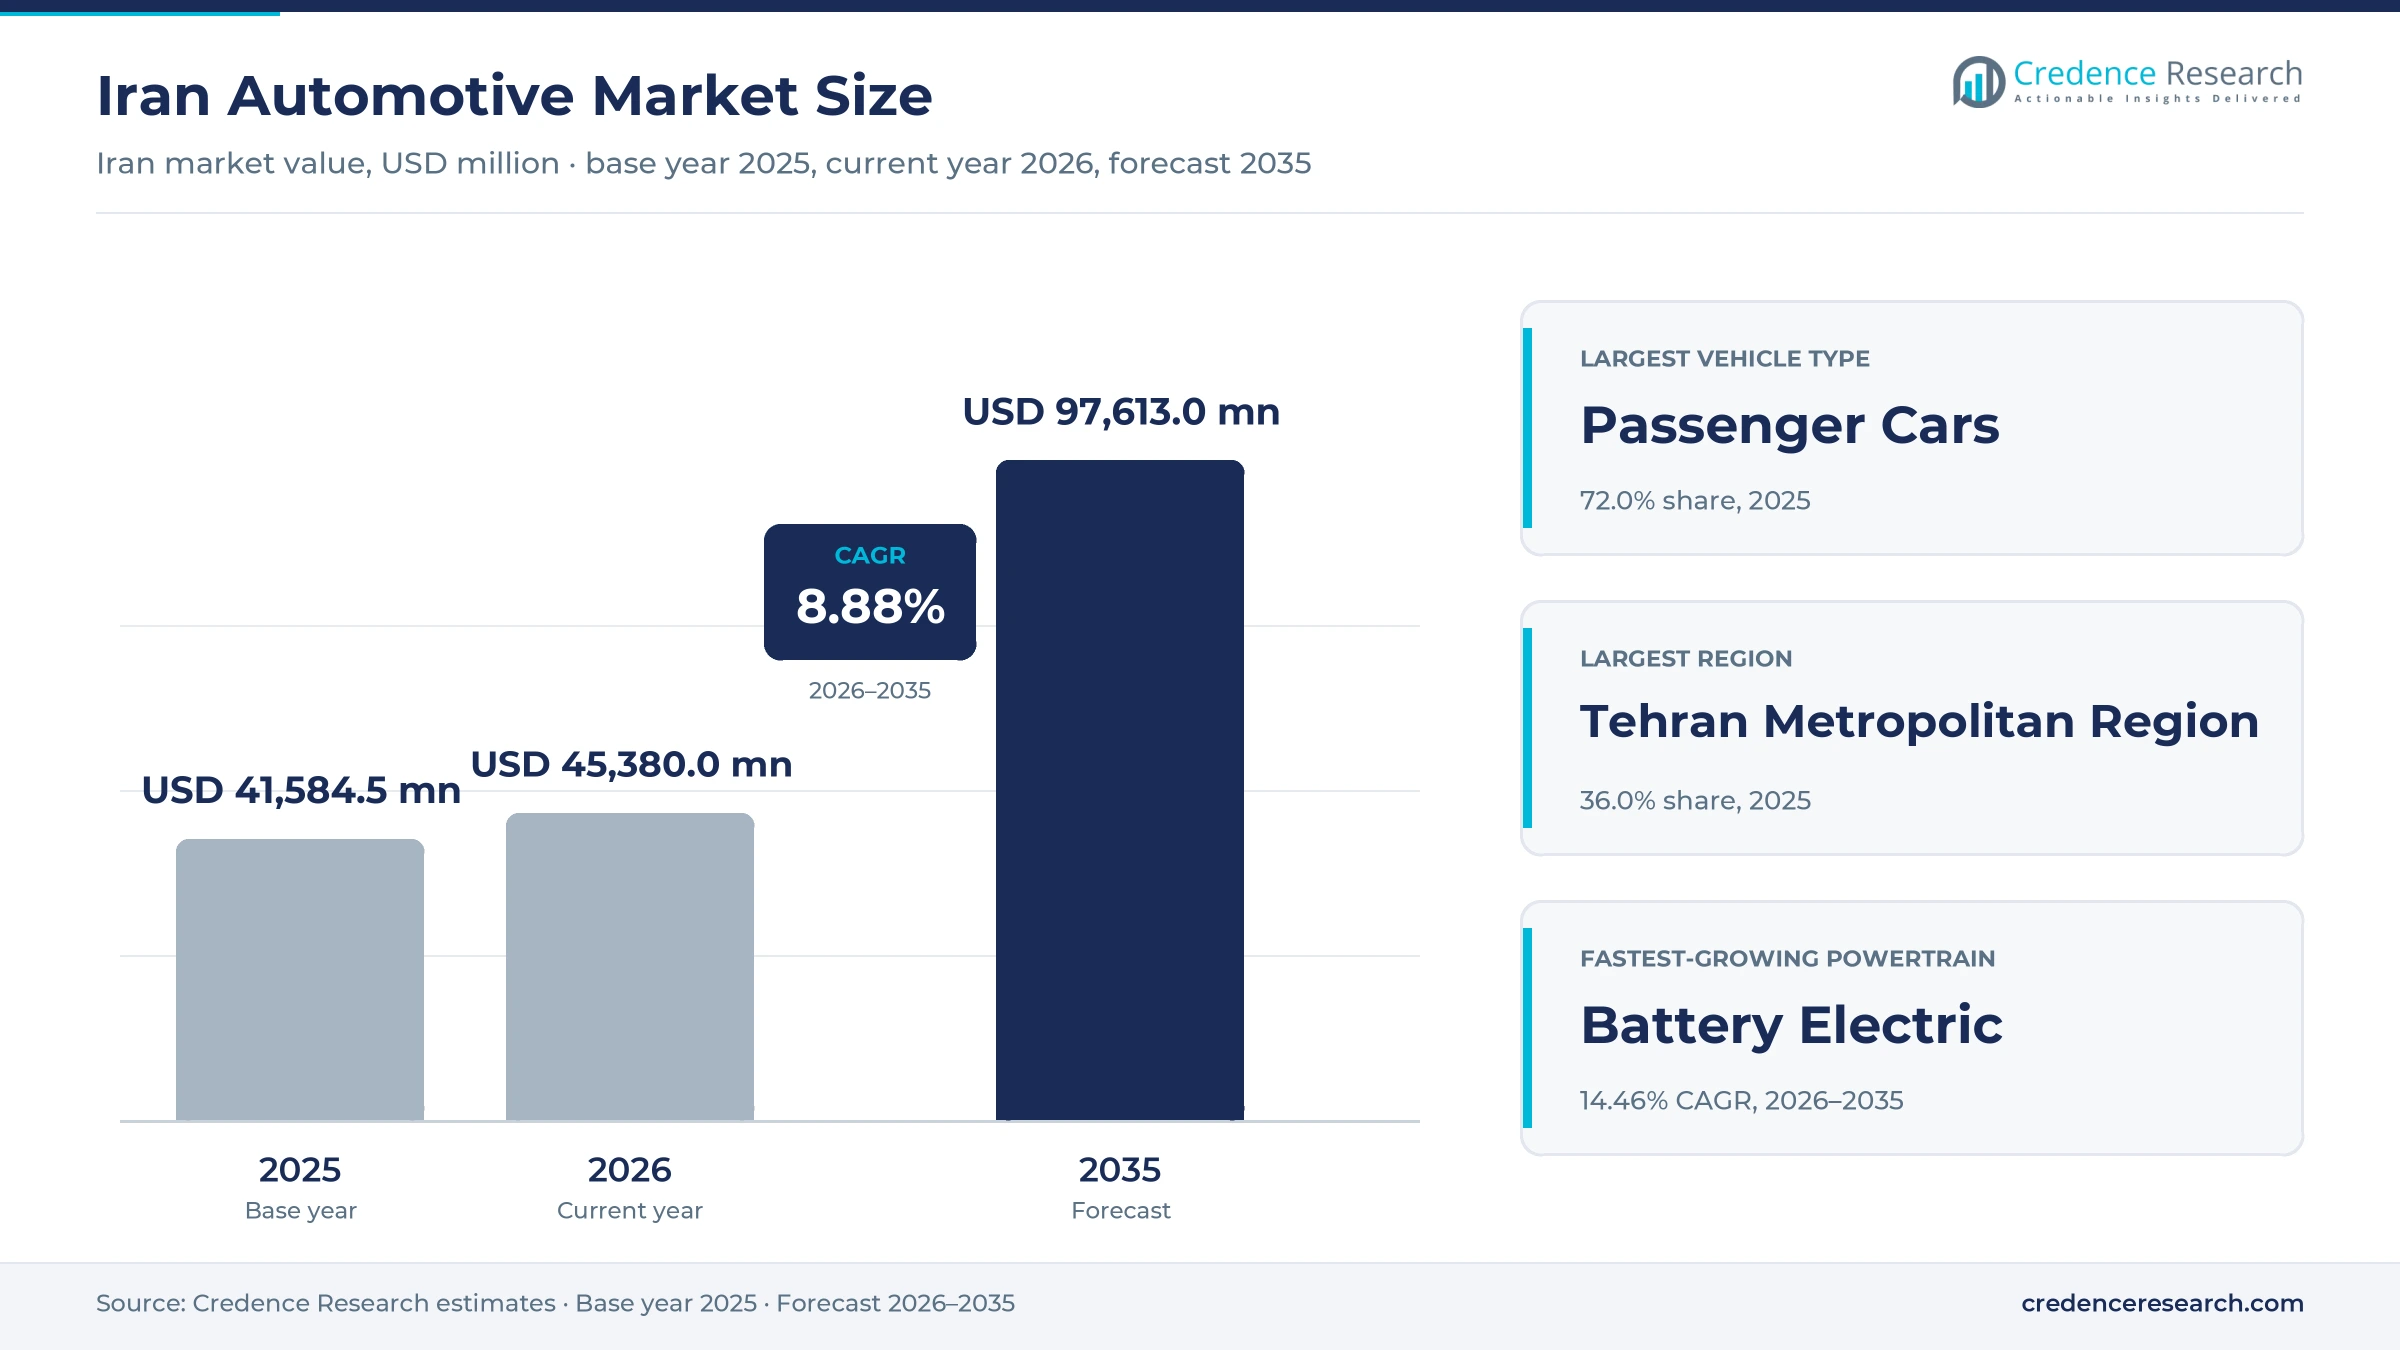
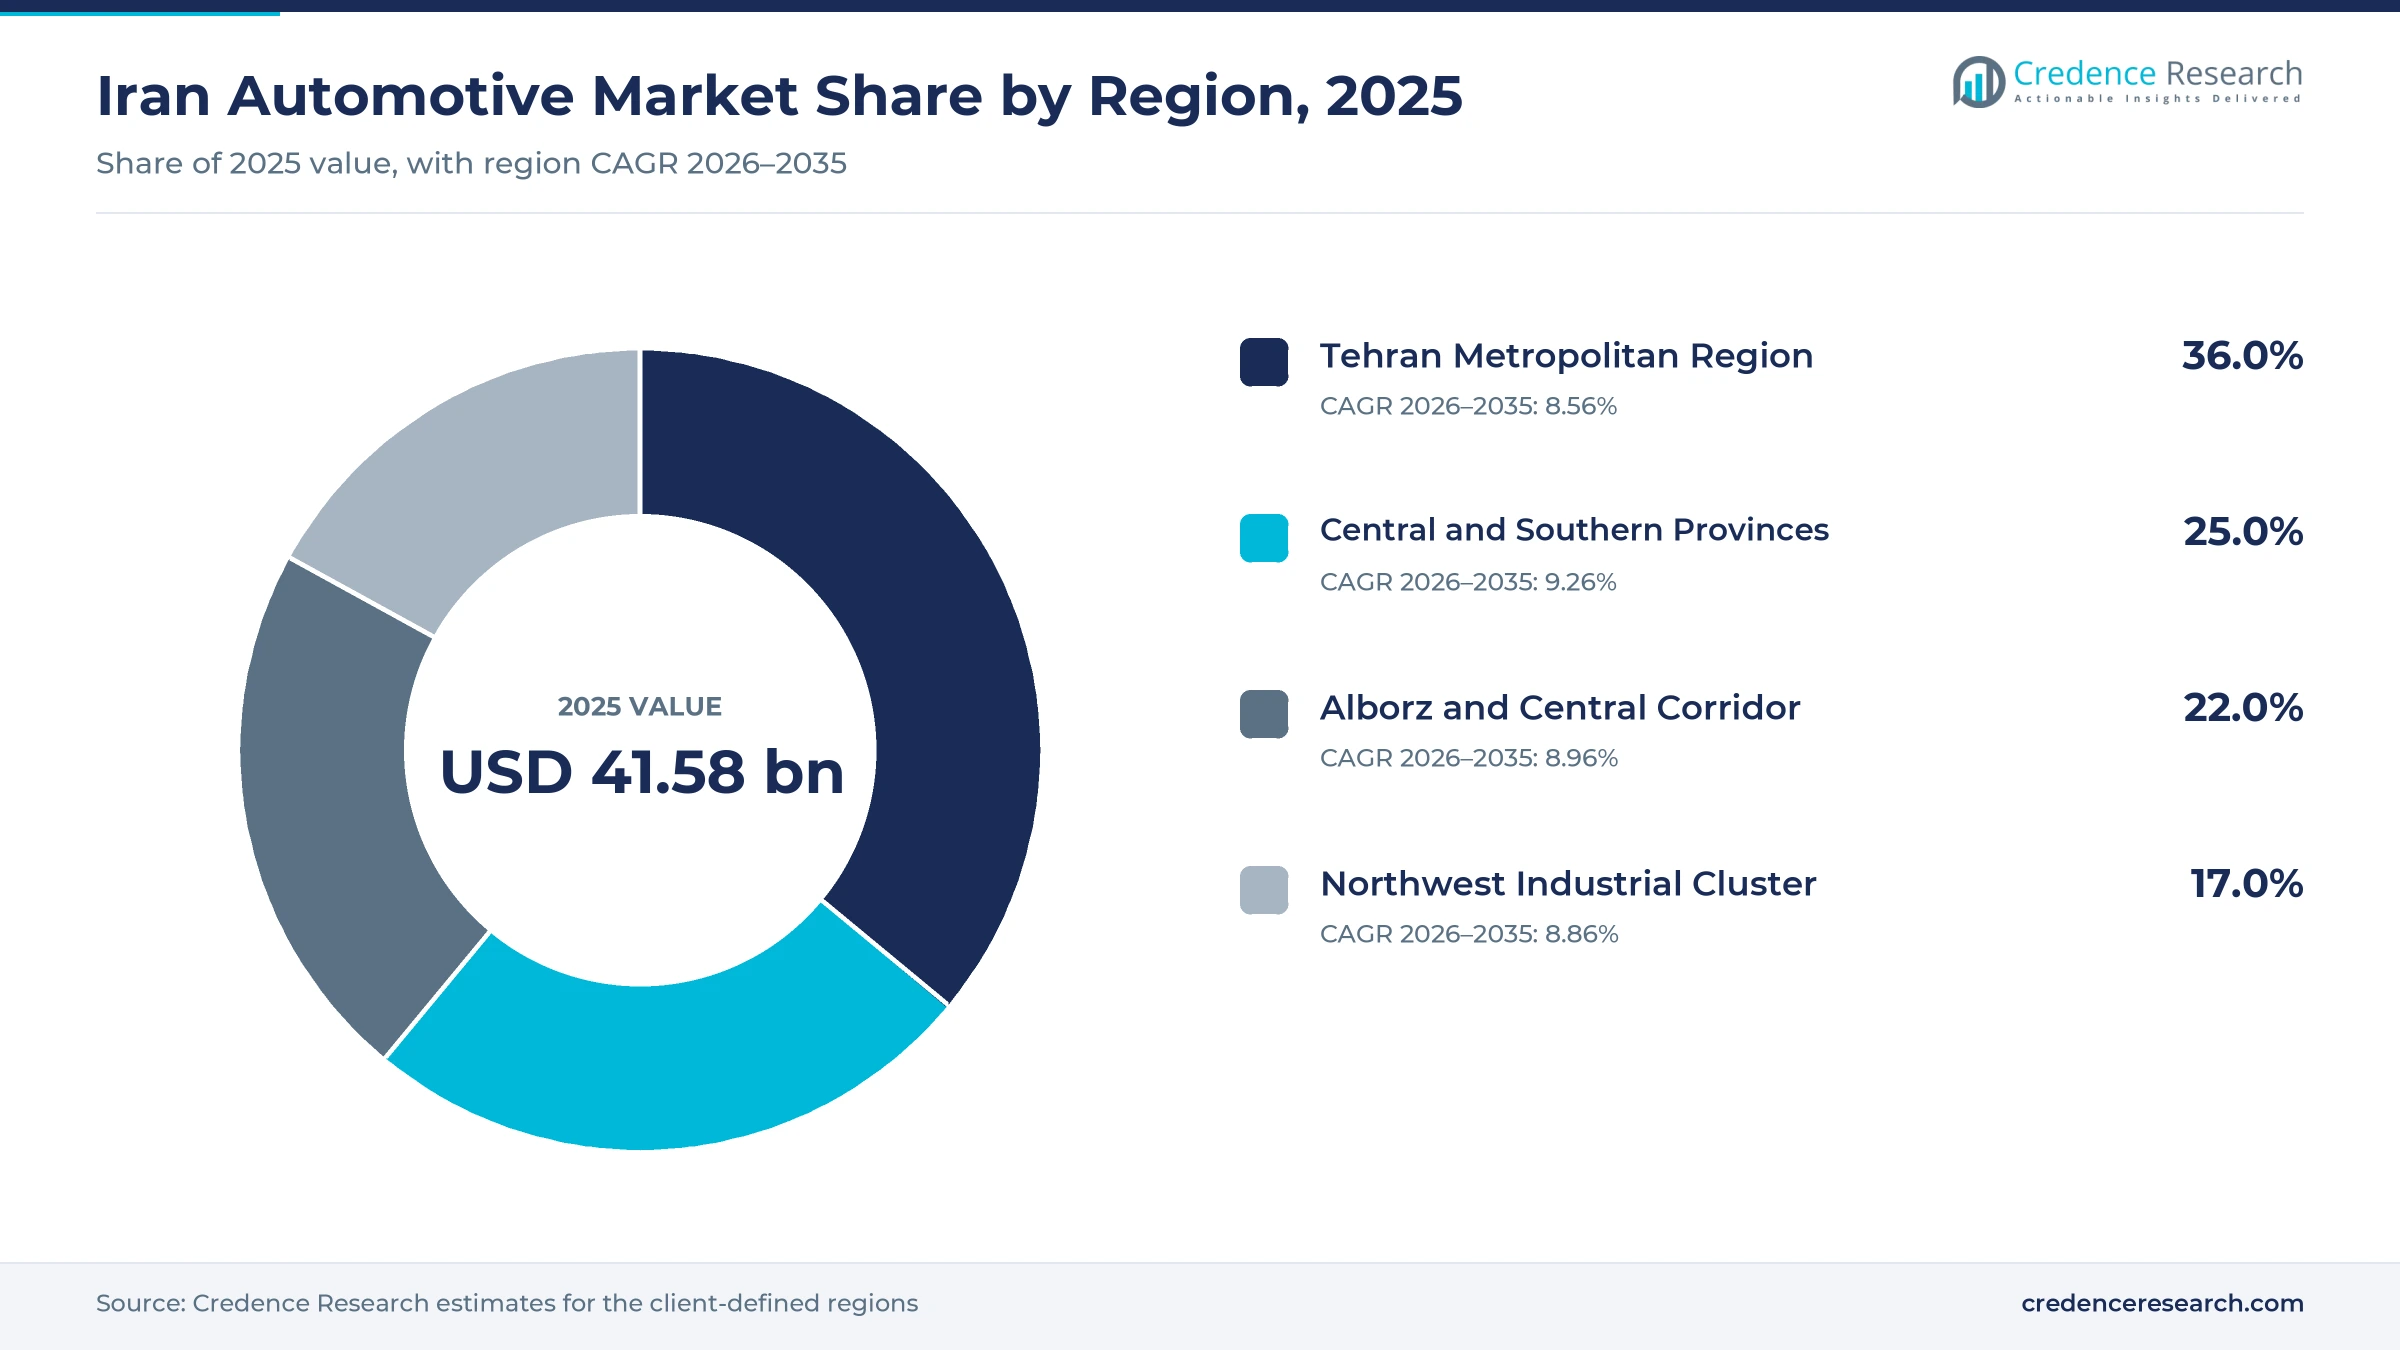
The Iran automotive market was valued at USD 41.58 billion in 2025 and is projected to increase from USD 45.38 billion in 2026 to USD 97.61 billion by 2035, registering a CAGR of 8.88% during 2026–2035. Demand comes from households replacing older cars, ride-hailing and taxi fleets, goods carriers and public agencies that buy locally assembled passenger cars, pickups, trucks, buses and motorcycles. The Tehran Metropolitan Region held the largest regional share, 36.0% in 2025, because the capital area concentrates income, dealer networks and daily commuting. The Central and Southern Provinces region is the fastest-growing region at 9.26% a year, as port trade and provincial cities add commercial and private vehicle demand. In turn, government policy has shifted toward hybrid, dual-fuel and electric vehicles, while a three-tier gasoline pricing system took effect in December 2025 to curb fuel use across the national fleet.
Which vehicles and buyers does the national estimate cover?
The estimate measures the value of new vehicles sold in Iran, including passenger cars, light commercial vehicles, medium and heavy commercial vehicles and two-wheelers. It counts locally built vehicles sold through carmaker allocation schemes, authorized dealers and fleet tenders, as well as brand-new imported vehicles.
The estimate excludes used-vehicle trading, spare parts, repair services and vehicle financing charges. The value chain runs from parts suppliers and assembly plants through carmaker sales platforms and dealers to households, fleet operators and public agencies across the country.
Iran Automotive Market Insights
- The Iran automotive market was valued at USD 41.58 billion in 2025 and is projected to reach USD 97.61 billion by 2035, registering a CAGR of 8.88% during 2026–2035.
- The Tehran Metropolitan Region held a 36.0% share of 2025 value, because the capital area has the densest dealer and commuter base.
- Passenger cars led with a 72.0% share of 2025 value, because private cars remain the main form of household travel in Iranian cities.
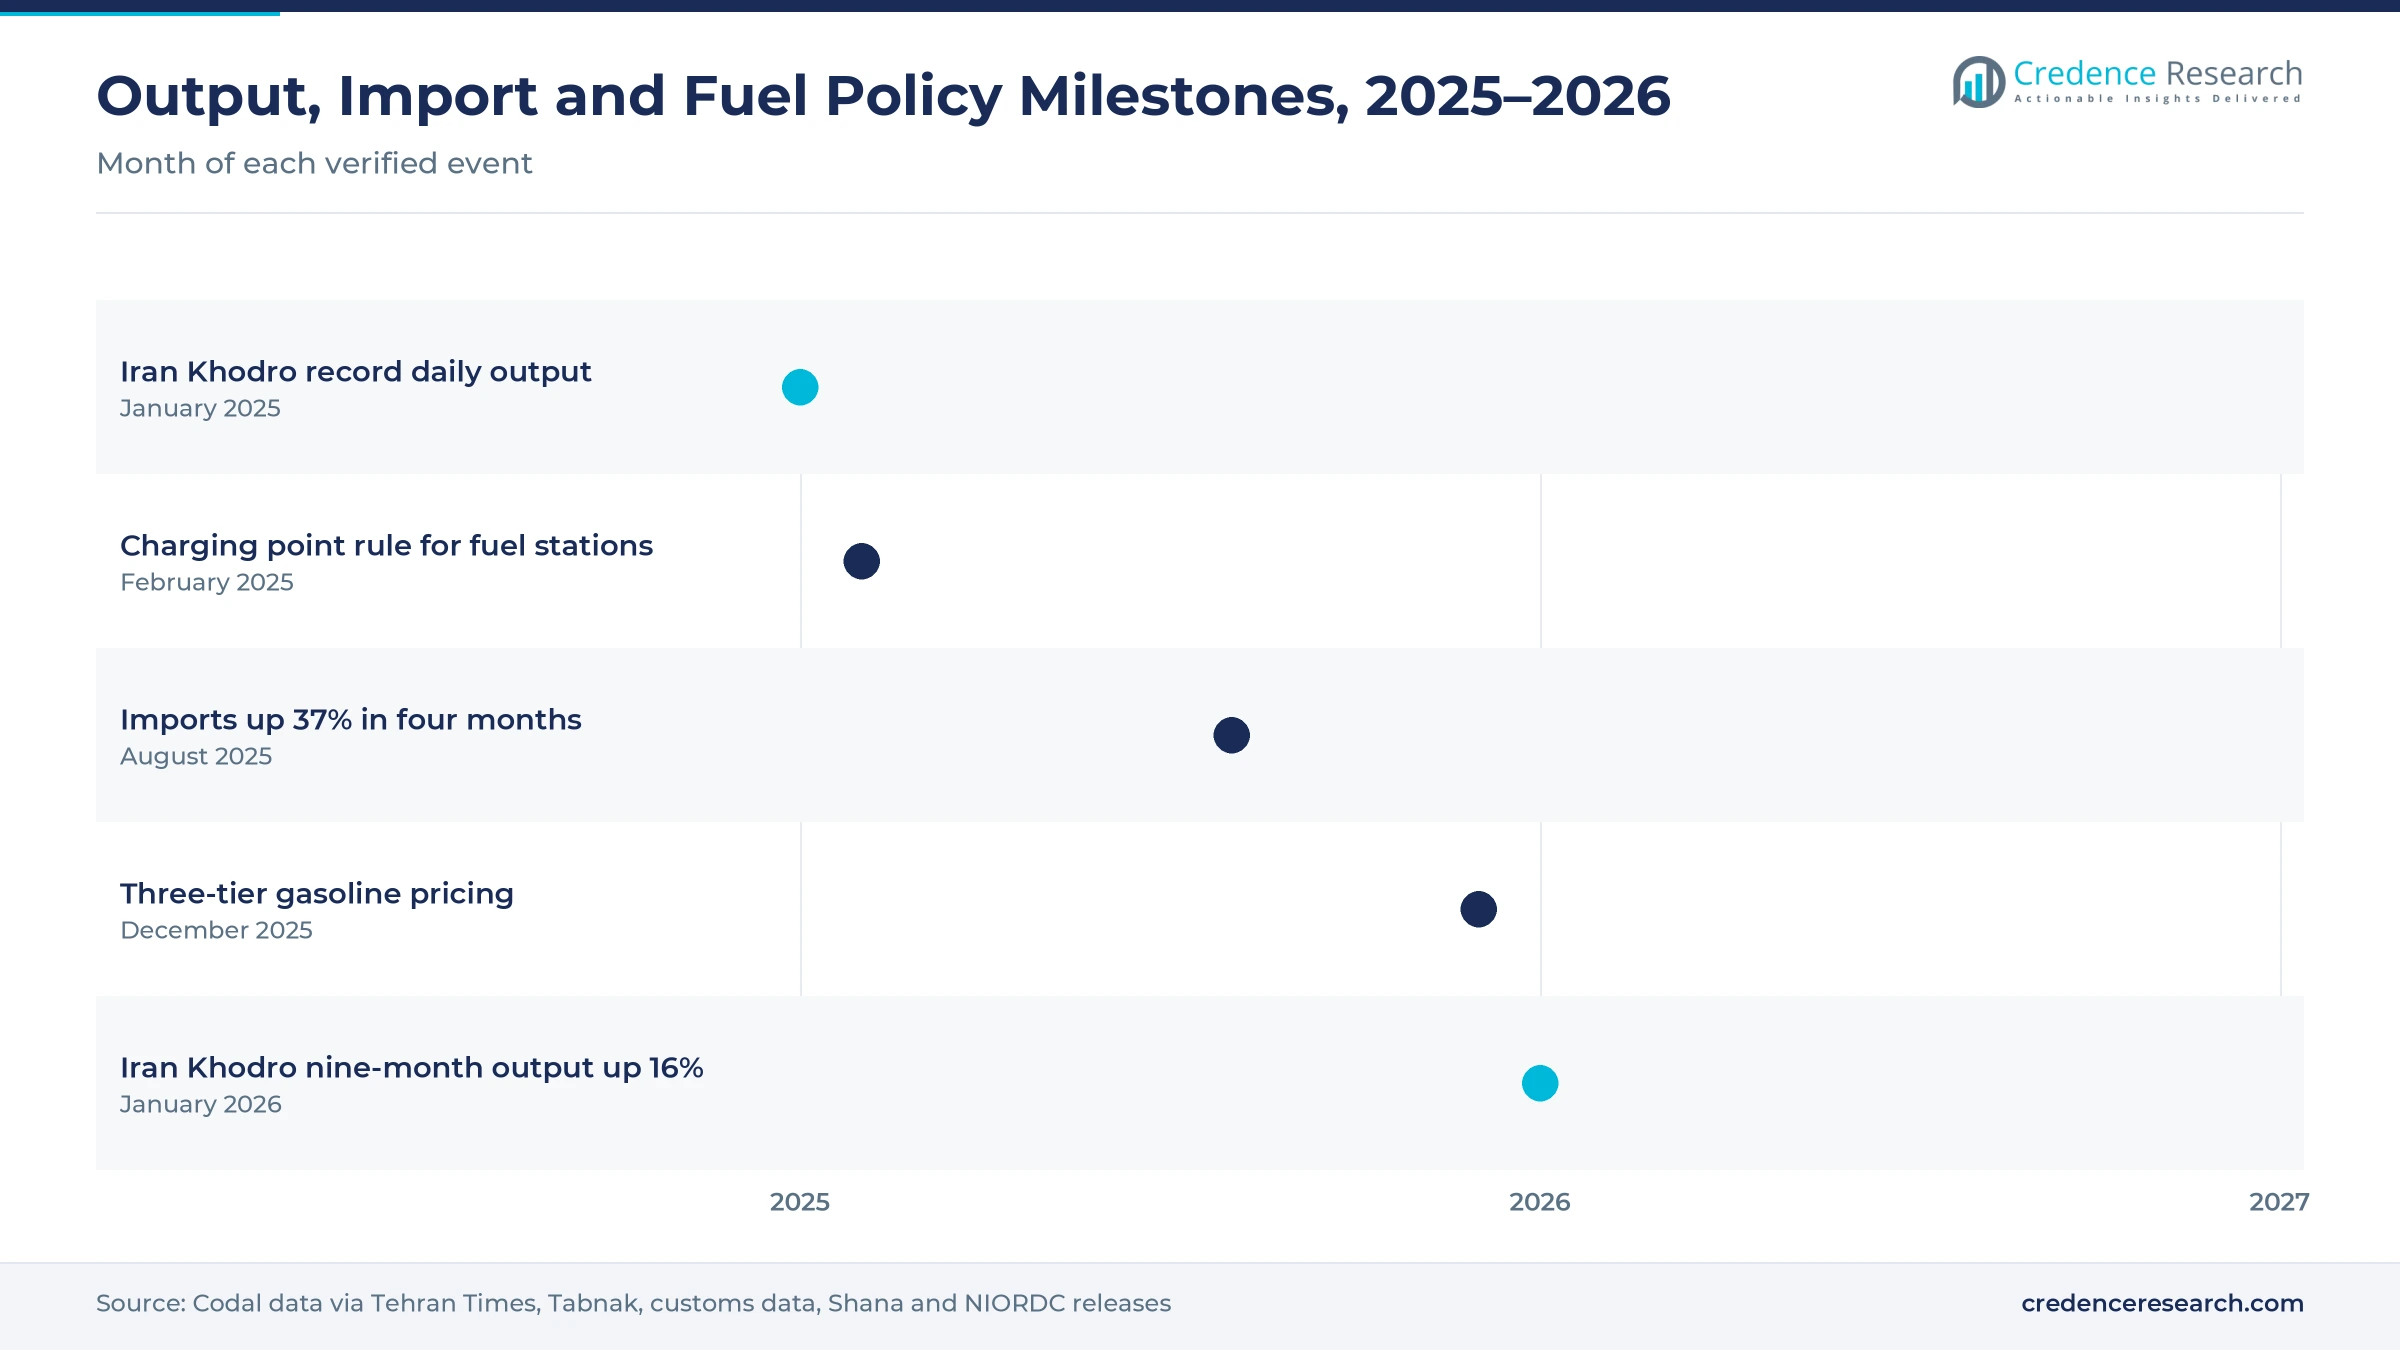
- Iran Khodro produced 2,505 cars on Jan. 25, 2025, a record daily output for the largest carmaker in the country.
- Customs offices cleared 14,287 brand-new imported vehicles in the four months to July 22, 2025, up 37% from a year earlier.
Passenger cars lead as battery electric models grow fastest
Why do passenger cars dominate vehicle sales value?
Based on vehicle type, the market is categorized into passenger cars, light commercial vehicles, medium and heavy commercial vehicles, and two-wheelers. Passenger Cars led with a 72.0% share of 2025 value, because Iran Khodro, SAIPA and Pars Khodro build mostly sedans and hatchbacks for households. Two-Wheelers grow fastest at 9.40% a year, as delivery riders and commuters choose low-cost motorcycles in crowded cities.
How quickly are electrified powertrains gaining ground?
Based on powertrain, the market is categorized into gasoline, diesel and CNG, hybrid electric and battery electric vehicles. Gasoline led with a 74.0% share of 2025 value, because most locally built cars still run on subsidized gasoline. Battery Electric vehicles grow fastest at 14.46% a year, as lower import tariffs and new charging station rules make electric models easier to buy and run.
Which sales channels move most new vehicles?
Based on sales channel, the market is categorized into OEM direct allocation, authorized dealers, fleet and government tenders, and importer and digital channels. OEM Direct Allocation led with a 48.0% share of 2025 value, because carmakers sell much of their output through registration and allocation schemes. Importer and Digital Channels grow fastest at 10.35% a year, as eased import rules bring more foreign brands to buyers.
| Segment Group | Leading Sub-segment | Share, 2025 | Fastest-growing Sub-segment | CAGR, 2026–2035 |
|---|---|---|---|---|
| By Vehicle Type | Passenger Cars | 72.0% | Two-Wheelers | 9.40% |
| By Powertrain | Gasoline | 74.0% | Battery Electric | 14.46% |
| By Sales Channel | OEM Direct Allocation | 48.0% | Importer and Digital Channels | 10.35% |
Request a Free Sample
Fill in your details and we'll send you a free sample report.
- Sample data tables & charts
- Research methodology
Local scale, city demand and fuel policy drive vehicle sales
How does domestic manufacturing scale support vehicle supply?
Domestic manufacturing scale supports vehicle supply, because local plants and suppliers build most of the cars sold in the country. Iranian automotive companies produced 1.335 million vehicles in the calendar year to March 2024, which made Iran the 16th largest car producer in the world. Iran Khodro produced 2,505 cars on Jan. 25, 2025, a record daily output, and 55,000 cars in the month to Jan. 19, according to Tabnak. Iran Khodro then produced 433,292 vehicles in the nine months to Dec. 21, 2025, up 16% from 370,486 a year earlier. As a result, passenger cars hold 72.0% of 2025 value, since local output fills most dealer and allocation orders.
Why do urban mobility and replacement needs lift car demand?
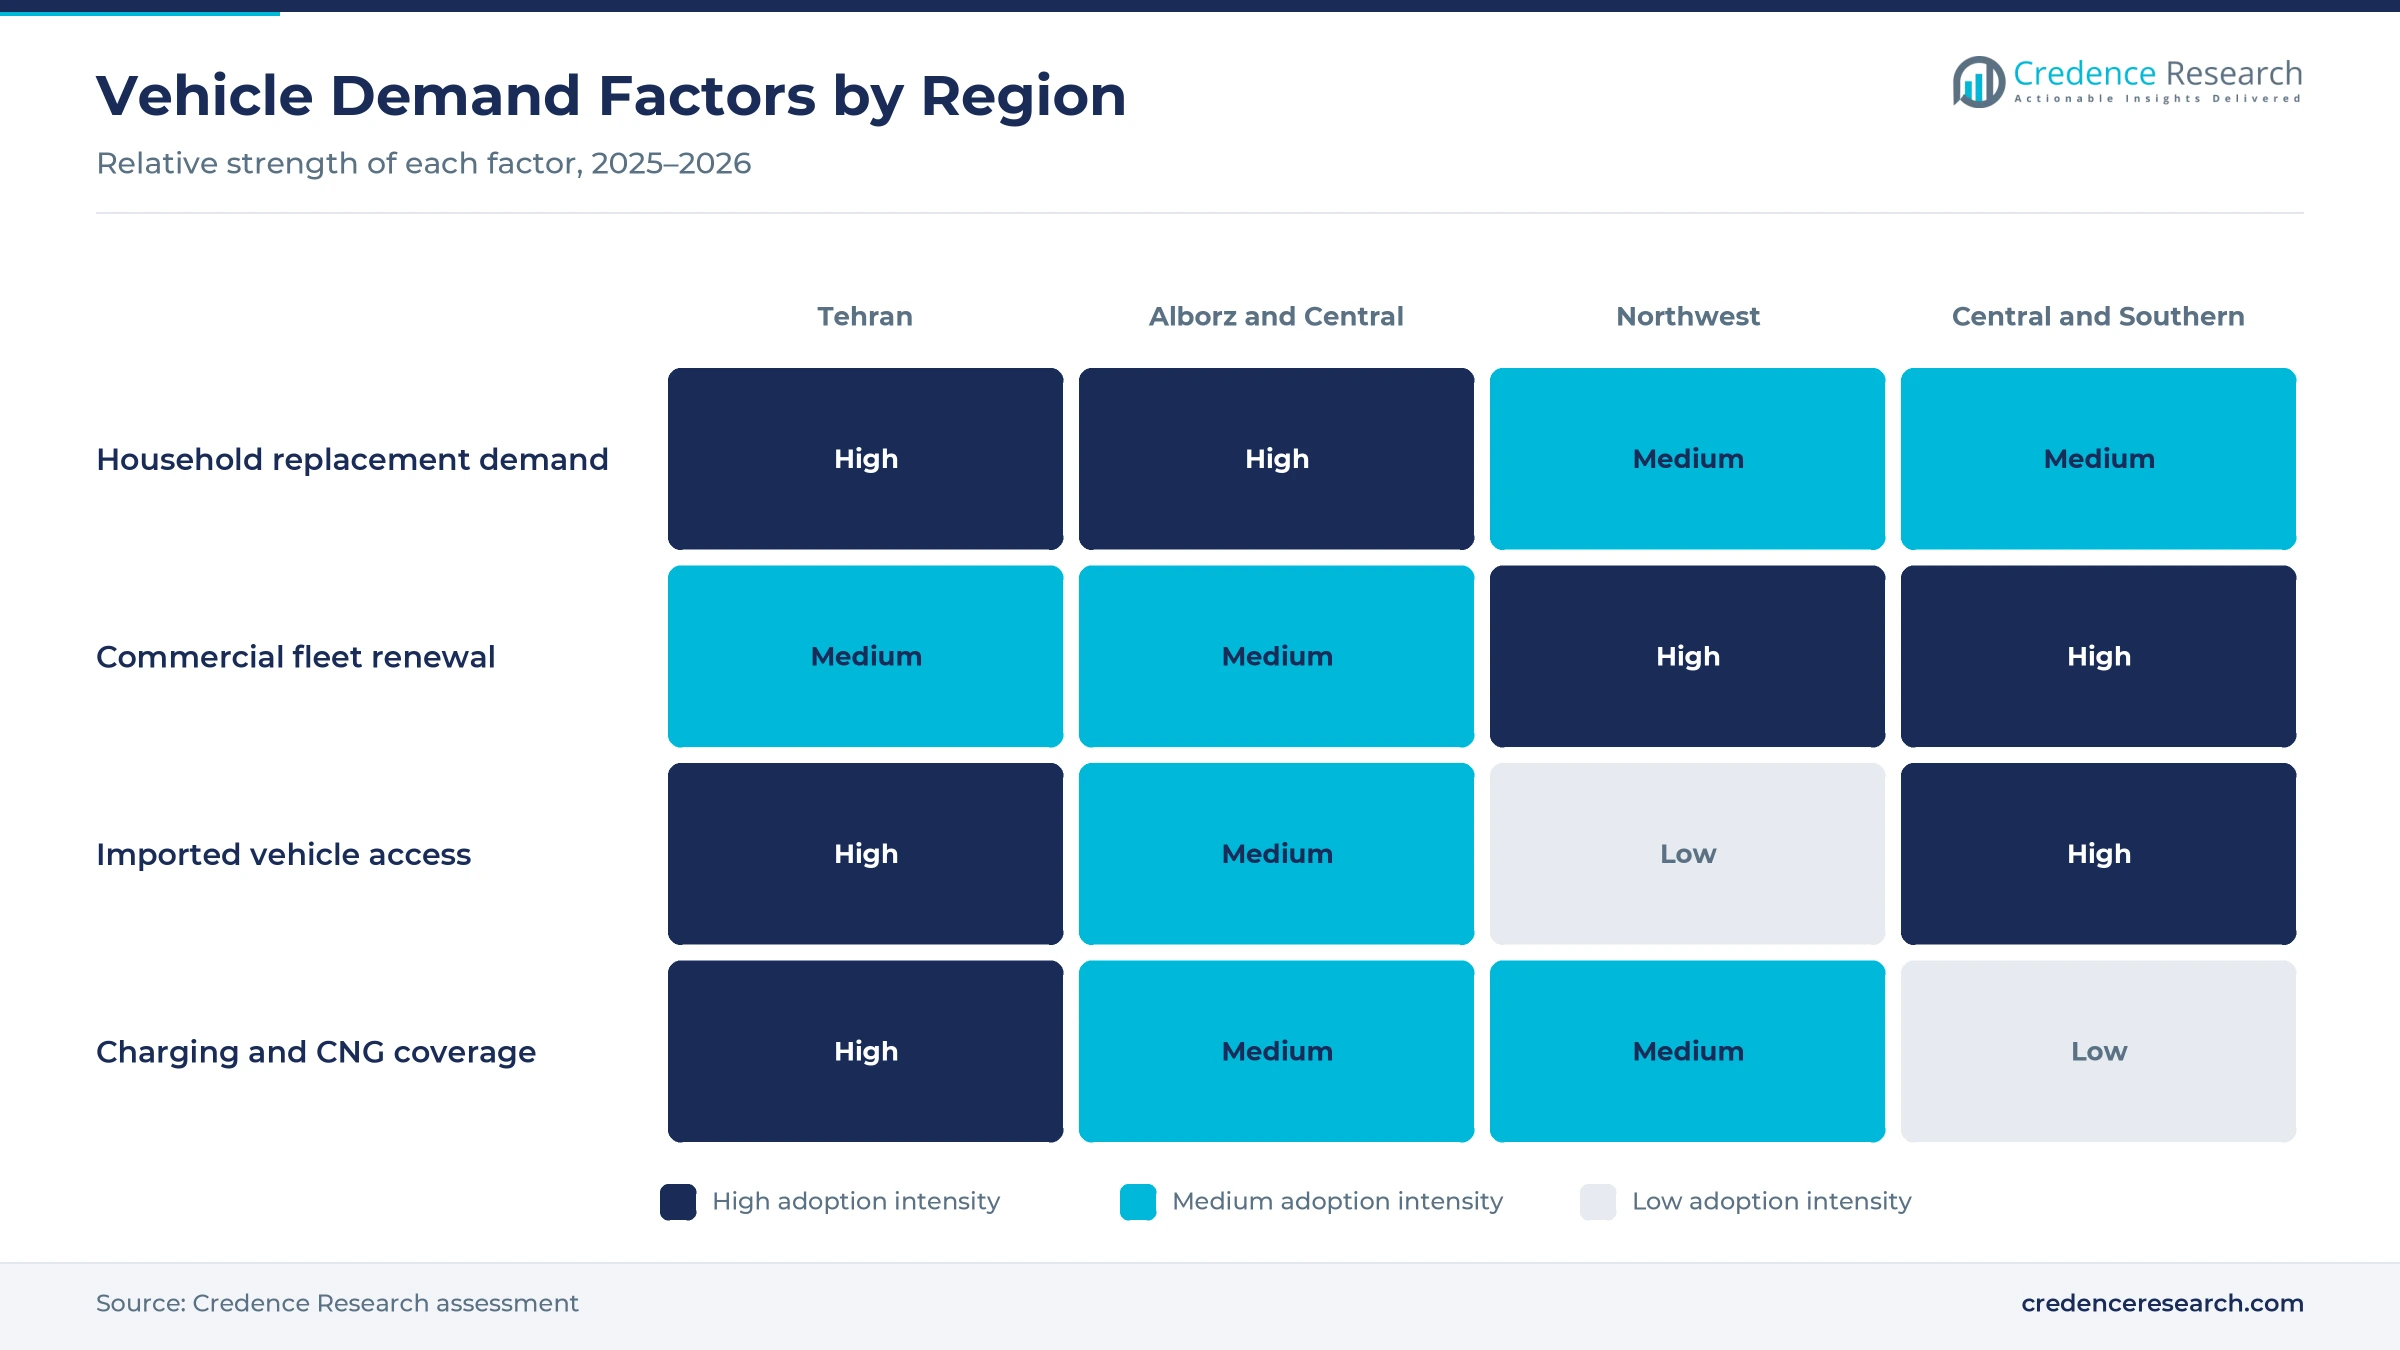
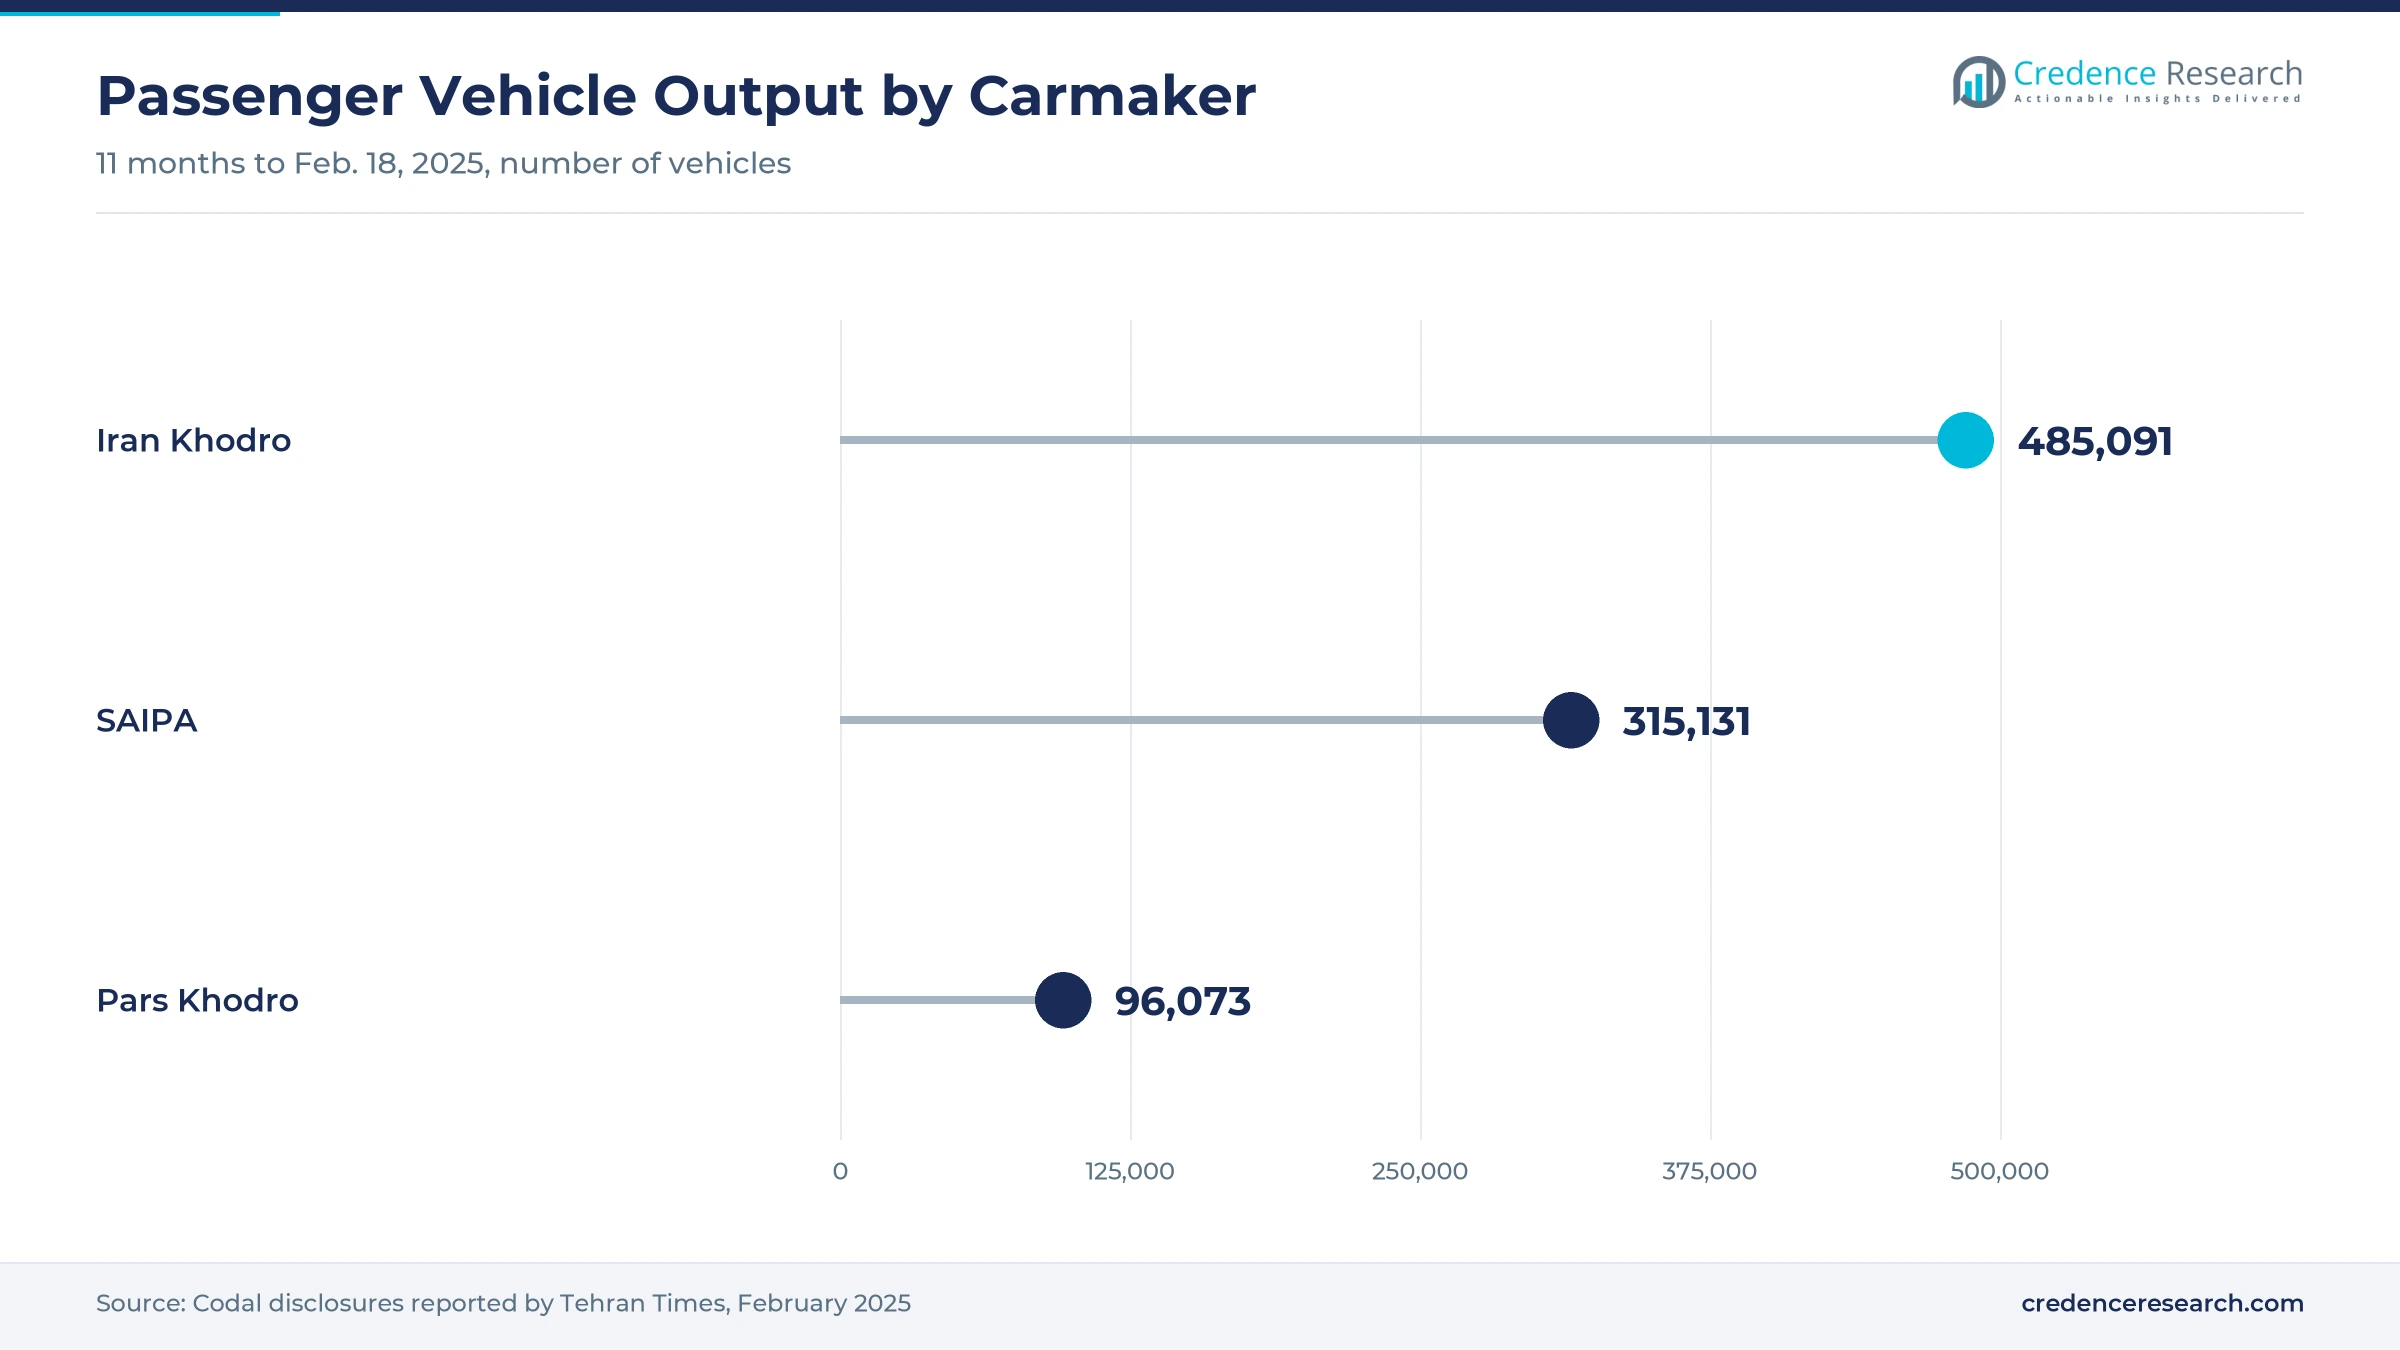
Urban mobility and replacement needs lift car demand, because most Iranians now live in cities where daily commuting depends on private cars and taxis. Urban residents made up 77.4% of the population in 2025, up from 76.7% in 2023, according to the World Bank. The population reached about 92.4 million in 2025, which keeps the pool of potential car buyers large. The three largest carmakers produced 896,295 passenger vehicles in the 11 months to Feb. 18, 2025, as reported by Tehran Times, yet waiting lists for popular models persisted. In turn, the capital region leads national demand, since replacement buying concentrates where commuting distances and household incomes are highest.
How do powertrain diversification and fleet renewal add demand?
Powertrain diversification and fleet renewal add demand, because the government wants cleaner vehicles to cut gasoline use and pollution. Iran has about 2,360 CNG stations with a daily capacity of 40 million cubic meters, while actual use is about 16 million cubic meters, according to Shana. The government signed deals for 55,000 dual-fuel vehicles, including 30,000 Nissan pickup trucks. A three-tier gasoline pricing system took effect in December 2025, which raises the cost of heavy fuel use for older cars. As a result, hybrid and battery electric models gain ground, and battery electric vehicles grow at 14.46% a year, the fastest powertrain rate.
Why do eased import rules widen buyer choice?
Eased import rules widen buyer choice, because the government introduced laws to lower prices and bring more competition to the car market. Customs offices cleared 14,287 brand-new vehicles in the four months to July 22, 2025, up 37% from a year earlier, according to Eghtesad Online. The value of those imports rose nearly 50% to $313 million, and another 10,000 to 13,000 vehicles waited for clearance at the Rajaee and Bahonar ports. Shipments mostly covered passenger cars, including electric vehicles that carry lower tariffs. In turn, importer and digital channels grow at 10.35% a year, the fastest channel rate, as foreign brands add models alongside local output.
Imports, charging rules and hybrid plans reshape the fleet
How is the shift to hybrid and dual-fuel models reshaping output?
The shift to hybrid and dual-fuel models is reshaping carmaker plans, because fuel policy now favors vehicles that burn less gasoline. In July 2026, the government described hybrid, dual-fuel and electric vehicles as its new approach to managing fuel and energy use. President Masoud Pezeshkian urged faster gasoline rationing reforms and higher output of hybrid and dual-fuel vehicles. After the three-tier gasoline pricing system took effect in December 2025, the share of fuel bought with station cards fell from 43% to 25%. Several domestic carmakers already produce electric and hybrid vehicles, although mass production requires large investment. As a result, hybrid electric vehicles gain share from a small base, while CNG and LPG vehicles keep a role in taxi and pickup fleets that run on cheaper natural gas.
Why is the rise of charging points important for electric cars?
The rise of charging points matters for electric cars, because buyers need places to recharge outside their homes. In February 2025, the Economic Council made new and renewed fuel station licenses conditional on space for an electric charging point. Since March 2025, the national refining and distribution company has issued 223 licenses for charging stations at fuel stations, and 27 stations were operating by July 2026. Officials said they expect the share of electricity in the transport energy mix to increase over the coming years. The country already runs about 2,360 CNG stations, which shows how fuel station networks can host alternative fuels. In turn, battery electric vehicles gain a practical base, and city buyers who drive short daily routes can consider electric models with more confidence.
Can commercial vehicle renewal open new fleet sales?
Commercial vehicle renewal can open new fleet sales, because aging trucks, vans and buses raise fuel use and repair costs for operators. The government signed deals for 55,000 dual-fuel vehicles, including 30,000 Nissan pickup trucks, to cut gasoline demand in working fleets. Experts told state media in July 2026 that the aging vehicle fleet is the core challenge, and that it has not been properly addressed in national plans. Free conversion programs for eligible gasoline vehicles also support gas-powered fleets. As a result, light commercial vehicles grow faster than the market average, and demand for commercial vehicles rises among goods carriers and city service operators.
Is there room for motorcycles in congested provincial cities?
Motorcycles have room to grow in congested cities, because riders can move through traffic quickly and spend less on fuel than car owners. A three-tier gasoline pricing system took effect in December 2025, which raises costs for drivers who use large amounts of fuel each month. Urban residents made up 77.4% of the population in 2025, so short trips in dense neighborhoods remain common across provincial capitals. Delivery services also rely on riders for parcels and food orders in crowded districts. In turn, two-wheelers grow at 9.40% a year, the fastest vehicle type rate, and the wider motorcycle and scooter supply base adds low-cost models.
Energy shortfalls, sanctions and an old fleet test makers
How do energy shortfalls disrupt assembly lines?
Energy shortfalls disrupt assembly lines, because plants need steady power, gas and fuel to keep production schedules on track. The head of the industrial development agency said in February 2026 that car output fell 7% in the nine months to Dec. 21, 2025, mainly due to energy supply imbalances. As a result, deliveries slip and waiting lists for popular models grow longer. Carmakers respond by shifting shifts to periods with stable supply and by building parts stock before winter peaks.
Why do sanctions limit parts supply and technology?
Sanctions limit parts supply and technology, because carmakers face restrictions on imported components, tools and foreign partnerships. Iran Khodro reported record daily output in January 2025 despite sanctions on car spares, which shows how much local suppliers now carry. However, shortages of advanced parts still delay new models and electrified powertrains. Carmakers respond by localizing more components and by sourcing kits and technology from partners that remain willing to trade.
How does an aging fleet slow emissions and safety gains?
An aging fleet slows emissions and safety gains, because many older cars stay on the road long after their design life. Experts told state media in July 2026 that fleet aging is the fundamental challenge for fuel consumption and air pollution. In turn, cities face heavy smog and high fuel demand during peak seasons. Policy makers respond with scrappage ideas, dual-fuel conversions and incentives for hybrid and electric replacements that use less gasoline.
Why do high prices and currency swings strain buyers?
High prices and currency swings strain buyers, because vehicle costs rise faster than many household incomes. Local media reported in mid-2025 that demand for domestic brands eased after two leading carmakers raised prices. As a result, some households delay replacement purchases or turn to used cars instead. Carmakers respond with installment plans, simpler trims and allocation schemes that spread deliveries across months, which keeps entry-level models within reach.
Tehran leads as southern provinces post the fastest growth
| Region | Value, 2025 (USD billion) | Share, 2025 | CAGR, 2026–2035 |
|---|---|---|---|
| Tehran Metropolitan Region | 14.97 | 36.0% | 8.56% |
| Central and Southern Provinces | 10.40 | 25.0% | 9.26% |
| Alborz and Central Corridor | 9.15 | 22.0% | 8.96% |
| Northwest Industrial Cluster | 7.07 | 17.0% | 8.86% |
Why does the Tehran Metropolitan Region lead vehicle sales?
The Tehran Metropolitan Region held a 36.0% share of 2025 value and grows at 8.56% a year, because the capital area has the largest concentration of households, dealers and taxi fleets. Commuting distances are long, and private cars remain the main way to reach work. As a result, replacement demand and early electric car buying are strongest here, where fuel stations are most numerous and early charging points are easiest to reach.
How do central and southern provinces add the fastest growth?
The Central and Southern Provinces region held a 25.0% share of 2025 value and grows fastest at 9.26% a year, because large provincial cities and port trade lift demand for cars, pickups and trucks. Imported vehicles enter through the Rajaee and Bahonar ports in southern Iran, which supports dealer stock in nearby provinces. In turn, goods carriers buy more light commercial vehicles for port and city logistics.
What drives demand in the Alborz and Central Corridor?
The Alborz and Central Corridor held a 22.0% share of 2025 value and grows at 8.96% a year, because commuter towns sit along the main road and rail routes west of the capital. Many households travel daily between these towns and Tehran by car. As a result, compact sedans and family hatchbacks sell steadily, while industrial employers add vans and pickups for staff and goods.
How does the Northwest Industrial Cluster support commercial demand?
The Northwest Industrial Cluster held a 17.0% share of 2025 value and grows at 8.86% a year, because industrial towns and overland trade routes need trucks, vans and buses. Industrial employers and freight operators renew vehicles as older units become costly to run. In turn, medium and heavy commercial vehicles and dual-fuel pickups take a larger part of regional sales than the national average.
Output records, import gains and fuel reforms, 2025–2026
| Development | Status and market relevance |
|---|---|
| In January 2025, Iran Khodro announced a record output of 2,505 cars in one day and 55,000 cars in one month. | Shows the scale of domestic supply |
| In February 2025, the Economic Council introduced a rule making fuel station licenses conditional on space for electric charging points. | Builds the base for electric car use |
| In August 2025, the customs chief announced that 14,287 brand-new vehicles were imported in four months, up 37%. | Widens buyer choice and price competition |
| In December 2025, the government introduced a three-tier gasoline pricing system across the country. | Raises costs for heavy fuel users |
| In January 2026, Codal data announced for Iran Khodro showed nine-month output of 433,292 vehicles, up 16% on the year. | Confirms output gains at the largest carmaker |
Dual-fuel kits, hybrid drives and charging points advance
- Dual-fuel CNG systems let cars and pickups switch between gasoline and natural gas, which cuts fuel bills for taxi and delivery fleets and draws on about 2,360 CNG stations nationwide.
- Hybrid electric drives pair small engines with batteries and motors, which lowers gasoline use in city traffic and fits the government plan to reduce fuel imports over time.
- Electric charging points at fuel stations give battery electric car owners places to recharge on daily routes, with 223 licenses issued since March 2025 and 27 stations in operation by July 2026.
Need a Custom Version of This Report?
Tailor the scope, geography, or segments to your exact requirements.
- Custom geography or segment scope
- Direct access to our analyst team
Iran Khodro and SAIPA set the pace for domestic supply
Competition is led by two large domestic groups and a set of private and commercial vehicle makers. Iran Khodro produced 485,091 vehicles in the 11 months to Feb. 18, 2025, including Peugeot, Suren, Dena, Tara and Rana models. SAIPA produced 315,131 vehicles in the same period, led by the X200 family of Tiba, Quick and Saina models and the Shahin sedan. Pars Khodro, a SAIPA subsidiary, produced about 96,000 vehicles, helped by higher Sahand output. Iran Khodro then grew output 16% in the nine months to Dec. 21, 2025, while SAIPA and Pars Khodro declined. Private makers and importers compete on Chinese-sourced models, electric cars and commercial vehicles. Rivals compete on price, delivery time, model range, fuel efficiency and after-sales service, and output stability has become a key advantage as energy supply problems disrupt production.
Which carmakers lead domestic vehicle output in Iran?
| Company | Type | Role in the market |
|---|---|---|
| Iran Khodro | Largest domestic carmaker | Produced 485,091 vehicles in the 11 months to Feb. 18, 2025, and grew nine-month output 16% in 2025 |
| SAIPA | Second-largest domestic carmaker | Produced 315,131 vehicles in the 11 months to Feb. 18, 2025, led by the X200 family |
| Pars Khodro | SAIPA subsidiary carmaker | Produced about 96,000 vehicles in the same period, with Sahand output rising to 13,295 units |
Credence Research view on Iranian vehicle demand
Credence Research's view is that Iranian vehicle demand will keep growing because a large urban population, an old fleet and new fuel policies all push buyers toward replacement cars. Passenger cars remain the largest value pool, while battery electric and hybrid models add the fastest growth from a small base. Eased import rules widen buyer choice and put pressure on local car prices. Carmakers that secure stable energy supply, localize parts and add efficient powertrains should gain share fastest across the Iran automotive base over the next decade.
How the national vehicle sales estimate was built
The report uses 2025 as the base year on a calendar basis, and market values come from the Credence Research model. That model combines carmaker production data published on the Codal disclosure platform, customs import figures, oil ministry fuel and CNG data, World Bank population and urbanization data, and company announcements. Segment splits, regional shares and regional growth rates are Credence Research estimates. Sources used are official statistics, government releases and company disclosures, and no interviews or surveys were used.
Electrified models and dealer sales lead growth to 2035
Vehicle sales value is expected to reach USD 97.61 billion by 2035, an 8.88% CAGR during 2026–2035, as households replace older cars and fleets renew trucks, vans and taxis. Growth should come from electrified powertrains, importer channels and provincial cities. Charging point rules and gasoline pricing reform would support cleaner models, while energy shortfalls and sanctions would slow output. Carmakers with steady supply, wider model ranges and efficient engines are expected to gain the most as Iran automotive demand spreads across the country.
Frequently Asked Questions
How big is the Iran automotive market?
Which vehicle type leads Iranian vehicle sales value?
Which region leads the Iranian market?
How many vehicles did the largest carmakers produce?
How fast are vehicle imports growing?
Which powertrain is growing fastest?
Who are the leading companies in the Iranian market?
What are the main challenges for carmakers?
Table of Content
Chapter 1 Market Segmentation
- 1.1 Segmentation Framework
- 1.1.1 Product and Service Classification
- 1.1.2 Application and End-Use Classification
- 1.1.3 Technology and Solution Classification
- 1.1.4 Customer and Distribution Channel Classification
- 1.1.5 Geographic Segmentation
- 1.1.6 Market Segment Definitions and Boundaries
- 1.2 By Vehicle Type
- 1.2.1 Passenger Cars
- 1.2.2 Light Commercial Vehicles
- 1.2.3 Medium and Heavy Commercial Vehicles
- 1.2.4 Two-Wheelers
- 1.3 By Powertrain
- 1.3.1 Gasoline
- 1.3.2 Diesel and CNG
- 1.3.3 Hybrid Electric
- 1.3.4 Battery Electric
- 1.4 By Sales Channel
- 1.4.1 OEM Direct Allocation
- 1.4.2 Authorized Dealers
- 1.4.3 Fleet and Government Tenders
- 1.4.4 Importer and Digital Channels
Chapter 2 Introduction
- 2.1 Report Objectives and Scope
- 2.2 Product Definition and Industry Terminology
- 2.3 Market Inclusions and Exclusions
- 2.4 Research Process
- 2.4.1 Primary Research and Expert Interviews
- 2.4.2 Secondary Research and Source Review
- 2.4.3 Top-Down and Bottom-Up Estimation
- 2.4.4 Data Triangulation and Verification
- 2.5 Market Size Measurement Basis
- 2.5.1 2025: USD 41.58 billion → 2035: USD 97.61 billion
- 2.6 Historical and Forecast Reference Periods
- 2.6.1 Historical Period: 2018-2025
- 2.6.2 Base Year: 2025
- 2.6.3 Forecast Period: 2025-2035
- 2.7 Research Assumptions and Limitations
Chapter 3 Executive Summary
- 3.1 Market Snapshot and Key Findings
- 3.2 Base-Year Market Size, 2025
- 3.3 Forecast Market Size, 2035
- 3.4 Revenue and Volume Growth Outlook
- 3.5 Key Demand and Supply Indicators
- 3.6 Leading Market Segments
- 3.7 Fastest-Growing Market Opportunities
- 3.8 Regional Performance Highlights
- 3.9 Technology and Industry Transformation
- 3.10 Competitive Landscape Summary
- 3.11 Analyst View and Strategic Implications
Chapter 4 Iran Automotive Market Trends and Developments
- 4.1 Historical Industry Development, 2018-2025
- 4.2 Recent Market Trends and Developments
- 4.3 Demand and Customer Behavior Trends
- 4.4 Technology and Product Innovation
- 4.5 Artificial Intelligence, Automation and Digitalization
- 4.6 Local Manufacturing and Supply Chain Realignment
- 4.7 Industry Partnerships, Mergers and Acquisitions
- 4.8 Sustainability and Circular Economy Developments
- 4.9 Government and Private Sector Investment Trends
- 4.10 Emerging Business Models and Commercialization
- 4.11 Industry Developments and Announcements
Chapter 5 Iran Automotive Market Production, Supply and Demand Analysis
- 5.1 Demand Trend and Consumption Analysis, 2018-2025
- 5.2 Demand Forecast, 2025-2035
- 5.3 Production and Output Trend, 2018-2025
- 5.4 Production and Output Forecast, 2025-2035
- 5.5 Installed Capacity and Capacity Utilization
- 5.6 Company-Wise Production Plants and Statistics
- 5.6.1 Installed Production Capacity
- 5.6.2 Actual Production
- 5.6.3 Planned Capacity and Expansion Targets
- 5.7 Supply Chain Structure and Procurement Trends
- 5.8 Supply-Demand Gap and Bottlenecks
- 5.9 Import Dependence and Sourcing Structure
- 5.10 Contract Manufacturing and Outsourcing
- 5.11 Regional Supply and Demand Concentration
Chapter 6 Iran Automotive Market Pricing Analysis
- 6.1 Pricing Structure and Measurement
- 6.2 Historical Pricing Trends, 2018-2025
- 6.3 Pricing Outlook, 2025-2035
- 6.4 Average Selling Price and Unit Economics
- 6.5 Pricing by Product and Market Segment
- 6.6 Geographic Pricing Differences
- 6.7 Key Input, Energy, Labor and Logistics Costs
- 6.8 Contract Pricing and Purchasing Models
- 6.9 Pricing Sensitivity and Competitive Positioning
- 6.10 Price, Margin and Profitability Implications
Chapter 7 Iran Automotive Market Dynamics
- 7.1 Market Growth Drivers
- 7.1.1 Demand-Side Drivers
- 7.1.2 Technology and Innovation Drivers
- 7.1.3 Infrastructure and Investment Drivers
- 7.1.4 Regulatory and Policy Drivers
- 7.2 Market Restraints
- 7.2.1 Cost and Affordability Constraints
- 7.2.2 Technology and Adoption Barriers
- 7.2.3 Supply Chain and Operational Constraints
- 7.3 Market Challenges
- 7.3.1 Competitive Pressure and Margin Erosion
- 7.3.2 Skills, Infrastructure and Implementation Gaps
- 7.4 Emerging Market Opportunities
- 7.5 Market Dynamics Impact and Time-Horizon Assessment
Chapter 8 Iran Automotive Value Chain Analysis
- 8.1 Industry Value Chain Overview
- 8.2 Upstream Suppliers and Critical Inputs
- 8.3 Technology and Component Providers
- 8.4 Manufacturing or Service Delivery
- 8.5 Distribution, Channel Partners and Integrators
- 8.6 Downstream Applications and End Users
- 8.7 Value Addition and Profit Pools
- 8.8 Vertical Integration and Outsourcing
- 8.9 Supplier Concentration and Risk
- 8.10 Supply Chain Localization and Resilience
Chapter 9 Iran Automotive Market Regulations and Policies
- 9.1 Relevant Laws, Standards and Compliance Frameworks
- 9.2 Product, Service, Safety and Quality Requirements
- 9.3 Government Policies, Incentives and Subsidies
- 9.4 Imports, Exports and Trade Barriers
- 9.5 Public Procurement and Local Content Requirements
- 9.6 Environmental and Sustainability Compliance
- 9.7 Upcoming Policy Changes and Market Implications
Chapter 10 Iran Automotive Market Hotspots and Opportunities
- 10.1 Market Opportunity Mapping and Growth Hotspots
- 10.2 High-Growth Applications and Customer Groups
- 10.3 Underserved Markets and White-Space Opportunities
- 10.4 Emerging Technology and Product Opportunities
- 10.5 New Capacity and Investment Hotspots
- 10.6 Market Entry and Expansion Opportunities
- 10.7 Distribution and Partnership Opportunities
- 10.8 Near-Term and Long-Term Commercial Potential
- 10.9 Opportunity Attractiveness and Execution Risks
Chapter 11 Iran Automotive Market Outlook, 2025-2035
- 11.1 Market Size and Analysis
- 11.1.1 Revenue (Market Measurement: 2025: USD 41.58 billion → 2035: USD 97.61 billion)
- 11.1.2 Market Volume and Quantity Sold
- 11.1.3 Historical Market Size, 2018-2025
- 11.1.4 Base-Year Market Size, 2025
- 11.2 Market Forecast, 2025-2035
- 11.2.1 Revenue Forecast to 2035
- 11.2.2 Volume Forecast to 2035
- 11.2.3 CAGR and Year-on-Year Growth
- 11.2.4 Incremental Revenue Opportunity
- 11.3 Forecast Assumptions and Scenario Analysis
- 11.3.1 Base-Case Forecast
- 11.3.2 Optimistic and Conservative Scenarios
- 11.3.3 Technology, Pricing and Policy Sensitivities
- 11.4 Market Attractiveness and Growth Outlook
Chapter 12 Iran Automotive Market Segmentation and Outlook
- 12.1 Segmentation Summary and Market Shares, 2025
- 12.2 Largest and Fastest-Growing Segments
- 12.3 By Vehicle Type - Market Size and Forecast, 2025-2035
- 12.3.1 Segment Definition and Scope
- 12.3.2 Historical Market Size, 2018-2025
- 12.3.3 Revenue Forecast, 2025-2035
- 12.3.4 Volume Forecast, 2025-2035
- 12.3.5 Base-Year Market Share, 2025
- 12.3.6 Segment CAGR and Growth Drivers
- 12.3.7 Subsegment Market Size and Forecast
- 12.3.7.1 Passenger Cars
- 12.3.7.2 Light Commercial Vehicles
- 12.3.7.3 Medium and Heavy Commercial Vehicles
- 12.3.7.4 Two-Wheelers
- 12.3.8 Subsegment Pricing and Adoption Trends
- 12.3.9 Leading Suppliers and Competition
- 12.3.10 Regional Demand and Opportunities
- 12.4 By Powertrain - Market Size and Forecast, 2025-2035
- 12.4.1 Segment Definition and Scope
- 12.4.2 Historical Market Size, 2018-2025
- 12.4.3 Revenue Forecast, 2025-2035
- 12.4.4 Volume Forecast, 2025-2035
- 12.4.5 Base-Year Market Share, 2025
- 12.4.6 Segment CAGR and Growth Drivers
- 12.4.7 Subsegment Market Size and Forecast
- 12.4.7.1 Gasoline
- 12.4.7.2 Diesel and CNG
- 12.4.7.3 Hybrid Electric
- 12.4.7.4 Battery Electric
- 12.4.8 Subsegment Pricing and Adoption Trends
- 12.4.9 Leading Suppliers and Competition
- 12.4.10 Regional Demand and Opportunities
- 12.5 By Sales Channel - Market Size and Forecast, 2025-2035
- 12.5.1 Segment Definition and Scope
- 12.5.2 Historical Market Size, 2018-2025
- 12.5.3 Revenue Forecast, 2025-2035
- 12.5.4 Volume Forecast, 2025-2035
- 12.5.5 Base-Year Market Share, 2025
- 12.5.6 Segment CAGR and Growth Drivers
- 12.5.7 Subsegment Market Size and Forecast
- 12.5.7.1 OEM Direct Allocation
- 12.5.7.2 Authorized Dealers
- 12.5.7.3 Fleet and Government Tenders
- 12.5.7.4 Importer and Digital Channels
- 12.5.8 Subsegment Pricing and Adoption Trends
- 12.5.9 Leading Suppliers and Competition
- 12.5.10 Regional Demand and Opportunities
- 12.6 Segment Growth Comparison
- 12.7 Segment Attractiveness and Priority Matrix
Chapter 13 Iran Automotive Geographic Market Outlook, 2025-2035
- 13.1 Domestic Market Distribution and Demand Clusters
- 13.2 State- or Province-Wise Market Size and Forecast, 2025-2035
- 13.3 City and Metropolitan Market Outlook
- 13.4 Industrial, Manufacturing and Commercial Clusters
- 13.5 Geographic Concentration of Key End Users
- 13.6 Local Pricing and Purchasing Differences
- 13.7 Domestic Production Facilities and Capacity Map
- 13.8 Local Infrastructure and Project Pipeline
- 13.9 State-Level Policy and Incentive Differences
- 13.10 Subnational Investment Hotspots and Opportunities
- 13.11 Distribution and Logistics Networks
- 13.12 Domestic Competitive Footprint
Chapter 14 Iran Automotive Technology, Innovation and Sustainability Outlook
- 14.1 Technology Landscape and Maturity
- 14.2 Product, Process and Service Innovation
- 14.3 AI, Automation and Digital Tools in the Industry
- 14.4 Technology Adoption and Performance Benchmarking
- 14.5 Innovation Pipeline and R&D Investment
- 14.6 Patent and Intellectual Property Trends
- 14.7 Energy Efficiency and Resource Management
- 14.8 Sustainability, Recycling and Circularity
- 14.9 Technology Roadmap, 2025-2035
- 14.10 Risks of Obsolescence and Technology Substitution
Chapter 15 Iran Automotive Market Key Strategic Imperatives
- 15.1 Growth and Market Entry Priorities
- 15.2 High-Return Products and Segments
- 15.3 Pricing, Profitability and Cost Optimization
- 15.4 Technology Investment and Product Differentiation
- 15.5 Supply Chain Localization and Resilience
- 15.6 Distribution and Customer Acquisition
- 15.7 Partnership, Acquisition and Capacity Strategy
- 15.8 Regional Expansion Priorities
- 15.9 Short-, Medium- and Long-Term Actions
Chapter 16 Competition Outlook
- 16.1 Industry Competition Characteristics
- 16.2 Market Structure and Concentration
- 16.3 Market Share and Competitive Positioning, 2025
- 16.4 Company-Wise Revenue and Product Benchmarking
- 16.5 Production and Service Capacity Benchmarking
- 16.6 Technology, Pricing and Differentiation
- 16.7 Regional Footprint and Distribution Strength
- 16.8 Mergers, Acquisitions and Strategic Alliances
- 16.9 New Entrants and Competitive Threats
- 16.10 Porter's Five Forces and Industry Attractiveness
- 16.11 Competitive Outlook, 2025-2035
Chapter 17 Company Profiles
- 17.1 Company Coverage and Selection Criteria
- 17.2 Iran Khodro
- 17.2.1 Business Description
- 17.2.2 Company Ownership and Geographic Presence
- 17.2.3 Product and Service Portfolio
- 17.2.4 Manufacturing and Operating Footprint
- 17.2.5 Production Capacity and Expansion Plans
- 17.2.6 Financial Performance and Investment
- 17.2.7 Market Share and Competitive Position
- 17.2.8 Technology and Innovation Capabilities
- 17.2.9 Strategic Alliances or Partnerships
- 17.2.10 Recent Developments
- 17.2.11 Growth Strategy and Outlook
- 17.3 SAIPA
- 17.4 Kerman Motor
- 17.5 Modiran Vehicle Manufacturing
- 17.6 Bahman Group
- 17.7 Pars Khodro
- 17.8 Zamyad
- 17.9 Iran Khodro Diesel
- 17.10 Farda Motors
- 17.11 AMICO
- 17.12 Other Relevant Market Participants
Note: Every listed company is profiled on the structure shown under the first company. The company list is preliminary and may change based on research findings, market developments, data availability and client requirements.
Chapter 18 Disclaimer
- 18.1 Research and Forecast Disclaimer
- 18.2 Data Source and Estimation Limitations
Note: The depth of individual sections depends on data availability for this market. Volume, capacity, trade and other unit-based metrics are included where applicable.

