
Collection duty and fleet rules keep refuse trucks in demand
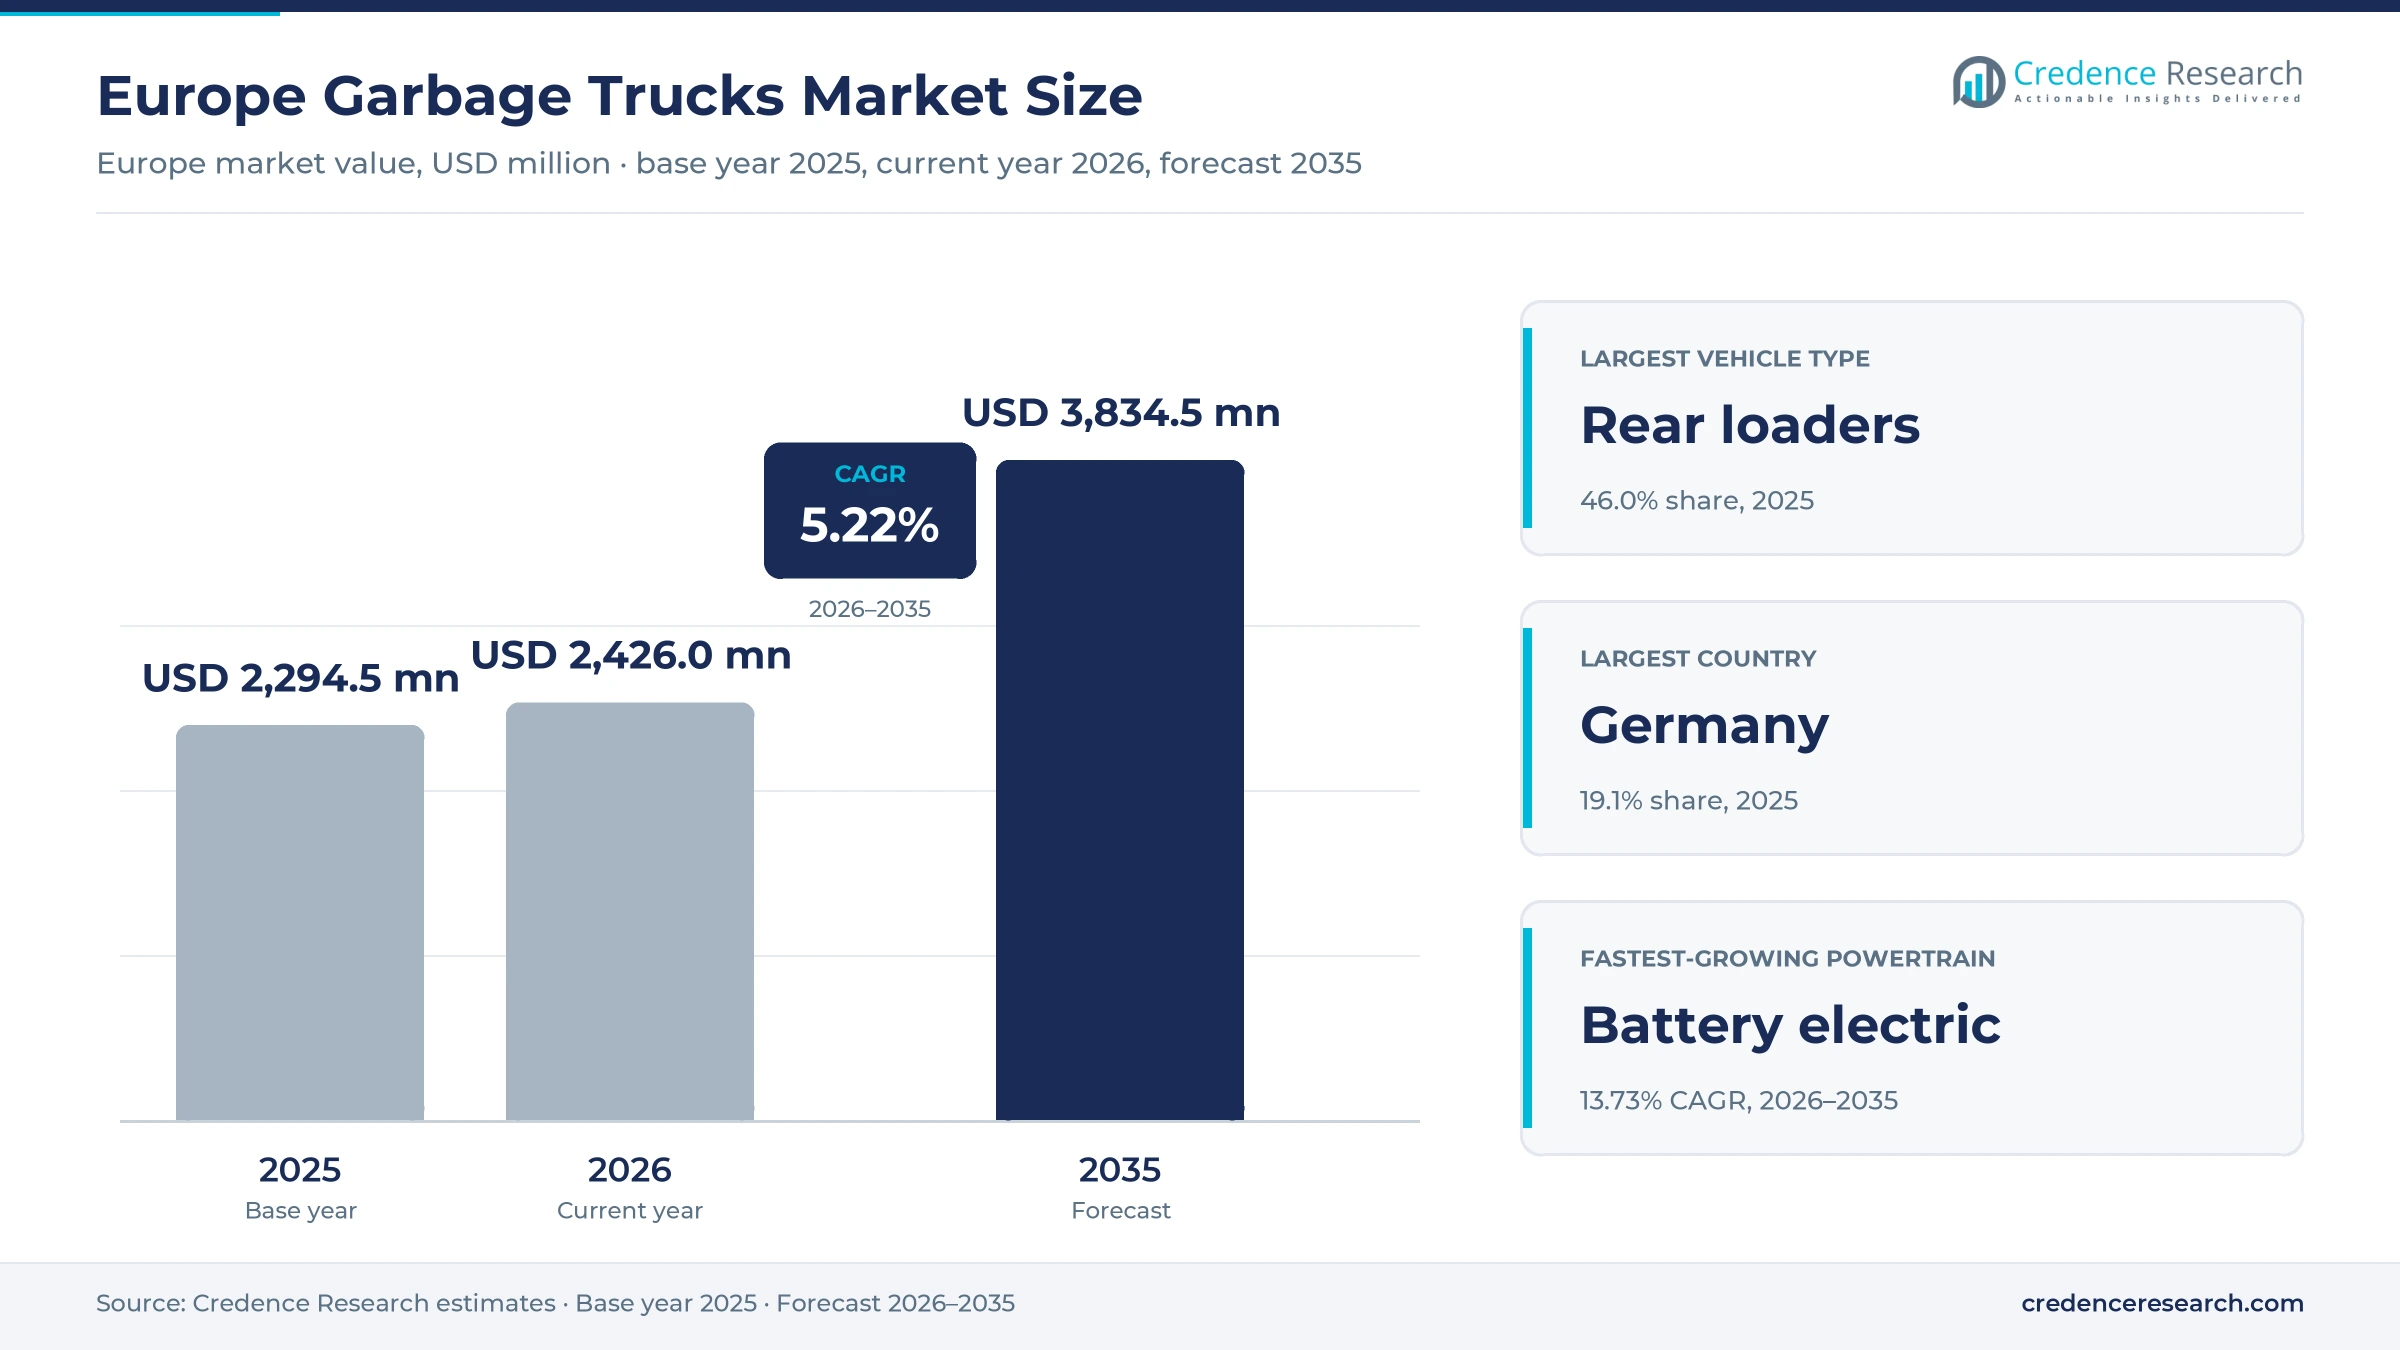
The Europe garbage trucks market was valued at USD 2.29 billion in 2025 and is projected to increase from USD 2.43 billion in 2026 to USD 3.83 billion by 2035, registering a CAGR of 5.22% during 2026–2035. Demand comes from municipal authorities and private waste operators that must collect household, recyclable and commercial waste on fixed rounds, whatever the economic cycle. Germany held the largest country share, 19.1% in 2025, because its large municipal fleets and high waste volumes keep replacement steady. The United Kingdom is the fastest-growing country at 5.59% a year, as weekly food waste collection and wider recycling duties add rounds and vehicles. In turn, European carbon dioxide standards for heavy vehicles now set targets for refuse trucks from 2035, so cities are moving from diesel chassis toward battery-electric units with electrically driven bodies.
Which refuse vehicles and buyers are counted in the estimate?
The estimate measures spending across Europe on new refuse collection vehicles, including rear loaders, side loaders, front loaders and roll-off or hook-lift trucks, valued as the complete chassis and body. It covers diesel, battery-electric, gas and hydrogen units bought by municipal authorities, private waste operators, industrial fleets and leasing companies. Values are stated in USD million at current prices and include units bought through tenders, dealers, direct supply and lease agreements.
The estimate excludes street sweepers, gully emptiers, skip containers and used vehicle sales, as well as aftermarket parts and repair services. The value chain runs from chassis makers and body builders through dealers and leasing firms to the councils and contractors that run daily collection rounds in each country.
Europe Garbage Trucks Market Insights
- The Europe garbage trucks market was valued at USD 2.29 billion in 2025 and is projected to reach USD 3.83 billion by 2035, at a 5.22% CAGR during 2026–2035.
- Germany held a 19.1% share of 2025 value, because its municipal fleets are large and its residents generate more waste than the European average.
- Rear loaders led vehicle types with a 46.0% share of 2025 value, as they suit narrow streets and mixed household rounds.
- European rules adopted in 2024 set carbon dioxide targets for refuse trucks from 2035, which is moving tenders toward zero-emission chassis.
- Battery-electric drivetrains grow fastest among powertrains at 13.73% a year during 2026–2035, as cities replace diesel units on urban rounds.
Rear loaders lead while electric drivetrains gain fastest
Why do rear loaders still dominate collection rounds?
Based on vehicle type, the market is categorized into rear loaders, side loaders, front loaders and roll-off and hook-lift trucks. Rear Loaders led with a 46.0% share of 2025 value, because they handle mixed bins on narrow streets with a two- or three-person crew. Side Loaders grow fastest at 5.81% a year, as automated single-operator rounds lower labor needs.
How quickly are fleets moving off diesel chassis?
Based on powertrain, the market is categorized into diesel and HVO-compatible ICE, battery electric, CNG and biomethane, and hydrogen fuel cell and hybrid units. Diesel and HVO-Compatible ICE led with a 78.0% share of 2025 value, because most tenders still buy proven engines for long shifts. Battery Electric grows fastest at 13.73% a year as cities set zero-emission targets.
Who buys most refuse trucks across Europe?
Based on customer type, the market is categorized into municipal authorities, private waste management operators, industrial and commercial fleet owners, and leasing and fleet service providers. Municipal Authorities led with a 47.0% share of 2025 value, because many councils still own and run their fleets. Leasing and Fleet Service Providers grow fastest at 6.62% a year, as electric units shift buyers toward leases.
Do tenders still decide most vehicle purchases?
Based on sales channel, the market is categorized into direct OEM sales, bodybuilder-dealer networks, public procurement tenders and leasing and fleet-as-a-service. Public Procurement Tenders led with a 41.0% share of 2025 value, because public buyers must award large orders through open competition. Leasing and Fleet-as-a-Service grows fastest at 6.82% a year as buyers spread battery costs over contract terms.
| Segment Group | Leading Sub-segment | Share, 2025 | Fastest-growing Sub-segment | CAGR, 2026–2035 |
|---|---|---|---|---|
| By Vehicle Type | Rear Loaders | 46.0% | Side Loaders | 5.81% |
| By Powertrain | Diesel and HVO-Compatible ICE | 78.0% | Battery Electric | 13.73% |
| By Customer Type | Municipal Authorities | 47.0% | Leasing and Fleet Service Providers | 6.62% |
| By Sales Channel | Public Procurement Tenders | 41.0% | Leasing and Fleet-as-a-Service | 6.82% |
Request a Free Sample
Fill in your details and we'll send you a free sample report.
- Sample data tables & charts
- Research methodology
Waste volumes, CO2 rules and electric proof lift orders
How do waste collection duties keep orders steady?
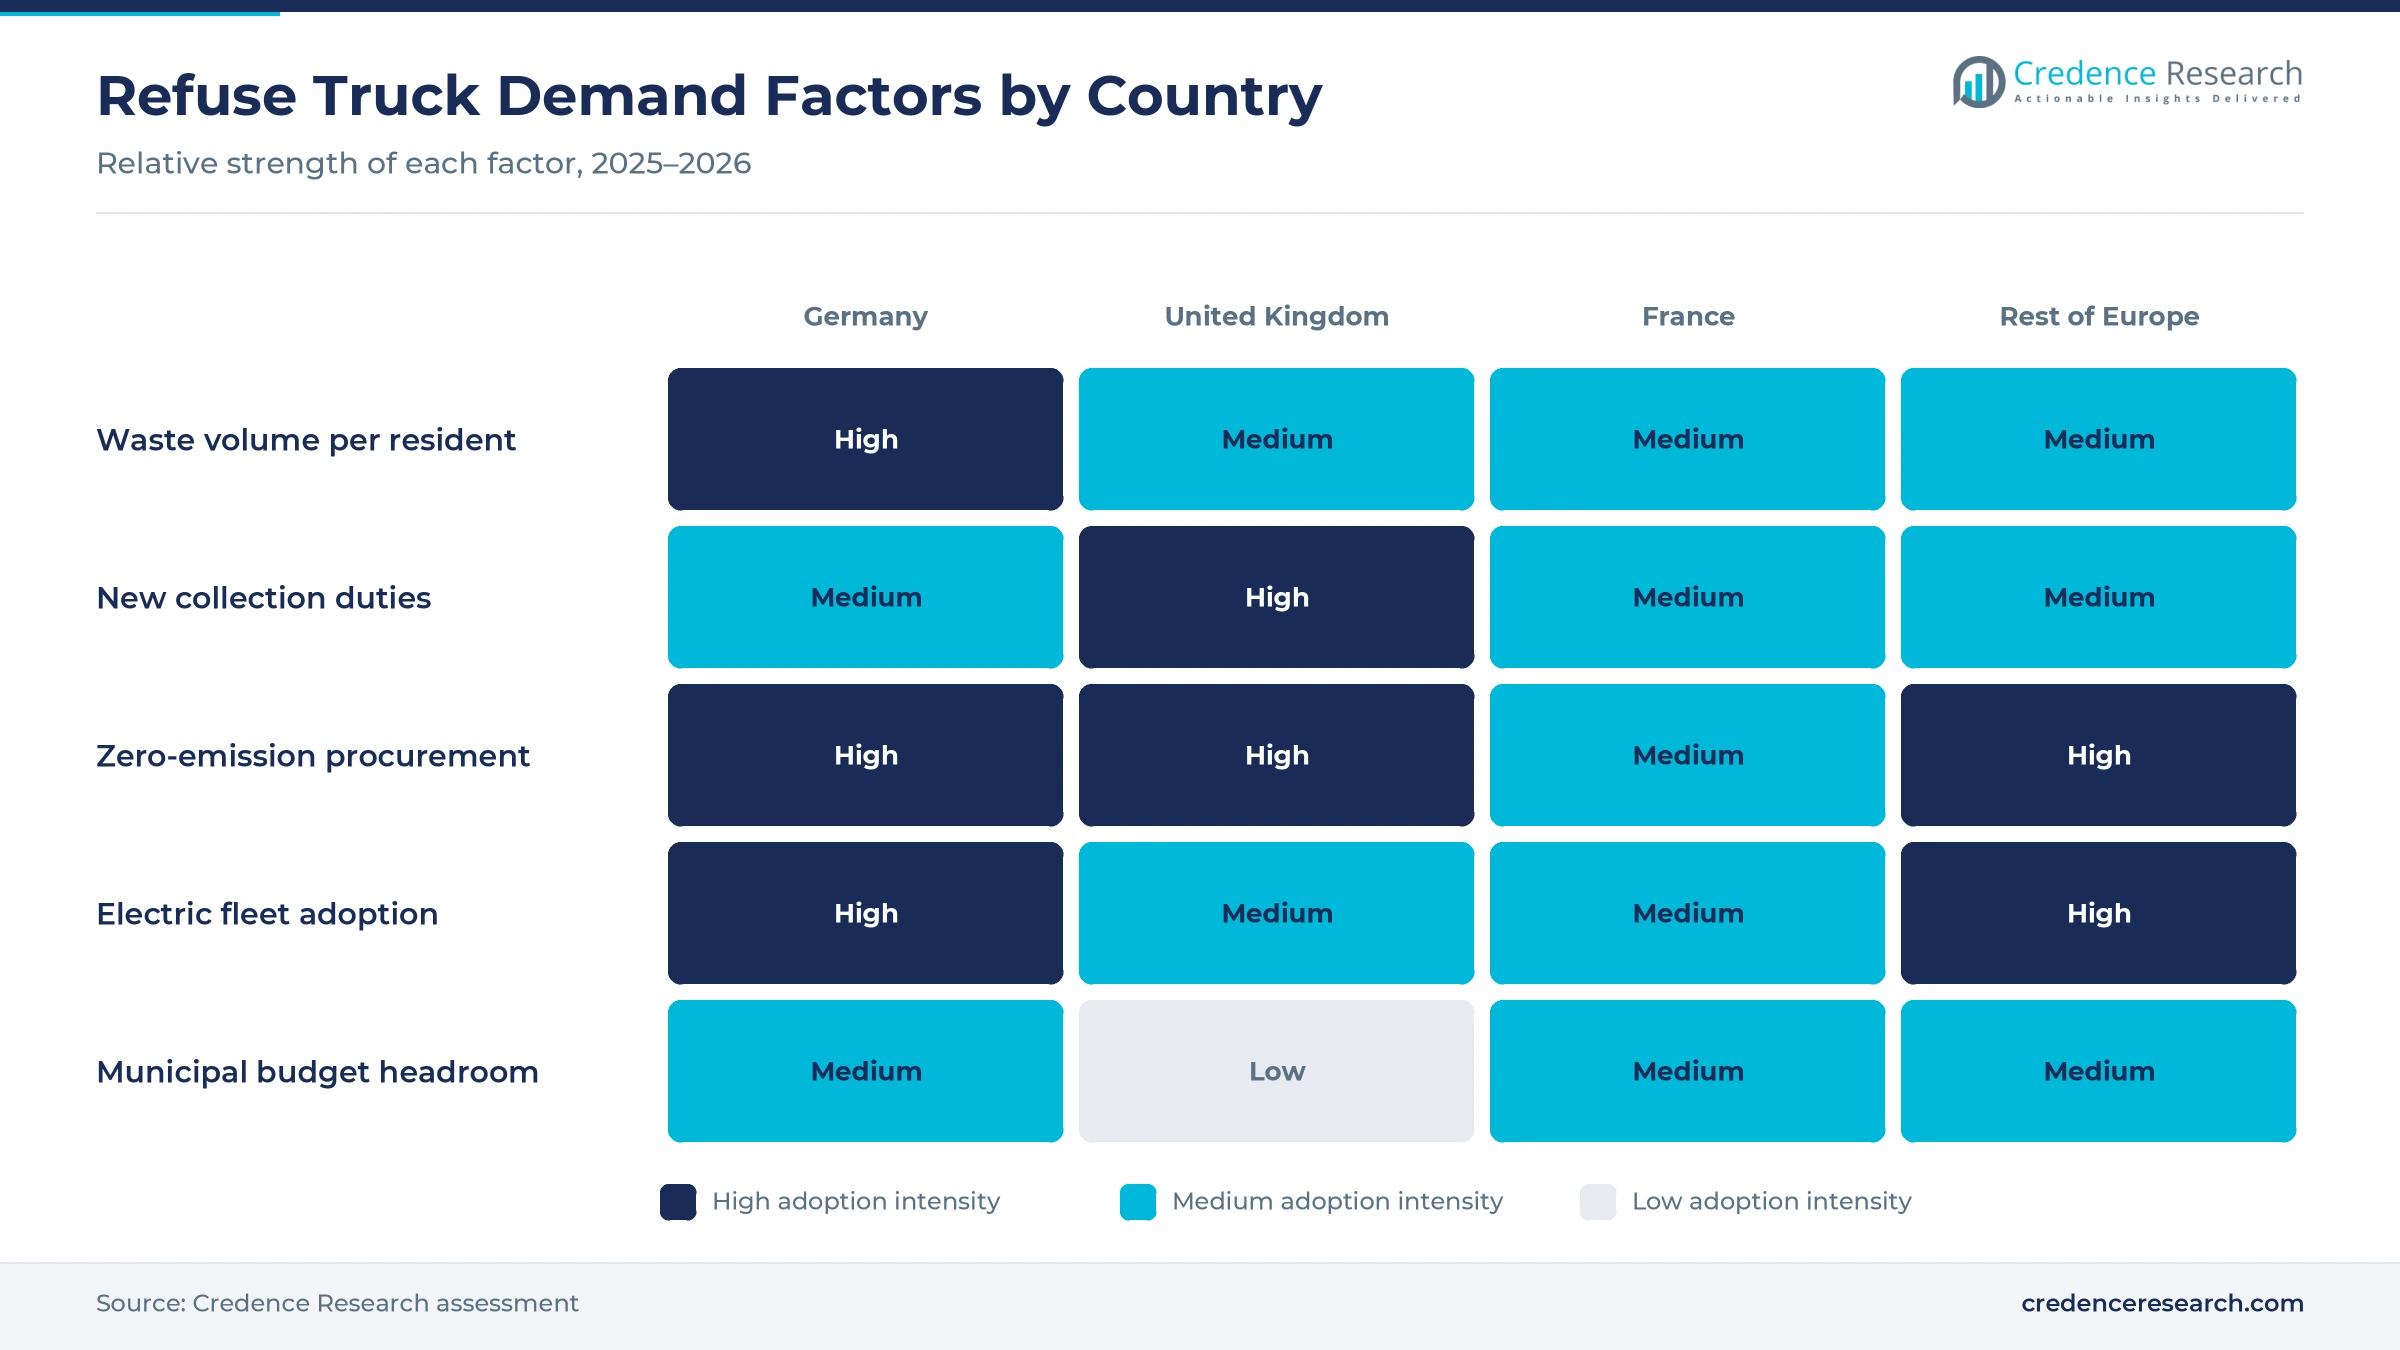
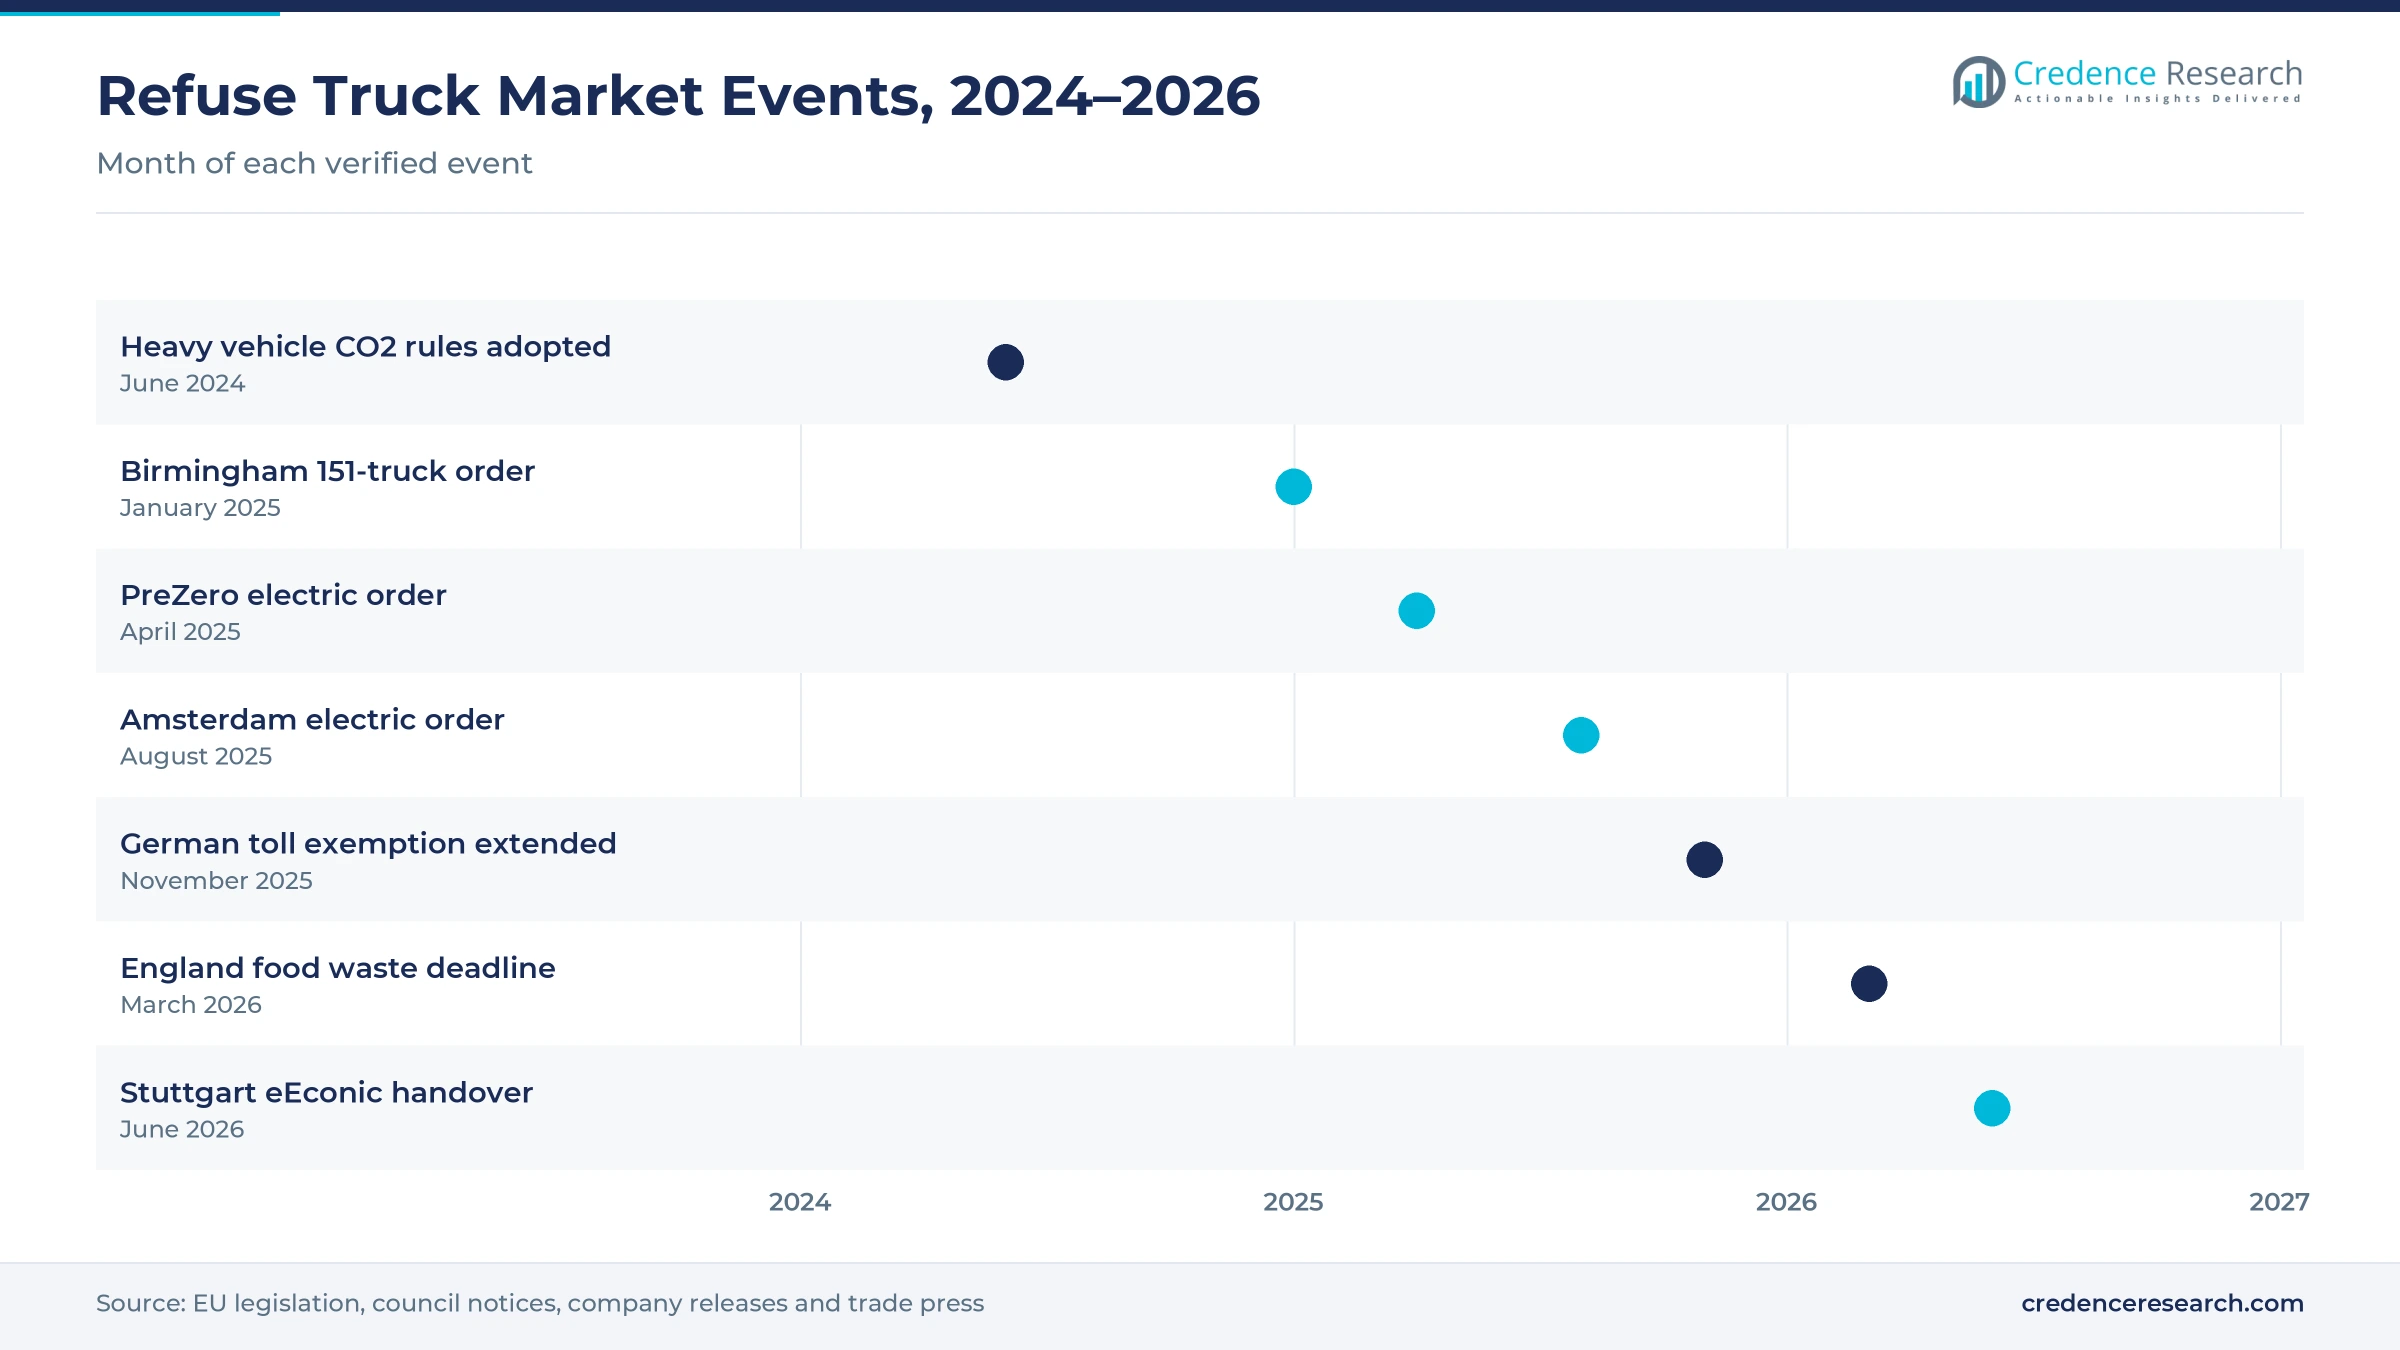
Waste collection duties keep orders steady, because councils must empty bins every week regardless of budgets or economic cycles. The European Union generated 517 kg of municipal waste per person in 2024, up from 511 kg in 2023, and recycled 48.1% of it, according to Eurostat. In England, weekly household food waste collections had to start by March 31, 2026, which adds separate rounds and vehicles. Birmingham City Council announced an order for 151 Dennis Eagle refuse vehicles in January 2025, including 41 compact units for organic waste. As a result, municipal authorities kept a 47.0% share of 2025 value while fleets grew to cover more fractions.
Why do heavy vehicle CO2 rules reshape refuse fleets?
Heavy vehicle carbon dioxide rules reshape refuse fleets, because chassis makers must cut average emissions of new trucks sharply. Regulation (EU) 2024/1610, dated June 2024, sets reductions of 45% for 2030, 65% for 2035 and 90% for 2040, and refuse trucks face targets from 2035. The Clean Vehicles Directive also requires most member states to buy at least 15% clean trucks from 2026 to 2030, and refuse collection service contracts count toward that share. Germany extended its road toll exemption for zero-emission trucks to June 30, 2031. Consequently, battery electric units grow fastest among powertrains at 13.73% a year through the forecast.
How have electric refuse fleets proved themselves commercially?
Electric refuse fleets have proved themselves commercially, because repeat orders now follow early trials in major cities. Karlsruhe introduced seven Mercedes-Benz eEconic trucks with FAUN bodies on its rounds from September 2025 and had placed orders for 11 more low-entry units by early November. Abfallwirtschaft Stuttgart commissioned the first five of ten eEconic trucks in June 2026, built at Woerth since 2022, according to the chassis maker. PreZero announced an order for 35 Volvo electric trucks for Stockholm-area depots in April 2025, the largest such order in Swedish recycling, and is also investing in depot charging equipment. In turn, demand for battery-electric heavy vehicles in waste duty keeps rising.
Why does fleet renewal in large markets sustain spending?
Fleet renewal in large markets sustains spending, because refuse trucks wear out quickly on stop-start rounds and must be replaced on fixed cycles. The European Union registered 307,460 new trucks in 2025, and diesel still made up 93.2% of them while electrically chargeable trucks reached 4.2%, up from 2.3%, according to industry registration data. Abfallwirtschaft Stuttgart runs about 1,100 vehicles, roughly 120 of them for waste collection, and it bought ten diesel Econic trucks alongside its electric units. Public procurement tenders led sales channels with a 41.0% share of 2025 value on such renewal. As a result, replacement keeps tenders flowing even when total truck sales fall across the region.
Electric bodies and separate fractions reshape fleets
Why is the shift to electric bodies gathering pace?
The shift to electric bodies is gathering pace, because a battery chassis allows the lifter and compactor to run without an idling engine. Amsterdam signed an order for 40 DAF XD Electric refuse trucks in August 2025, each with a 90 kW electric power take-off for cranes and compactors, according to trade press reports. Each Karlsruhe eEconic saves between 150 and 170 metric tons of carbon dioxide a year, depending on its route. The eEconic carries three battery packs of 112 kWh nominal capacity, enough for a typical urban shift without recharging. Consequently, quieter collection lets cities run early rounds in dense residential districts.
How is separate fraction collection changing the body mix?
Separate fraction collection is changing the body mix, because councils now collect food, paper, glass and plastics on their own rounds. England required businesses with ten or more employees to separate recyclables by March 31, 2025, with micro-firms following by March 31, 2027, according to local council guidance. Amsterdam split its electric order into 13 rear-end loaders, 10 crane and hook-lift units and 17 front loaders. Birmingham also chose 41 compact 7.5-metric-ton trucks for organic waste. In turn, side loaders grow fastest among vehicle types at 5.81% a year, and narrow side-loader refuse vehicles win more rounds.
Can leasing open a clear opening for electric units?
Leasing opens a clear opening for electric units, because an electric refuse truck costs far more upfront than a diesel unit with the same body. Leasing and fleet-as-a-service grows fastest among sales channels at 6.82% a year, as councils spread battery costs over contract terms. PreZero is investing in charging equipment at its Stockholm-area depots alongside its 35-truck order. The Clean Vehicles Directive counted refuse collection contracts toward a 10% clean truck share in most member states through 2025. As a result, lessors that bundle chassis, body, charging and service win contracts from smaller councils.
Where do hydrogen and gas units find an opening?
Hydrogen and gas units find an opening on long rural and heavy routes, because battery range and payload limit some duties. FAUN Zoeller U.K. supplied a BLUEPOWER hydrogen fuel cell refuse truck to St Helens in 2022, the first local authority to run one. The Kirchhoff Group ECOTEC division, parent of FAUN, produces around 8,000 garbage trucks a year worldwide. European rules also let makers count zero-emission vocational vehicles toward compliance from 2030. Consequently, hydrogen and hybrid units grow quickly from a small base, while biomethane fits operators that run anaerobic digestion at municipal solid waste services.
Price gaps, depot power and tight budgets slow change
How does the purchase price gap slow electric adoption?
The purchase price gap slows electric adoption, because an electric refuse truck can cost well above a diesel unit with the same body. Councils with fixed capital budgets then buy fewer vehicles or delay replacement by a year or two. As a result, older diesel trucks stay on rounds longer than planned, which raises repair costs. Buyers respond with leases, grants and whole-life cost tenders that credit lower energy and maintenance spending.
Why is depot charging a planning problem?
Depot charging is a planning problem, because a fleet of electric refuse trucks returns at the same time and needs high-power connections overnight. Grid upgrades at older depots can take longer than the vehicle delivery itself. Consequently, some councils receive electric trucks before their chargers are ready to use. Operators respond by phasing orders, adding smart charging software and sharing sites with bus or utility fleets.
What pressure do municipal budgets place on orders?
Municipal budgets place pressure on orders, because waste services compete with social care, housing and roads for limited funding. New duties such as weekly food waste rounds add costs even when grants help with vehicles. In turn, some authorities stretch tender cycles or buy diesel units to cover immediate needs. Suppliers respond with framework agreements and lease options that spread costs across several budget years.
Can battery weight limit payload on heavy rounds?
Battery weight can limit payload on heavy rounds, because large packs reduce the tonnage a truck may legally carry within axle limits. Rural routes with long distances to transfer stations also stretch battery range. As a result, operators keep diesel or gas trucks for the hardest duties while electrifying dense urban rounds first. Makers respond with lighter battery chemistries, modular packs and electric bodies that draw less energy.
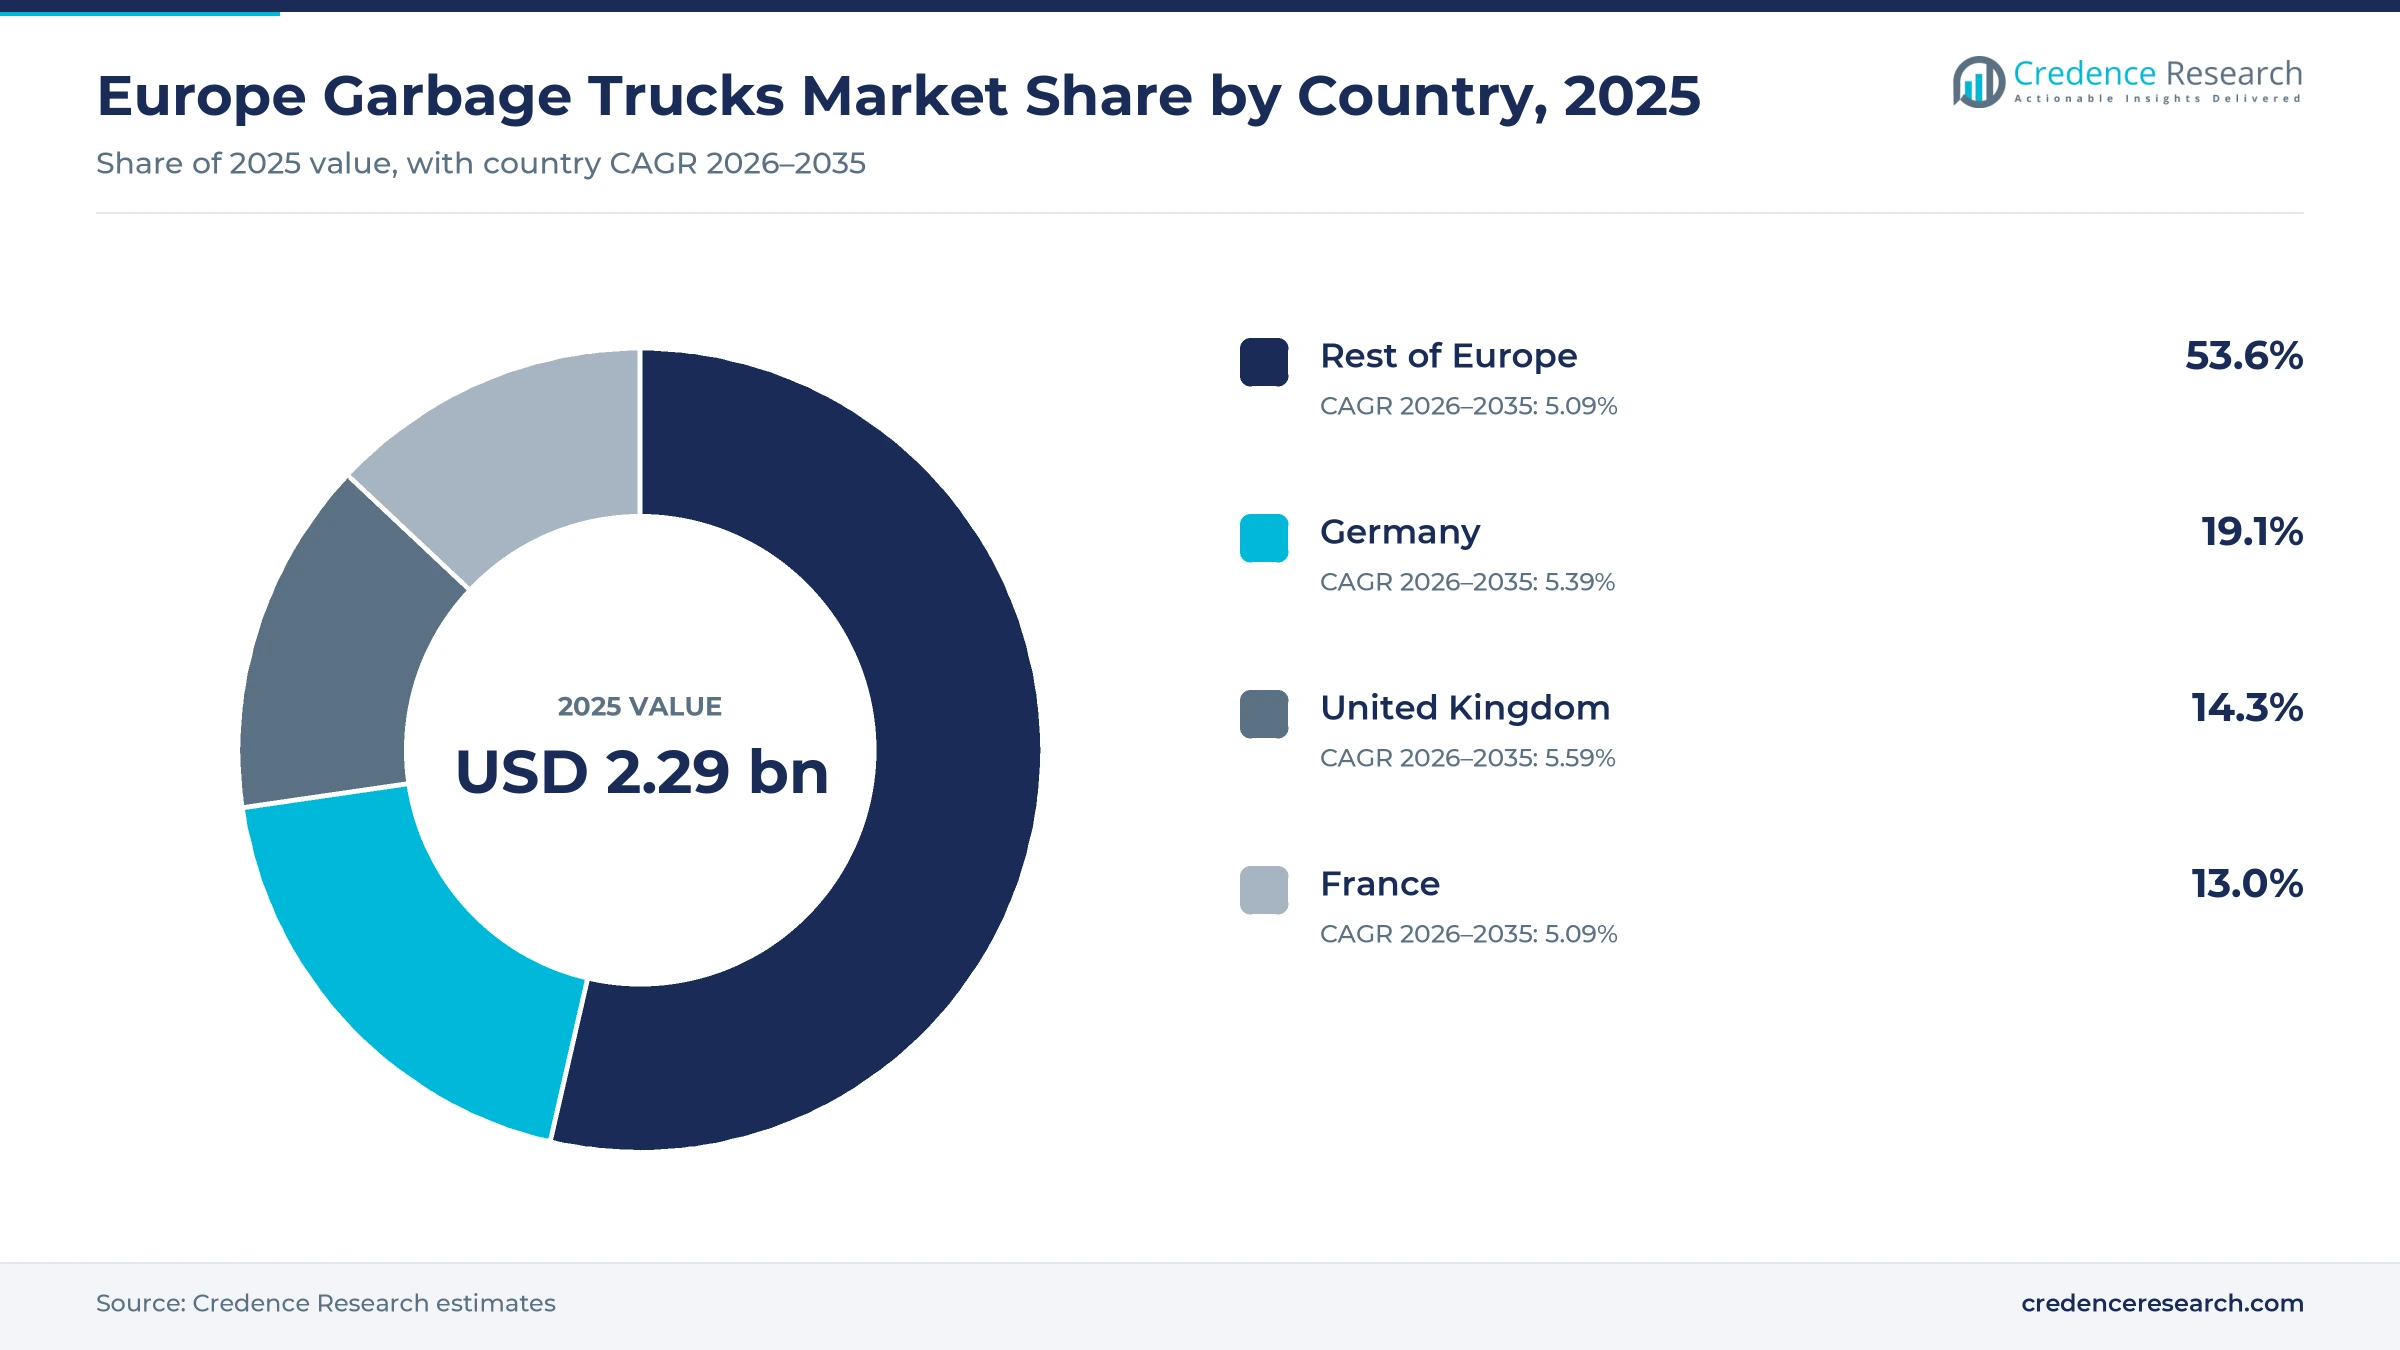
Germany leads while the United Kingdom gains fastest
| Country | Value, 2025 (USD billion) | Share, 2025 | CAGR, 2026–2035 |
|---|---|---|---|
| Rest of Europe | 1.23 | 53.6% | 5.09% |
| Germany | 0.44 | 19.1% | 5.39% |
| United Kingdom | 0.33 | 14.3% | 5.59% |
| France | 0.30 | 13.0% | 5.09% |
Large municipal fleets keep Germany ahead
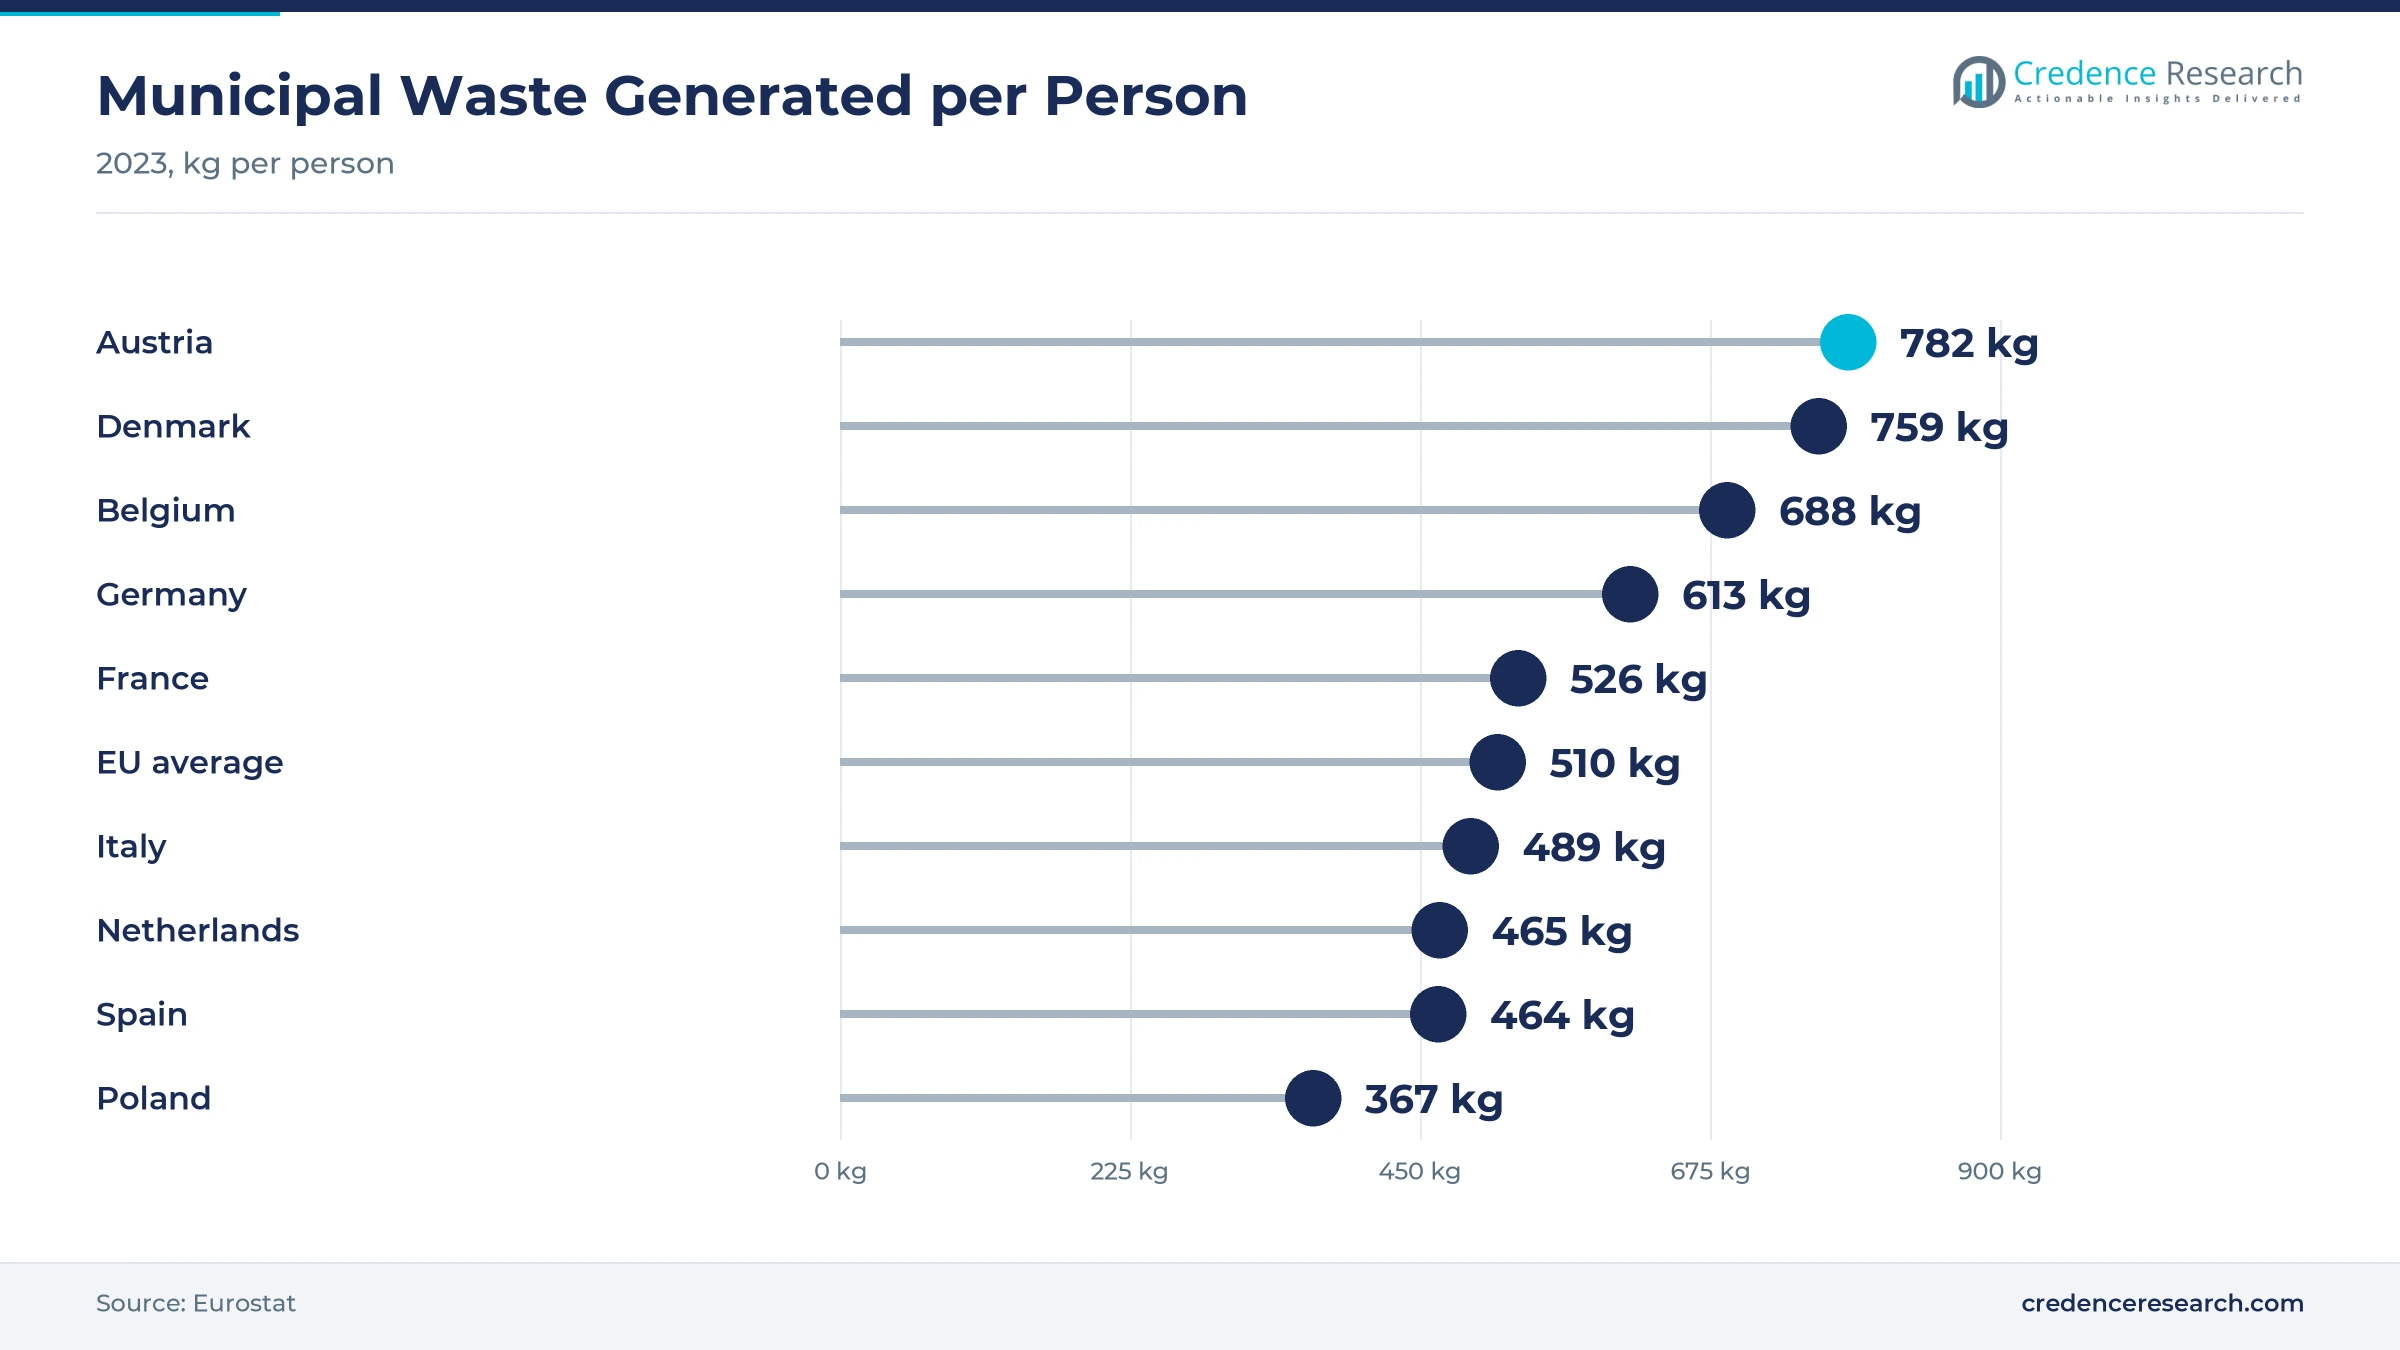
Germany held a 19.1% share of 2025 value and grows at 5.39% a year. Residents generated 613 kg of municipal waste per person in 2023, well above the European average of 510 kg, which keeps rounds long and fleets large. Karlsruhe and Stuttgart both added Mercedes-Benz eEconic trucks in 2025 and 2026, while the toll exemption for zero-emission trucks runs to mid-2031. However, German truck registrations fell 12.2% in 2025, so tender timing still drives yearly volumes.
Why does the United Kingdom grow fastest?
The United Kingdom held a 14.3% share of 2025 value and grows fastest at 5.59% a year. English councils had to offer weekly household food waste collection by March 2026, backed by central capital funding of 261.7 million pounds. Birmingham ordered 151 Dennis Eagle vehicles in January 2025, and Westminster ordered 40 electric eCollect trucks for operation with Veolia in 2023. As a result, new rounds and clean air zones lift vehicle numbers faster than elsewhere in Europe.
Steady renewal supports France
France held a 13.0% share of 2025 value and grows at 5.09% a year. Residents generated 526 kg of municipal waste per person in 2023, slightly above the European average, which keeps collection demand stable. French truck registrations fell 9% in 2025, yet the Clean Vehicles Directive still requires clean trucks in public contracts through 2030. In turn, French cities favor gas and electric units for dense urban rounds while keeping diesel trucks on rural routes.
Nordic and Dutch cities lead change in the rest of Europe
The rest of Europe held a 53.6% share of 2025 value and grows at 5.09% a year. Amsterdam ordered 40 DAF XD Electric refuse trucks for 2026 delivery, PreZero ordered 35 Volvo electric trucks in Sweden, and Copenhagen operator ARC ordered 78 Scania electric trucks in 2022. Austria and Denmark generated 782 kg and 759 kg of municipal waste per person in 2023. Consequently, Nordic and Dutch cities set the pace for zero-emission collection across the region.
Fleet orders, toll rules and deliveries, 2024–2026
| Development | Status and market relevance |
|---|---|
| In January 2025, Birmingham City Council ordered 151 Dennis Eagle refuse vehicles, including 41 compact organic waste units. | Shows scale of council renewal |
| In April 2025, PreZero ordered 35 Volvo electric trucks for its Stockholm-area waste operations. | Largest such order in Swedish recycling |
| In August 2025, Amsterdam ordered 40 DAF XD Electric refuse trucks for delivery in 2026. | Covers all household and office waste emission-free |
| In November 2025, the Bundestag extended the toll exemption for zero-emission trucks to June 2031. | Lowers operating cost of electric units |
| In June 2026, Abfallwirtschaft Stuttgart received the first five of ten Mercedes-Benz eEconic trucks. | Confirms repeat municipal electric orders |
Diesel, battery, gas and hydrogen chassis compete
- Diesel and HVO-compatible engines still run most rounds because they refuel quickly and can burn renewable diesel to cut emissions without new depots.
- Battery-electric chassis drive both the wheels and the body from one battery, which removes idling noise and exhaust on dense urban rounds.
- CNG and biomethane engines suit operators that produce gas from food waste, so the fuel can come from the same material the truck collects.
- Hydrogen fuel cell and hybrid units extend range on long rural routes, although refueling sites remain scarce across most countries.
Need a Custom Version of This Report?
Tailor the scope, geography, or segments to your exact requirements.
- Custom geography or segment scope
- Direct access to our analyst team
Chassis makers and body builders compete on uptime
Competition runs between chassis makers and body builders that combine into complete refuse vehicles for tenders. Mercedes-Benz Trucks has built the eEconic low-entry electric chassis at Woerth since 2022 and supplies cities such as Stuttgart and Karlsruhe. FAUN, part of the Kirchhoff Group ECOTEC division that builds around 8,000 garbage trucks a year worldwide, supplies bodies for such chassis. Dennis Eagle supplies complete vehicles to British councils, including Birmingham and Westminster. Volvo Trucks, DAF Trucks and Scania compete for electric chassis orders in Sweden, the Netherlands and Denmark. Suppliers compete on uptime, service networks, body compatibility and whole-life cost rather than on purchase price alone, and many also sell waste handling equipment to the same customers.
Which suppliers have verified European refuse truck activity?
| Company | Type | Role in the market |
|---|---|---|
| Mercedes-Benz Trucks | Chassis maker | eEconic built at Woerth since 2022, supplied to Stuttgart and Karlsruhe |
| FAUN Group | Body builder | Bodies on Karlsruhe eEconic trucks, part of Kirchhoff ECOTEC |
| ZOELLER Group | Body builder | FAUN Zoeller U.K. supplied a hydrogen refuse truck to St Helens |
| Dennis Eagle | Complete vehicle maker | 151-vehicle Birmingham order in January 2025 |
| Volvo Trucks | Chassis maker | 35 electric trucks for PreZero in Sweden, April 2025 |
| DAF Trucks | Chassis maker | 40 XD Electric refuse trucks ordered by Amsterdam, August 2025 |
| Scania | Chassis maker | 78 electric trucks for Copenhagen operator ARC in 2022 |
Credence Research sees electric refuse units scaling
Credence Research's view is that Europe garbage truck spending will grow steadily through 2035, because collection duties never pause and carbon dioxide rules raise the value of each new unit. Rear loaders should keep the largest share, while battery-electric drivetrains and leasing channels add value fastest. Germany will stay the largest country, although the United Kingdom gains share as weekly food waste rounds expand. However, purchase price gaps, depot power and tight municipal budgets will reward suppliers that offer financing, charging and service together.
Fleet sizes, renewal cycles and prices anchor the model
The report uses 2025 as the base year, with values in USD million at current prices. Market values come from the Credence Research model, which combines fleet sizes, renewal cycles, unit prices by powertrain and body type, and tender volumes. The four country groups and their 2025 shares follow the client brief, while country growth rates and the splits by vehicle type, powertrain, customer type and sales channel are Credence Research estimates. Sources used are official statistics, European legislation and guidance, council notices, industry registration data, company announcements and trade press, and no interviews or surveys were used.
Zero-emission rules shape refuse fleets through 2035
The Europe garbage trucks market is expected to reach USD 3.83 billion by 2035, a 5.22% CAGR during 2026–2035, as waste collection duties and zero-emission rules keep fleets renewing. Spending is projected to rise from USD 2.43 billion in 2026 as clean vehicle procurement targets tighten. Growth should be strongest in battery-electric units, leasing channels and the United Kingdom, while Germany keeps the largest country share. In contrast, tight municipal budgets and slow depot upgrades could delay orders in some years.
Frequently Asked Questions
How big is the Europe garbage trucks market?
Which country leads demand?
Which country grows fastest?
Which vehicle type holds the largest share?
Which powertrain grows fastest?
How do European rules affect refuse truck buyers?
Who are the leading companies in this market?
What are the main risks to growth?
Table of Content
Chapter 1 Market Segmentation
- 1.1 Segmentation Framework
- 1.1.1 Product and Service Classification
- 1.1.2 Application and End-Use Classification
- 1.1.3 Technology and Solution Classification
- 1.1.4 Customer and Distribution Channel Classification
- 1.1.5 Geographic Segmentation
- 1.1.6 Market Segment Definitions and Boundaries
- 1.2 By Vehicle Type
- 1.2.1 Rear Loaders
- 1.2.2 Side Loaders
- 1.2.3 Front Loaders
- 1.2.4 Roll-Off and Hook-Lift Trucks
- 1.3 By Powertrain
- 1.3.1 Diesel and HVO-Compatible ICE
- 1.3.2 Battery Electric
- 1.3.3 CNG and Biomethane
- 1.3.4 Hydrogen Fuel Cell and Hybrid
- 1.4 By Customer Type
- 1.4.1 Municipal Authorities
- 1.4.2 Private Waste Management Operators
- 1.4.3 Industrial and Commercial Fleet Owners
- 1.4.4 Leasing and Fleet Service Providers
- 1.5 By Sales Channel
- 1.5.1 Public Procurement Tenders
- 1.5.2 Bodybuilder-Dealer Networks
- 1.5.3 Direct OEM Sales
- 1.5.4 Leasing and Fleet-as-a-Service
- 1.6 By Country
- 1.6.1 Germany
- 1.6.2 United Kingdom
- 1.6.3 France
- 1.6.4 Rest of Europe
Chapter 2 Introduction
- 2.1 Report Objectives and Scope
- 2.2 Product Definition and Industry Terminology
- 2.3 Market Inclusions and Exclusions
- 2.4 Research Process
- 2.4.1 Primary Research and Expert Interviews
- 2.4.2 Secondary Research and Source Review
- 2.4.3 Top-Down and Bottom-Up Estimation
- 2.4.4 Data Triangulation and Verification
- 2.5 Market Size Measurement Basis
- 2.5.1 2025: USD 2.29 billion → 2035: USD 3.83 billion
- 2.6 Historical and Forecast Reference Periods
- 2.6.1 Historical Period: 2018-2025
- 2.6.2 Base Year: 2025
- 2.6.3 Forecast Period: 2025-2035
- 2.7 Research Assumptions and Limitations
Chapter 3 Executive Summary
- 3.1 Market Snapshot and Key Findings
- 3.2 Base-Year Market Size, 2025
- 3.3 Forecast Market Size, 2035
- 3.4 Revenue and Volume Growth Outlook
- 3.5 Key Demand and Supply Indicators
- 3.6 Leading Market Segments
- 3.7 Fastest-Growing Market Opportunities
- 3.8 Regional Performance Highlights
- 3.9 Technology and Industry Transformation
- 3.10 Competitive Landscape Summary
- 3.11 Analyst View and Strategic Implications
Chapter 4 Europe Garbage Trucks Market Trends and Developments
- 4.1 Historical Industry Development, 2018-2025
- 4.2 Recent Market Trends and Developments
- 4.3 Demand and Customer Behavior Trends
- 4.4 Technology and Product Innovation
- 4.5 Artificial Intelligence, Automation and Digitalization
- 4.6 Local Manufacturing and Supply Chain Realignment
- 4.7 Industry Partnerships, Mergers and Acquisitions
- 4.8 Sustainability and Circular Economy Developments
- 4.9 Government and Private Sector Investment Trends
- 4.10 Emerging Business Models and Commercialization
- 4.11 Industry Developments and Announcements
Chapter 5 Europe Garbage Trucks Market Production, Supply and Demand Analysis
- 5.1 Demand Trend and Consumption Analysis, 2018-2025
- 5.2 Demand Forecast, 2025-2035
- 5.3 Production and Output Trend, 2018-2025
- 5.4 Production and Output Forecast, 2025-2035
- 5.5 Installed Capacity and Capacity Utilization
- 5.6 Company-Wise Production Plants and Statistics
- 5.6.1 Installed Production Capacity
- 5.6.2 Actual Production
- 5.6.3 Planned Capacity and Expansion Targets
- 5.7 Supply Chain Structure and Procurement Trends
- 5.8 Supply-Demand Gap and Bottlenecks
- 5.9 Import Dependence and Sourcing Structure
- 5.10 Contract Manufacturing and Outsourcing
- 5.11 Regional Supply and Demand Concentration
Chapter 6 Europe Garbage Trucks Market Pricing Analysis
- 6.1 Pricing Structure and Measurement
- 6.2 Historical Pricing Trends, 2018-2025
- 6.3 Pricing Outlook, 2025-2035
- 6.4 Average Selling Price and Unit Economics
- 6.5 Pricing by Product and Market Segment
- 6.6 Geographic Pricing Differences
- 6.7 Key Input, Energy, Labor and Logistics Costs
- 6.8 Contract Pricing and Purchasing Models
- 6.9 Pricing Sensitivity and Competitive Positioning
- 6.10 Price, Margin and Profitability Implications
Chapter 7 Europe Garbage Trucks Market Dynamics
- 7.1 Market Growth Drivers
- 7.1.1 Demand-Side Drivers
- 7.1.2 Technology and Innovation Drivers
- 7.1.3 Infrastructure and Investment Drivers
- 7.1.4 Regulatory and Policy Drivers
- 7.2 Market Restraints
- 7.2.1 Cost and Affordability Constraints
- 7.2.2 Technology and Adoption Barriers
- 7.2.3 Supply Chain and Operational Constraints
- 7.3 Market Challenges
- 7.3.1 Competitive Pressure and Margin Erosion
- 7.3.2 Skills, Infrastructure and Implementation Gaps
- 7.4 Emerging Market Opportunities
- 7.5 Market Dynamics Impact and Time-Horizon Assessment
Chapter 8 Europe Garbage Trucks Value Chain Analysis
- 8.1 Industry Value Chain Overview
- 8.2 Upstream Suppliers and Critical Inputs
- 8.3 Technology and Component Providers
- 8.4 Manufacturing or Service Delivery
- 8.5 Distribution, Channel Partners and Integrators
- 8.6 Downstream Applications and End Users
- 8.7 Value Addition and Profit Pools
- 8.8 Vertical Integration and Outsourcing
- 8.9 Supplier Concentration and Risk
- 8.10 Supply Chain Localization and Resilience
Chapter 9 Europe Garbage Trucks Market Regulations and Policies
- 9.1 Relevant Laws, Standards and Compliance Frameworks
- 9.2 Product, Service, Safety and Quality Requirements
- 9.3 Government Policies, Incentives and Subsidies
- 9.4 Imports, Exports and Trade Barriers
- 9.5 Public Procurement and Local Content Requirements
- 9.6 Environmental and Sustainability Compliance
- 9.7 Upcoming Policy Changes and Market Implications
Chapter 10 Europe Garbage Trucks Market Hotspots and Opportunities
- 10.1 Market Opportunity Mapping and Growth Hotspots
- 10.2 High-Growth Applications and Customer Groups
- 10.3 Underserved Markets and White-Space Opportunities
- 10.4 Emerging Technology and Product Opportunities
- 10.5 New Capacity and Investment Hotspots
- 10.6 Market Entry and Expansion Opportunities
- 10.7 Distribution and Partnership Opportunities
- 10.8 Near-Term and Long-Term Commercial Potential
- 10.9 Opportunity Attractiveness and Execution Risks
Chapter 11 Europe Garbage Trucks Market Outlook, 2025-2035
- 11.1 Market Size and Analysis
- 11.1.1 Revenue (Market Measurement: 2025: USD 2.29 billion → 2035: USD 3.83 billion)
- 11.1.2 Market Volume and Quantity Sold
- 11.1.3 Historical Market Size, 2018-2025
- 11.1.4 Base-Year Market Size, 2025
- 11.2 Market Forecast, 2025-2035
- 11.2.1 Revenue Forecast to 2035
- 11.2.2 Volume Forecast to 2035
- 11.2.3 CAGR and Year-on-Year Growth
- 11.2.4 Incremental Revenue Opportunity
- 11.3 Forecast Assumptions and Scenario Analysis
- 11.3.1 Base-Case Forecast
- 11.3.2 Optimistic and Conservative Scenarios
- 11.3.3 Technology, Pricing and Policy Sensitivities
- 11.4 Market Attractiveness and Growth Outlook
Chapter 12 Europe Garbage Trucks Market Segmentation and Outlook
- 12.1 Segmentation Summary and Market Shares, 2025
- 12.2 Largest and Fastest-Growing Segments
- 12.3 By Vehicle Type - Market Size and Forecast, 2025-2035
- 12.3.1 Segment Definition and Scope
- 12.3.2 Historical Market Size, 2018-2025
- 12.3.3 Revenue Forecast, 2025-2035
- 12.3.4 Volume Forecast, 2025-2035
- 12.3.5 Base-Year Market Share, 2025
- 12.3.6 Segment CAGR and Growth Drivers
- 12.3.7 Subsegment Market Size and Forecast
- 12.3.7.1 Rear Loaders
- 12.3.7.2 Side Loaders
- 12.3.7.3 Front Loaders
- 12.3.7.4 Roll-Off and Hook-Lift Trucks
- 12.3.8 Subsegment Pricing and Adoption Trends
- 12.3.9 Leading Suppliers and Competition
- 12.3.10 Regional Demand and Opportunities
- 12.4 By Powertrain - Market Size and Forecast, 2025-2035
- 12.4.1 Segment Definition and Scope
- 12.4.2 Historical Market Size, 2018-2025
- 12.4.3 Revenue Forecast, 2025-2035
- 12.4.4 Volume Forecast, 2025-2035
- 12.4.5 Base-Year Market Share, 2025
- 12.4.6 Segment CAGR and Growth Drivers
- 12.4.7 Subsegment Market Size and Forecast
- 12.4.7.1 Diesel and HVO-Compatible ICE
- 12.4.7.2 Battery Electric
- 12.4.7.3 CNG and Biomethane
- 12.4.7.4 Hydrogen Fuel Cell and Hybrid
- 12.4.8 Subsegment Pricing and Adoption Trends
- 12.4.9 Leading Suppliers and Competition
- 12.4.10 Regional Demand and Opportunities
- 12.5 By Customer Type - Market Size and Forecast, 2025-2035
- 12.5.1 Segment Definition and Scope
- 12.5.2 Historical Market Size, 2018-2025
- 12.5.3 Revenue Forecast, 2025-2035
- 12.5.4 Volume Forecast, 2025-2035
- 12.5.5 Base-Year Market Share, 2025
- 12.5.6 Segment CAGR and Growth Drivers
- 12.5.7 Subsegment Market Size and Forecast
- 12.5.7.1 Municipal Authorities
- 12.5.7.2 Private Waste Management Operators
- 12.5.7.3 Industrial and Commercial Fleet Owners
- 12.5.7.4 Leasing and Fleet Service Providers
- 12.5.8 Subsegment Pricing and Adoption Trends
- 12.5.9 Leading Suppliers and Competition
- 12.5.10 Regional Demand and Opportunities
- 12.6 By Sales Channel - Market Size and Forecast, 2025-2035
- 12.6.1 Segment Definition and Scope
- 12.6.2 Historical Market Size, 2018-2025
- 12.6.3 Revenue Forecast, 2025-2035
- 12.6.4 Volume Forecast, 2025-2035
- 12.6.5 Base-Year Market Share, 2025
- 12.6.6 Segment CAGR and Growth Drivers
- 12.6.7 Subsegment Market Size and Forecast
- 12.6.7.1 Public Procurement Tenders
- 12.6.7.2 Bodybuilder-Dealer Networks
- 12.6.7.3 Direct OEM Sales
- 12.6.7.4 Leasing and Fleet-as-a-Service
- 12.6.8 Subsegment Pricing and Adoption Trends
- 12.6.9 Leading Suppliers and Competition
- 12.6.10 Regional Demand and Opportunities
- 12.7 By Country - Market Size and Forecast, 2025-2035
- 12.7.1 Segment Definition and Scope
- 12.7.2 Historical Market Size, 2018-2025
- 12.7.3 Revenue Forecast, 2025-2035
- 12.7.4 Volume Forecast, 2025-2035
- 12.7.5 Base-Year Market Share, 2025
- 12.7.6 Segment CAGR and Growth Drivers
- 12.7.7 Subsegment Market Size and Forecast
- 12.7.7.1 Germany
- 12.7.7.2 United Kingdom
- 12.7.7.3 France
- 12.7.7.4 Rest of Europe
- 12.7.8 Subsegment Pricing and Adoption Trends
- 12.7.9 Leading Suppliers and Competition
- 12.7.10 Regional Demand and Opportunities
- 12.8 Segment Growth Comparison
- 12.9 Segment Attractiveness and Priority Matrix
Chapter 13 Europe Garbage Trucks End-Use and Application Market Outlook
- 13.1 End-Use Industry and Customer Demand Structure
- 13.2 Leading Applications and Customer Groups
- 13.3 End-Use Market Size, Share and Forecast
- 13.4 Major End-Use Industry Deep Dives
- 13.4.1 Customer Requirements and Use Cases
- 13.4.2 Demand and Replacement Cycles
- 13.4.3 Technical and Regulatory Considerations
- 13.4.4 Purchasing and Procurement Models
- 13.4.5 Leading Vendors and Distribution Channels
- 13.4.6 Forecast and Commercial Opportunities
- 13.5 Emerging Applications and Cross-Segment Demand
- 13.6 End-Use Industry Investment Priorities
Chapter 14 Europe Garbage Trucks Geographic Market Outlook, 2025-2035
- 14.1 Regional Market Size and Country-Level Shares, 2025
- 14.2 Country Market Size Comparison, 2025
- 14.3 Country Market Forecasts, 2025-2035
- 14.4 Subregional Industrial and Demand Clusters
- 14.5 Intra-Regional Pricing and Cost Differences
- 14.6 Cross-Border Trade and Supply Networks
- 14.7 Regional Supply and Demand Balances
- 14.8 Country Opportunity Comparison and Prioritization
Note: Every listed country is covered on the structure shown under the first country.
Chapter 15 Europe Garbage Trucks Technology, Innovation and Sustainability Outlook
- 15.1 Technology Landscape and Maturity
- 15.2 Product, Process and Service Innovation
- 15.3 AI, Automation and Digital Tools in the Industry
- 15.4 Technology Adoption and Performance Benchmarking
- 15.5 Innovation Pipeline and R&D Investment
- 15.6 Patent and Intellectual Property Trends
- 15.7 Energy Efficiency and Resource Management
- 15.8 Sustainability, Recycling and Circularity
- 15.9 Technology Roadmap, 2025-2035
- 15.10 Risks of Obsolescence and Technology Substitution
Chapter 16 Europe Garbage Trucks Market Key Strategic Imperatives
- 16.1 Growth and Market Entry Priorities
- 16.2 High-Return Products and Segments
- 16.3 Pricing, Profitability and Cost Optimization
- 16.4 Technology Investment and Product Differentiation
- 16.5 Supply Chain Localization and Resilience
- 16.6 Distribution and Customer Acquisition
- 16.7 Partnership, Acquisition and Capacity Strategy
- 16.8 Regional Expansion Priorities
- 16.9 Short-, Medium- and Long-Term Actions
Chapter 17 Competition Outlook
- 17.1 Industry Competition Characteristics
- 17.2 Market Structure and Concentration
- 17.3 Market Share and Competitive Positioning, 2025
- 17.4 Company-Wise Revenue and Product Benchmarking
- 17.5 Production and Service Capacity Benchmarking
- 17.6 Technology, Pricing and Differentiation
- 17.7 Regional Footprint and Distribution Strength
- 17.8 Mergers, Acquisitions and Strategic Alliances
- 17.9 New Entrants and Competitive Threats
- 17.10 Porter's Five Forces and Industry Attractiveness
- 17.11 Competitive Outlook, 2025-2035
Chapter 18 Company Profiles
- 18.1 Company Coverage and Selection Criteria
- 18.2 FAUN Group
- 18.2.1 Business Description
- 18.2.2 Company Ownership and Geographic Presence
- 18.2.3 Product and Service Portfolio
- 18.2.4 Manufacturing and Operating Footprint
- 18.2.5 Production Capacity and Expansion Plans
- 18.2.6 Financial Performance and Investment
- 18.2.7 Market Share and Competitive Position
- 18.2.8 Technology and Innovation Capabilities
- 18.2.9 Strategic Alliances or Partnerships
- 18.2.10 Recent Developments
- 18.2.11 Growth Strategy and Outlook
- 18.3 Terberg Environmental
- 18.4 ZOELLER Group
- 18.5 Bucher Municipal
- 18.6 Dennis Eagle
- 18.7 Volvo Trucks
- 18.8 Mercedes-Benz Trucks
- 18.9 Scania
- 18.10 DAF Trucks
- 18.11 IVECO
- 18.12 Other Relevant Market Participants
Note: Every listed company is profiled on the structure shown under the first company. The company list is preliminary and may change based on research findings, market developments, data availability and client requirements.
Chapter 19 Disclaimer
- 19.1 Research and Forecast Disclaimer
- 19.2 Data Source and Estimation Limitations
Note: The depth of individual sections depends on data availability for this market. Volume, capacity, trade and other unit-based metrics are included where applicable.

