
Security tiers, not enrollment, now carry spending growth
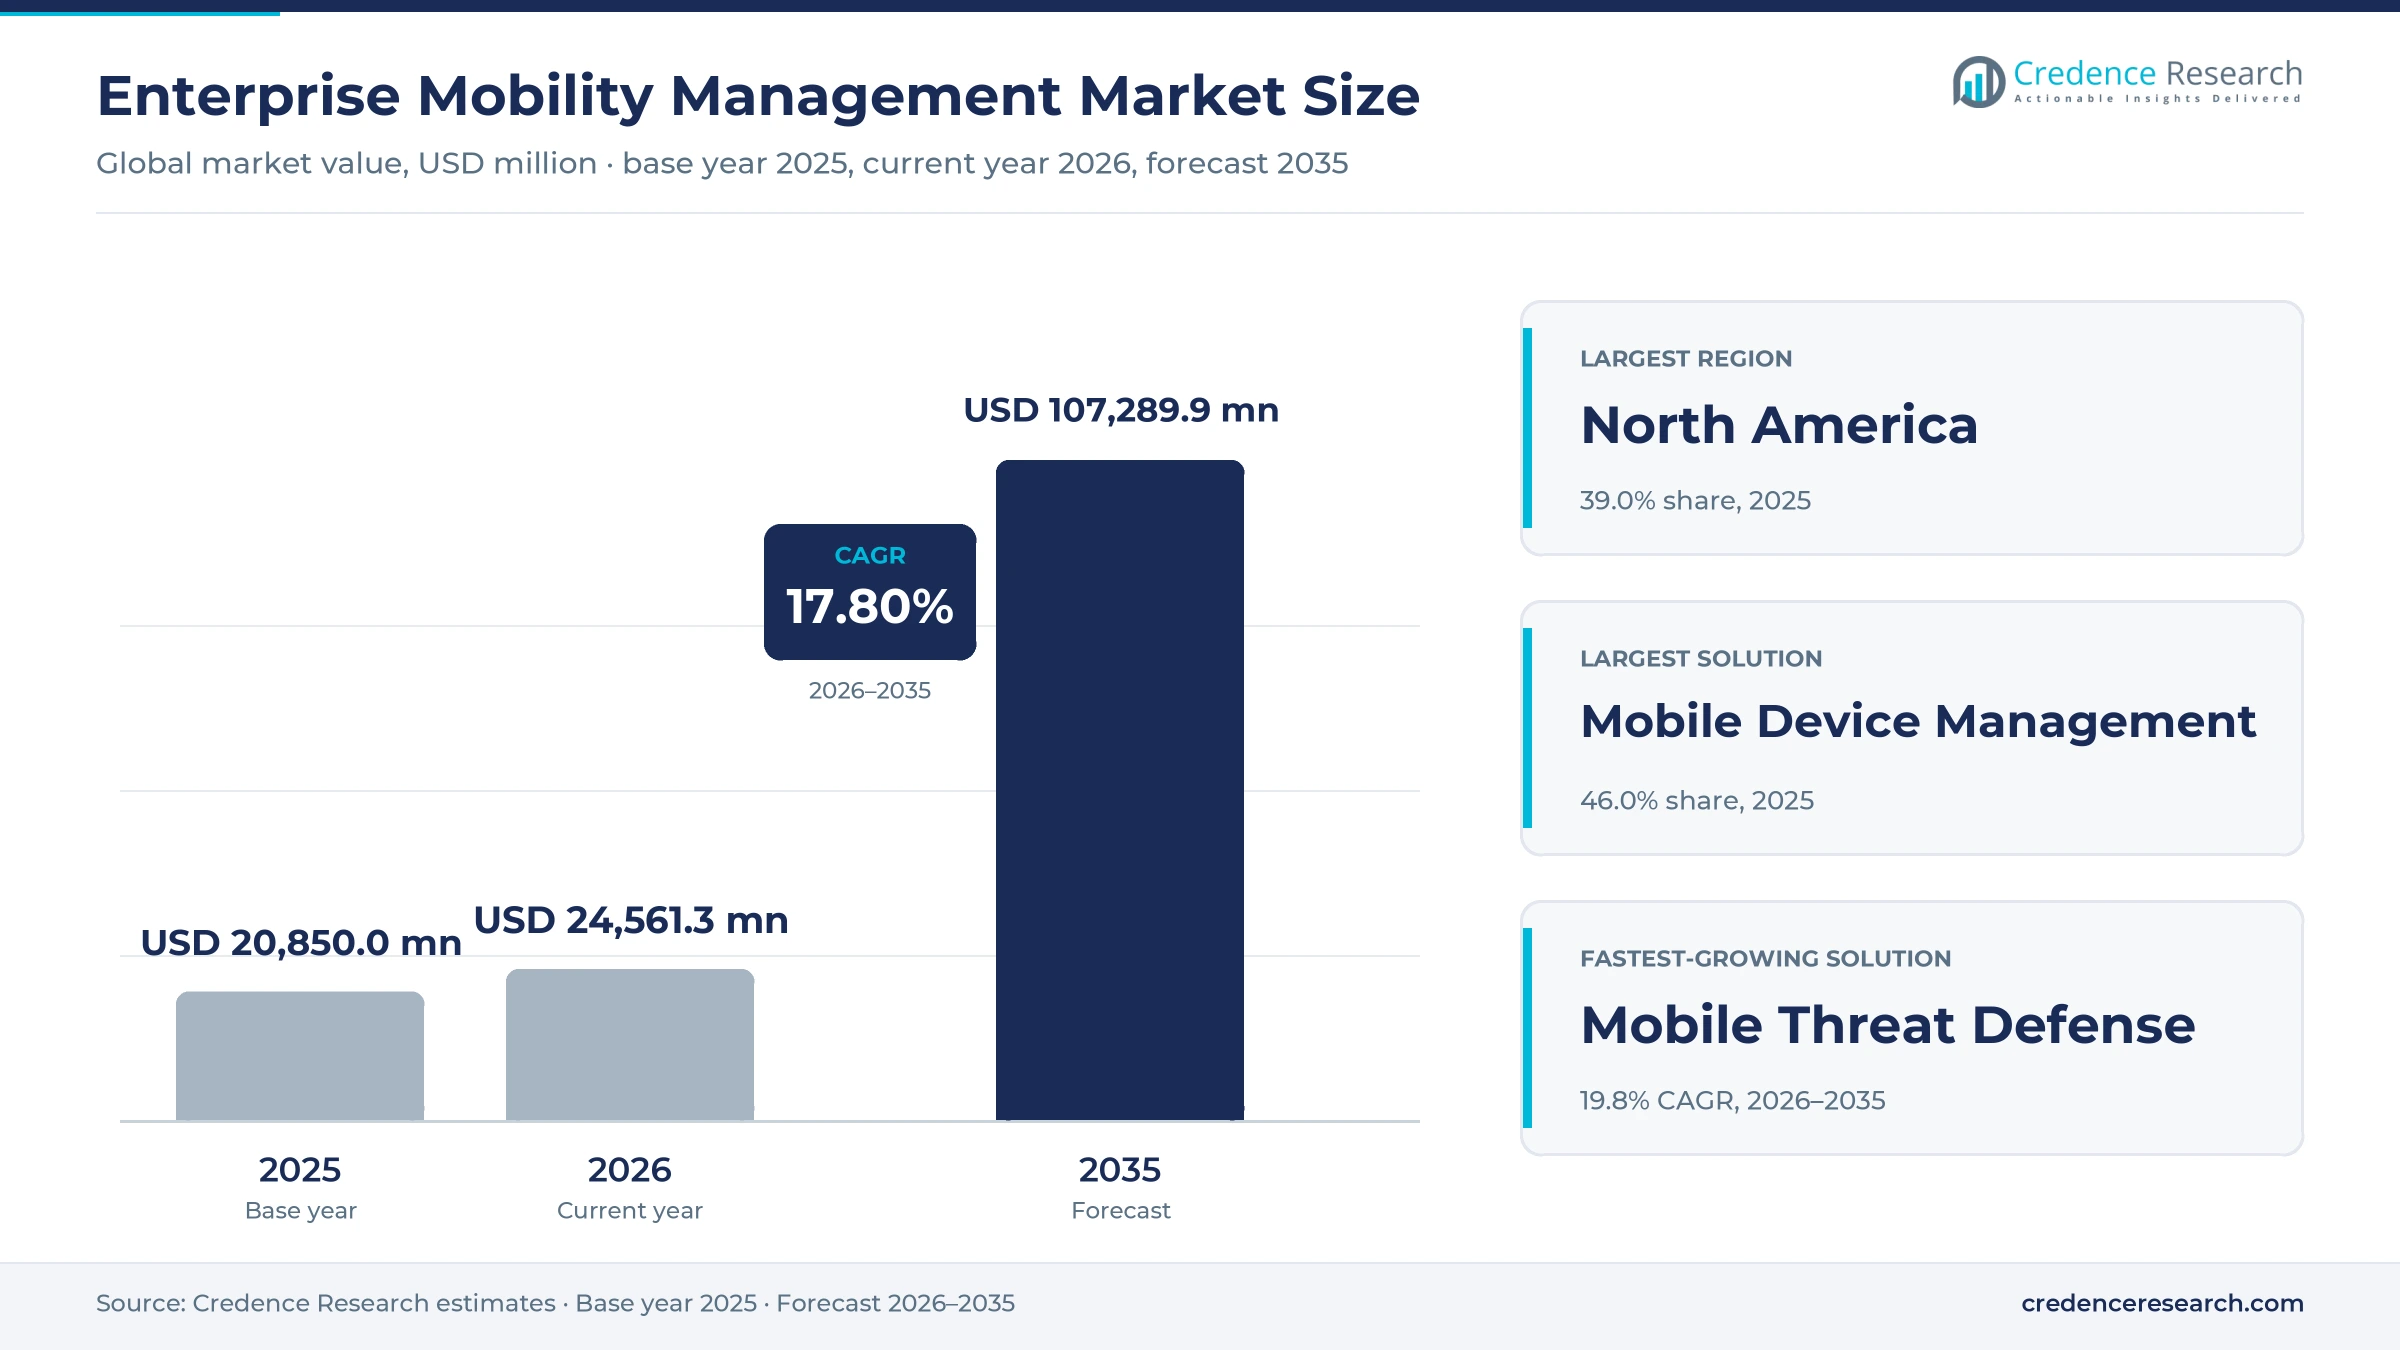
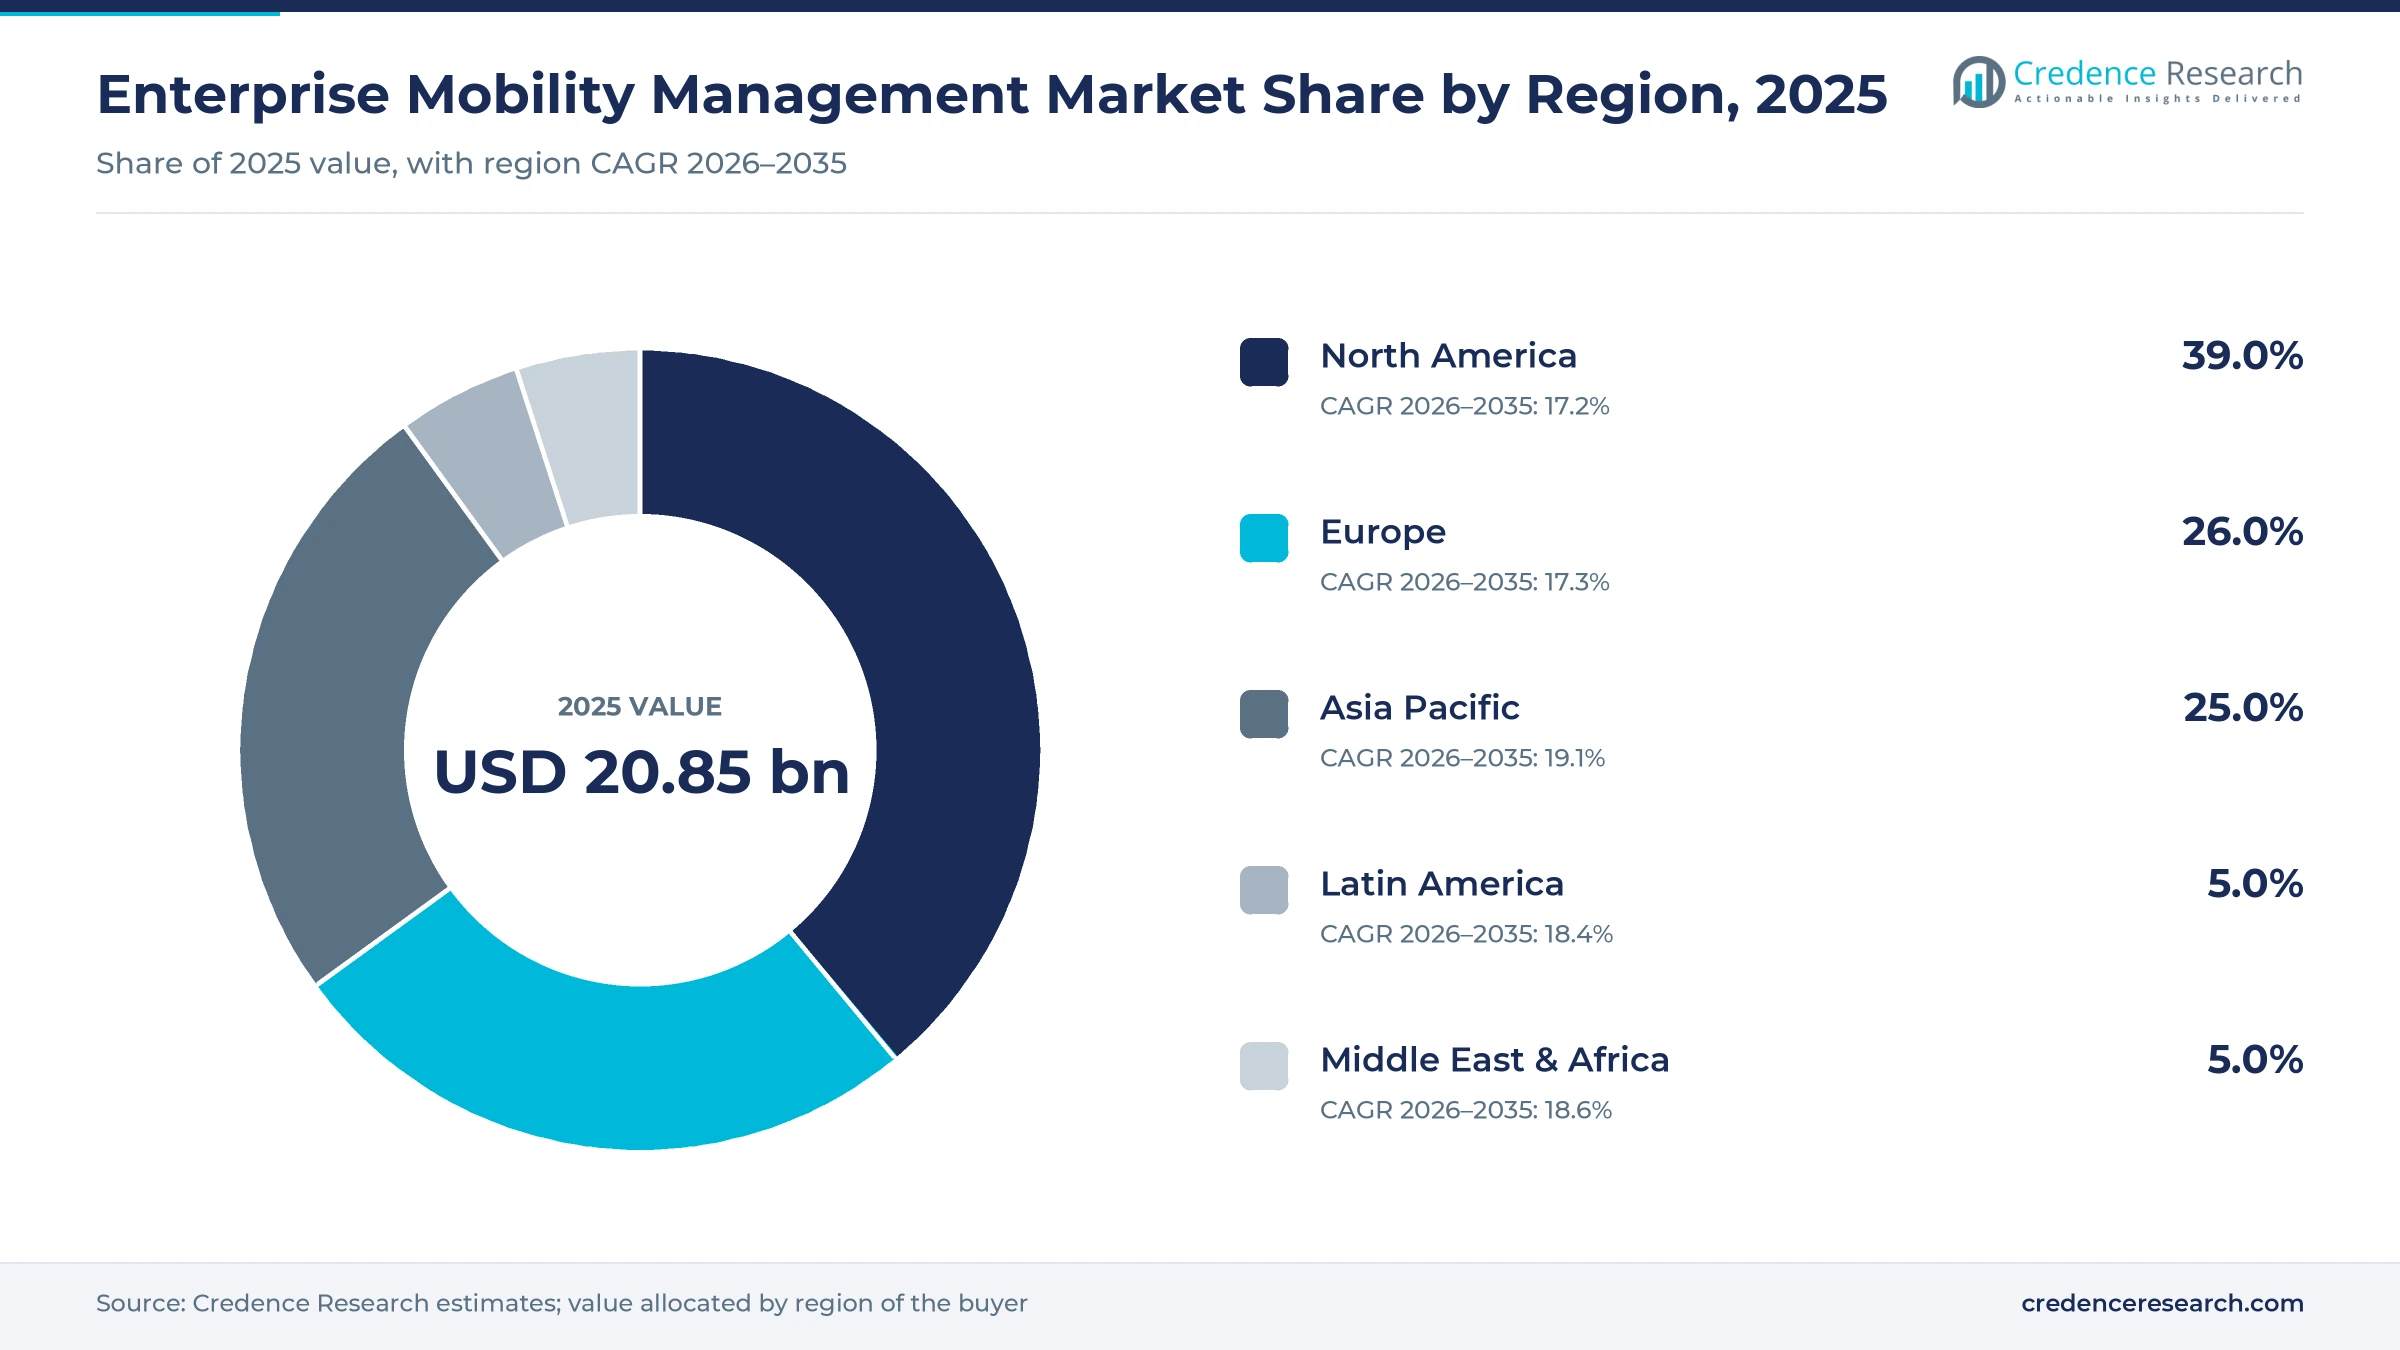
The global enterprise mobility management market was valued at USD 20.85 billion in 2025 and is projected to increase from USD 24.56 billion in 2026 to USD 107.29 billion by 2035, registering a CAGR of 17.80% during 2026–2035. Spending covers device enrollment, app and content controls, identity checks and threat defense for phones, tablets, laptops and rugged devices, plus the services that deploy and run them. Demand comes from banks, hospitals, public agencies and frontline operators that must prove control over devices that leave the office. North America held the largest regional share, 39.0% in 2025, because large federal and corporate fleets buy multi-platform licenses early. Asia Pacific is the fastest-growing region at 19.1% a year as 5G coverage and new privacy rules widen the buyer base. The main commercial change is bundling, since Microsoft is folding former add-on features into its main business suites, which lowers standalone prices and pushes specialist vendors toward security and frontline use cases.
Device, app and identity controls now sit in one console
The market counts software that enrolls and configures mobile and desktop devices, distributes and restricts business apps, protects shared files, verifies users and detects threats on the device, sold as subscriptions or perpetual licenses. It also counts the consulting, deployment and managed services that organizations buy to run these tools across mixed fleets of Apple, Android and Windows devices.
Device hardware, carrier airtime, general network security appliances and desktop virtualization licenses are excluded, even where the same vendors sell them. Value sits mainly with platform vendors that own the management console, while integrators and managed service providers earn fees for enrollment projects, policy design and help-desk support.
Enterprise Mobility Management Market Insights
- The global enterprise mobility management market was valued at USD 20.85 billion in 2025 and is projected to reach USD 107.29 billion by 2035, growing at a 17.80% CAGR during 2026–2035.
- North America held 39.0% of 2025 value, supported by large corporate Apple and Windows fleets and federal mobile security guidance.
- Mobile device management held 46.0% of 2025 value, while mobile threat defense grows fastest at 19.8% a year as phone attacks rise.
- Verizon's 2025 Mobile Security Index found that 85% of organizations saw mobile attacks rise and 75% raised mobile security spending.
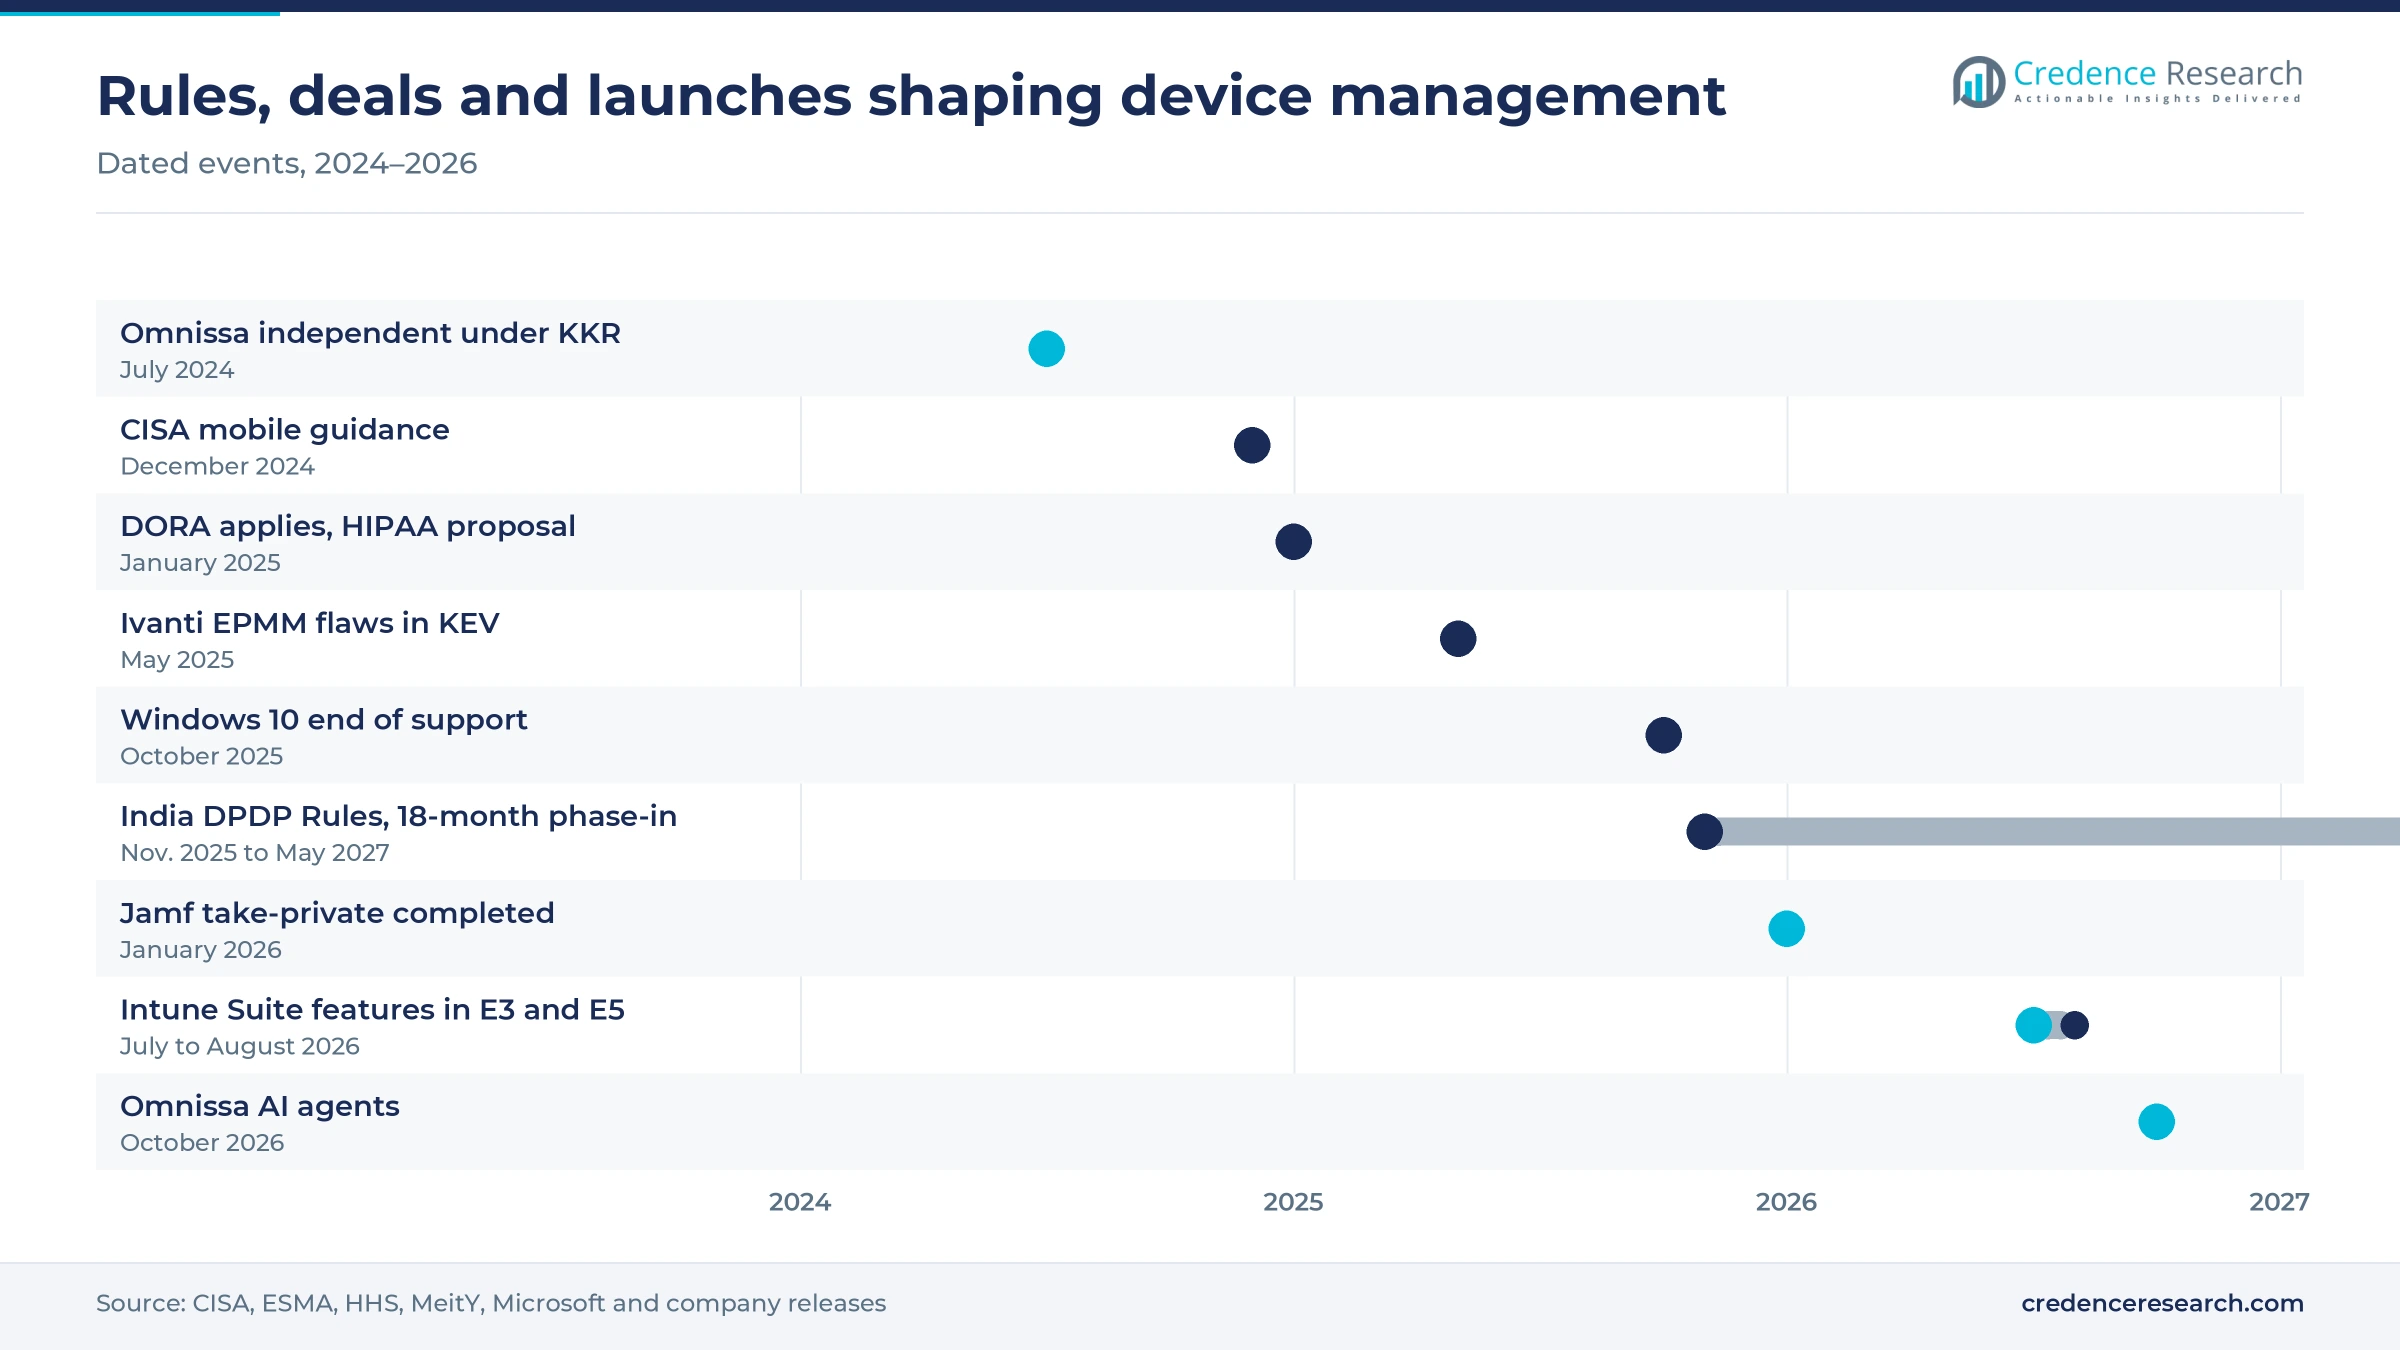
- Francisco Partners closed its USD 2.2 billion take-private of Jamf on Jan. 30, 2026, after KKR made Omnissa independent in July 2024.
Device control leads as threat defense grows fastest
Device control leads while threat defense grows fastest
Based on solution, the market is categorized into mobile device management, mobile application management, mobile content management, identity and access management, and mobile threat defense. Mobile Device Management led with 46.0% of 2025 value because app, content and threat controls all run on an enrolled device, and Apple said in June 2025 that iOS 26 moves enrolled devices between servers without wiping them, making enrollment the vendor switching point. Mobile Threat Defense grows fastest at 19.8% a year, as Zimperium found in April 2025 that over 50% of devices run outdated or compromised software. Banks and agencies often license mobile threat defense separately, keeping it priced apart from suite bundles.
Cloud consoles lead as suite bundling speeds the shift
Based on deployment, the market is categorized into cloud-based and on-premises deployment. Cloud-Based deployment led with 66.0% of 2025 value because vendors run policy, patch and analytics services centrally, which spares buyers the self-hosted server exposure shown by the exploited Ivanti flaws described in the challenges. Cloud-based deployment also grows fastest at 18.3% a year as Microsoft completed the rollout of former Intune Suite features to eligible Microsoft 365 E3 and E5 tenants by Aug. 1, 2026. On-premises deployment holds on in defense and sovereign government estates, where device data must stay inside national networks.
Large fleets lead while low entry prices lift smaller firms
Based on enterprise size, the market is categorized into large enterprises and small and medium-sized enterprises. Large Enterprises led with 61.0% of 2025 value because they run mixed fleets across many sites and buy multi-year platform contracts, as Shared Services Canada did when it renewed its BlackBerry UEM and secure communications agreement on March 31, 2026. Small and Medium-Sized Enterprises grow fastest at 18.7% a year as entry pricing falls, and Jamf lists Jamf Now at USD 4.00 per device per month with the first three devices free. Smaller firms still lack the staff to write and audit device policies, which favors managed service bundles.
Banks lead on resilience rules as healthcare grows fastest
Based on industry vertical, the market is categorized into BFSI, healthcare, government, retail, IT and telecom, and manufacturing and other users. BFSI led with 24.0% of 2025 value because supervisors now test how banks and insurers control endpoints, and the EU Digital Operational Resilience Act has applied to financial entities since Jan. 17, 2025, according to ESMA. Healthcare grows fastest at 19.2% a year as an HHS proposal published Jan. 6, 2025, would require encryption of patient data, multifactor authentication and a written technology asset inventory under the HIPAA Security Rule. The rule is not yet final, so the timing of hospital spending remains uncertain.
| Segment Group | Leading Sub-segment | Share, 2025 | Fastest-growing Sub-segment | CAGR, 2026–2035 |
|---|---|---|---|---|
| By Solution | Mobile Device Management | 46.0% | Mobile Threat Defense | 19.8% |
| By Deployment | Cloud-Based | 66.0% | Cloud-Based | 18.3% |
| By Enterprise Size | Large Enterprises | 61.0% | Small and Medium-Sized Enterprises | 18.7% |
| By Industry Vertical | BFSI | 24.0% | Healthcare | 19.2% |
Per-user bundles undercut per-device list prices
Pricing follows two models, per user for suites that cover all of a worker's devices and per device for Apple, rugged and shared fleets. Per-user plans suit office staff who carry a laptop and a phone, while per-device plans suit kiosks and handhelds shared across shifts. List prices tell only part of the story, because large buyers negotiate discounts and many receive management inside wider productivity suites. Bundling pushes the effective price of basic enrollment toward zero, so vendor margins increasingly depend on security add-ons, Apple specialization and managed services.
| Plan | Typical price or fee | Basis |
|---|---|---|
| Microsoft Intune Plan 1 | USD 8.00 per user per month | Microsoft lists, November 2026 |
| Microsoft Intune Suite add-on | USD 10.00 per user per month | Microsoft lists, November 2026 |
| Jamf Pro for iOS and iPadOS | USD 3.33 per device per month, billed annually | Jamf lists, November 2026 |
| Jamf Pro for macOS | USD 7.17 per device per month, billed annually | Jamf lists, November 2026 |
| Hexnode UEM Pro to Ultimate | USD 2.20 to 4.70 per device per month | Hexnode pricing snapshot, September 2026 |
Request a Free Sample
Fill in your details and we'll send you a free sample report.
- Sample data tables & charts
- Research methodology
Attacks, hybrid work and data rules widen managed fleets
Mobile attacks push security budgets toward device controls
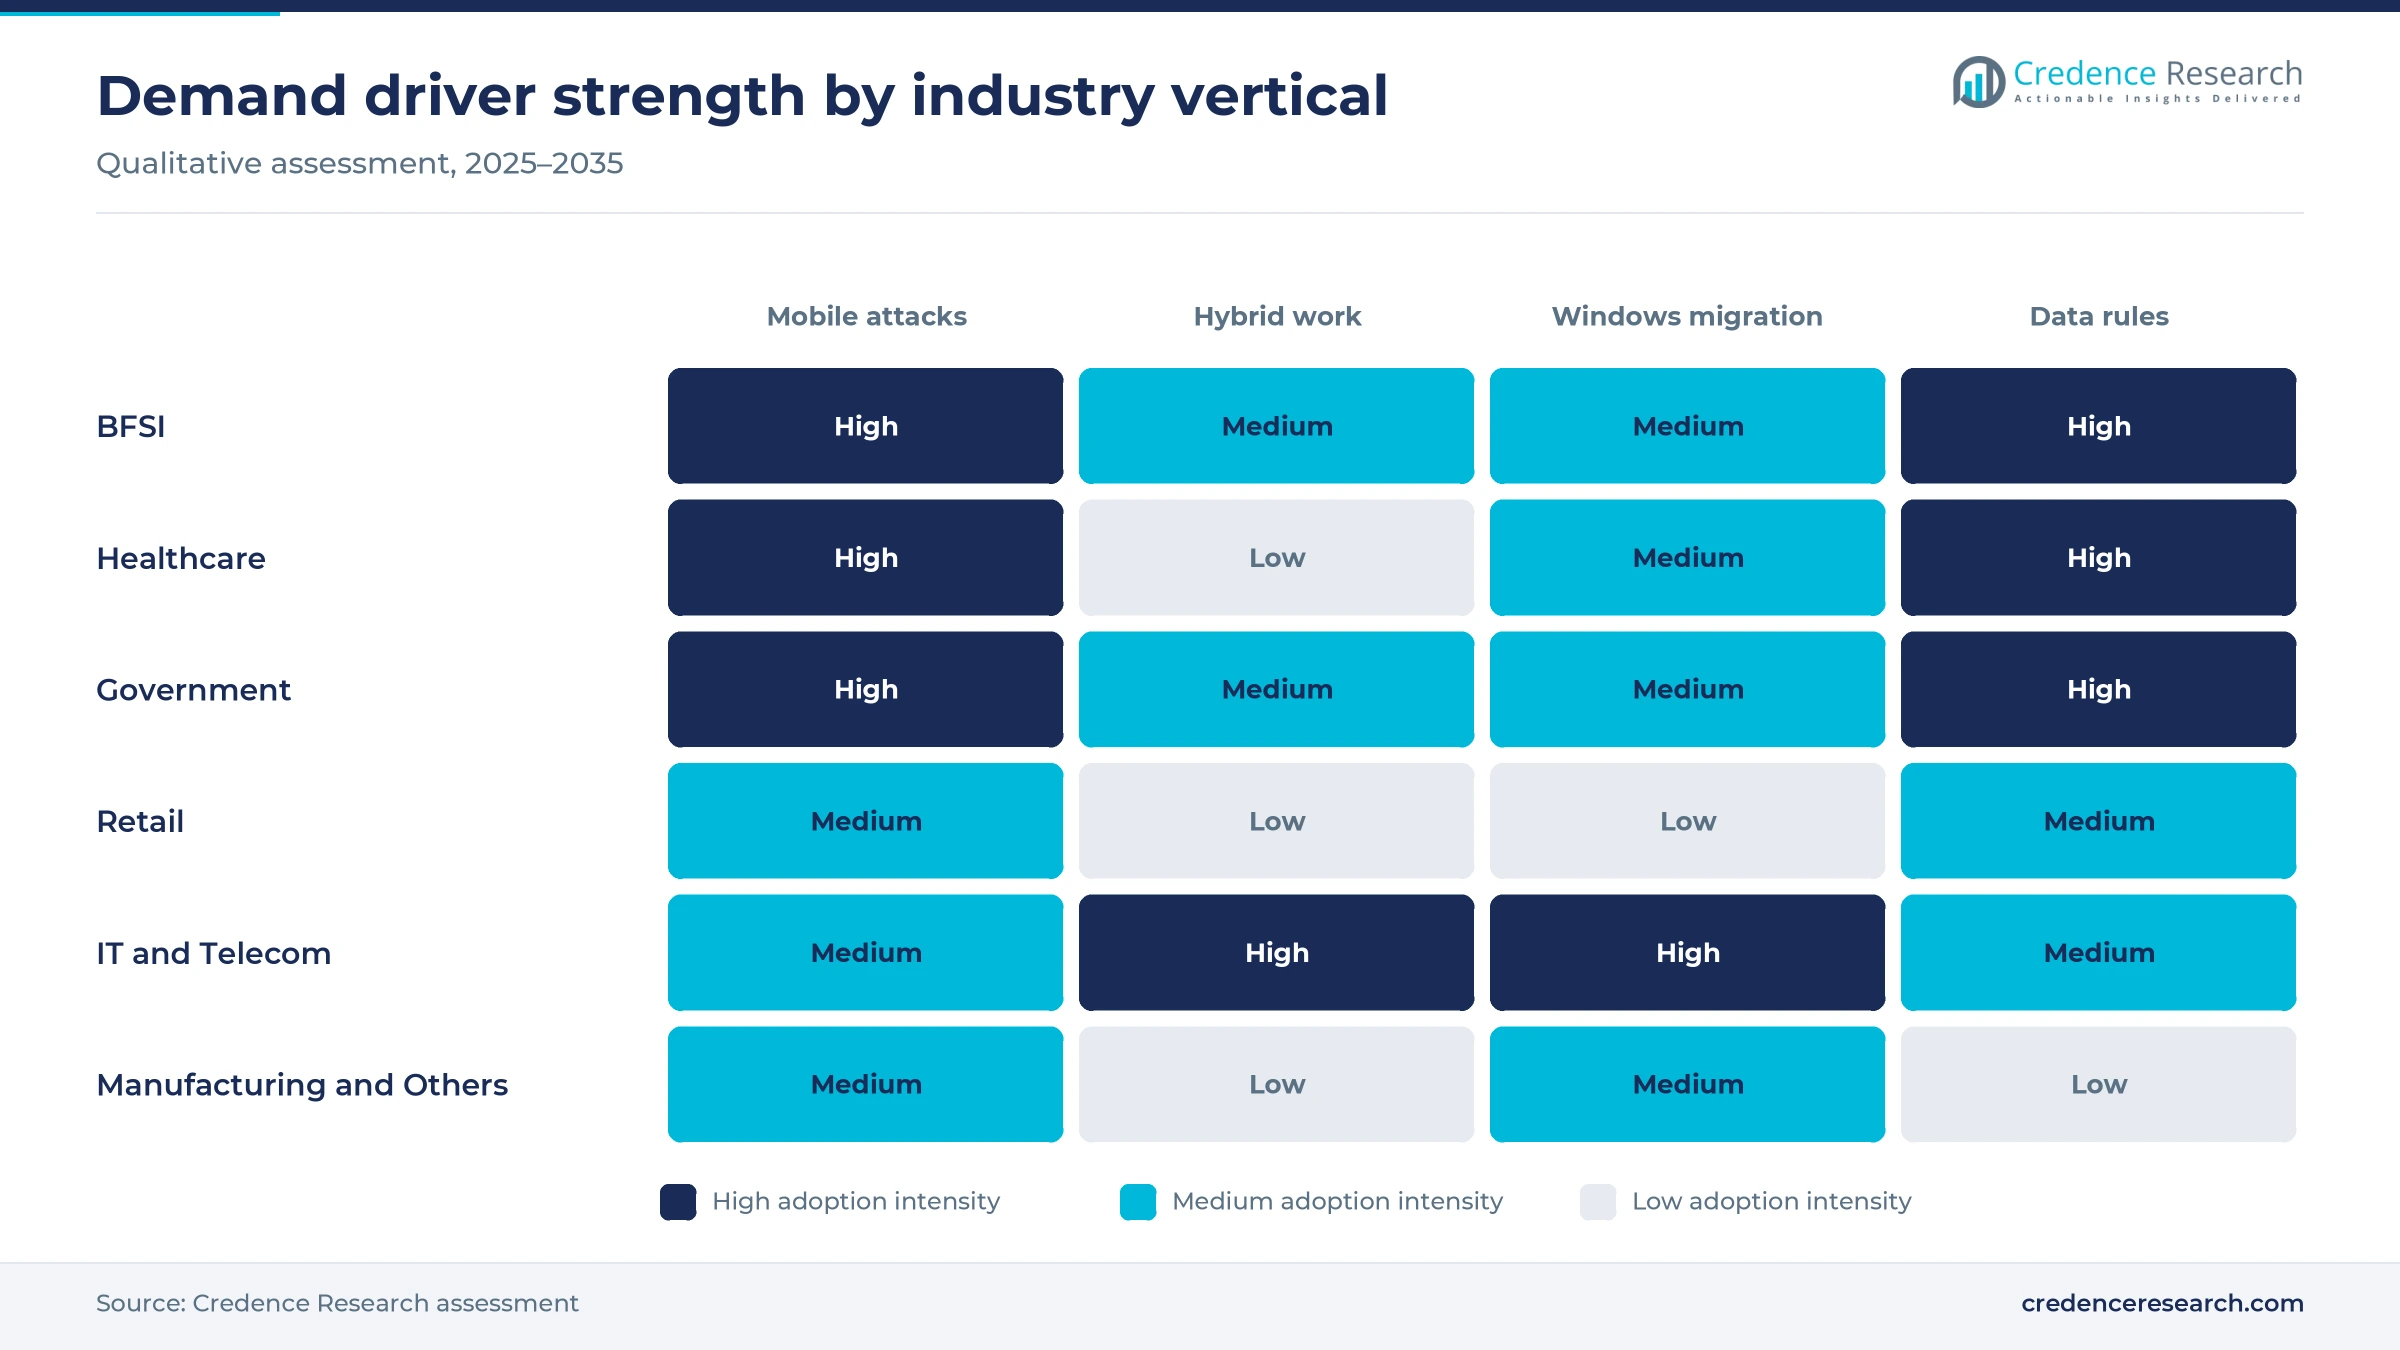
Rising attack rates on phones and tablets are turning device control from an IT convenience into a funded security line, because a compromised handset now reaches email, files and cloud apps directly. Verizon's 2025 Mobile Security Index, released in October 2025, found that 85% of organizations saw mobile attacks rise. The same survey found that 89% hold a specific mobile security budget and that 75% raised that spending over the past year. Security teams now justify purchases on incident cost rather than device count, which favors suites that bundle enrollment, app control and threat detection. Vendors that report device risk to security operations tools gain the most, while basic configuration tools risk being bundled away.
Hybrid work keeps corporate data on devices outside the office
Work done outside the office keeps corporate data on devices that perimeter firewalls never see, so policy must travel with the device and the app. The U.S. Bureau of Labor Statistics found that 22.6% of workers teleworked in March 2026, and the rate ranged from 21.5% to 23.0% over the prior year. ITU counted 99 mobile broadband subscriptions per 100 inhabitants worldwide in 2025, with 36% of them on 5G. Ericsson reported 3.1 billion 5G subscriptions in the first quarter of 2026. Faster mobile links let staff run full business apps from phones, so each worker brings more devices under management. Per-user licensing captures this growth better than per-device pricing does.
Windows migration pulls laptops into the same console as phones
Windows fleet changes are moving laptops onto the same cloud consoles that already manage phones, because modern management replaces older on-site imaging and patch servers. Microsoft ended Windows 10 support on Oct. 14, 2025, which left organizations to upgrade, replace or pay for Extended Security Updates on their remaining devices. Omnissa announced Windows Server management for Workspace ONE in May 2026, extending one cloud console from endpoints to servers. SOTI's 2026.1 release added centralized firmware and patch management for Windows devices and integration with Microsoft Defender for Endpoint. Vendors that cover Windows, Apple and Android in one license gain a larger share of wallet, while single-platform tools face consolidation pressure at renewal.
Data protection rules extend audit duties to mobile endpoints
Data protection rules are extending audit duties to every device that stores regulated data, which makes enrollment, encryption and remote wipe compliance requirements rather than options. CISA issued mobile communications guidance in December 2024 that tells highly targeted officials to assume their mobile communications could be intercepted and to use end-to-end encryption consistently. India notified its Digital Personal Data Protection Rules on Nov. 13, 2025, with most obligations taking effect after 18 months. The EU resilience rules for financial firms noted above add documented ICT controls to the same list. Vendors with audit reporting and data residency options gain in these accounts, while tools without usable logs lose evaluations.
AI agents and platform mergers reshape vendor choice
AI agents are shifting endpoint work from consoles to approvals
Platform vendors are shifting toward AI agents that prepare patches, packages and fixes for administrator approval, to address staffing limits in IT teams, creating openings for governance features across large fleets. Omnissa introduced three IT agents and a hosted MCP server in October 2026, and it said AI assistant use across enterprise endpoints rose nearly 1,000% year on year. Omnissa also found that three-quarters of that assistant activity came from unsanctioned tools, and its platform runs about 150 million workflow executions a month. The top E5 suite now links Intune with Security Copilot for agent-based tasks, according to Petri. Verizon's index found that only 17% of organizations had controls specific to AI-assisted attacks. Vendors that log and gate agent actions will pass security reviews at regulated buyers.
Identity, security and device control are merging into one platform
Device management vendors are shifting toward platforms that join identity, endpoint security and compliance, to address tool sprawl, creating openings for single-contract deals with mid-sized firms. Kandji renamed itself Iru on Oct. 22, 2025, and launched a platform combining workforce identity, device management, endpoint detection and compliance automation. Private equity has backed this consolidation, as KKR completed its USD 4 billion purchase of the former VMware end-user computing unit, now Omnissa, on July 1, 2024. Francisco Partners closed its USD 2.2 billion take-private of Jamf on Jan. 30, 2026. Buyers of identity and access tools now face overlap with device vendors at renewal, which pressures standalone single sign-on pricing.
Shared frontline devices open a large underserved fleet
Shared devices used by shift workers in retail, logistics and healthcare open a large opening for vendors that make handover fast and secure, because one handset often passes between workers at each shift change. SOTI released version 2026.1 of SOTI ONE in June 2026, letting users end the previous session from the unlock screen and sign in with PIN, NFC or both. SOTI says it serves more than 17,000 customers around the world. Samsung split Knox Suite into Base, Essentials and Enterprise plans in January 2025, with the Base plan included in Galaxy device purchases at no extra cost. Samsung says over 35,000 businesses in 134 countries use Knox. Retailers and logistics operators gain less downtime, while vendors gain recurring per-device fees on rugged fleets.
Sovereign and post-quantum controls create a public-sector opening
Public agencies that must keep device data inside national networks create an opening for vendors that offer on-premises consoles with modern cryptography, because cloud-only tools cannot meet their residency rules. BlackBerry announced on June 16, 2026, that BlackBerry UEM will add post-quantum cryptographic libraries aligned with NIST standards, a path toward FIPS 140-3 accreditation and macOS management in its on-premises model. Those features were expected in summer 2026, with some console upgrades due later in the year. BlackBerry also says its UEM is the only endpoint tool certified by Germany's BSI under Common Criteria for managing Apple and Samsung devices in government use. Defense ministries and multi-agency service providers gain an alternative to public cloud consoles, although the certification claim comes from the vendor itself.
Server flaws, bundling and phishing restrain spending
Self-hosted servers expose buyers to fast exploitation
Self-hosted management servers expose buyers to fast exploitation, because the console holds credentials and push rights for every enrolled device. CISA added two Ivanti Endpoint Manager Mobile flaws to its exploited vulnerabilities catalog on May 19, 2025, and Shadowserver counted about 940 vulnerable instances days earlier, according to Cybersecurity Dive. Agencies and banks that keep on-premises consoles for data control are the most exposed. Fast patch programs and moves to vendor-run cloud consoles reduce that risk but add migration cost.
Suite bundling compresses prices for standalone tools
Suite bundling compresses prices for standalone management and security tools, because buyers compare each quote against features they already own. Microsoft lists Remote Help at USD 3.50, Advanced Analytics at USD 5.00 and Endpoint Privilege Management at USD 3.00 per user per month as add-ons, and it is folding several of them into its E3 and E5 suites. Specialist vendors selling into Windows-heavy firms are the most exposed at renewal. They respond by targeting Apple fleets, rugged devices and sovereign deployments.
Overlapping tools raise integration costs for IT teams
Overlapping tools raise integration costs, because each console keeps its own device records, policies and alerts. Iru said in October 2025 that nearly half of IT teams cite overlapping tools as a top challenge. Mid-sized firms without integration staff are the most exposed, since they pay twice for similar features and still lack a single device record. Consolidation helps only when migration is cheap, and the iOS 26 migration feature described above lowers that cost for Apple fleets.
Social engineering bypasses device policy
Social engineering bypasses device policy, because a user who approves a malicious login or types a password into a fake page defeats most configuration controls. Zimperium found in April 2025 that SMS phishing makes up about 69% of mobile phishing attacks and that voice phishing rose 28%. Banks and health systems with large customer-facing workforces are the most exposed. Vendors answer with phishing-resistant sign-in and on-device link scanning, which adds cost and some user friction.
North America leads as Asia Pacific grows fastest
| Region | Value, 2025 (USD billion) | Share, 2025 | CAGR, 2026–2035 |
|---|---|---|---|
| North America | 8.13 | 39.0% | 17.1% |
| Europe | 5.42 | 26.0% | 17.2% |
| Asia Pacific | 5.21 | 25.0% | 19.1% |
| Latin America | 1.04 | 5.0% | 18.4% |
| Middle East & Africa | 1.04 | 5.0% | 18.6% |
North America leads on federal and corporate security spending
North America held 39.0% of 2025 value and grows at 17.1% a year, because the region combines the largest corporate Apple and Windows fleets with federal security guidance. Shared Services Canada's March 2026 renewal of its BlackBerry UEM agreement, noted above, shows that federal buyers in the region commit to multi-year platform contracts. Most leading platform vendors, including Microsoft, Jamf, Omnissa and Iru, are based in the United States, and the CISA guidance and HIPAA proposal described above shape buyer requirements. Slower growth than Asia Pacific reflects high existing penetration among large firms.
Europe buys on resilience and certification rules
Europe held 26.0% of 2025 value and grows at 17.2% a year. Demand rests on regulation more than on new devices, since DORA, described above, makes banks and insurers document ICT controls, and BSI certification, which BlackBerry says its UEM holds, narrows the choice for German government buyers. ITU reports that over four in ten mobile broadband subscriptions in Europe were 5G in 2025, a base that suits field use of full business apps. Data residency preferences favor vendors with EU-hosted clouds or on-premises options.
Asia Pacific grows fastest on 5G scale and new privacy law
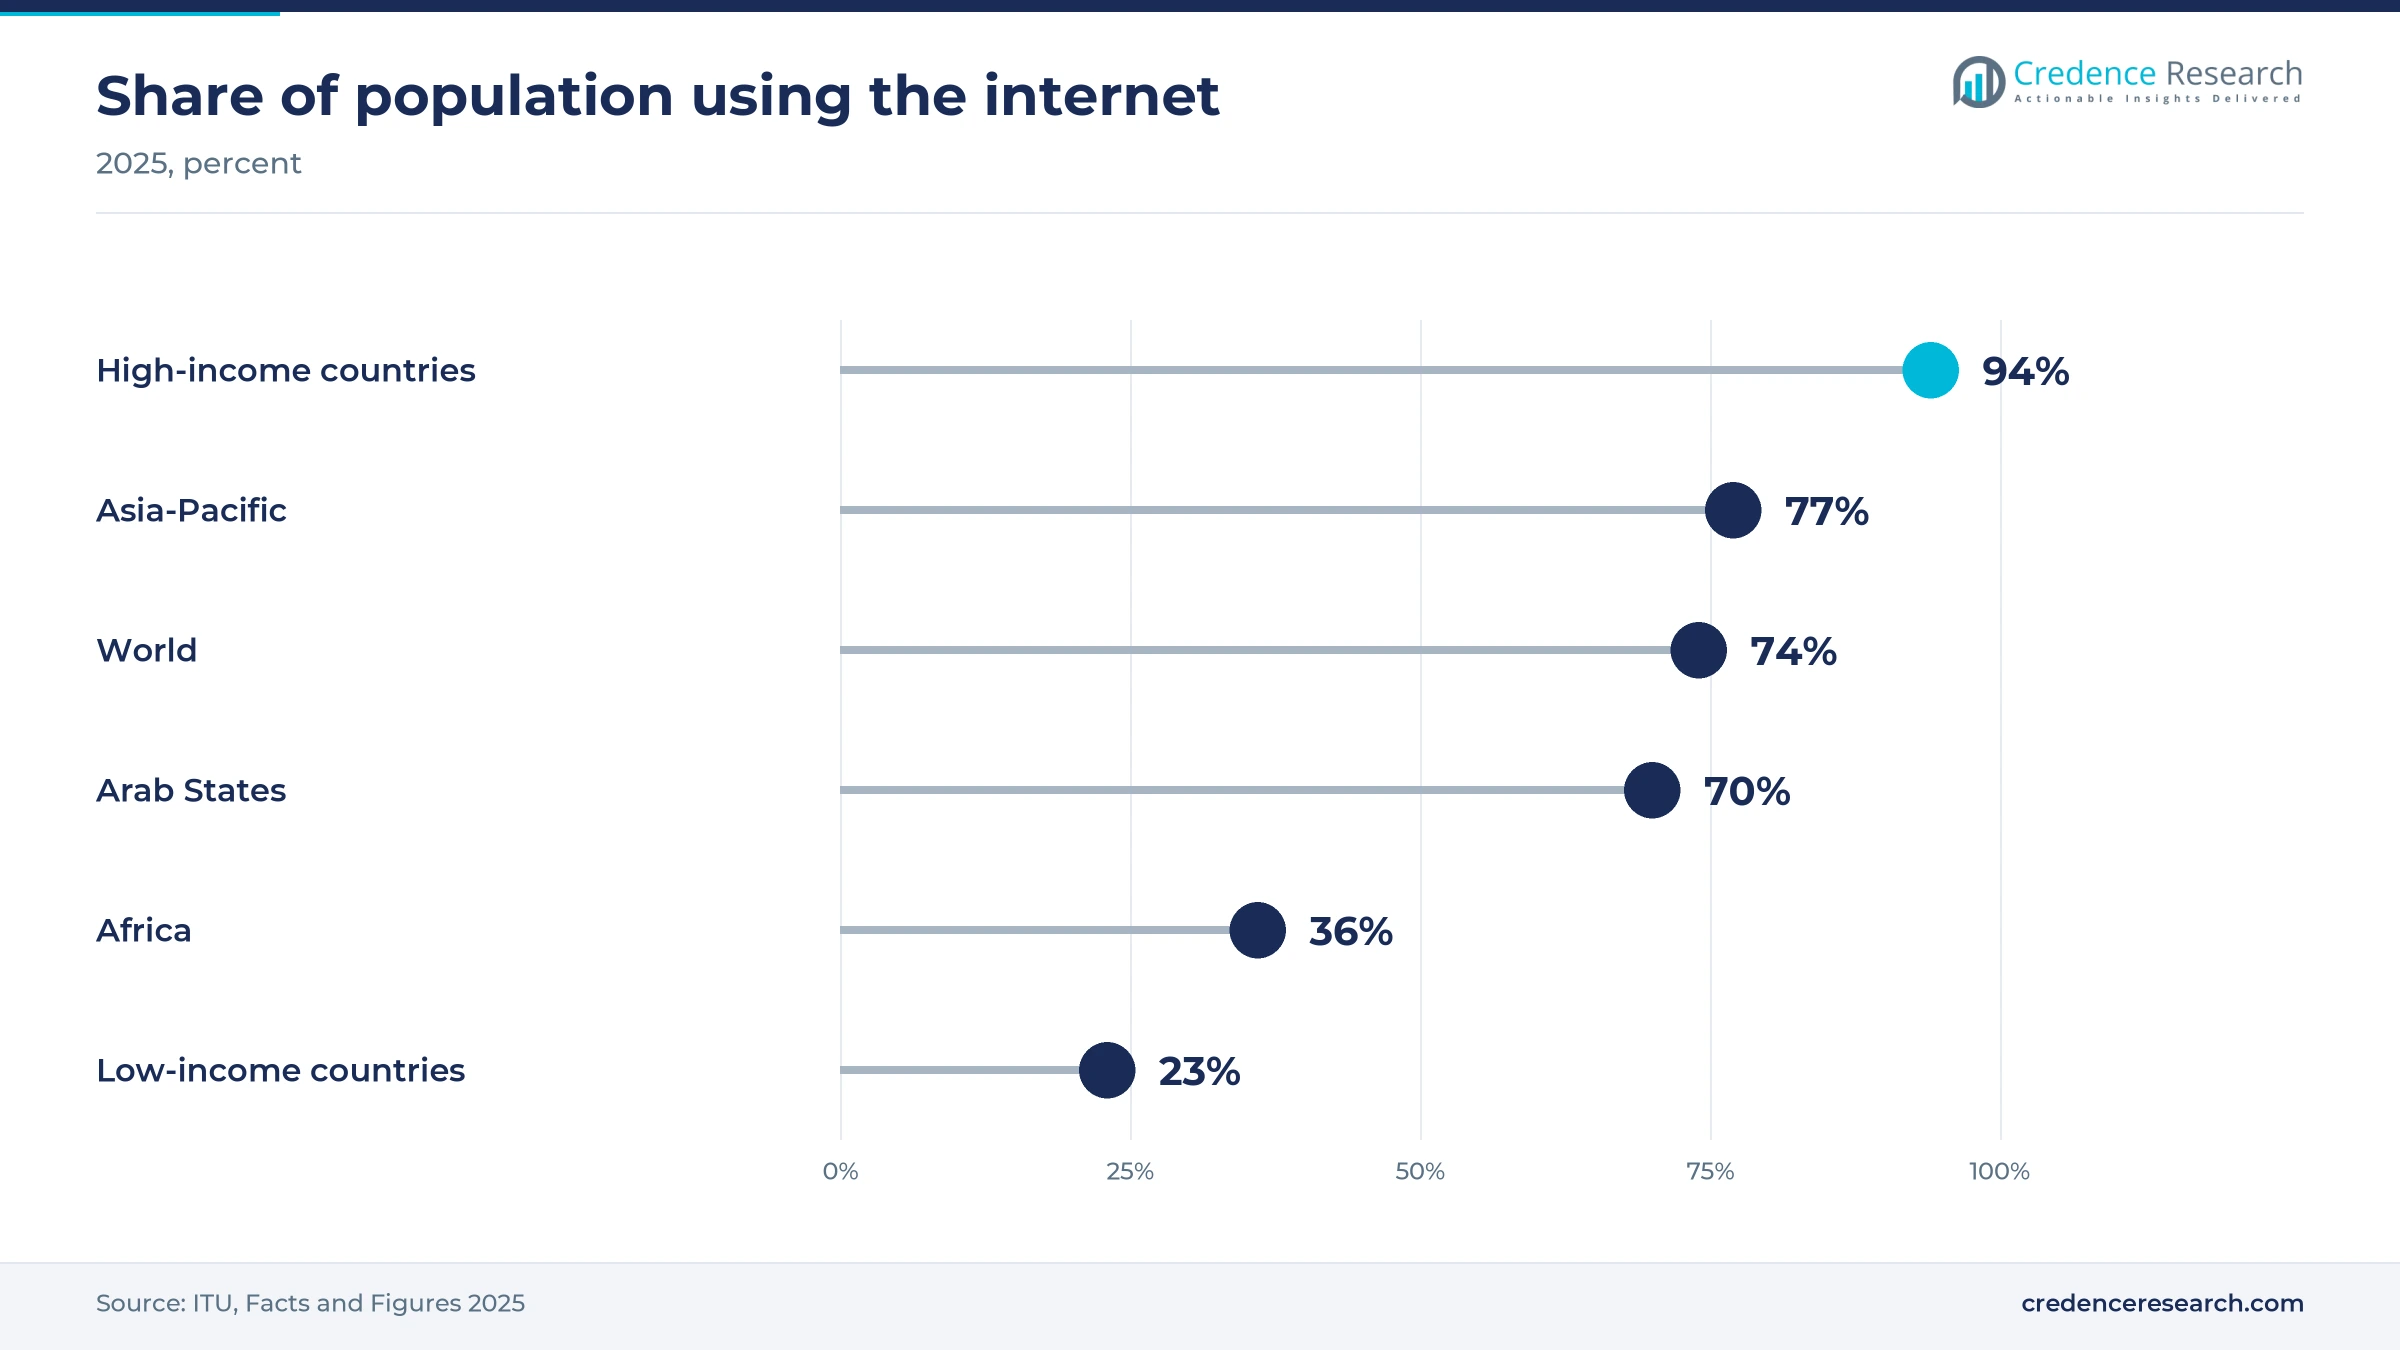
Asia Pacific held 25.0% of 2025 value and grows fastest at 19.1% a year, because a large base of first-time buyers is formalizing device policy. ITU estimates that 77% of the Asia-Pacific population used the internet in 2025, below Europe and the Americas, which leaves room for new business users. Ericsson expects 5G subscriptions in South East Asia and Oceania to rise from about 160 million in 2025 to about 670 million in 2031. India's data protection rules, noted above, add compliance demand among Indian firms, while price-sensitive SMEs favor low-cost per-device plans.
Latin America adopts through carriers and managed services
Latin America held 5.0% of 2025 value and grows at 18.4% a year. Credence Research expects demand to concentrate in Brazil and Mexico, where banks, retailers and logistics firms run large Android fleets and often buy management through carriers or managed service providers. Public data on device management spending in the region are scarce, so the regional split is a Credence Research estimate with a wide margin of error. Currency swings raise the local cost of subscriptions priced in U.S. dollars.
Gulf states drive Middle East and Africa demand
Middle East & Africa held 5.0% of 2025 value and grows at 18.6% a year from a small base. Ericsson expects 5G penetration in the Gulf Cooperation Council to approach or exceed 90% by 2031, which supports mobile-first government and banking services there. ITU estimates that only 36% of Africa's population used the internet in 2025, which limits demand outside the Gulf and South Africa. Credence Research therefore treats the Gulf states as the main source of regional growth.
Take-privates, rebrands and AI launches mark 2025–2026
| Development | Status and market relevance |
|---|---|
| In October 2025, Kandji renamed itself Iru and launched a platform that combines workforce identity, device management, endpoint detection and compliance automation. | Launch. The platform was available to new customers at launch, and existing Kandji customers move to the Iru experience. |
| In January 2026, Francisco Partners completed its take-private acquisition of Jamf for USD 13.05 per share in cash, an enterprise value of about USD 2.2 billion. | Completed. Jamf left Nasdaq and now operates as a privately held Apple device management specialist. |
| In June 2026, SOTI released version 2026.1 of its SOTI ONE platform with faster shared-device sign-in, Windows patch management and Defender for Endpoint integration. | Launch. The release targets frontline fleets in retail, logistics and healthcare that share devices across shifts. |
| In June 2026, BlackBerry announced post-quantum cryptography, macOS support and multi-tenant controls for the on-premises version of BlackBerry UEM. | Announcement. The features were expected in summer 2026, with some console upgrades scheduled for general availability later in 2026. |
| In October 2026, Omnissa introduced three IT agents, a hosted MCP server and an Omnissa Cloud PC service for Workspace ONE and Horizon customers. | Launch. Omnissa did not state general availability dates, and Cloud PC initially runs on AWS. |
Declarative policy and passkeys change device control
- Declarative device management lets the device apply and report policy on its own, which cuts server polling and speeds compliance checks on Apple fleets.
- Containerization separates work apps and data from personal content on the same phone, which supports BYOD security policies that employees and auditors both accept.
- Mobile threat detection scans apps, networks and links on the device and feeds risk scores to access policies in near real time.
- Phishing-resistant authentication binds sign-in to a hardware-backed passkey on the device, which blocks credential replay from fake login pages.
Need a Custom Version of This Report?
Tailor the scope, geography, or segments to your exact requirements.
- Custom geography or segment scope
- Direct access to our analyst team
Suite owners set price floors as specialists hold niches
Competition splits between suite owners that bundle device control into wider licenses and independent platforms that win on breadth, certification or specialization. Microsoft reaches the largest installed base through its productivity suites, which sets the reference price that rivals quote against. Omnissa, Ivanti and IBM sell multi-platform consoles to large organizations, with Omnissa adding AI agents and Windows Server management. Jamf and Iru focus on Apple devices, where depth of support for new operating system features decides renewals. BlackBerry concentrates on government and regulated buyers that need on-premises control and certification, while SOTI and Samsung serve rugged and frontline fleets. Cisco ties device management to Meraki networks, Citrix pairs it with app delivery, and ManageEngine competes on price among mid-sized firms. Ownership changes at Omnissa and Jamf point to further consolidation through 2035.
Platform owners, specialists and service providers split the value
The supply side splits into platform owners, independent specialists and service providers. Microsoft and Samsung tie management to their own software and devices, which gives them distribution at near-zero marginal cost. Independent platforms such as Omnissa, Ivanti, IBM, BlackBerry and SOTI compete on multi-platform coverage and deployment choice, while Jamf and Iru specialize in Apple fleets. Government certification, integrations with endpoint security and identity tools, and migration cost act as the main entry barriers. Margins are likely highest in security add-ons and certified deployments, although vendors do not disclose them by product.
Companies profiled and their roles in this market
| Company | Type | Role in the market |
|---|---|---|
| Microsoft Corporation | Suite owner | Intune device and app management bundled with Microsoft business suites |
| Omnissa | Independent platform | Workspace ONE UEM for mobile, desktop and server management |
| Ivanti | Independent platform | Endpoint Manager Mobile and Neurons unified endpoint management |
| Jamf | Apple specialist | Jamf Pro and Jamf Now management and security for Apple devices |
| SOTI Inc. | Frontline specialist | SOTI ONE and MobiControl for rugged and shared frontline devices |
| IBM Corporation | Independent platform | MaaS360 cloud unified endpoint management with threat detection |
| BlackBerry Limited | Government specialist | BlackBerry UEM for on-premises and certified government deployments |
| Samsung Electronics Co., Ltd. | Device maker | Knox Suite plans for managing and securing Galaxy devices |
| Cisco Systems, Inc. | Network vendor | Meraki Systems Manager device management tied to Meraki networks |
| Citrix (Cloud Software Group) | Independent platform | Citrix Endpoint Management alongside virtual app and desktop delivery |
| ManageEngine (Zoho Corporation) | Value platform | Mobile Device Manager Plus and Endpoint Central for mid-sized firms |
| Iru | Apple-first platform | Identity, device management and endpoint security platform, formerly Kandji |
Value moves from enrollment to security and identity
Credence Research's view is that value in this market is moving from basic device enrollment, which suites now give away, to security, identity and frontline features that buyers still pay for separately. Suite bundling sets a low price floor for Windows-heavy firms, so independent vendors must win on Apple depth, rugged fleets, certification or deployment choice. Security budgets are the strongest support for growth, because buyers now justify spending on incident cost. Vendors that combine device risk, identity signals and audit trails in one record are best placed, while single-purpose configuration tools face the sharpest price pressure through 2035.
Device counts and list prices anchor the estimate
The report uses 2025 as the base year and 2026–2035 as the forecast period, and it replaces an earlier edition built on a 2022 base year. Market values come from the Credence Research model, built from estimated managed device and user counts, published list prices for per-user and per-device plans, and the share of spending that goes to services. Regional, segment and industry splits are Credence Research estimates built from public company, regulator and statistical data. Sources include company releases, regulator documents from CISA, ESMA, HHS and India's Ministry of Electronics and Information Technology, and statistics from ITU and the U.S. Bureau of Labor Statistics. No interviews or surveys were conducted for this edition of the report.
Security features carry growth as bundling caps prices
Through 2035, growth comes more from security and identity features than from new device enrollments, as suites absorb basic management. Per-user licensing spreads as workers carry more devices, while per-device plans hold in shared and rugged fleets. Asia Pacific gains share as 5G coverage widens and India's privacy rules take effect, while North America remains the largest region. AI agents will take over routine packaging and patching tasks, but regulated buyers will demand approval steps and audit logs. The main uncertainty is how far bundling lowers average prices, which could slow value growth even as managed device counts rise.
Bundling pace and security budgets set the 2035 range
The range depends mostly on how far suite bundling lowers prices for basic device control and on whether security budgets keep funding threat defense and identity features. Fast bundling with flat security budgets would shift value to a few suite owners and slow total growth. Sustained growth in mobile attacks and new privacy rules in Asia would lift spending on higher-priced security tiers. The base case assumes both forces continue at roughly current rates.
| Scenario | CAGR, 2026–2035 | Value, 2035 | What has to hold |
|---|---|---|---|
| Downside | 15.3% | USD 88.45 billion | Suite bundling spreads to Apple and Android fleets and security budgets stop rising |
| Base | 17.80% | USD 107.29 billion | Bundling lowers basic prices while threat defense and identity tiers keep gaining buyers |
| Upside | 19.8% | USD 124.84 billion | Mobile attacks keep rising and privacy rules in Asia and Europe force wider device coverage |
Frequently Asked Questions
How big is the enterprise mobility management market?
What is the difference between EMM and UEM?
Which solution segment leads the market?
Which region leads the enterprise mobility management market?
How do Microsoft's 2026 licensing changes affect the market?
What does device management software cost?
Which companies lead the market?
What could slow growth in this market?
Table of Content
Chapter 1 Market Segmentation
- 1.1 Segmentation Framework
- 1.1.1 Product and Service Classification
- 1.1.2 Application and End-Use Classification
- 1.1.3 Technology and Solution Classification
- 1.1.4 Customer and Distribution Channel Classification
- 1.1.5 Geographic Segmentation
- 1.1.6 Market Segment Definitions and Boundaries
- 1.2 By Solution
- 1.2.1 Mobile Device Management
- 1.2.2 Mobile Application Management
- 1.2.3 Mobile Content Management
- 1.2.4 Identity and Access Management
- 1.2.5 Mobile Threat Defense
- 1.3 By Deployment
- 1.3.1 Cloud-Based
- 1.3.2 On-Premises
- 1.4 By Enterprise Size
- 1.4.1 Large Enterprises
- 1.4.2 Small and Medium-Sized Enterprises
- 1.5 By Industry Vertical
- 1.5.1 BFSI
- 1.5.2 Healthcare
- 1.5.3 Government
- 1.5.4 Retail
- 1.5.5 IT and Telecom
- 1.5.6 Manufacturing and Others
Chapter 2 Introduction
- 2.1 Report Objectives and Scope
- 2.2 Product Definition and Industry Terminology
- 2.3 Market Inclusions and Exclusions
- 2.4 Research Process
- 2.4.1 Primary Research and Expert Interviews
- 2.4.2 Secondary Research and Source Review
- 2.4.3 Top-Down and Bottom-Up Estimation
- 2.4.4 Data Triangulation and Verification
- 2.5 Market Size Measurement Basis
- 2.5.1 2025: USD 20.85 billion → 2035: USD 107.29 billion
- 2.6 Historical and Forecast Reference Periods
- 2.6.1 Historical Period: 2018-2025
- 2.6.2 Base Year: 2025
- 2.6.3 Forecast Period: 2025-2035
- 2.7 Research Assumptions and Limitations
Chapter 3 Executive Summary
- 3.1 Market Snapshot and Key Findings
- 3.2 Base-Year Market Size, 2025
- 3.3 Forecast Market Size, 2035
- 3.4 Revenue and Volume Growth Outlook
- 3.5 Key Demand and Supply Indicators
- 3.6 Leading Market Segments
- 3.7 Fastest-Growing Market Opportunities
- 3.8 Regional Performance Highlights
- 3.9 Technology and Industry Transformation
- 3.10 Competitive Landscape Summary
- 3.11 Analyst View and Strategic Implications
Chapter 4 Global Enterprise Mobility Management Market Trends and Developments
- 4.1 Historical Industry Development, 2018-2025
- 4.2 Recent Market Trends and Developments
- 4.3 Demand and Customer Behavior Trends
- 4.4 Technology and Product Innovation
- 4.5 Artificial Intelligence, Automation and Digitalization
- 4.6 Local Manufacturing and Supply Chain Realignment
- 4.7 Industry Partnerships, Mergers and Acquisitions
- 4.8 Sustainability and Circular Economy Developments
- 4.9 Government and Private Sector Investment Trends
- 4.10 Emerging Business Models and Commercialization
- 4.11 Industry Developments and Announcements
Chapter 5 Global Enterprise Mobility Management Market Production, Supply and Demand Analysis
- 5.1 Demand Trend and Consumption Analysis, 2018-2025
- 5.2 Demand Forecast, 2025-2035
- 5.3 Production and Output Trend, 2018-2025
- 5.4 Production and Output Forecast, 2025-2035
- 5.5 Installed Capacity and Capacity Utilization
- 5.6 Company-Wise Production Plants and Statistics
- 5.6.1 Installed Production Capacity
- 5.6.2 Actual Production
- 5.6.3 Planned Capacity and Expansion Targets
- 5.7 Supply Chain Structure and Procurement Trends
- 5.8 Supply-Demand Gap and Bottlenecks
- 5.9 Import Dependence and Sourcing Structure
- 5.10 Contract Manufacturing and Outsourcing
- 5.11 Regional Supply and Demand Concentration
Chapter 6 Global Enterprise Mobility Management Market Pricing Analysis
- 6.1 Pricing Structure and Measurement
- 6.2 Historical Pricing Trends, 2018-2025
- 6.3 Pricing Outlook, 2025-2035
- 6.4 Average Selling Price and Unit Economics
- 6.5 Pricing by Product and Market Segment
- 6.6 Geographic Pricing Differences
- 6.7 Key Input, Energy, Labor and Logistics Costs
- 6.8 Contract Pricing and Purchasing Models
- 6.9 Pricing Sensitivity and Competitive Positioning
- 6.10 Price, Margin and Profitability Implications
Chapter 7 Global Enterprise Mobility Management Market Dynamics
- 7.1 Market Growth Drivers
- 7.1.1 Demand-Side Drivers
- 7.1.2 Technology and Innovation Drivers
- 7.1.3 Infrastructure and Investment Drivers
- 7.1.4 Regulatory and Policy Drivers
- 7.2 Market Restraints
- 7.2.1 Cost and Affordability Constraints
- 7.2.2 Technology and Adoption Barriers
- 7.2.3 Supply Chain and Operational Constraints
- 7.3 Market Challenges
- 7.3.1 Competitive Pressure and Margin Erosion
- 7.3.2 Skills, Infrastructure and Implementation Gaps
- 7.4 Emerging Market Opportunities
- 7.5 Market Dynamics Impact and Time-Horizon Assessment
Chapter 8 Global Enterprise Mobility Management Value Chain Analysis
- 8.1 Industry Value Chain Overview
- 8.2 Upstream Suppliers and Critical Inputs
- 8.3 Technology and Component Providers
- 8.4 Manufacturing or Service Delivery
- 8.5 Distribution, Channel Partners and Integrators
- 8.6 Downstream Applications and End Users
- 8.7 Value Addition and Profit Pools
- 8.8 Vertical Integration and Outsourcing
- 8.9 Supplier Concentration and Risk
- 8.10 Supply Chain Localization and Resilience
Chapter 9 Global Enterprise Mobility Management Market Regulations and Policies
- 9.1 Relevant Laws, Standards and Compliance Frameworks
- 9.2 Product, Service, Safety and Quality Requirements
- 9.3 Government Policies, Incentives and Subsidies
- 9.4 Imports, Exports and Trade Barriers
- 9.5 Public Procurement and Local Content Requirements
- 9.6 Environmental and Sustainability Compliance
- 9.7 Data Protection, AI and Cybersecurity Compliance
- 9.8 Upcoming Policy Changes and Market Implications
Chapter 10 Global Enterprise Mobility Management Market Hotspots and Opportunities
- 10.1 Market Opportunity Mapping and Growth Hotspots
- 10.2 High-Growth Applications and Customer Groups
- 10.3 Underserved Markets and White-Space Opportunities
- 10.4 Emerging Technology and Product Opportunities
- 10.5 New Capacity and Investment Hotspots
- 10.6 Market Entry and Expansion Opportunities
- 10.7 Distribution and Partnership Opportunities
- 10.8 Near-Term and Long-Term Commercial Potential
- 10.9 Opportunity Attractiveness and Execution Risks
Chapter 11 Global Enterprise Mobility Management Market Outlook, 2025-2035
- 11.1 Market Size and Analysis
- 11.1.1 Revenue (Market Measurement: 2025: USD 20.85 billion → 2035: USD 107.29 billion)
- 11.1.2 Market Volume and Quantity Sold
- 11.1.3 Historical Market Size, 2018-2025
- 11.1.4 Base-Year Market Size, 2025
- 11.2 Market Forecast, 2025-2035
- 11.2.1 Revenue Forecast to 2035
- 11.2.2 Volume Forecast to 2035
- 11.2.3 CAGR and Year-on-Year Growth
- 11.2.4 Incremental Revenue Opportunity
- 11.3 Forecast Assumptions and Scenario Analysis
- 11.3.1 Base-Case Forecast
- 11.3.2 Optimistic and Conservative Scenarios
- 11.3.3 Technology, Pricing and Policy Sensitivities
- 11.4 Market Attractiveness and Growth Outlook
Chapter 12 Global Enterprise Mobility Management Market Segmentation and Outlook
- 12.1 Segmentation Summary and Market Shares, 2025
- 12.2 Largest and Fastest-Growing Segments
- 12.3 By Solution - Market Size and Forecast, 2025-2035
- 12.3.1 Segment Definition and Scope
- 12.3.2 Historical Market Size, 2018-2025
- 12.3.3 Revenue Forecast, 2025-2035
- 12.3.4 Volume Forecast, 2025-2035
- 12.3.5 Base-Year Market Share, 2025
- 12.3.6 Segment CAGR and Growth Drivers
- 12.3.7 Subsegment Market Size and Forecast
- 12.3.7.1 Mobile Device Management
- 12.3.7.2 Mobile Application Management
- 12.3.7.3 Mobile Content Management
- 12.3.7.4 Identity and Access Management
- 12.3.7.5 Mobile Threat Defense
- 12.3.8 Subsegment Pricing and Adoption Trends
- 12.3.9 Leading Suppliers and Competition
- 12.3.10 Regional Demand and Opportunities
- 12.4 By Deployment - Market Size and Forecast, 2025-2035
- 12.4.1 Segment Definition and Scope
- 12.4.2 Historical Market Size, 2018-2025
- 12.4.3 Revenue Forecast, 2025-2035
- 12.4.4 Volume Forecast, 2025-2035
- 12.4.5 Base-Year Market Share, 2025
- 12.4.6 Segment CAGR and Growth Drivers
- 12.4.7 Subsegment Market Size and Forecast
- 12.4.7.1 Cloud-Based
- 12.4.7.2 On-Premises
- 12.4.8 Subsegment Pricing and Adoption Trends
- 12.4.9 Leading Suppliers and Competition
- 12.4.10 Regional Demand and Opportunities
- 12.5 By Enterprise Size - Market Size and Forecast, 2025-2035
- 12.5.1 Segment Definition and Scope
- 12.5.2 Historical Market Size, 2018-2025
- 12.5.3 Revenue Forecast, 2025-2035
- 12.5.4 Volume Forecast, 2025-2035
- 12.5.5 Base-Year Market Share, 2025
- 12.5.6 Segment CAGR and Growth Drivers
- 12.5.7 Subsegment Market Size and Forecast
- 12.5.7.1 Large Enterprises
- 12.5.7.2 Small and Medium-Sized Enterprises
- 12.5.8 Subsegment Pricing and Adoption Trends
- 12.5.9 Leading Suppliers and Competition
- 12.5.10 Regional Demand and Opportunities
- 12.6 By Industry Vertical - Market Size and Forecast, 2025-2035
- 12.6.1 Segment Definition and Scope
- 12.6.2 Historical Market Size, 2018-2025
- 12.6.3 Revenue Forecast, 2025-2035
- 12.6.4 Volume Forecast, 2025-2035
- 12.6.5 Base-Year Market Share, 2025
- 12.6.6 Segment CAGR and Growth Drivers
- 12.6.7 Subsegment Market Size and Forecast
- 12.6.7.1 BFSI
- 12.6.7.2 Healthcare
- 12.6.7.3 Government
- 12.6.7.4 Retail
- 12.6.7.5 IT and Telecom
- 12.6.7.6 Manufacturing and Others
- 12.6.8 Subsegment Pricing and Adoption Trends
- 12.6.9 Leading Suppliers and Competition
- 12.6.10 Regional Demand and Opportunities
- 12.7 Segment Growth Comparison
- 12.8 Segment Attractiveness and Priority Matrix
Chapter 13 Global Enterprise Mobility Management End-Use and Application Market Outlook
- 13.1 End-Use Industry and Customer Demand Structure
- 13.2 Leading Applications and Customer Groups
- 13.3 End-Use Market Size, Share and Forecast
- 13.4 Major End-Use Industry Deep Dives
- 13.4.1 Customer Requirements and Use Cases
- 13.4.2 Demand and Replacement Cycles
- 13.4.3 Technical and Regulatory Considerations
- 13.4.4 Purchasing and Procurement Models
- 13.4.5 Leading Vendors and Distribution Channels
- 13.4.6 Forecast and Commercial Opportunities
- 13.5 Emerging Applications and Cross-Segment Demand
- 13.6 End-Use Industry Investment Priorities
Chapter 14 Global Enterprise Mobility Management Geographic Market Outlook, 2025-2035
- 14.1 Regional Market Size and Share, 2025
- 14.2 Regional Market Forecast, 2025-2035
- 14.3 Regional Pricing, Production and Demand Differences
- 14.4 North America
- 14.4.1 United States
- 14.4.2 Canada
- 14.4.3 Mexico
- 14.5 Europe
- 14.5.1 Germany
- 14.5.2 France
- 14.5.3 Italy
- 14.5.4 United Kingdom
- 14.5.5 Spain
- 14.5.6 Poland
- 14.5.7 Russia
- 14.5.8 Netherlands
- 14.5.9 Belgium
- 14.5.10 Sweden
- 14.5.11 Denmark
- 14.5.12 Norway
- 14.5.13 Rest of Europe
- 14.6 Asia Pacific
- 14.6.1 China
- 14.6.2 India
- 14.6.3 Japan
- 14.6.4 South Korea
- 14.6.5 Thailand
- 14.6.6 Indonesia
- 14.6.7 Vietnam
- 14.6.8 Malaysia
- 14.6.9 Australia
- 14.6.10 Rest of Asia Pacific
- 14.7 Latin America
- 14.7.1 Brazil
- 14.7.2 Argentina
- 14.7.3 Colombia
- 14.7.4 Chile
- 14.7.5 Rest of Latin America
- 14.8 Middle East
- 14.8.1 Saudi Arabia
- 14.8.2 United Arab Emirates
- 14.8.3 Turkey
- 14.8.4 Israel
- 14.8.5 Iran
- 14.8.6 Rest of the Middle East
- 14.9 Africa
- 14.9.1 South Africa
- 14.9.2 Egypt
- 14.9.3 Nigeria
- 14.9.4 Morocco
- 14.9.5 Rest of Africa
- 14.10 Regional Investment, Policy and Supply Chain Differences
- 14.11 Regional Competitive Landscape
- 14.12 Geographic Growth Hotspots
Chapter 15 Global Enterprise Mobility Management Technology, Innovation and Sustainability Outlook
- 15.1 Technology Landscape and Maturity
- 15.2 Product, Process and Service Innovation
- 15.3 AI, Automation and Digital Tools in the Industry
- 15.4 Technology Adoption and Performance Benchmarking
- 15.5 Innovation Pipeline and R&D Investment
- 15.6 Patent and Intellectual Property Trends
- 15.7 Energy Efficiency and Resource Management
- 15.8 Sustainability, Recycling and Circularity
- 15.9 Technology Roadmap, 2025-2035
- 15.10 Risks of Obsolescence and Technology Substitution
Chapter 16 Global Enterprise Mobility Management Market Key Strategic Imperatives
- 16.1 Growth and Market Entry Priorities
- 16.2 High-Return Products and Segments
- 16.3 Pricing, Profitability and Cost Optimization
- 16.4 Technology Investment and Product Differentiation
- 16.5 Supply Chain Localization and Resilience
- 16.6 Distribution and Customer Acquisition
- 16.7 Partnership, Acquisition and Capacity Strategy
- 16.8 Regional Expansion Priorities
- 16.9 Short-, Medium- and Long-Term Actions
Chapter 17 Competition Outlook
- 17.1 Industry Competition Characteristics
- 17.2 Market Structure and Concentration
- 17.3 Market Share and Competitive Positioning, 2025
- 17.4 Company-Wise Revenue and Product Benchmarking
- 17.5 Production and Service Capacity Benchmarking
- 17.6 Technology, Pricing and Differentiation
- 17.7 Regional Footprint and Distribution Strength
- 17.8 Mergers, Acquisitions and Strategic Alliances
- 17.9 New Entrants and Competitive Threats
- 17.10 Porter's Five Forces and Industry Attractiveness
- 17.11 Competitive Outlook, 2025-2035
Chapter 18 Company Profiles
- 18.1 Company Coverage and Selection Criteria
- 18.2 Microsoft Corporation
- 18.2.1 Business Description
- 18.2.2 Company Ownership and Geographic Presence
- 18.2.3 Product and Service Portfolio
- 18.2.4 Manufacturing and Operating Footprint
- 18.2.5 Production Capacity and Expansion Plans
- 18.2.6 Financial Performance and Investment
- 18.2.7 Market Share and Competitive Position
- 18.2.8 Technology and Innovation Capabilities
- 18.2.9 Strategic Alliances or Partnerships
- 18.2.10 Recent Developments
- 18.2.11 Growth Strategy and Outlook
- 18.3 Omnissa
- 18.4 Ivanti
- 18.5 Jamf
- 18.6 SOTI Inc.
- 18.7 IBM Corporation
- 18.8 BlackBerry Limited
- 18.9 Samsung Electronics Co., Ltd.
- 18.10 Cisco Systems, Inc.
- 18.11 Citrix (Cloud Software Group)
- 18.12 ManageEngine (Zoho Corporation)
- 18.13 Iru
- 18.14 Other Relevant Market Participants
Note: Every listed company is profiled on the structure shown under the first company. The company list is preliminary and may change based on research findings, market developments, data availability and client requirements.
Chapter 19 Disclaimer
- 19.1 Research and Forecast Disclaimer
- 19.2 Data Source and Estimation Limitations
Note: The depth of individual sections depends on data availability for this market. Volume, capacity, trade and other unit-based metrics are included where applicable.

