Chapter No. 1 : Introduction 39
1.1. Report Description 39
1.1.1. Purpose of the Report 39
1.1.2. USP & Key Offerings 39
1.2. Key Benefits for Stakeholders 39
1.3. Target Audience 40
1.4. Report Scope 41
Chapter No. 2 : Executive Summary 43
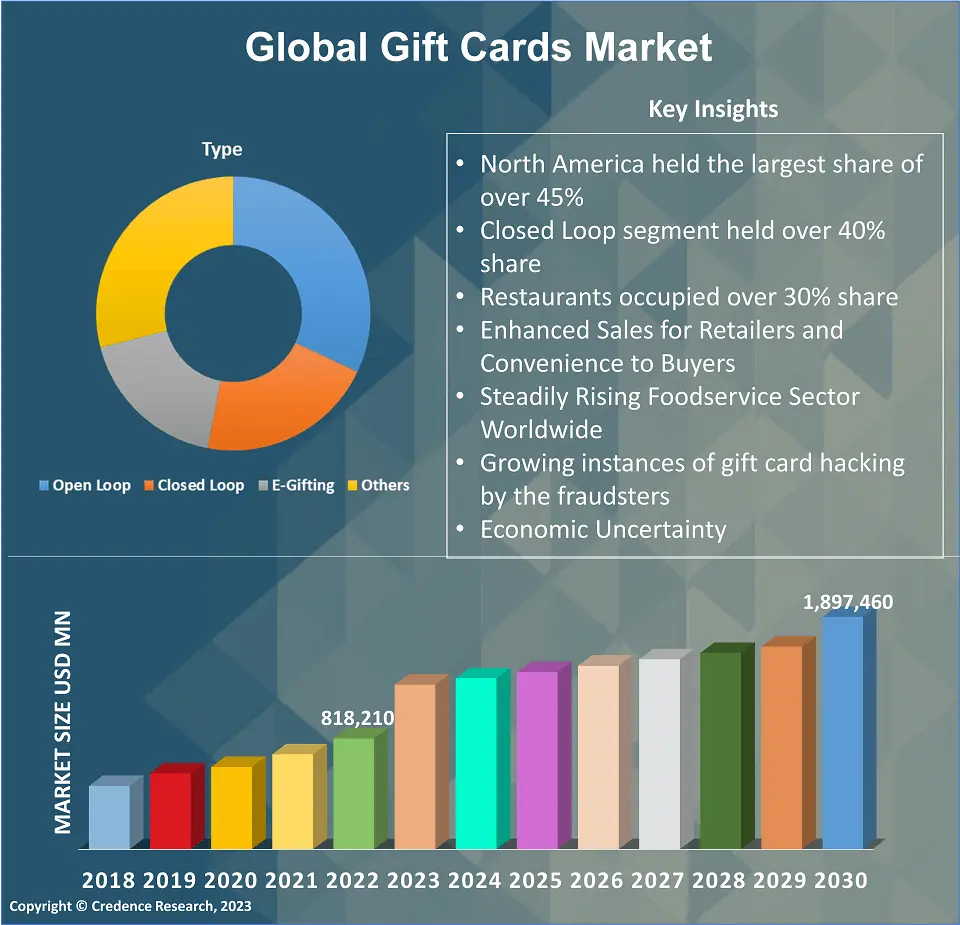
2.1. Gift Cards Market Snapshot 43
2.2. Global Gift Cards Market, 2017 – 2022 (USD Million) 44
Chapter No. 3 : Impact Analysis of COVID 19 & Russia-Ukraine War on Gift Cards Market 45
3.1. Impact Assessment of COVID-19 Pandemic, By Region 45
3.1.1. Supply chain disruptions 45
3.1.2. Shift in Consumer Behavior 45
3.1.3. E-Commerce Growth 45
3.1.4. Industry-Specific Impacts 45
3.1.5. Business Gifting 45
3.2. Russia-Ukraine War Impacts 46
3.2.1. Uncertainty and economic instability 46
3.2.2. Currency Fluctuations 46
3.2.3. Cross-Border Trade 46
3.2.4. Tourism and Travel 46
3.2.1. Market Sentiment 46
Chapter No. 4 : Gift Cards Market – Industry Analysis 47
4.1. Introduction 47
4.2. Market Drivers 48
4.2.1. Enhanced Sales for Retailers and Convenience to Buyers 48
4.2.2. Steadily Rising Foodservice Sector Worldwide 49
4.2.3. Consistently Growing Retail Industry Worldwide 49
4.3. Market Restraints 51
4.3.1. Growing instances of gift card hacking by the fraudsters 51
4.3.2. Economic Uncertainty 51
4.4. Market Opportunities 53
4.4.1. Rise of Digital Gift Cards 53
4.4.2. Use of Packaged Gift Cards 53
4.5. Buying Criteria 54
Chapter No. 5 : Analysis Competitive Landscape 55
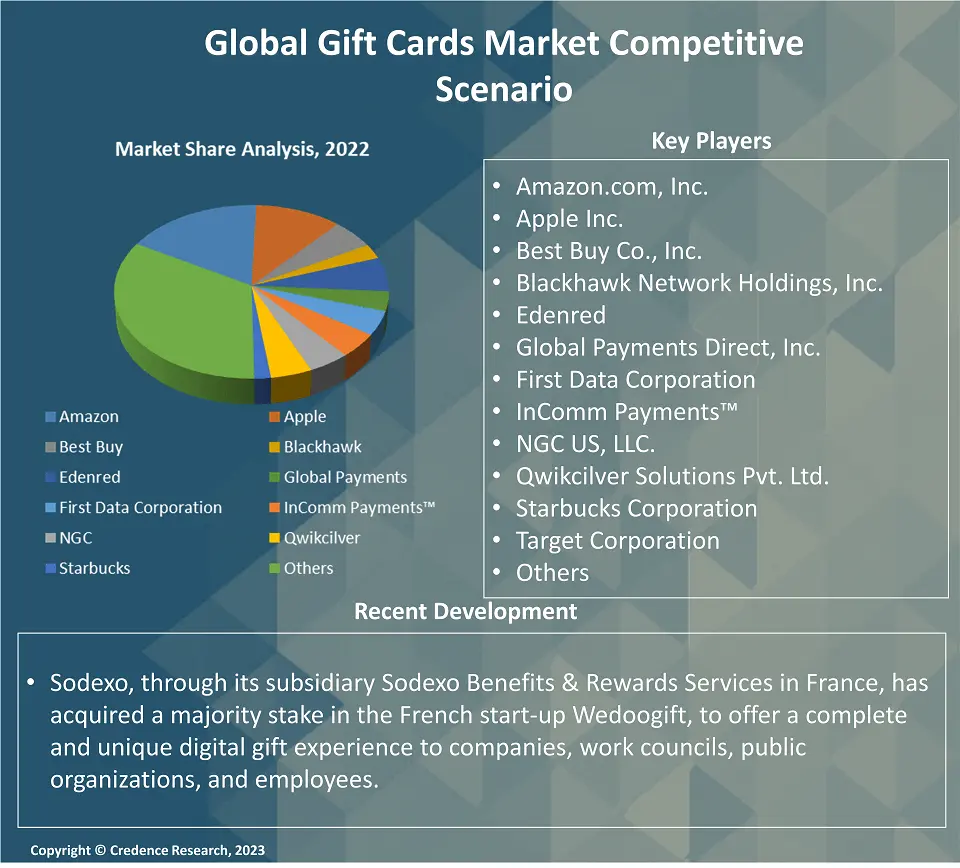
5.1. Company Market Share Analysis – 2022 55
5.1.1. Global Gift Cards Market: Company Market Share, by Revenue2022 55
5.1.2. Global Gift Cards Market: Top 6 Company Market Share, by Revenue2022 55
5.1.3. Global Gift Cards Market: Top 3 Company Market Share, by Revenue2022 56
5.1. Global Gift Cards Market Company Revenue Market Share, 2022 57
5.2. Strategic Developments 58
5.2.1. Acquisitions & Mergers, Partnerships and New Product Launch 58
5.3. Key Players Product Matrix 60
Chapter No. 6 : PESTEL & Adjacent Market Analysis 64
6.1. PESTEL 64
6.1.1. Political Factors 64
6.1.2. Economic Factors 64
6.1.3. Social Factors 64
6.1.4. Technological Factors 64
6.1.5. Environmental Factors 65
6.1.6. Legal Factors 65
6.2. Adjacent Market Analysis 65
Chapter No. 7 : Gift Cards Market – By Type Segment Analysis 68
7.1. Gift Cards Market Overview, by Type Segment 68
7.1.1. Gift Cards Market Revenue Share, By Type, 2022 & 2030 68
7.1.2. Gift Cards Market Attractiveness Analysis, By Type 70
7.1.3. Incremental Revenue Growth Opportunity, by Type, 2023 – 2030 70
7.1.4. Gift Cards Market Revenue, By Type, 2017, 2022, 2026 & 2030 71
7.2. Open Loop 72
7.2.1. Global Open Loop Gift Cards Market Revenue, By Region, 2017 – 2022 (USD Million) 73
7.2.2. Global Open Loop Gift Cards Market Revenue, By Region, 2017 – 2022 (USD Million) 73
7.3. Closed Loop 74
7.3.1. Global Closed Loop Gift Cards Market Revenue, By Region, 2017 – 2022 (USD Million) 75
7.3.2. Global Closed Loop Gift Cards Market Revenue, By Region, 2017 – 2022 (USD Million) 75
7.4. E-Gifting 76
7.4.1. Global E-Gifting Gift Cards Market Revenue, By Region, 2017 – 2022 (USD Million) 77
7.4.2. Global E-Gifting Gift Cards Market Revenue, By Region, 2017 – 2022 (USD Million) 77
7.5. Others 78
7.5.1. Global Others Gift Cards Market Revenue, By Region, 2017 – 2022 (USD Million) 79
7.5.2. Global Others Gift Cards Market Revenue, By Region, 2017 – 2022 (USD Million) 79
Chapter No. 8 : Gift Cards Market – By Merchant Type Segment Analysis 80
8.1. Gift Cards Market Overview, by Merchant Type Segment 80
8.1.1. Gift Cards Market Revenue Share, By Merchant Type, 2022 & 2030 80
8.1.2. Gift Cards Market Attractiveness Analysis, By Merchant Type 83
8.1.3. Incremental Revenue Growth Opportunity, by Merchant Type, 2023 – 2030 83
8.1.4. Gift Cards Market Revenue, By Merchant Type, 2017, 2022, 2026 & 2030 84
8.2. Restaurants 85
8.2.1. Global Restaurants Gift Cards Market Revenue, By Region, 2017 – 2022 (USD Million) 86
8.2.2. Global Restaurants Gift Cards Market Revenue, By Region, 2017 – 2022 (USD Million) 86
8.3. Discount Stores 87
8.3.1. Global Discount Stores Gift Cards Market Revenue, By Region, 2017 – 2022 (USD Million) 88
8.3.2. Global Discount Stores Gift Cards Market Revenue, By Region, 2017 – 2022 (USD Million) 88
8.4. Supermarkets/Hypermarkets 89
8.4.1. Global Supermarkets/Hypermarkets Gift Cards Market Revenue, By Region, 2017 – 2022 (USD Million) 90
8.4.2. Global Supermarkets/Hypermarkets Gift Cards Market Revenue, By Region, 2017 – 2022 (USD Million) 90
8.5. Coffee Shops 91
8.5.1. Global Coffee Shops Gift Cards Market Revenue, By Region, 2017 – 2022 (USD Billion) 92
8.5.2. Global Coffee Shops Gift Cards Market Revenue, By Region, 2017 – 2022 (USD Billion) 92
8.6. Others 93
8.6.1. Global Others Gift Cards Market Revenue, By Region, 2017 – 2022 (USD Billion) 94
8.6.2. Global Others Gift Cards Market Revenue, By Region, 2017 – 2022 (USD Billion) 94
Chapter No. 9 : Gift Cards Market – By End-user Segment Analysis 95
9.1. Gift Cards Market Overview, by End-user Segment 95
9.1.1. Gift Cards Market Revenue Share, By End-user, 2022 & 2030 95
9.1.2. Gift Cards Market Attractiveness Analysis, By End-user 96
9.1.3. Incremental Revenue Growth Opportunity, by End-user, 2023 – 2030 96
9.1.4. Gift Cards Market Revenue, By End-user, 2017, 2022, 2026 & 2030 97
9.2. Business 98
9.2.1. Global Business Gift Cards Market Revenue, By Region, 2017 – 2022 (USD Billion) 99
9.2.2. Global Business Gift Cards Market Revenue, By Region, 2017 – 2022 (USD Billion) 99
9.3. Individuals 100
9.3.1. Global Individuals Gift Cards Market Revenue, By Region, 2017 – 2022 (USD Billion) 101
9.3.2. Global Individuals Gift Cards Market Revenue, By Region, 2017 – 2022 (USD Billion) 101
Chapter No. 10 : Gift Cards Market – By Price Range Segment Analysis 102
10.1. Gift Cards Market Overview, by Price Range Segment 102
10.1.1. Gift Cards Market Revenue Share, By Price Range, 2022 & 2030 102
10.1.2. Gift Cards Market Attractiveness Analysis, By Price Range 103
10.1.3. Incremental Revenue Growth Opportunity, by Price Range, 2023 – 2030 103
10.1.4. Gift Cards Market Revenue, By Price Range, 2017, 2022, 2026 & 2030 104
10.2. High (Above 400 US$) 105
10.2.1. Global High (Above 400 US$) Gift Cards Market Revenue, By Region, 2017 – 2022 (USD Billion) 106
10.2.2. Global High (Above 400 US$) Gift Cards Market Revenue, By Region, 2017 – 2022 (USD Billion) 106
10.3. Medium (200-400 US$) 107
10.3.1. Global Medium (200-400 US$) Gift Cards Market Revenue, By Region, 2017 – 2022 (USD Billion) 108
10.3.2. Global Medium (200-400 US$) Gift Cards Market Revenue, By Region, 2017 – 2022 (USD Billion) 108
10.4. Low 109
10.4.1. Global Low Gift Cards Market Revenue, By Region, 2017 – 2022 (USD Billion) 110
10.4.2. Global Low Gift Cards Market Revenue, By Region, 2017 – 2022 (USD Billion) 110
Chapter No. 11 : Gift Cards Market – Regional Analysis 111
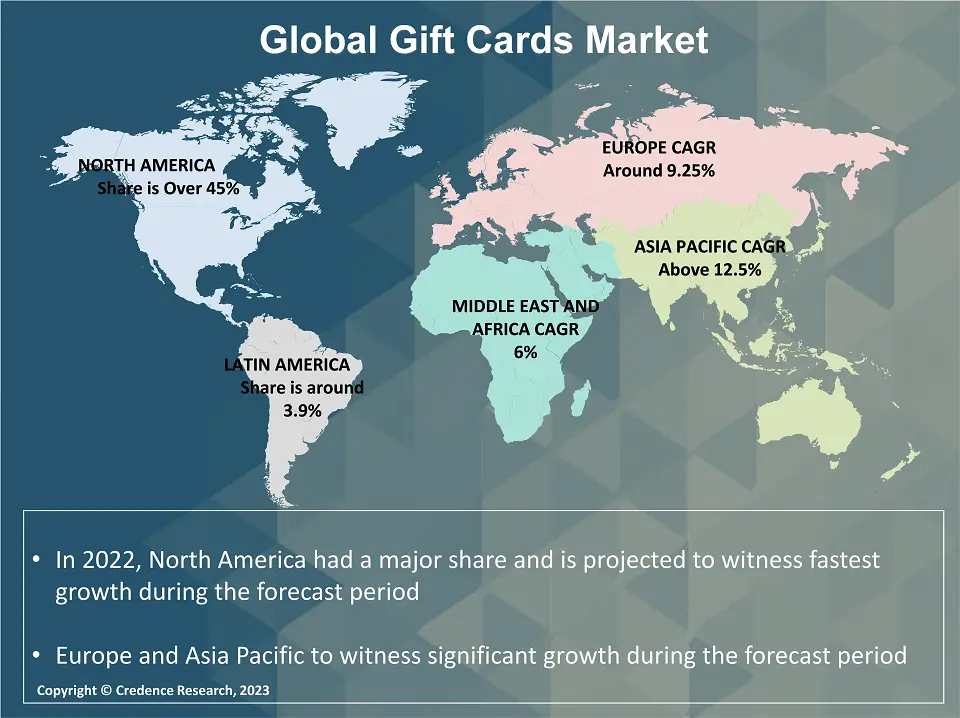
11.1. Gift Cards Market Overview, by Regional Segments 111
11.2. Region 111
11.2.1. Global Gift Cards Market Revenue Share, By Region, 2022 & 2030 111
11.2.2. Gift Cards Market Attractiveness Analysis, By Region 112
11.2.3. Incremental Revenue Growth Opportunity, by Region, 2023 – 2030 112
11.2.4. Gift Cards Market Revenue, By Region, 2017, 2022, 2026 & 2030 113
11.2.5. Global Gift Cards Market Revenue, By Region, 2017 – 2022 (USD Billion) 114
11.2.6. Global Gift Cards Market Revenue, By Region, 2023 – 2030 (USD Billion) 114
11.3. Type 115
11.3.1. Global Gift Cards Market Revenue, By Type, 2017 – 2022 (USD Billion) 115
11.3.2. Global Gift Cards Market Revenue, By Type, 2023 – 2030 (USD Billion) 115
11.4. Merchant Type 116
11.4.1. Global Gift Cards Market Revenue, By Merchant Type, 2017 – 2022 (USD Billion) 116
11.4.2. Global Gift Cards Market Revenue, By Merchant Type, 2023 – 2030 (USD Billion) 116
11.5. End-user 117
11.5.1. Global Gift Cards Market Revenue, By End-user, 2017 – 2022 (USD Billion) 117
11.5.2. Global Gift Cards Market Revenue, By End-user, 2023 – 2030 (USD Billion) 117
11.6. Price Range 118
11.6.1. Global Gift Cards Market Revenue, By Price Range, 2017 – 2022 (USD Billion) 118
11.6.2. Global Gift Cards Market Revenue, By Price Range, 2023 – 2030 (USD Billion) 118
Chapter No. 12 : Gift Cards Market – North America 119
12.1. North America 119
12.1.1. North America Gift Cards Market Revenue, By Country, 2017 – 2030 (USD Billion) 120
12.1.2. North America Gift Cards Market Revenue, By Type, 2017 – 2020 (USD Billion) 122
12.1.3. North America Gift Cards Market Revenue, By Merchant Type, 2017 – 2030 (USD Billion) 123
12.1.4. North America Gift Cards Market Revenue, By End-user, 2017 – 2030 (USD Billion) 124
12.1.5. North America Gift Cards Market Revenue, By Price Range, 2017 – 2030 (USD Billion) 125
12.2. U.S. 126
12.2.1. U.S. Gift Cards Market Revenue, By Type, 2017 – 2020 (USD Billion) 126
12.2.2. U.S. Gift Cards Market Revenue, By Merchant Type, 2017 – 2030 (USD Billion) 127
12.2.3. U.S. Gift Cards Market Revenue, By End-user, 2017 – 2030 (USD Billion) 128
12.2.4. U.S. Gift Cards Market Revenue, By Price Range, 2017 – 2030 (USD Billion) 129
12.3. Canada 130
12.3.1. Canada Gift Cards Market Revenue, By Type, 2017 – 2020 (USD Billion) 130
12.3.2. Canada Gift Cards Market Revenue, By Merchant Type, 2017 – 2030 (USD Billion) 131
12.3.3. Canada Gift Cards Market Revenue, By End-user, 2017 – 2030 (USD Billion) 132
12.3.4. Canada Gift Cards Market Revenue, By Price Range, 2017 – 2030 (USD Billion) 133
12.4. Mexico 134
12.4.1. Mexico Gift Cards Market Revenue, By Type, 2017 – 2020 (USD Billion) 134
12.4.2. Mexico Gift Cards Market Revenue, By Merchant Type, 2017 – 2030 (USD Billion) 135
12.4.3. Mexico Gift Cards Market Revenue, By End-user, 2017 – 2030 (USD Billion) 136
12.4.4. Mexico Gift Cards Market Revenue, By Price Range, 2017 – 2030 (USD Billion) 137
Chapter No. 13 : Gift Cards Market – Europe 138
13.1. Europe 138
Key Highlights 138
13.1.1. Europe Gift Cards Market Revenue, By Country, 2017 – 2022 (USD Billion) 140
13.1.2. Europe Gift Cards Market Revenue, By Type, 2017 – 2020 (USD Billion) 141
13.1.3. Europe Gift Cards Market Revenue, By Merchant Type, 2017 – 2030 (USD Billion) 142
13.1.4. Europe Gift Cards Market Revenue, By End-user, 2017 – 2030 (USD Billion) 143
13.1.5. Europe Gift Cards Market Revenue, By Price Range, 2017 – 2030 (USD Billion) 144
13.2. UK 145
13.2.1. UK Gift Cards Market Revenue, By Type, 2017 – 2020 (USD Billion) 145
13.2.2. UK Gift Cards Market Revenue, By Merchant Type, 2017 – 2030 (USD Billion) 146
13.2.3. UK Gift Cards Market Revenue, By End-user, 2017 – 2030 (USD Billion) 147
13.2.4. UK Gift Cards Market Revenue, By Price Range, 2017 – 2030 (USD Billion) 148
13.3. France 149
13.3.1. France Gift Cards Market Revenue, By Type, 2017 – 2020 (USD Billion) 149
13.3.2. France Gift Cards Market Revenue, By Merchant Type, 2017 – 2030 (USD Billion) 150
13.3.3. France Gift Cards Market Revenue, By End-user, 2017 – 2030 (USD Billion) 151
13.3.4. France Gift Cards Market Revenue, By Price Range, 2017 – 2030 (USD Billion) 152
13.4. Germany 153
13.4.1. Germany Gift Cards Market Revenue, By Type, 2017 – 2020 (USD Billion) 153
13.4.2. Germany Gift Cards Market Revenue, By Merchant Type, 2017 – 2030 (USD Billion) 154
13.4.3. Germany Gift Cards Market Revenue, By End-user, 2017 – 2030 (USD Billion) 155
13.4.4. Germany Gift Cards Market Revenue, By Price Range, 2017 – 2030 (USD Billion) 156
13.5. Italy 157
13.5.1. Germany Gift Cards Market Revenue, By Type, 2017 – 2020 (USD Billion) 157
13.5.2. Italy Gift Cards Market Revenue, By Merchant Type, 2017 – 2030 (USD Billion) 158
13.5.3. Italy Gift Cards Market Revenue, By End-user, 2017 – 2030 (USD Billion) 159
13.5.4. Italy Gift Cards Market Revenue, By Price Range, 2017 – 2030 (USD Billion) 160
13.6. Spain 161
13.6.1. Spain Gift Cards Market Revenue, By Type, 2017 – 2020 (USD Billion) 161
13.6.2. Spain Gift Cards Market Revenue, By Merchant Type, 2017 – 2030 (USD Billion) 162
13.6.3. Spain Gift Cards Market Revenue, By End-user, 2017 – 2030 (USD Billion) 163
13.6.4. Spain Gift Cards Market Revenue, By Price Range, 2017 – 2030 (USD Billion) 164
13.7. Russia 165
13.7.1. Russia Gift Cards Market Revenue, By Type, 2017 – 2020 (USD Billion) 165
13.7.2. Russia Gift Cards Market Revenue, By Merchant Type, 2017 – 2030 (USD Billion) 166
13.7.3. Russia Gift Cards Market Revenue, By End-user, 2017 – 2030 (USD Billion) 167
13.7.4. Russia Gift Cards Market Revenue, By Price Range, 2017 – 2030 (USD Billion) 168
13.8. Belgium 169
13.8.1. Belgium Gift Cards Market Revenue, By Type, 2017 – 2020 (USD Billion) 169
13.8.2. Belgium Gift Cards Market Revenue, By Merchant Type, 2017 – 2030 (USD Billion) 170
13.8.3. Belgium Gift Cards Market Revenue, By End-user, 2017 – 2030 (USD Billion) 171
13.8.4. Belgium Gift Cards Market Revenue, By Price Range, 2017 – 2030 (USD Billion) 172
13.9. Netherland 173
13.9.1. Netherland Gift Cards Market Revenue, By Type, 2017 – 2020 (USD Billion) 173
13.9.2. Netherland Gift Cards Market Revenue, By Merchant Type, 2017 – 2030 (USD Billion) 174
13.9.3. Netherland Gift Cards Market Revenue, By End-user, 2017 – 2030 (USD Billion) 175
13.9.4. Netherland Gift Cards Market Revenue, By Price Range, 2017 – 2030 (USD Billion) 176
13.10. Austria 177
13.10.1. Austria Gift Cards Market Revenue, By Type, 2017 – 2020 (USD Billion) 177
13.10.2. Austria Gift Cards Market Revenue, By Merchant Type, 2017 – 2030 (USD Billion) 178
13.10.3. Austria Gift Cards Market Revenue, By End-user, 2017 – 2030 (USD Billion) 179
13.10.4. Austria Gift Cards Market Revenue, By Price Range, 2017 – 2030 (USD Billion) 180
13.11. Sweden 181
13.11.1. Sweden Gift Cards Market Revenue, By Type, 2017 – 2020 (USD Billion) 181
13.11.2. Sweden Gift Cards Market Revenue, By Merchant Type, 2017 – 2030 (USD Billion) 182
13.11.3. Sweden Gift Cards Market Revenue, By End-user, 2017 – 2030 (USD Billion) 183
13.11.4. Sweden Gift Cards Market Revenue, By Price Range, 2017 – 2030 (USD Billion) 184
13.12. Poland 185
13.12.1. Poland Gift Cards Market Revenue, By Type, 2017 – 2020 (USD Billion) 185
13.12.2. Poland Gift Cards Market Revenue, By Merchant Type, 2017 – 2030 (USD Billion) 186
13.12.3. Poland Gift Cards Market Revenue, By End-user, 2017 – 2030 (USD Billion) 187
13.12.4. Poland Gift Cards Market Revenue, By Price Range, 2017 – 2030 (USD Billion) 188
13.13. Denmark 189
13.13.1. Denmark Gift Cards Market Revenue, By Type, 2017 – 2020 (USD Billion) 189
13.13.2. Denmark Gift Cards Market Revenue, By Merchant Type, 2017 – 2030 (USD Billion) 190
13.13.3. Denmark Gift Cards Market Revenue, By End-user, 2017 – 2030 (USD Billion) 191
13.13.4. Denmark Gift Cards Market Revenue, By Price Range, 2017 – 2030 (USD Billion) 192
13.14. Switzerland 193
13.14.1. Switzerland Gift Cards Market Revenue, By Type, 2017 – 2020 (USD Billion) 193
13.14.2. Switzerland Gift Cards Market Revenue, By Merchant Type, 2017 – 2030 (USD Billion) 194
13.14.3. Switzerland Gift Cards Market Revenue, By End-user, 2017 – 2030 (USD Billion) 195
13.14.4. Switzerland Gift Cards Market Revenue, By Price Range, 2017 – 2030 (USD Billion) 196
13.15. Rest of Europe 197
13.15.1. Rest of Europe Gift Cards Market Revenue, By Type, 2017 – 2020 (USD Billion) 197
13.15.2. Rest of Europe Gift Cards Market Revenue, By Merchant Type, 2017 – 2030 (USD Billion) 198
13.15.3. Rest of Europe Gift Cards Market Revenue, By End-user, 2017 – 2030 (USD Billion) 199
13.15.4. Rest of Europe Gift Cards Market Revenue, By Price Range, 2017 – 2030 (USD Billion) 200
Chapter No. 14 : Gift Cards Market – Asia Pacific 201
14.1. Asia Pacific 201
Key Highlights 201
14.1.1. Asia Pacific Gift Cards Market Revenue, By Country, 2017 – 2022 (USD Billion) 203
14.1.2. Asia Pacific Gift Cards Market Revenue, By Type, 2017 – 2020 (USD Billion) 204
14.1.3. Asia Pacific Gift Cards Market Revenue, By Merchant Type, 2017 – 2030 (USD Billion) 205
14.1.4. Asia Pacific Gift Cards Market Revenue, By End-user, 2017 – 2030 (USD Billion) 206
14.1.5. Asia Pacific Gift Cards Market Revenue, By Price Range, 2017 – 2030 (USD Billion) 207
14.2. China 208
14.2.1. China Gift Cards Market Revenue, By Type, 2017 – 2020 (USD Billion) 208
14.2.2. China Gift Cards Market Revenue, By Merchant Type, 2017 – 2030 (USD Billion) 209
14.2.3. China Gift Cards Market Revenue, By End-user, 2017 – 2030 (USD Billion) 210
14.2.4. China Gift Cards Market Revenue, By Price Range, 2017 – 2030 (USD Billion) 211
14.3. Japan 212
14.3.1. Japan Gift Cards Market Revenue, By Type, 2017 – 2020 (USD Billion) 212
14.3.2. Japan Gift Cards Market Revenue, By Merchant Type, 2017 – 2030 (USD Billion) 213
14.3.3. Japan Gift Cards Market Revenue, By End-user, 2017 – 2030 (USD Billion) 214
14.3.4. Japan Gift Cards Market Revenue, By Price Range, 2017 – 2030 (USD Billion) 215
14.4. South Korea 216
14.4.1. South Korea Gift Cards Market Revenue, By Type, 2017 – 2020 (USD Billion) 216
14.4.2. South Korea Gift Cards Market Revenue, By Merchant Type, 2017 – 2030 (USD Billion) 217
14.4.3. South Korea Gift Cards Market Revenue, By End-user, 2017 – 2030 (USD Billion) 218
14.4.4. South Korea Gift Cards Market Revenue, By Price Range, 2017 – 2030 (USD Billion) 219
14.5. India 220
14.5.1. India Gift Cards Market Revenue, By Type, 2017 – 2020 (USD Billion) 220
14.5.2. India Gift Cards Market Revenue, By Merchant Type, 2017 – 2030 (USD Billion) 221
14.5.3. India Gift Cards Market Revenue, By End-user, 2017 – 2030 (USD Billion) 222
14.5.4. India Gift Cards Market Revenue, By Price Range, 2017 – 2030 (USD Billion) 223
14.6. Australia 224
14.6.1. Australia Gift Cards Market Revenue, By Type, 2017 – 2020 (USD Billion) 224
14.6.2. Australia Gift Cards Market Revenue, By Merchant Type, 2017 – 2030 (USD Billion) 225
14.6.3. Australia Gift Cards Market Revenue, By End-user, 2017 – 2030 (USD Billion) 226
14.6.4. Australia Gift Cards Market Revenue, By Price Range, 2017 – 2030 (USD Billion) 227
14.7. Thailand 228
14.7.1. Thailand Gift Cards Market Revenue, By Type, 2017 – 2020 (USD Billion) 228
14.7.2. Thailand Gift Cards Market Revenue, By Merchant Type, 2017 – 2030 (USD Billion) 229
14.7.3. Thailand Gift Cards Market Revenue, By End-user, 2017 – 2030 (USD Billion) 230
14.7.4. Thailand Gift Cards Market Revenue, By Price Range, 2017 – 2030 (USD Billion) 231
14.8. Indonesia 232
14.8.1. Indonesia Gift Cards Market Revenue, By Type, 2017 – 2020 (USD Billion) 232
14.8.2. Indonesia Gift Cards Market Revenue, By Merchant Type, 2017 – 2030 (USD Billion) 233
14.8.3. Indonesia Gift Cards Market Revenue, By End-user, 2017 – 2030 (USD Billion) 234
14.8.4. Indonesia Gift Cards Market Revenue, By Price Range, 2017 – 2030 (USD Billion) 235
14.9. Vietnam 236
14.9.1. Vietnam Gift Cards Market Revenue, By Type, 2017 – 2020 (USD Billion) 236
14.9.2. Vietnam Gift Cards Market Revenue, By Merchant Type, 2017 – 2030 (USD Billion) 237
14.9.3. Vietnam Gift Cards Market Revenue, By End-user, 2017 – 2030 (USD Billion) 238
14.9.4. Vietnam Gift Cards Market Revenue, By Price Range, 2017 – 2030 (USD Billion) 239
14.10. Malaysia 240
14.10.1. Malaysia Gift Cards Market Revenue, By Type, 2017 – 2020 (USD Billion) 240
14.10.2. Malaysia Gift Cards Market Revenue, By Merchant Type, 2017 – 2030 (USD Billion) 241
14.10.3. Malaysia Gift Cards Market Revenue, By End-user, 2017 – 2030 (USD Billion) 242
14.10.4. Malaysia Gift Cards Market Revenue, By Price Range, 2017 – 2030 (USD Billion) 243
14.11. Philippines 244
14.11.1. Philippines Gift Cards Market Revenue, By Type, 2017 – 2020 (USD Billion) 244
14.11.2. Philippines Gift Cards Market Revenue, By Merchant Type, 2017 – 2030 (USD Billion) 245
14.11.3. Philippines Gift Cards Market Revenue, By End-user, 2017 – 2030 (USD Billion) 246
14.11.4. Philippines Gift Cards Market Revenue, By Price Range, 2017 – 2030 (USD Billion) 247
14.12. Taiwan 248
14.12.1. Taiwan Gift Cards Market Revenue, By Type, 2017 – 2020 (USD Billion) 248
14.12.2. Taiwan Gift Cards Market Revenue, By Merchant Type, 2017 – 2030 (USD Billion) 249
14.12.3. Taiwan Gift Cards Market Revenue, By End-user, 2017 – 2030 (USD Billion) 250
14.12.4. Taiwan Gift Cards Market Revenue, By Price Range, 2017 – 2030 (USD Billion) 251
14.13. Rest of Asia Pacific 252
14.13.1. Rest of Asia Pacific Gift Cards Market Revenue, By Type, 2017 – 2020 (USD Billion) 252
14.13.2. Rest of Asia Pacific Gift Cards Market Revenue, By Merchant Type, 2017 – 2030 (USD Billion) 253
14.13.3. Rest of Asia Pacific Gift Cards Market Revenue, By End-user, 2017 – 2030 (USD Billion) 254
14.13.4. Rest of Asia Pacific Gift Cards Market Revenue, By Price Range, 2017 – 2030 (USD Billion) 255
Chapter No. 15 : Gift Cards Market – Latin America 256
15.1. Latin America 256
Key Highlights 256
15.1.1. Latin America Gift Cards Market Revenue, By Country, 2017 – 2022 (USD Billion) 257
15.1.2. Latin America Gift Cards Market Revenue, By Type, 2017 – 2020 (USD Billion) 258
15.1.3. Latin America Gift Cards Market Revenue, By Merchant Type, 2017 – 2030 (USD Billion) 259
15.1.4. Latin America Gift Cards Market Revenue, By End-user, 2017 – 2030 (USD Billion) 260
15.1.5. Latin America Gift Cards Market Revenue, By Price Range, 2017 – 2030 (USD Billion) 261
15.2. Brazil 262
15.2.1. Brazil Gift Cards Market Revenue, By Type, 2017 – 2020 (USD Billion) 262
15.2.2. Brazil Gift Cards Market Revenue, By Merchant Type, 2017 – 2030 (USD Billion) 263
15.2.3. Brazil Gift Cards Market Revenue, By End-user, 2017 – 2030 (USD Billion) 264
15.2.4. Brazil Gift Cards Market Revenue, By Price Range, 2017 – 2030 (USD Billion) 265
15.3. Argentina 266
15.3.1. Argentina Gift Cards Market Revenue, By Type, 2017 – 2020 (USD Billion) 266
15.3.2. Argentina Gift Cards Market Revenue, By Merchant Type, 2017 – 2030 (USD Billion) 267
15.3.3. Argentina Gift Cards Market Revenue, By End-user, 2017 – 2030 (USD Billion) 268
15.3.4. Argentina Gift Cards Market Revenue, By Price Range, 2017 – 2030 (USD Billion) 269
15.4. Peru 270
15.4.1. Peru Gift Cards Market Revenue, By Type, 2017 – 2020 (USD Billion) 270
15.4.2. Peru Gift Cards Market Revenue, By Merchant Type, 2017 – 2030 (USD Billion) 271
15.4.3. Peru Gift Cards Market Revenue, By End-user, 2017 – 2030 (USD Billion) 272
15.4.4. Peru Gift Cards Market Revenue, By Price Range, 2017 – 2030 (USD Billion) 273
15.5. Chile 274
15.5.1. Chile Gift Cards Market Revenue, By Type, 2017 – 2020 (USD Billion) 274
15.5.2. Chile Gift Cards Market Revenue, By Merchant Type, 2017 – 2030 (USD Billion) 275
15.5.3. Chile Gift Cards Market Revenue, By End-user, 2017 – 2030 (USD Billion) 276
15.5.4. Chile Gift Cards Market Revenue, By Price Range, 2017 – 2030 (USD Billion) 277
15.6. Colombia 278
15.6.1. Colombia Gift Cards Market Revenue, By Type, 2017 – 2020 (USD Billion) 278
15.6.2. Colombia Gift Cards Market Revenue, By Merchant Type, 2017 – 2030 (USD Billion) 279
15.6.3. Colombia Gift Cards Market Revenue, By End-user, 2017 – 2030 (USD Billion) 280
15.6.4. Colombia Gift Cards Market Revenue, By Price Range, 2017 – 2030 (USD Billion) 281
15.7. Rest of Latin America 282
15.7.1. Rest of Latin America Gift Cards Market Revenue, By Type, 2017 – 2020 (USD Billion) 282
15.7.2. Rest of Latin America Gift Cards Market Revenue, By Merchant Type, 2017 – 2030 (USD Billion) 283
15.7.3. Rest of Latin America Gift Cards Market Revenue, By End-user, 2017 – 2030 (USD Billion) 284
15.7.4. Rest of Latin America Gift Cards Market Revenue, By Price Range, 2017 – 2030 (USD Billion) 285
Chapter No. 16 : Gift Cards Market – Middle East 286
16.1. The Middle-East 286
Key Highlights 286
16.1.1. Middle East Gift Cards Market Revenue, By Country, 2017 – 2022 (USD Billion) 287
16.1.2. Middle East Gift Cards Market Revenue, By Type, 2017 – 2020 (USD Billion) 288
16.1.3. Middle East Gift Cards Market Revenue, By Merchant Type, 2017 – 2030 (USD Billion) 289
16.1.4. Middle East Gift Cards Market Revenue, By End-user, 2017 – 2030 (USD Billion) 290
16.1.5. Middle East Gift Cards Market Revenue, By Price Range, 2017 – 2030 (USD Billion) 291
16.2. UAE 292
16.2.1. UAE Gift Cards Market Revenue, By Type, 2017 – 2020 (USD Billion) 292
16.2.2. UAE Gift Cards Market Revenue, By Merchant Type, 2017 – 2030 (USD Billion) 293
16.2.3. UAE Gift Cards Market Revenue, By End-user, 2017 – 2030 (USD Billion) 294
16.2.4. UAE Gift Cards Market Revenue, By Price Range, 2017 – 2030 (USD Billion) 295
16.3. KSA 296
16.3.1. KSA Gift Cards Market Revenue, By Type, 2017 – 2020 (USD Billion) 296
16.3.2. KSA Gift Cards Market Revenue, By Merchant Type, 2017 – 2030 (USD Billion) 297
16.3.3. KSA Gift Cards Market Revenue, By End-user, 2017 – 2030 (USD Billion) 298
16.3.4. KSA Gift Cards Market Revenue, By Price Range, 2017 – 2030 (USD Billion) 299
16.4. Israel 300
16.4.1. Israel Gift Cards Market Revenue, By Type, 2017 – 2020 (USD Billion) 300
16.4.2. Israel Gift Cards Market Revenue, By Merchant Type, 2017 – 2030 (USD Billion) 301
16.4.3. Israel Gift Cards Market Revenue, By End-user, 2017 – 2030 (USD Billion) 302
16.4.4. Israel Gift Cards Market Revenue, By Price Range, 2017 – 2030 (USD Billion) 303
16.5. Turkey 304
16.5.1. Turkey Gift Cards Market Revenue, By Type, 2017 – 2020 (USD Billion) 304
16.5.2. Turkey Gift Cards Market Revenue, By Merchant Type, 2017 – 2030 (USD Billion) 305
16.5.3. Turkey Gift Cards Market Revenue, By End-user, 2017 – 2030 (USD Billion) 306
16.5.4. Turkey Gift Cards Market Revenue, By Price Range, 2017 – 2030 (USD Billion) 307
16.6. Iran 308
16.6.1. Iran Gift Cards Market Revenue, By Type, 2017 – 2020 (USD Billion) 308
16.6.2. Iran Gift Cards Market Revenue, By Merchant Type, 2017 – 2030 (USD Billion) 309
16.6.3. Iran Gift Cards Market Revenue, By End-user, 2017 – 2030 (USD Billion) 310
16.6.4. Iran Gift Cards Market Revenue, By Price Range, 2017 – 2030 (USD Billion) 311
16.7. Rest of Middle East 312
16.7.1. Rest of Middle East Gift Cards Market Revenue, By Type, 2017 – 2020 (USD Billion) 312
16.7.2. Rest of Middle East Gift Cards Market Revenue, By Merchant Type, 2017 – 2030 (USD Billion) 313
16.7.3. Rest of Middle East Gift Cards Market Revenue, By End-user, 2017 – 2030 (USD Billion) 314
16.7.4. Rest of Middle East Gift Cards Market Revenue, By Price Range, 2017 – 2030 (USD Billion) 315
Chapter No. 17 : Gift Cards Market – Africa 316
17.1. Africa 316
Key Highlights 316
17.1.1. Africa Gift Cards Market Revenue, By Country, 2017 – 2022 (USD Billion) 317
17.1.2. Africa Gift Cards Market Revenue, By Type, 2017 – 2020 (USD Billion) 318
17.1.3. Africa Gift Cards Market Revenue, By Merchant Type, 2017 – 2030 (USD Billion) 319
17.1.4. Africa Gift Cards Market Revenue, By End-user, 2017 – 2030 (USD Billion) 320
17.1.5. Africa Gift Cards Market Revenue, By Price Range, 2017 – 2030 (USD Billion) 321
17.2. South Africa 322
17.2.1. South Africa Gift Cards Market Revenue, By Type, 2017 – 2020 (USD Billion) 322
17.2.2. South Africa Gift Cards Market Revenue, By Merchant Type, 2017 – 2030 (USD Billion) 323
17.2.3. South Africa Gift Cards Market Revenue, By End-user, 2017 – 2030 (USD Billion) 324
17.2.4. South Africa Gift Cards Market Revenue, By Price Range, 2017 – 2030 (USD Billion) 325
17.3. Egypt 326
17.3.1. Egypt Gift Cards Market Revenue, By Type, 2017 – 2020 (USD Billion) 326
17.3.2. Egypt Gift Cards Market Revenue, By Merchant Type, 2017 – 2030 (USD Billion) 327
17.3.3. Egypt Gift Cards Market Revenue, By End-user, 2017 – 2030 (USD Billion) 328
17.3.4. Egypt Gift Cards Market Revenue, By Price Range, 2017 – 2030 (USD Billion) 329
17.4. Nigeria 330
17.4.1. Nigeria Gift Cards Market Revenue, By Type, 2017 – 2020 (USD Billion) 330
17.4.2. Nigeria Gift Cards Market Revenue, By Merchant Type, 2017 – 2030 (USD Billion) 331
17.4.3. Nigeria Gift Cards Market Revenue, By End-user, 2017 – 2030 (USD Billion) 332
17.4.4. Nigeria Gift Cards Market Revenue, By Price Range, 2017 – 2030 (USD Billion) 333
17.5. Algeria 334
17.5.1. Algeria Gift Cards Market Revenue, By Type, 2017 – 2020 (USD Billion) 334
17.5.2. Algeria Gift Cards Market Revenue, By Merchant Type, 2017 – 2030 (USD Billion) 335
17.5.3. Algeria Gift Cards Market Revenue, By End-user, 2017 – 2030 (USD Billion) 336
17.5.4. Algeria Gift Cards Market Revenue, By Price Range, 2017 – 2030 (USD Billion) 337
17.6. Morocco 338
17.6.1. Morocco Gift Cards Market Revenue, By Type, 2017 – 2020 (USD Billion) 338
17.6.2. Morocco Gift Cards Market Revenue, By Merchant Type, 2017 – 2030 (USD Billion) 339
17.6.3. Morocco Gift Cards Market Revenue, By End-user, 2017 – 2030 (USD Billion) 340
17.6.4. Morocco Gift Cards Market Revenue, By Price Range, 2017 – 2030 (USD Billion) 341
17.7. Rest of Africa 342
17.7.1. Rest of Africa Gift Cards Market Revenue, By Type, 2017 – 2020 (USD Billion) 342
17.7.2. Rest of Africa Gift Cards Market Revenue, By Merchant Type, 2017 – 2030 (USD Billion) 343
17.7.3. Rest of Africa Gift Cards Market Revenue, By End-user, 2017 – 2030 (USD Billion) 344
17.7.4. Rest of Africa Gift Cards Market Revenue, By Price Range, 2017 – 2030 (USD Billion) 345
Chapter No. 18 : Company Profiles 346
18.1. Amazon.com, Inc. 346
18.1.1. Company Overview 346
18.1.2. Product Portfolio 347
18.1.3. Financial Overview 347
18.2. Apple Inc. 348
18.2.1. Company Overview 348
18.2.2. Product Portfolio 349
18.2.3. Financial Overview 349
18.3. Best Buy Co., Inc. 350
18.3.1. Company Overview 350
18.3.2. Product Portfolio 351
18.3.3. Financial Overview 352
18.4. Blackhawk Network Holdings, Inc. 353
18.4.1. Company Overview 353
18.4.2. Product Portfolio 354
18.4.3. Financial Overview 354
18.5. Edenred 355
18.5.1. Company Overview 355
18.5.2. Product Portfolio 356
18.5.3. Financial Overview 356
18.6. Global Payments Direct, Inc. 357
18.6.1. Company Overview 357
18.6.2. Product Portfolio 358
18.6.3. Financial Overview 358
18.7. First Data Corporation 359
18.7.1. Company Overview 359
18.7.2. Product Portfolio 360
18.7.3. Financial Overview 360
18.8. InComm Payments™ 361
18.8.1. Company Overview 361
18.8.2. Product Portfolio 362
18.8.3. Financial Overview 363
18.9. NGC US, LLC. 364
18.9.1. Company Overview 364
18.9.2. Product Portfolio 365
18.9.3. Financial Overview 365
18.10. Qwikcilver Solutions Pvt. Ltd. 366
18.10.1. Company Overview 366
18.10.2. Product Portfolio 367
18.10.3. Financial Overview 367
18.11. Starbucks Corporation 368
18.11.1. Company Overview 368
18.11.2. Product Portfolio 369
18.11.3. Financial Overview 369
18.12. Target Corporation 370
18.12.1. Company Overview 370
18.12.2. Product Portfolio 371
18.12.3. Financial Overview 371
Chapter No. 19 : Research Methodology 372
19.1. Research Methodology 372
19.2. Phase I – Secondary Research 373
19.3. Phase II – Data Modeling 373
19.3.1. Company Share Analysis Model 374
19.3.2. Revenue Based Modeling 374
19.4. Phase III – Primary Research 375
19.5. Research Limitations 376
19.5.1. Assumptions 376
List of Figures
FIG NO. 1. Global Gift Cards Market Revenue, 2017 – 2022 (USD Billion) 44
FIG NO. 2. Company Share Analysis, 2022 55
FIG NO. 3. Company Share Analysis, 2022 55
FIG NO. 4. Company Share Analysis, 2022 56
FIG NO. 5. Gift Cards Market – Company Revenue Market Share, 2022 57
FIG NO. 6. Gift Cards Market Revenue Share, By Type, 2022 & 2030 68
FIG NO. 7. Market Attractiveness Analysis, By Type 70
FIG NO. 8. Incremental Revenue Growth Opportunity by Type 70
FIG NO. 9. Gift Cards Market Revenue, By Type, 2017, 2022, 2026 & 2030 71
FIG NO. 10. Global Gift Cards Market for Open Loop, Revenue (USD Billion) 2017 – 2030 72
FIG NO. 11. Global Gift Cards Market for Closed Loop, Revenue (USD Billion) 2017 – 2030 74
FIG NO. 12. Global Gift Cards Market for E-Gifting, Revenue (USD Billion) 2017 – 2030 76
FIG NO. 13. Global Gift Cards Market for Others, Revenue (USD Billion) 2017 – 2030 78
FIG NO. 14. Gift Cards Market Revenue Share, By Merchant Type, 2022 & 2030 80
FIG NO. 15. Market Attractiveness Analysis, By Merchant Type 83
FIG NO. 16. Incremental Revenue Growth Opportunity by Merchant Type 83
FIG NO. 17. Gift Cards Market Revenue, By Merchant Type, 2017, 2022, 2026 & 2030 84
FIG NO. 18. Global Gift Cards Market for Restaurants, Revenue (USD Billion) 2017 – 2030 85
FIG NO. 19. Global Gift Cards Market for Discount Stores, Revenue (USD Billion) 2017 – 2030 87
FIG NO. 20. Global Gift Cards Market for Supermarkets/Hypermarkets, Revenue (USD Billion) 2017 – 2030 89
FIG NO. 21. Global Gift Cards Market for Coffee Shops, Revenue (USD Billion) 2017 – 2030 91
FIG NO. 22. Global Gift Cards Market for Others, Revenue (USD Billion) 2017 – 2030 93
FIG NO. 23. Gift Cards Market Revenue Share, By End-user, 2022 & 2030 95
FIG NO. 24. Market Attractiveness Analysis, By End-user 96
FIG NO. 25. Incremental Revenue Growth Opportunity by End-user 96
FIG NO. 26. Gift Cards Market Revenue, By End-user, 2017, 2022, 2026 & 2030 97
FIG NO. 27. Global Gift Cards Market for Business, Revenue (USD Billion) 2017 – 2030 98
FIG NO. 28. Global Gift Cards Market for Individuals, Revenue (USD Billion) 2017 – 2030 100
FIG NO. 29. Gift Cards Market Revenue Share, By Price Range, 2022 & 2030 102
FIG NO. 30. Market Attractiveness Analysis, By Price Range 103
FIG NO. 31. Incremental Revenue Growth Opportunity by Price Range 103
FIG NO. 32. Gift Cards Market Revenue, By Price Range, 2017, 2022, 2026 & 2030 104
FIG NO. 33. Global Gift Cards Market for High (Above 400 US$), Revenue (USD Billion) 2017 – 2030 105
FIG NO. 34. Global Gift Cards Market for Medium (200-400 US$), Revenue (USD Billion) 2017 – 2030 107
FIG NO. 35. Global Gift Cards Market for Low, Revenue (USD Billion) 2017 – 2030 109
FIG NO. 36. Global Gift Cards Market Revenue Share, By Region, 2022 & 2030 111
FIG NO. 37. Market Attractiveness Analysis, By Region 112
FIG NO. 38. Incremental Revenue Growth Opportunity by Region 112
FIG NO. 39. Gift Cards Market Revenue, By Region, 2017, 2022, 2026 & 2030 113
FIG NO. 40. North America Gift Cards Market Revenue, 2017 – 2022 (USD Billion) 119
FIG NO. 41. Europe Gift Cards Market Revenue, 2017 – 2022 (USD Billion) 138
FIG NO. 42. Asia Pacific Gift Cards Market Revenue, 2017 – 2022 (USD Billion) 201
FIG NO. 43. Latin America Gift Cards Market Revenue, 2017 – 2022 (USD Billion) 256
FIG NO. 44. The Middle-East Gift Cards Market Revenue, 2017 – 2022 (USD Billion) 286
FIG NO. 45. Africa Gift Cards Market Revenue, 2017 – 2022 (USD Billion) 316
FIG NO. 46. Research Methodology – Detailed View 372
FIG NO. 47. Research Methodology 373
List of Tables
TABLE NO. 1. : Global Gift Cards Market: Snapshot 44
TABLE NO. 2. : Drivers for the Gift Cards Market: Impact Analysis 49
TABLE NO. 3. : Restraints for the Gift Cards Market: Impact Analysis 52
TABLE NO. 4. : Global Open Loop Gift Cards Market Revenue, By Region, 2017 – 2022 (USD Billion) 74
TABLE NO. 5. : Global Open Loop Gift Cards Market Revenue, By Region, 2023– 2030 (USD Billion) 74
TABLE NO. 6. : Global Closed Loop Gift Cards Market Revenue, By Region, 2017 – 2022 (USD Billion) 76
TABLE NO. 7. : Global Closed Loop Gift Cards Market Revenue, By Region, 2023– 2030 (USD Billion) 76
TABLE NO. 8. : Global E-Gifting Gift Cards Market Revenue, By Region, 2017 – 2022 (USD Billion) 78
TABLE NO. 9. : Global E-Gifting Gift Cards Market Revenue, By Region, 2023– 2030 (USD Billion) 78
TABLE NO. 10. : Global Others Gift Cards Market Revenue, By Region, 2017 – 2022 (USD Billion) 80
TABLE NO. 11. : Global Others Gift Cards Market Revenue, By Region, 2023– 2030 (USD Billion) 80
TABLE NO. 12. : Global Restaurants Gift Cards Market Revenue, By Region, 2017 – 2022 (USD Billion) 87
TABLE NO. 13. : Global Restaurants Gift Cards Market Revenue, By Region, 2023– 2030 (USD Billion) 87
TABLE NO. 14. : Global Discount Stores Gift Cards Market Revenue, By Region, 2017 – 2022 (USD Billion) 89
TABLE NO. 15. : Global Discount Stores Gift Cards Market Revenue, By Region, 2023– 2030 (USD Billion) 89
TABLE NO. 16. : Global Supermarkets/Hypermarkets Gift Cards Market Revenue, By Region, 2017 – 2022 (USD Billion) 91
TABLE NO. 17. : Global Supermarkets/Hypermarkets Gift Cards Market Revenue, By Region, 2023– 2030 (USD Billion) 91
TABLE NO. 18. : Global Coffee Shops Gift Cards Market Revenue, By Region, 2017 – 2022 (USD Billion) 93
TABLE NO. 19. : Global Coffee Shops Gift Cards Market Revenue, By Region, 2023– 2030 (USD Billion) 93
TABLE NO. 20. : Global Others Gift Cards Market Revenue, By Region, 2017 – 2022 (USD Billion) 95
TABLE NO. 21. : Global Others Gift Cards Market Revenue, By Region, 2023– 2030 (USD Billion) 95
TABLE NO. 22. : Global Business Gift Cards Market Revenue, By Region, 2017 – 2022 (USD Billion) 100
TABLE NO. 23. : Global Business Gift Cards Market Revenue, By Region, 2023– 2030 (USD Billion) 100
TABLE NO. 24. : Global Individuals Gift Cards Market Revenue, By Region, 2017 – 2022 (USD Billion) 102
TABLE NO. 25. : Global Individuals Gift Cards Market Revenue, By Region, 2023– 2030 (USD Billion) 102
TABLE NO. 26. : Global High (Above 400 US$) Gift Cards Market Revenue, By Region, 2017 – 2022 (USD Billion) 107
TABLE NO. 27. : Global High (Above 400 US$) Gift Cards Market Revenue, By Region, 2023– 2030 (USD Billion) 107
TABLE NO. 28. : Global Medium (200-400 US$) Gift Cards Market Revenue, By Region, 2017 – 2022 (USD Billion) 109
TABLE NO. 29. : Global Medium (200-400 US$) Gift Cards Market Revenue, By Region, 2023– 2030 (USD Billion) 109
TABLE NO. 30. : Global Low Gift Cards Market Revenue, By Region, 2017 – 2022 (USD Billion) 111
TABLE NO. 31. : Global Low Gift Cards Market Revenue, By Region, 2023– 2030 (USD Billion) 111
TABLE NO. 32. : Global Gift Cards Market Revenue, By Region, 2017 – 2022 (USD Billion) 115
TABLE NO. 33. : Global Gift Cards Market Revenue, By Region, 2023– 2030 (USD Billion) 115
TABLE NO. 34. : Global Gift Cards Market Revenue, By Type, 2017 – 2022 (USD Billion) 116
TABLE NO. 35. : Global Gift Cards Market Revenue, By Type, 2023– 2030 (USD Billion) 116
TABLE NO. 36. : Global Gift Cards Market Revenue, By Merchant Type, 2017 – 2022 (USD Billion) 117
TABLE NO. 37. : Global Gift Cards Market Revenue, By Merchant Type, 2023– 2030 (USD Billion) 117
TABLE NO. 38. : Global Gift Cards Market Revenue, By End-user, 2017 – 2022 (USD Billion) 118
TABLE NO. 39. : Global Gift Cards Market Revenue, By End-user, 2023– 2030 (USD Billion) 118
TABLE NO. 40. : Global Gift Cards Market Revenue, By Price Range, 2017 – 2022 (USD Billion) 119
TABLE NO. 41. : Global Gift Cards Market Revenue, By Price Range, 2023– 2030 (USD Billion) 119
TABLE NO. 42. : North America Gift Cards Market Revenue, By Country, 2017 – 2022 (USD Billion) 121
TABLE NO. 43. : North America Gift Cards Market Revenue, By Country, 2023– 2030 (USD Billion) 121
TABLE NO. 44. : North America Gift Cards Market Revenue, By Type, 2017 – 2022 (USD Billion) 123
TABLE NO. 45. : North America Gift Cards Market Revenue, By Type, 2023– 2030 (USD Billion) 123
TABLE NO. 46. : North America Gift Cards Market Revenue, By Merchant Type, 2017 – 2022 (USD Billion) 124
TABLE NO. 47. : North America Gift Cards Market Revenue, By Merchant Type, 2023– 2030 (USD Billion) 124
TABLE NO. 48. : North America Gift Cards Market Revenue, By End-user, 2017 – 2022 (USD Billion) 125
TABLE NO. 49. : North America Gift Cards Market Revenue, By End-user, 2023– 2030 (USD Billion) 125
TABLE NO. 50. : North America Gift Cards Market Revenue, By Price Range, 2017 – 2022 (USD Billion) 126
TABLE NO. 51. : North America Gift Cards Market Revenue, By Price Range, 2023– 2030 (USD Billion) 126
TABLE NO. 52. : U.S. Gift Cards Market Revenue, By Type, 2017 – 2022 (USD Billion) 127
TABLE NO. 53. : U.S. Gift Cards Market Revenue, By Type, 2023– 2030 (USD Billion) 127
TABLE NO. 54. : U.S. Gift Cards Market Revenue, By Merchant Type, 2017 – 2022 (USD Billion) 128
TABLE NO. 55. : U.S. Gift Cards Market Revenue, By Merchant Type, 2023– 2030 (USD Billion) 128
TABLE NO. 56. : U.S. Gift Cards Market Revenue, By End-user, 2017 – 2022 (USD Billion) 129
TABLE NO. 57. : U.S. Gift Cards Market Revenue, By End-user, 2023– 2030 (USD Billion) 129
TABLE NO. 58. : U.S. Gift Cards Market Revenue, By Price Range, 2017 – 2022 (USD Billion) 130
TABLE NO. 59. : U.S. Gift Cards Market Revenue, By Price Range, 2023– 2030 (USD Billion) 130
TABLE NO. 60. : Canada Gift Cards Market Revenue, By Type, 2017 – 2022 (USD Billion) 131
TABLE NO. 61. : Canada Gift Cards Market Revenue, By Type, 2023– 2030 (USD Billion) 131
TABLE NO. 62. : Canada Gift Cards Market Revenue, By Merchant Type, 2017 – 2022 (USD Billion) 132
TABLE NO. 63. : Canada Gift Cards Market Revenue, By Merchant Type, 2023– 2030 (USD Billion) 132
TABLE NO. 64. : Canada Gift Cards Market Revenue, By End-user, 2017 – 2022 (USD Billion) 133
TABLE NO. 65. : Canada Gift Cards Market Revenue, By End-user, 2023– 2030 (USD Billion) 133
TABLE NO. 66. : Canada Gift Cards Market Revenue, By Price Range, 2017 – 2022 (USD Billion) 134
TABLE NO. 67. : Canada Gift Cards Market Revenue, By Price Range, 2023– 2030 (USD Billion) 134
TABLE NO. 68. : Mexico Gift Cards Market Revenue, By Type, 2017 – 2022 (USD Billion) 135
TABLE NO. 69. : Mexico Gift Cards Market Revenue, By Type, 2023– 2030 (USD Billion) 135
TABLE NO. 70. : Mexico Gift Cards Market Revenue, By Merchant Type, 2017 – 2022 (USD Billion) 136
TABLE NO. 71. : Mexico Gift Cards Market Revenue, By Merchant Type, 2023– 2030 (USD Billion) 136
TABLE NO. 72. : Mexico Gift Cards Market Revenue, By End-user, 2017 – 2022 (USD Billion) 137
TABLE NO. 73. : Mexico Gift Cards Market Revenue, By End-user, 2023– 2030 (USD Billion) 137
TABLE NO. 74. : Mexico Gift Cards Market Revenue, By Price Range, 2017 – 2022 (USD Billion) 138
TABLE NO. 75. : Mexico Gift Cards Market Revenue, By Price Range, 2023– 2030 (USD Billion) 138
TABLE NO. 76. : Europe Gift Cards Market Revenue, By Country, 2017 – 2022 (USD Billion) 141
TABLE NO. 77. : Europe Gift Cards Market Revenue, By Country, 2023– 2030 (USD Billion) 141
TABLE NO. 78. : Europe Gift Cards Market Revenue, By Type, 2017 – 2022 (USD Billion) 142
TABLE NO. 79. : Europe Gift Cards Market Revenue, By Type, 2023– 2030 (USD Billion) 142
TABLE NO. 80. : Europe Gift Cards Market Revenue, By Merchant Type, 2017 – 2022 (USD Billion) 143
TABLE NO. 81. : Europe Gift Cards Market Revenue, By Merchant Type, 2023– 2030 (USD Billion) 143
TABLE NO. 82. : Europe Gift Cards Market Revenue, By End-user, 2017 – 2022 (USD Billion) 144
TABLE NO. 83. : Europe Gift Cards Market Revenue, By End-user, 2023– 2030 (USD Billion) 144
TABLE NO. 84. : Europe Gift Cards Market Revenue, By Price Range, 2017 – 2022 (USD Billion) 145
TABLE NO. 85. : Europe Gift Cards Market Revenue, By Price Range, 2023– 2030 (USD Billion) 145
TABLE NO. 86. : UK Gift Cards Market Revenue, By Type, 2017 – 2022 (USD Billion) 146
TABLE NO. 87. : UK Gift Cards Market Revenue, By Type, 2023– 2030 (USD Billion) 146
TABLE NO. 88. : UK Gift Cards Market Revenue, By Merchant Type, 2017 – 2022 (USD Billion) 147
TABLE NO. 89. : UK Gift Cards Market Revenue, By Merchant Type, 2023– 2030 (USD Billion) 147
TABLE NO. 90. : UK Gift Cards Market Revenue, By End-user, 2017 – 2022 (USD Billion) 148
TABLE NO. 91. : UK Gift Cards Market Revenue, By End-user, 2023– 2030 (USD Billion) 148
TABLE NO. 92. : UK Gift Cards Market Revenue, By Price Range, 2017 – 2022 (USD Billion) 149
TABLE NO. 93. : UK Gift Cards Market Revenue, By Price Range, 2023– 2030 (USD Billion) 149
TABLE NO. 94. : France Gift Cards Market Revenue, By Type, 2017 – 2022 (USD Billion) 150
TABLE NO. 95. : France Gift Cards Market Revenue, By Type, 2023– 2030 (USD Billion) 150
TABLE NO. 96. : France Gift Cards Market Revenue, By Merchant Type, 2017 – 2022 (USD Billion) 151
TABLE NO. 97. : France Gift Cards Market Revenue, By Merchant Type, 2023– 2030 (USD Billion) 151
TABLE NO. 98. : France Gift Cards Market Revenue, By End-user, 2017 – 2022 (USD Billion) 152
TABLE NO. 99. : France Gift Cards Market Revenue, By End-user, 2023– 2030 (USD Billion) 152
TABLE NO. 100. : France Gift Cards Market Revenue, By Price Range, 2017 – 2022 (USD Billion) 153
TABLE NO. 101. : France Gift Cards Market Revenue, By Price Range, 2023– 2030 (USD Billion) 153
TABLE NO. 102. : Germany Gift Cards Market Revenue, By Type, 2017 – 2022 (USD Billion) 154
TABLE NO. 103. : Germany Gift Cards Market Revenue, By Type, 2023– 2030 (USD Billion) 154
TABLE NO. 104. : Germany Gift Cards Market Revenue, By Merchant Type, 2017 – 2022 (USD Billion) 155
TABLE NO. 105. : Germany Gift Cards Market Revenue, By Merchant Type, 2023– 2030 (USD Billion) 155
TABLE NO. 106. : Germany Gift Cards Market Revenue, By End-user, 2017 – 2022 (USD Billion) 156
TABLE NO. 107. : Germany Gift Cards Market Revenue, By End-user, 2023– 2030 (USD Billion) 156
TABLE NO. 108. : Germany Gift Cards Market Revenue, By Price Range, 2017 – 2022 (USD Billion) 157
TABLE NO. 109. : Germany Gift Cards Market Revenue, By Price Range, 2023– 2030 (USD Billion) 157
TABLE NO. 110. : Italy Gift Cards Market Revenue, By Type, 2017 – 2022 (USD Billion) 158
TABLE NO. 111. : Italy Gift Cards Market Revenue, By Type, 2023– 2030 (USD Billion) 158
TABLE NO. 112. : Italy Gift Cards Market Revenue, By Merchant Type, 2017 – 2022 (USD Billion) 159
TABLE NO. 113. : Italy Gift Cards Market Revenue, By Merchant Type, 2023– 2030 (USD Billion) 159
TABLE NO. 114. : Italy Gift Cards Market Revenue, By End-user, 2017 – 2022 (USD Billion) 160
TABLE NO. 115. : Italy Gift Cards Market Revenue, By End-user, 2023– 2030 (USD Billion) 160
TABLE NO. 116. : Italy Gift Cards Market Revenue, By Price Range, 2017 – 2022 (USD Billion) 161
TABLE NO. 117. : Italy Gift Cards Market Revenue, By Price Range, 2023– 2030 (USD Billion) 161
TABLE NO. 118. : Spain Gift Cards Market Revenue, By Type, 2017 – 2022 (USD Billion) 162
TABLE NO. 119. : Spain Gift Cards Market Revenue, By Type, 2023– 2030 (USD Billion) 162
TABLE NO. 120. : Spain Gift Cards Market Revenue, By Merchant Type, 2017 – 2022 (USD Billion) 163
TABLE NO. 121. : Spain Gift Cards Market Revenue, By Merchant Type, 2023– 2030 (USD Billion) 163
TABLE NO. 122. : Spain Gift Cards Market Revenue, By End-user, 2017 – 2022 (USD Billion) 164
TABLE NO. 123. : Spain Gift Cards Market Revenue, By End-user, 2023– 2030 (USD Billion) 164
TABLE NO. 124. : Spain Gift Cards Market Revenue, By Price Range, 2017 – 2022 (USD Billion) 165
TABLE NO. 125. : Spain Gift Cards Market Revenue, By Price Range, 2023– 2030 (USD Billion) 165
TABLE NO. 126. : Russia Gift Cards Market Revenue, By Type, 2017 – 2022 (USD Billion) 166
TABLE NO. 127. : Russia Gift Cards Market Revenue, By Type, 2023– 2030 (USD Billion) 166
TABLE NO. 128. : Russia Gift Cards Market Revenue, By Merchant Type, 2017 – 2022 (USD Billion) 167
TABLE NO. 129. : Russia Gift Cards Market Revenue, By Merchant Type, 2023– 2030 (USD Billion) 167
TABLE NO. 130. : Russia Gift Cards Market Revenue, By End-user, 2017 – 2022 (USD Billion) 168
TABLE NO. 131. : Russia Gift Cards Market Revenue, By End-user, 2023– 2030 (USD Billion) 168
TABLE NO. 132. : Russia Gift Cards Market Revenue, By Price Range, 2017 – 2022 (USD Billion) 169
TABLE NO. 133. : Russia Gift Cards Market Revenue, By Price Range, 2023– 2030 (USD Billion) 169
TABLE NO. 134. : Belgium Gift Cards Market Revenue, By Type, 2017 – 2022 (USD Billion) 170
TABLE NO. 135. : Belgium Gift Cards Market Revenue, By Type, 2023– 2030 (USD Billion) 170
TABLE NO. 136. : Belgium Gift Cards Market Revenue, By Merchant Type, 2017 – 2022 (USD Billion) 171
TABLE NO. 137. : Belgium Gift Cards Market Revenue, By Merchant Type, 2023– 2030 (USD Billion) 171
TABLE NO. 138. : Belgium Gift Cards Market Revenue, By End-user, 2017 – 2022 (USD Billion) 172
TABLE NO. 139. : Belgium Gift Cards Market Revenue, By End-user, 2023– 2030 (USD Billion) 172
TABLE NO. 140. : Belgium Gift Cards Market Revenue, By Price Range, 2017 – 2022 (USD Billion) 173
TABLE NO. 141. : Belgium Gift Cards Market Revenue, By Price Range, 2023– 2030 (USD Billion) 173
TABLE NO. 142. : Netherland Gift Cards Market Revenue, By Type, 2017 – 2022 (USD Billion) 174
TABLE NO. 143. : Netherland Gift Cards Market Revenue, By Type, 2023– 2030 (USD Billion) 174
TABLE NO. 144. : Netherland Gift Cards Market Revenue, By Merchant Type, 2017 – 2022 (USD Billion) 175
TABLE NO. 145. : Netherland Gift Cards Market Revenue, By Merchant Type, 2023– 2030 (USD Billion) 175
TABLE NO. 146. : Netherland Gift Cards Market Revenue, By End-user, 2017 – 2022 (USD Billion) 176
TABLE NO. 147. : Netherland Gift Cards Market Revenue, By End-user, 2023– 2030 (USD Billion) 176
TABLE NO. 148. : Netherland Gift Cards Market Revenue, By Price Range, 2017 – 2022 (USD Billion) 177
TABLE NO. 149. : Netherland Gift Cards Market Revenue, By Price Range, 2023– 2030 (USD Billion) 177
TABLE NO. 150. : Austria Gift Cards Market Revenue, By Type, 2017 – 2022 (USD Billion) 178
TABLE NO. 151. : Austria Gift Cards Market Revenue, By Type, 2023– 2030 (USD Billion) 178
TABLE NO. 152. : Austria Gift Cards Market Revenue, By Merchant Type, 2017 – 2022 (USD Billion) 179
TABLE NO. 153. : Austria Gift Cards Market Revenue, By Merchant Type, 2023– 2030 (USD Billion) 179
TABLE NO. 154. : Austria Gift Cards Market Revenue, By End-user, 2017 – 2022 (USD Billion) 180
TABLE NO. 155. : Austria Gift Cards Market Revenue, By End-user, 2023– 2030 (USD Billion) 180
TABLE NO. 156. : Austria Gift Cards Market Revenue, By Price Range, 2017 – 2022 (USD Billion) 181
TABLE NO. 157. : Austria Gift Cards Market Revenue, By Price Range, 2023– 2030 (USD Billion) 181
TABLE NO. 158. : Sweden Gift Cards Market Revenue, By Type, 2017 – 2022 (USD Billion) 182
TABLE NO. 159. : Sweden Gift Cards Market Revenue, By Type, 2023– 2030 (USD Billion) 182
TABLE NO. 160. : Sweden Gift Cards Market Revenue, By Merchant Type, 2017 – 2022 (USD Billion) 183
TABLE NO. 161. : Sweden Gift Cards Market Revenue, By Merchant Type, 2023– 2030 (USD Billion) 183
TABLE NO. 162. : Sweden Gift Cards Market Revenue, By End-user, 2017 – 2022 (USD Billion) 184
TABLE NO. 163. : Sweden Gift Cards Market Revenue, By End-user, 2023– 2030 (USD Billion) 184
TABLE NO. 164. : Sweden Gift Cards Market Revenue, By Price Range, 2017 – 2022 (USD Billion) 185
TABLE NO. 165. : Sweden Gift Cards Market Revenue, By Price Range, 2023– 2030 (USD Billion) 185
TABLE NO. 166. : Poland Gift Cards Market Revenue, By Type, 2017 – 2022 (USD Billion) 186
TABLE NO. 167. : Poland Gift Cards Market Revenue, By Type, 2023– 2030 (USD Billion) 186
TABLE NO. 168. : Poland Gift Cards Market Revenue, By Merchant Type, 2017 – 2022 (USD Billion) 187
TABLE NO. 169. : Poland Gift Cards Market Revenue, By Merchant Type, 2023– 2030 (USD Billion) 187
TABLE NO. 170. : Poland Gift Cards Market Revenue, By End-user, 2017 – 2022 (USD Billion) 188
TABLE NO. 171. : Poland Gift Cards Market Revenue, By End-user, 2023– 2030 (USD Billion) 188
TABLE NO. 172. : Poland Gift Cards Market Revenue, By Price Range, 2017 – 2022 (USD Billion) 189
TABLE NO. 173. : Poland Gift Cards Market Revenue, By Price Range, 2023– 2030 (USD Billion) 189
TABLE NO. 174. : Denmark Gift Cards Market Revenue, By Type, 2017 – 2022 (USD Billion) 190
TABLE NO. 175. : Denmark Gift Cards Market Revenue, By Type, 2023– 2030 (USD Billion) 190
TABLE NO. 176. : Denmark Gift Cards Market Revenue, By Merchant Type, 2017 – 2022 (USD Billion) 191
TABLE NO. 177. : Denmark Gift Cards Market Revenue, By Merchant Type, 2023– 2030 (USD Billion) 191
TABLE NO. 178. : Denmark Gift Cards Market Revenue, By End-user, 2017 – 2022 (USD Billion) 192
TABLE NO. 179. : Denmark Gift Cards Market Revenue, By End-user, 2023– 2030 (USD Billion) 192
TABLE NO. 180. : Denmark Gift Cards Market Revenue, By Price Range, 2017 – 2022 (USD Billion) 193
TABLE NO. 181. : Denmark Gift Cards Market Revenue, By Price Range, 2023– 2030 (USD Billion) 193
TABLE NO. 182. : Switzerland Gift Cards Market Revenue, By Type, 2017 – 2022 (USD Billion) 194
TABLE NO. 183. : Switzerland Gift Cards Market Revenue, By Type, 2023– 2030 (USD Billion) 194
TABLE NO. 184. : Switzerland Gift Cards Market Revenue, By Merchant Type, 2017 – 2022 (USD Billion) 195
TABLE NO. 185. : Switzerland Gift Cards Market Revenue, By Merchant Type, 2023– 2030 (USD Billion) 195
TABLE NO. 186. : Switzerland Gift Cards Market Revenue, By End-user, 2017 – 2022 (USD Billion) 196
TABLE NO. 187. : Switzerland Gift Cards Market Revenue, By End-user, 2023– 2030 (USD Billion) 196
TABLE NO. 188. : Switzerland Gift Cards Market Revenue, By Price Range, 2017 – 2022 (USD Billion) 197
TABLE NO. 189. : Switzerland Gift Cards Market Revenue, By Price Range, 2023– 2030 (USD Billion) 197
TABLE NO. 190. : Rest of Europe Gift Cards Market Revenue, By Type, 2017 – 2022 (USD Billion) 198
TABLE NO. 191. : Rest of Europe Gift Cards Market Revenue, By Type, 2023– 2030 (USD Billion) 198
TABLE NO. 192. : Rest of Europe Gift Cards Market Revenue, By Merchant Type, 2017 – 2022 (USD Billion) 199
TABLE NO. 193. : Rest of Europe Gift Cards Market Revenue, By Merchant Type, 2023– 2030 (USD Billion) 199
TABLE NO. 194. : Rest of Europe Gift Cards Market Revenue, By End-user, 2017 – 2022 (USD Billion) 200
TABLE NO. 195. : Rest of Europe Gift Cards Market Revenue, By End-user, 2023– 2030 (USD Billion) 200
TABLE NO. 196. : Rest of Europe Gift Cards Market Revenue, By Price Range, 2017 – 2022 (USD Billion) 201
TABLE NO. 197. : Rest of Europe Gift Cards Market Revenue, By Price Range, 2023– 2030 (USD Billion) 201
TABLE NO. 198. : Asia Pacific Gift Cards Market Revenue, By Country, 2017 – 2022 (USD Billion) 204
TABLE NO. 199. : Asia Pacific Gift Cards Market Revenue, By Country, 2023– 2030 (USD Billion) 204
TABLE NO. 200. : Asia Pacific Gift Cards Market Revenue, By Type, 2017 – 2022 (USD Billion) 205
TABLE NO. 201. : Asia Pacific Gift Cards Market Revenue, By Type, 2023– 2030 (USD Billion) 205
TABLE NO. 202. : Asia Pacific Gift Cards Market Revenue, By Merchant Type, 2017 – 2022 (USD Billion) 206
TABLE NO. 203. : Asia Pacific Gift Cards Market Revenue, By Merchant Type, 2023– 2030 (USD Billion) 206
TABLE NO. 204. : Asia Pacific Gift Cards Market Revenue, By End-user, 2017 – 2022 (USD Billion) 207
TABLE NO. 205. : Asia Pacific Gift Cards Market Revenue, By End-user, 2023– 2030 (USD Billion) 207
TABLE NO. 206. : Asia Pacific Gift Cards Market Revenue, By Price Range, 2017 – 2022 (USD Billion) 208
TABLE NO. 207. : Asia Pacific Gift Cards Market Revenue, By Price Range, 2023– 2030 (USD Billion) 208
TABLE NO. 208. : China Gift Cards Market Revenue, By Type, 2017 – 2022 (USD Billion) 209
TABLE NO. 209. : China Gift Cards Market Revenue, By Type, 2023– 2030 (USD Billion) 209
TABLE NO. 210. : China Gift Cards Market Revenue, By Merchant Type, 2017 – 2022 (USD Billion) 210
TABLE NO. 211. : China Gift Cards Market Revenue, By Merchant Type, 2023– 2030 (USD Billion) 210
TABLE NO. 212. : China Gift Cards Market Revenue, By End-user, 2017 – 2022 (USD Billion) 211
TABLE NO. 213. : China Gift Cards Market Revenue, By End-user, 2023– 2030 (USD Billion) 211
TABLE NO. 214. : China Gift Cards Market Revenue, By Price Range, 2017 – 2022 (USD Billion) 212
TABLE NO. 215. : China Gift Cards Market Revenue, By Price Range, 2023– 2030 (USD Billion) 212
TABLE NO. 216. : Japan Gift Cards Market Revenue, By Type, 2017 – 2022 (USD Billion) 213
TABLE NO. 217. : Japan Gift Cards Market Revenue, By Type, 2023– 2030 (USD Billion) 213
TABLE NO. 218. : Japan Gift Cards Market Revenue, By Merchant Type, 2017 – 2022 (USD Billion) 214
TABLE NO. 219. : Japan Gift Cards Market Revenue, By Merchant Type, 2023– 2030 (USD Billion) 214
TABLE NO. 220. : Japan Gift Cards Market Revenue, By End-user, 2017 – 2022 (USD Billion) 215
TABLE NO. 221. : Japan Gift Cards Market Revenue, By End-user, 2023– 2030 (USD Billion) 215
TABLE NO. 222. : Japan Gift Cards Market Revenue, By Price Range, 2017 – 2022 (USD Billion) 216
TABLE NO. 223. : Japan Gift Cards Market Revenue, By Price Range, 2023– 2030 (USD Billion) 216
TABLE NO. 224. : South Korea Gift Cards Market Revenue, By Type, 2017 – 2022 (USD Billion) 217
TABLE NO. 225. : South Korea Gift Cards Market Revenue, By Type, 2023– 2030 (USD Billion) 217
TABLE NO. 226. : South Korea Gift Cards Market Revenue, By Merchant Type, 2017 – 2022 (USD Billion) 218
TABLE NO. 227. : South Korea Gift Cards Market Revenue, By Merchant Type, 2023– 2030 (USD Billion) 218
TABLE NO. 228. : South Korea Gift Cards Market Revenue, By End-user, 2017 – 2022 (USD Billion) 219
TABLE NO. 229. : South Korea Gift Cards Market Revenue, By End-user, 2023– 2030 (USD Billion) 219
TABLE NO. 230. : South Korea Gift Cards Market Revenue, By Price Range, 2017 – 2022 (USD Billion) 220
TABLE NO. 231. : South Korea Gift Cards Market Revenue, By Price Range, 2023– 2030 (USD Billion) 220
TABLE NO. 232. : India Gift Cards Market Revenue, By Type, 2017 – 2022 (USD Billion) 221
TABLE NO. 233. : India Gift Cards Market Revenue, By Type, 2023– 2030 (USD Billion) 221
TABLE NO. 234. : India Gift Cards Market Revenue, By Merchant Type, 2017 – 2022 (USD Billion) 222
TABLE NO. 235. : India Gift Cards Market Revenue, By Merchant Type, 2023– 2030 (USD Billion) 222
TABLE NO. 236. : India Gift Cards Market Revenue, By End-user, 2017 – 2022 (USD Billion) 223
TABLE NO. 237. : India Gift Cards Market Revenue, By End-user, 2023– 2030 (USD Billion) 223
TABLE NO. 238. : India Gift Cards Market Revenue, By Price Range, 2017 – 2022 (USD Billion) 224
TABLE NO. 239. : India Gift Cards Market Revenue, By Price Range, 2023– 2030 (USD Billion) 224
TABLE NO. 240. : Australia Gift Cards Market Revenue, By Type, 2017 – 2022 (USD Billion) 225
TABLE NO. 241. : Australia Gift Cards Market Revenue, By Type, 2023– 2030 (USD Billion) 225
TABLE NO. 242. : Australia Gift Cards Market Revenue, By Merchant Type, 2017 – 2022 (USD Billion) 226
TABLE NO. 243. : Australia Gift Cards Market Revenue, By Merchant Type, 2023– 2030 (USD Billion) 226
TABLE NO. 244. : Australia Gift Cards Market Revenue, By End-user, 2017 – 2022 (USD Billion) 227
TABLE NO. 245. : Australia Gift Cards Market Revenue, By End-user, 2023– 2030 (USD Billion) 227
TABLE NO. 246. : Australia Gift Cards Market Revenue, By Price Range, 2017 – 2022 (USD Billion) 228
TABLE NO. 247. : Australia Gift Cards Market Revenue, By Price Range, 2023– 2030 (USD Billion) 228
TABLE NO. 248. : Thailand Gift Cards Market Revenue, By Type, 2017 – 2022 (USD Billion) 229
TABLE NO. 249. : Thailand Gift Cards Market Revenue, By Type, 2023– 2030 (USD Billion) 229
TABLE NO. 250. : Thailand Gift Cards Market Revenue, By Merchant Type, 2017 – 2022 (USD Billion) 230
TABLE NO. 251. : Thailand Gift Cards Market Revenue, By Merchant Type, 2023– 2030 (USD Billion) 230
TABLE NO. 252. : Thailand Gift Cards Market Revenue, By End-user, 2017 – 2022 (USD Billion) 231
TABLE NO. 253. : Thailand Gift Cards Market Revenue, By End-user, 2023– 2030 (USD Billion) 231
TABLE NO. 254. : Thailand Gift Cards Market Revenue, By Price Range, 2017 – 2022 (USD Billion) 232
TABLE NO. 255. : Thailand Gift Cards Market Revenue, By Price Range, 2023– 2030 (USD Billion) 232
TABLE NO. 256. : Indonesia Gift Cards Market Revenue, By Type, 2017 – 2022 (USD Billion) 233
TABLE NO. 257. : Indonesia Gift Cards Market Revenue, By Type, 2023– 2030 (USD Billion) 233
TABLE NO. 258. : Indonesia Gift Cards Market Revenue, By Merchant Type, 2017 – 2022 (USD Billion) 234
TABLE NO. 259. : Indonesia Gift Cards Market Revenue, By Merchant Type, 2023– 2030 (USD Billion) 234
TABLE NO. 260. : Indonesia Gift Cards Market Revenue, By End-user, 2017 – 2022 (USD Billion) 235
TABLE NO. 261. : Indonesia Gift Cards Market Revenue, By End-user, 2023– 2030 (USD Billion) 235
TABLE NO. 262. : Indonesia Gift Cards Market Revenue, By Price Range, 2017 – 2022 (USD Billion) 236
TABLE NO. 263. : Indonesia Gift Cards Market Revenue, By Price Range, 2023– 2030 (USD Billion) 236
TABLE NO. 264. : Vietnam Gift Cards Market Revenue, By Type, 2017 – 2022 (USD Billion) 237
TABLE NO. 265. : Vietnam Gift Cards Market Revenue, By Type, 2023– 2030 (USD Billion) 237
TABLE NO. 266. : Vietnam Gift Cards Market Revenue, By Merchant Type, 2017 – 2022 (USD Billion) 238
TABLE NO. 267. : Vietnam Gift Cards Market Revenue, By Merchant Type, 2023– 2030 (USD Billion) 238
TABLE NO. 268. : Vietnam Gift Cards Market Revenue, By End-user, 2017 – 2022 (USD Billion) 239
TABLE NO. 269. : Vietnam Gift Cards Market Revenue, By End-user, 2023– 2030 (USD Billion) 239
TABLE NO. 270. : Vietnam Gift Cards Market Revenue, By Price Range, 2017 – 2022 (USD Billion) 240
TABLE NO. 271. : Vietnam Gift Cards Market Revenue, By Price Range, 2023– 2030 (USD Billion) 240
TABLE NO. 272. : Malaysia Gift Cards Market Revenue, By Type, 2017 – 2022 (USD Billion) 241
TABLE NO. 273. : Malaysia Gift Cards Market Revenue, By Type, 2023– 2030 (USD Billion) 241
TABLE NO. 274. : Malaysia Gift Cards Market Revenue, By Merchant Type, 2017 – 2022 (USD Billion) 242
TABLE NO. 275. : Malaysia Gift Cards Market Revenue, By Merchant Type, 2023– 2030 (USD Billion) 242
TABLE NO. 276. : Malaysia Gift Cards Market Revenue, By End-user, 2017 – 2022 (USD Billion) 243
TABLE NO. 277. : Malaysia Gift Cards Market Revenue, By End-user, 2023– 2030 (USD Billion) 243
TABLE NO. 278. : Malaysia Gift Cards Market Revenue, By Price Range, 2017 – 2022 (USD Billion) 244
TABLE NO. 279. : Malaysia Gift Cards Market Revenue, By Price Range, 2023– 2030 (USD Billion) 244
TABLE NO. 280. : Philippines Gift Cards Market Revenue, By Type, 2017 – 2022 (USD Billion) 245
TABLE NO. 281. : Philippines Gift Cards Market Revenue, By Type, 2023– 2030 (USD Billion) 245
TABLE NO. 282. : Philippines Gift Cards Market Revenue, By Merchant Type, 2017 – 2022 (USD Billion) 246
TABLE NO. 283. : Philippines Gift Cards Market Revenue, By Merchant Type, 2023– 2030 (USD Billion) 246
TABLE NO. 284. : Philippines Gift Cards Market Revenue, By End-user, 2017 – 2022 (USD Billion) 247
TABLE NO. 285. : Philippines Gift Cards Market Revenue, By End-user, 2023– 2030 (USD Billion) 247
TABLE NO. 286. : Philippines Gift Cards Market Revenue, By Price Range, 2017 – 2022 (USD Billion) 248
TABLE NO. 287. : Philippines Gift Cards Market Revenue, By Price Range, 2023– 2030 (USD Billion) 248
TABLE NO. 288. : Taiwan Gift Cards Market Revenue, By Type, 2017 – 2022 (USD Billion) 249
TABLE NO. 289. : Taiwan Gift Cards Market Revenue, By Type, 2023– 2030 (USD Billion) 249
TABLE NO. 290. : Taiwan Gift Cards Market Revenue, By Merchant Type, 2017 – 2022 (USD Billion) 250
TABLE NO. 291. : Taiwan Gift Cards Market Revenue, By Merchant Type, 2023– 2030 (USD Billion) 250
TABLE NO. 292. : Taiwan Gift Cards Market Revenue, By End-user, 2017 – 2022 (USD Billion) 251
TABLE NO. 293. : Taiwan Gift Cards Market Revenue, By End-user, 2023– 2030 (USD Billion) 251
TABLE NO. 294. : Taiwan Gift Cards Market Revenue, By Price Range, 2017 – 2022 (USD Billion) 252
TABLE NO. 295. : Taiwan Gift Cards Market Revenue, By Price Range, 2023– 2030 (USD Billion) 252
TABLE NO. 296. : Rest of Asia Pacific Gift Cards Market Revenue, By Type, 2017 – 2022 (USD Billion) 253
TABLE NO. 297. : Rest of Asia Pacific Gift Cards Market Revenue, By Type, 2023– 2030 (USD Billion) 253
TABLE NO. 298. : Rest of Asia Pacific Gift Cards Market Revenue, By Merchant Type, 2017 – 2022 (USD Billion) 254
TABLE NO. 299. : Rest of Asia Pacific Gift Cards Market Revenue, By Merchant Type, 2023– 2030 (USD Billion) 254
TABLE NO. 300. : Rest of Asia Pacific Gift Cards Market Revenue, By End-user, 2017 – 2022 (USD Billion) 255
TABLE NO. 301. : Rest of Asia Pacific Gift Cards Market Revenue, By End-user, 2023– 2030 (USD Billion) 255
TABLE NO. 302. : Rest of Asia Pacific Gift Cards Market Revenue, By Price Range, 2017 – 2022 (USD Billion) 256
TABLE NO. 303. : Rest of Asia Pacific Gift Cards Market Revenue, By Price Range, 2023– 2030 (USD Billion) 256
TABLE NO. 304. : Latin America Gift Cards Market Revenue, By Country, 2017 – 2022 (USD Billion) 258
TABLE NO. 305. : Latin America Gift Cards Market Revenue, By Country, 2023– 2030 (USD Billion) 258
TABLE NO. 306. : Latin America Gift Cards Market Revenue, By Type, 2017 – 2022 (USD Billion) 259
TABLE NO. 307. : Latin America Gift Cards Market Revenue, By Type, 2023– 2030 (USD Billion) 259
TABLE NO. 308. : Latin America Gift Cards Market Revenue, By Merchant Type, 2017 – 2022 (USD Billion) 260
TABLE NO. 309. : Latin America Gift Cards Market Revenue, By Merchant Type, 2023– 2030 (USD Billion) 260
TABLE NO. 310. : Latin America Gift Cards Market Revenue, By End-user, 2017 – 2022 (USD Billion) 261
TABLE NO. 311. : Latin America Gift Cards Market Revenue, By End-user, 2023– 2030 (USD Billion) 261
TABLE NO. 312. : Latin America Gift Cards Market Revenue, By Price Range, 2017 – 2022 (USD Billion) 262
TABLE NO. 313. : Latin America Gift Cards Market Revenue, By Price Range, 2023– 2030 (USD Billion) 262
TABLE NO. 314. : Brazil Gift Cards Market Revenue, By Type, 2017 – 2022 (USD Billion) 263
TABLE NO. 315. : Brazil Gift Cards Market Revenue, By Type, 2023– 2030 (USD Billion) 263
TABLE NO. 316. : Brazil Gift Cards Market Revenue, By Merchant Type, 2017 – 2022 (USD Billion) 264
TABLE NO. 317. : Brazil Gift Cards Market Revenue, By Merchant Type, 2023– 2030 (USD Billion) 264
TABLE NO. 318. : Brazil Gift Cards Market Revenue, By End-user, 2017 – 2022 (USD Billion) 265
TABLE NO. 319. : Brazil Gift Cards Market Revenue, By End-user, 2023– 2030 (USD Billion) 265
TABLE NO. 320. : Brazil Gift Cards Market Revenue, By Price Range, 2017 – 2022 (USD Billion) 266
TABLE NO. 321. : Brazil Gift Cards Market Revenue, By Price Range, 2023– 2030 (USD Billion) 266
TABLE NO. 322. : Argentina Gift Cards Market Revenue, By Type, 2017 – 2022 (USD Billion) 267
TABLE NO. 323. : Argentina Gift Cards Market Revenue, By Type, 2023– 2030 (USD Billion) 267
TABLE NO. 324. : Argentina Gift Cards Market Revenue, By Merchant Type, 2017 – 2022 (USD Billion) 268
TABLE NO. 325. : Argentina Gift Cards Market Revenue, By Merchant Type, 2023– 2030 (USD Billion) 268
TABLE NO. 326. : Argentina Gift Cards Market Revenue, By End-user, 2017 – 2022 (USD Billion) 269
TABLE NO. 327. : Argentina Gift Cards Market Revenue, By End-user, 2023– 2030 (USD Billion) 269
TABLE NO. 328. : Argentina Gift Cards Market Revenue, By Price Range, 2017 – 2022 (USD Billion) 270
TABLE NO. 329. : Argentina Gift Cards Market Revenue, By Price Range, 2023– 2030 (USD Billion) 270
TABLE NO. 330. : Peru Gift Cards Market Revenue, By Type, 2017 – 2022 (USD Billion) 271
TABLE NO. 331. : Peru Gift Cards Market Revenue, By Type, 2023– 2030 (USD Billion) 271
TABLE NO. 332. : Peru Gift Cards Market Revenue, By Merchant Type, 2017 – 2022 (USD Billion) 272
TABLE NO. 333. : Peru Gift Cards Market Revenue, By Merchant Type, 2023– 2030 (USD Billion) 272
TABLE NO. 334. : Peru Gift Cards Market Revenue, By End-user, 2017 – 2022 (USD Billion) 273
TABLE NO. 335. : Peru Gift Cards Market Revenue, By End-user, 2023– 2030 (USD Billion) 273
TABLE NO. 336. : Peru Gift Cards Market Revenue, By Price Range, 2017 – 2022 (USD Billion) 274
TABLE NO. 337. : Peru Gift Cards Market Revenue, By Price Range, 2023– 2030 (USD Billion) 274
TABLE NO. 338. : Chile Gift Cards Market Revenue, By Type, 2017 – 2022 (USD Billion) 275
TABLE NO. 339. : Chile Gift Cards Market Revenue, By Type, 2023– 2030 (USD Billion) 275
TABLE NO. 340. : Chile Gift Cards Market Revenue, By Merchant Type, 2017 – 2022 (USD Billion) 276
TABLE NO. 341. : Chile Gift Cards Market Revenue, By Merchant Type, 2023– 2030 (USD Billion) 276
TABLE NO. 342. : Chile Gift Cards Market Revenue, By End-user, 2017 – 2022 (USD Billion) 277
TABLE NO. 343. : Chile Gift Cards Market Revenue, By End-user, 2023– 2030 (USD Billion) 277
TABLE NO. 344. : Chile Gift Cards Market Revenue, By Price Range, 2017 – 2022 (USD Billion) 278
TABLE NO. 345. : Chile Gift Cards Market Revenue, By Price Range, 2023– 2030 (USD Billion) 278
TABLE NO. 346. : Colombia Gift Cards Market Revenue, By Type, 2017 – 2022 (USD Billion) 279
TABLE NO. 347. : Colombia Gift Cards Market Revenue, By Type, 2023– 2030 (USD Billion) 279
TABLE NO. 348. : Colombia Gift Cards Market Revenue, By Merchant Type, 2017 – 2022 (USD Billion) 280
TABLE NO. 349. : Colombia Gift Cards Market Revenue, By Merchant Type, 2023– 2030 (USD Billion) 280
TABLE NO. 350. : Colombia Gift Cards Market Revenue, By End-user, 2017 – 2022 (USD Billion) 281
TABLE NO. 351. : Colombia Gift Cards Market Revenue, By End-user, 2023– 2030 (USD Billion) 281
TABLE NO. 352. : Colombia Gift Cards Market Revenue, By Price Range, 2017 – 2022 (USD Billion) 282
TABLE NO. 353. : Colombia Gift Cards Market Revenue, By Price Range, 2023– 2030 (USD Billion) 282
TABLE NO. 354. : Rest of Latin America Gift Cards Market Revenue, By Type, 2017 – 2022 (USD Billion) 283
TABLE NO. 355. : Rest of Latin America Gift Cards Market Revenue, By Type, 2023– 2030 (USD Billion) 283
TABLE NO. 356. : Rest of Latin America Gift Cards Market Revenue, By Merchant Type, 2017 – 2022 (USD Billion) 284
TABLE NO. 357. : Rest of Latin America Gift Cards Market Revenue, By Merchant Type, 2023– 2030 (USD Billion) 284
TABLE NO. 358. : Rest of Latin America Gift Cards Market Revenue, By End-user, 2017 – 2022 (USD Billion) 285
TABLE NO. 359. : Rest of Latin America Gift Cards Market Revenue, By End-user, 2023– 2030 (USD Billion) 285
TABLE NO. 360. : Rest of Latin America Gift Cards Market Revenue, By Price Range, 2017 – 2022 (USD Billion) 286
TABLE NO. 361. : Rest of Latin America Gift Cards Market Revenue, By Price Range, 2023– 2030 (USD Billion) 286
TABLE NO. 362. : Middle East Gift Cards Market Revenue, By Country, 2017 – 2022 (USD Billion) 288
TABLE NO. 363. : Middle East Gift Cards Market Revenue, By Country, 2023– 2030 (USD Billion) 288
TABLE NO. 364. : Middle East Gift Cards Market Revenue, By Type, 2017 – 2022 (USD Billion) 289
TABLE NO. 365. : Middle East Gift Cards Market Revenue, By Type, 2023– 2030 (USD Billion) 289
TABLE NO. 366. : Middle East Gift Cards Market Revenue, By Merchant Type, 2017 – 2022 (USD Billion) 290
TABLE NO. 367. : Middle East Gift Cards Market Revenue, By Merchant Type, 2023– 2030 (USD Billion) 290
TABLE NO. 368. : Middle East Gift Cards Market Revenue, By End-user, 2017 – 2022 (USD Billion) 291
TABLE NO. 369. : Middle East Gift Cards Market Revenue, By End-user, 2023– 2030 (USD Billion) 291
TABLE NO. 370. : Middle East Gift Cards Market Revenue, By Price Range, 2017 – 2022 (USD Billion) 292
TABLE NO. 371. : Middle East Gift Cards Market Revenue, By Price Range, 2023– 2030 (USD Billion) 292
TABLE NO. 372. : UAE Gift Cards Market Revenue, By Type, 2017 – 2022 (USD Billion) 293
TABLE NO. 373. : UAE Gift Cards Market Revenue, By Type, 2023– 2030 (USD Billion) 293
TABLE NO. 374. : UAE Gift Cards Market Revenue, By Merchant Type, 2017 – 2022 (USD Billion) 294
TABLE NO. 375. : UAE Gift Cards Market Revenue, By Merchant Type, 2023– 2030 (USD Billion) 294
TABLE NO. 376. : UAE Gift Cards Market Revenue, By End-user, 2017 – 2022 (USD Billion) 295
TABLE NO. 377. : UAE Gift Cards Market Revenue, By End-user, 2023– 2030 (USD Billion) 295
TABLE NO. 378. : UAE Gift Cards Market Revenue, By Price Range, 2017 – 2022 (USD Billion) 296
TABLE NO. 379. : UAE Gift Cards Market Revenue, By Price Range, 2023– 2030 (USD Billion) 296
TABLE NO. 380. : KSA Gift Cards Market Revenue, By Type, 2017 – 2022 (USD Billion) 297
TABLE NO. 381. : KSA Gift Cards Market Revenue, By Type, 2023– 2030 (USD Billion) 297
TABLE NO. 382. : KSA Gift Cards Market Revenue, By Merchant Type, 2017 – 2022 (USD Billion) 298
TABLE NO. 383. : KSA Gift Cards Market Revenue, By Merchant Type, 2023– 2030 (USD Billion) 298
TABLE NO. 384. : KSA Gift Cards Market Revenue, By End-user, 2017 – 2022 (USD Billion) 299
TABLE NO. 385. : KSA Gift Cards Market Revenue, By End-user, 2023– 2030 (USD Billion) 299
TABLE NO. 386. : KSA Gift Cards Market Revenue, By Price Range, 2017 – 2022 (USD Billion) 300
TABLE NO. 387. : KSA Gift Cards Market Revenue, By Price Range, 2023– 2030 (USD Billion) 300
TABLE NO. 388. : Israel Gift Cards Market Revenue, By Type, 2017 – 2022 (USD Billion) 301
TABLE NO. 389. : Israel Gift Cards Market Revenue, By Type, 2023– 2030 (USD Billion) 301
TABLE NO. 390. : Israel Gift Cards Market Revenue, By Merchant Type, 2017 – 2022 (USD Billion) 302
TABLE NO. 391. : Israel Gift Cards Market Revenue, By Merchant Type, 2023– 2030 (USD Billion) 302
TABLE NO. 392. : Israel Gift Cards Market Revenue, By End-user, 2017 – 2022 (USD Billion) 303
TABLE NO. 393. : Israel Gift Cards Market Revenue, By End-user, 2023– 2030 (USD Billion) 303
TABLE NO. 394. : Israel Gift Cards Market Revenue, By Price Range, 2017 – 2022 (USD Billion) 304
TABLE NO. 395. : Israel Gift Cards Market Revenue, By Price Range, 2023– 2030 (USD Billion) 304
TABLE NO. 396. : Turkey Gift Cards Market Revenue, By Type, 2017 – 2022 (USD Billion) 305
TABLE NO. 397. : Turkey Gift Cards Market Revenue, By Type, 2023– 2030 (USD Billion) 305
TABLE NO. 398. : Turkey Gift Cards Market Revenue, By Merchant Type, 2017 – 2022 (USD Billion) 306
TABLE NO. 399. : Turkey Gift Cards Market Revenue, By Merchant Type, 2023– 2030 (USD Billion) 306
TABLE NO. 400. : Turkey Gift Cards Market Revenue, By End-user, 2017 – 2022 (USD Billion) 307
TABLE NO. 401. : Turkey Gift Cards Market Revenue, By End-user, 2023– 2030 (USD Billion) 307
TABLE NO. 402. : Turkey Gift Cards Market Revenue, By Price Range, 2017 – 2022 (USD Billion) 308
TABLE NO. 403. : Turkey Gift Cards Market Revenue, By Price Range, 2023– 2030 (USD Billion) 308
TABLE NO. 404. : Iran Gift Cards Market Revenue, By Type, 2017 – 2022 (USD Billion) 309
TABLE NO. 405. : Iran Gift Cards Market Revenue, By Type, 2023– 2030 (USD Billion) 309
TABLE NO. 406. : Iran Gift Cards Market Revenue, By Merchant Type, 2017 – 2022 (USD Billion) 310
TABLE NO. 407. : Iran Gift Cards Market Revenue, By Merchant Type, 2023– 2030 (USD Billion) 310
TABLE NO. 408. : Iran Gift Cards Market Revenue, By End-user, 2017 – 2022 (USD Billion) 311
TABLE NO. 409. : Iran Gift Cards Market Revenue, By End-user, 2023– 2030 (USD Billion) 311
TABLE NO. 410. : Iran Gift Cards Market Revenue, By Price Range, 2017 – 2022 (USD Billion) 312
TABLE NO. 411. : Iran Gift Cards Market Revenue, By Price Range, 2023– 2030 (USD Billion) 312
TABLE NO. 412. : Rest of Middle East Gift Cards Market Revenue, By Type, 2017 – 2022 (USD Billion) 313
TABLE NO. 413. : Rest of Middle East Gift Cards Market Revenue, By Type, 2023– 2030 (USD Billion) 313
TABLE NO. 414. : Rest of Middle East Gift Cards Market Revenue, By Merchant Type, 2017 – 2022 (USD Billion) 314
TABLE NO. 415. : Rest of Middle East Gift Cards Market Revenue, By Merchant Type, 2023– 2030 (USD Billion) 314
TABLE NO. 416. : Rest of Middle East Gift Cards Market Revenue, By End-user, 2017 – 2022 (USD Billion) 315
TABLE NO. 417. : Rest of Middle East Gift Cards Market Revenue, By End-user, 2023– 2030 (USD Billion) 315
TABLE NO. 418. : Rest of Middle East Gift Cards Market Revenue, By Price Range, 2017 – 2022 (USD Billion) 316
TABLE NO. 419. : Rest of Middle East Gift Cards Market Revenue, By Price Range, 2023– 2030 (USD Billion) 316
TABLE NO. 420. : Africa Gift Cards Market Revenue, By Country, 2017 – 2022 (USD Billion) 318
TABLE NO. 421. : Africa Gift Cards Market Revenue, By Country, 2023– 2030 (USD Billion) 318
TABLE NO. 422. : Africa Gift Cards Market Revenue, By Type, 2017 – 2022 (USD Billion) 319
TABLE NO. 423. : Africa Gift Cards Market Revenue, By Type, 2023– 2030 (USD Billion) 319
TABLE NO. 424. : Africa Gift Cards Market Revenue, By Merchant Type, 2017 – 2022 (USD Billion) 320
TABLE NO. 425. : Africa Gift Cards Market Revenue, By Merchant Type, 2023– 2030 (USD Billion) 320
TABLE NO. 426. : Africa Gift Cards Market Revenue, By End-user, 2017 – 2022 (USD Billion) 321
TABLE NO. 427. : Africa Gift Cards Market Revenue, By End-user, 2023– 2030 (USD Billion) 321
TABLE NO. 428. : Africa Gift Cards Market Revenue, By Price Range, 2017 – 2022 (USD Billion) 322
TABLE NO. 429. : Africa Gift Cards Market Revenue, By Price Range, 2023– 2030 (USD Billion) 322
TABLE NO. 430. : South Africa Gift Cards Market Revenue, By Type, 2017 – 2022 (USD Billion) 323
TABLE NO. 431. : South Africa Gift Cards Market Revenue, By Type, 2023– 2030 (USD Billion) 323
TABLE NO. 432. : South Africa Gift Cards Market Revenue, By Merchant Type, 2017 – 2022 (USD Billion) 324
TABLE NO. 433. : South Africa Gift Cards Market Revenue, By Merchant Type, 2023– 2030 (USD Billion) 324
TABLE NO. 434. : South Africa Gift Cards Market Revenue, By End-user, 2017 – 2022 (USD Billion) 325
TABLE NO. 435. : South Africa Gift Cards Market Revenue, By End-user, 2023– 2030 (USD Billion) 325
TABLE NO. 436. : South Africa Gift Cards Market Revenue, By Price Range, 2017 – 2022 (USD Billion) 326
TABLE NO. 437. : South Africa Gift Cards Market Revenue, By Price Range, 2023– 2030 (USD Billion) 326
TABLE NO. 438. : Egypt Gift Cards Market Revenue, By Type, 2017 – 2022 (USD Billion) 327
TABLE NO. 439. : Egypt Gift Cards Market Revenue, By Type, 2023– 2030 (USD Billion) 327
TABLE NO. 440. : Egypt Gift Cards Market Revenue, By Merchant Type, 2017 – 2022 (USD Billion) 328
TABLE NO. 441. : Egypt Gift Cards Market Revenue, By Merchant Type, 2023– 2030 (USD Billion) 328
TABLE NO. 442. : Egypt Gift Cards Market Revenue, By End-user, 2017 – 2022 (USD Billion) 329
TABLE NO. 443. : Egypt Gift Cards Market Revenue, By End-user, 2023– 2030 (USD Billion) 329
TABLE NO. 444. : Egypt Gift Cards Market Revenue, By Price Range, 2017 – 2022 (USD Billion) 330
TABLE NO. 445. : Egypt Gift Cards Market Revenue, By Price Range, 2023– 2030 (USD Billion) 330
TABLE NO. 446. : Nigeria Gift Cards Market Revenue, By Type, 2017 – 2022 (USD Billion) 331
TABLE NO. 447. : Nigeria Gift Cards Market Revenue, By Type, 2023– 2030 (USD Billion) 331
TABLE NO. 448. : Nigeria Gift Cards Market Revenue, By Merchant Type, 2017 – 2022 (USD Billion) 332
TABLE NO. 449. : Nigeria Gift Cards Market Revenue, By Merchant Type, 2023– 2030 (USD Billion) 332
TABLE NO. 450. : Nigeria Gift Cards Market Revenue, By End-user, 2017 – 2022 (USD Billion) 333
TABLE NO. 451. : Nigeria Gift Cards Market Revenue, By End-user, 2023– 2030 (USD Billion) 333
TABLE NO. 452. : Nigeria Gift Cards Market Revenue, By Price Range, 2017 – 2022 (USD Billion) 334
TABLE NO. 453. : Nigeria Gift Cards Market Revenue, By Price Range, 2023– 2030 (USD Billion) 334
TABLE NO. 454. : Algeria Gift Cards Market Revenue, By Type, 2017 – 2022 (USD Billion) 335
TABLE NO. 455. : Algeria Gift Cards Market Revenue, By Type, 2023– 2030 (USD Billion) 335
TABLE NO. 456. : Algeria Gift Cards Market Revenue, By Merchant Type, 2017 – 2022 (USD Billion) 336
TABLE NO. 457. : Algeria Gift Cards Market Revenue, By Merchant Type, 2023– 2030 (USD Billion) 336
TABLE NO. 458. : Algeria Gift Cards Market Revenue, By End-user, 2017 – 2022 (USD Billion) 337
TABLE NO. 459. : Algeria Gift Cards Market Revenue, By End-user, 2023– 2030 (USD Billion) 337
TABLE NO. 460. : Algeria Gift Cards Market Revenue, By Price Range, 2017 – 2022 (USD Billion) 338
TABLE NO. 461. : Algeria Gift Cards Market Revenue, By Price Range, 2023– 2030 (USD Billion) 338
TABLE NO. 462. : Morocco Gift Cards Market Revenue, By Type, 2017 – 2022 (USD Billion) 339
TABLE NO. 463. : Morocco Gift Cards Market Revenue, By Type, 2023– 2030 (USD Billion) 339
TABLE NO. 464. : Morocco Gift Cards Market Revenue, By Merchant Type, 2017 – 2022 (USD Billion) 340
TABLE NO. 465. : Morocco Gift Cards Market Revenue, By Merchant Type, 2023– 2030 (USD Billion) 340
TABLE NO. 466. : Morocco Gift Cards Market Revenue, By End-user, 2017 – 2022 (USD Billion) 341
TABLE NO. 467. : Morocco Gift Cards Market Revenue, By End-user, 2023– 2030 (USD Billion) 341
TABLE NO. 468. : Morocco Gift Cards Market Revenue, By Price Range, 2017 – 2022 (USD Billion) 342
TABLE NO. 469. : Morocco Gift Cards Market Revenue, By Price Range, 2023– 2030 (USD Billion) 342
TABLE NO. 470. : Rest of Africa Gift Cards Market Revenue, By Type, 2017 – 2022 (USD Billion) 343
TABLE NO. 471. : Rest of Africa Gift Cards Market Revenue, By Type, 2023– 2030 (USD Billion) 343
TABLE NO. 472. : Rest of Africa Gift Cards Market Revenue, By Merchant Type, 2017 – 2022 (USD Billion) 344
TABLE NO. 473. : Rest of Africa Gift Cards Market Revenue, By Merchant Type, 2023– 2030 (USD Billion) 344
TABLE NO. 474. : Rest of Africa Gift Cards Market Revenue, By End-user, 2017 – 2022 (USD Billion) 345
TABLE NO. 475. : Rest of Africa Gift Cards Market Revenue, By End-user, 2023– 2030 (USD Billion) 345
TABLE NO. 476. : Rest of Africa Gift Cards Market Revenue, By Price Range, 2017 – 2022 (USD Billion) 346
TABLE NO. 477. : Rest of Africa Gift Cards Market Revenue, By Price Range, 2023– 2030 (USD Billion) 346