
Offshore gas completions keep heavy brines in demand
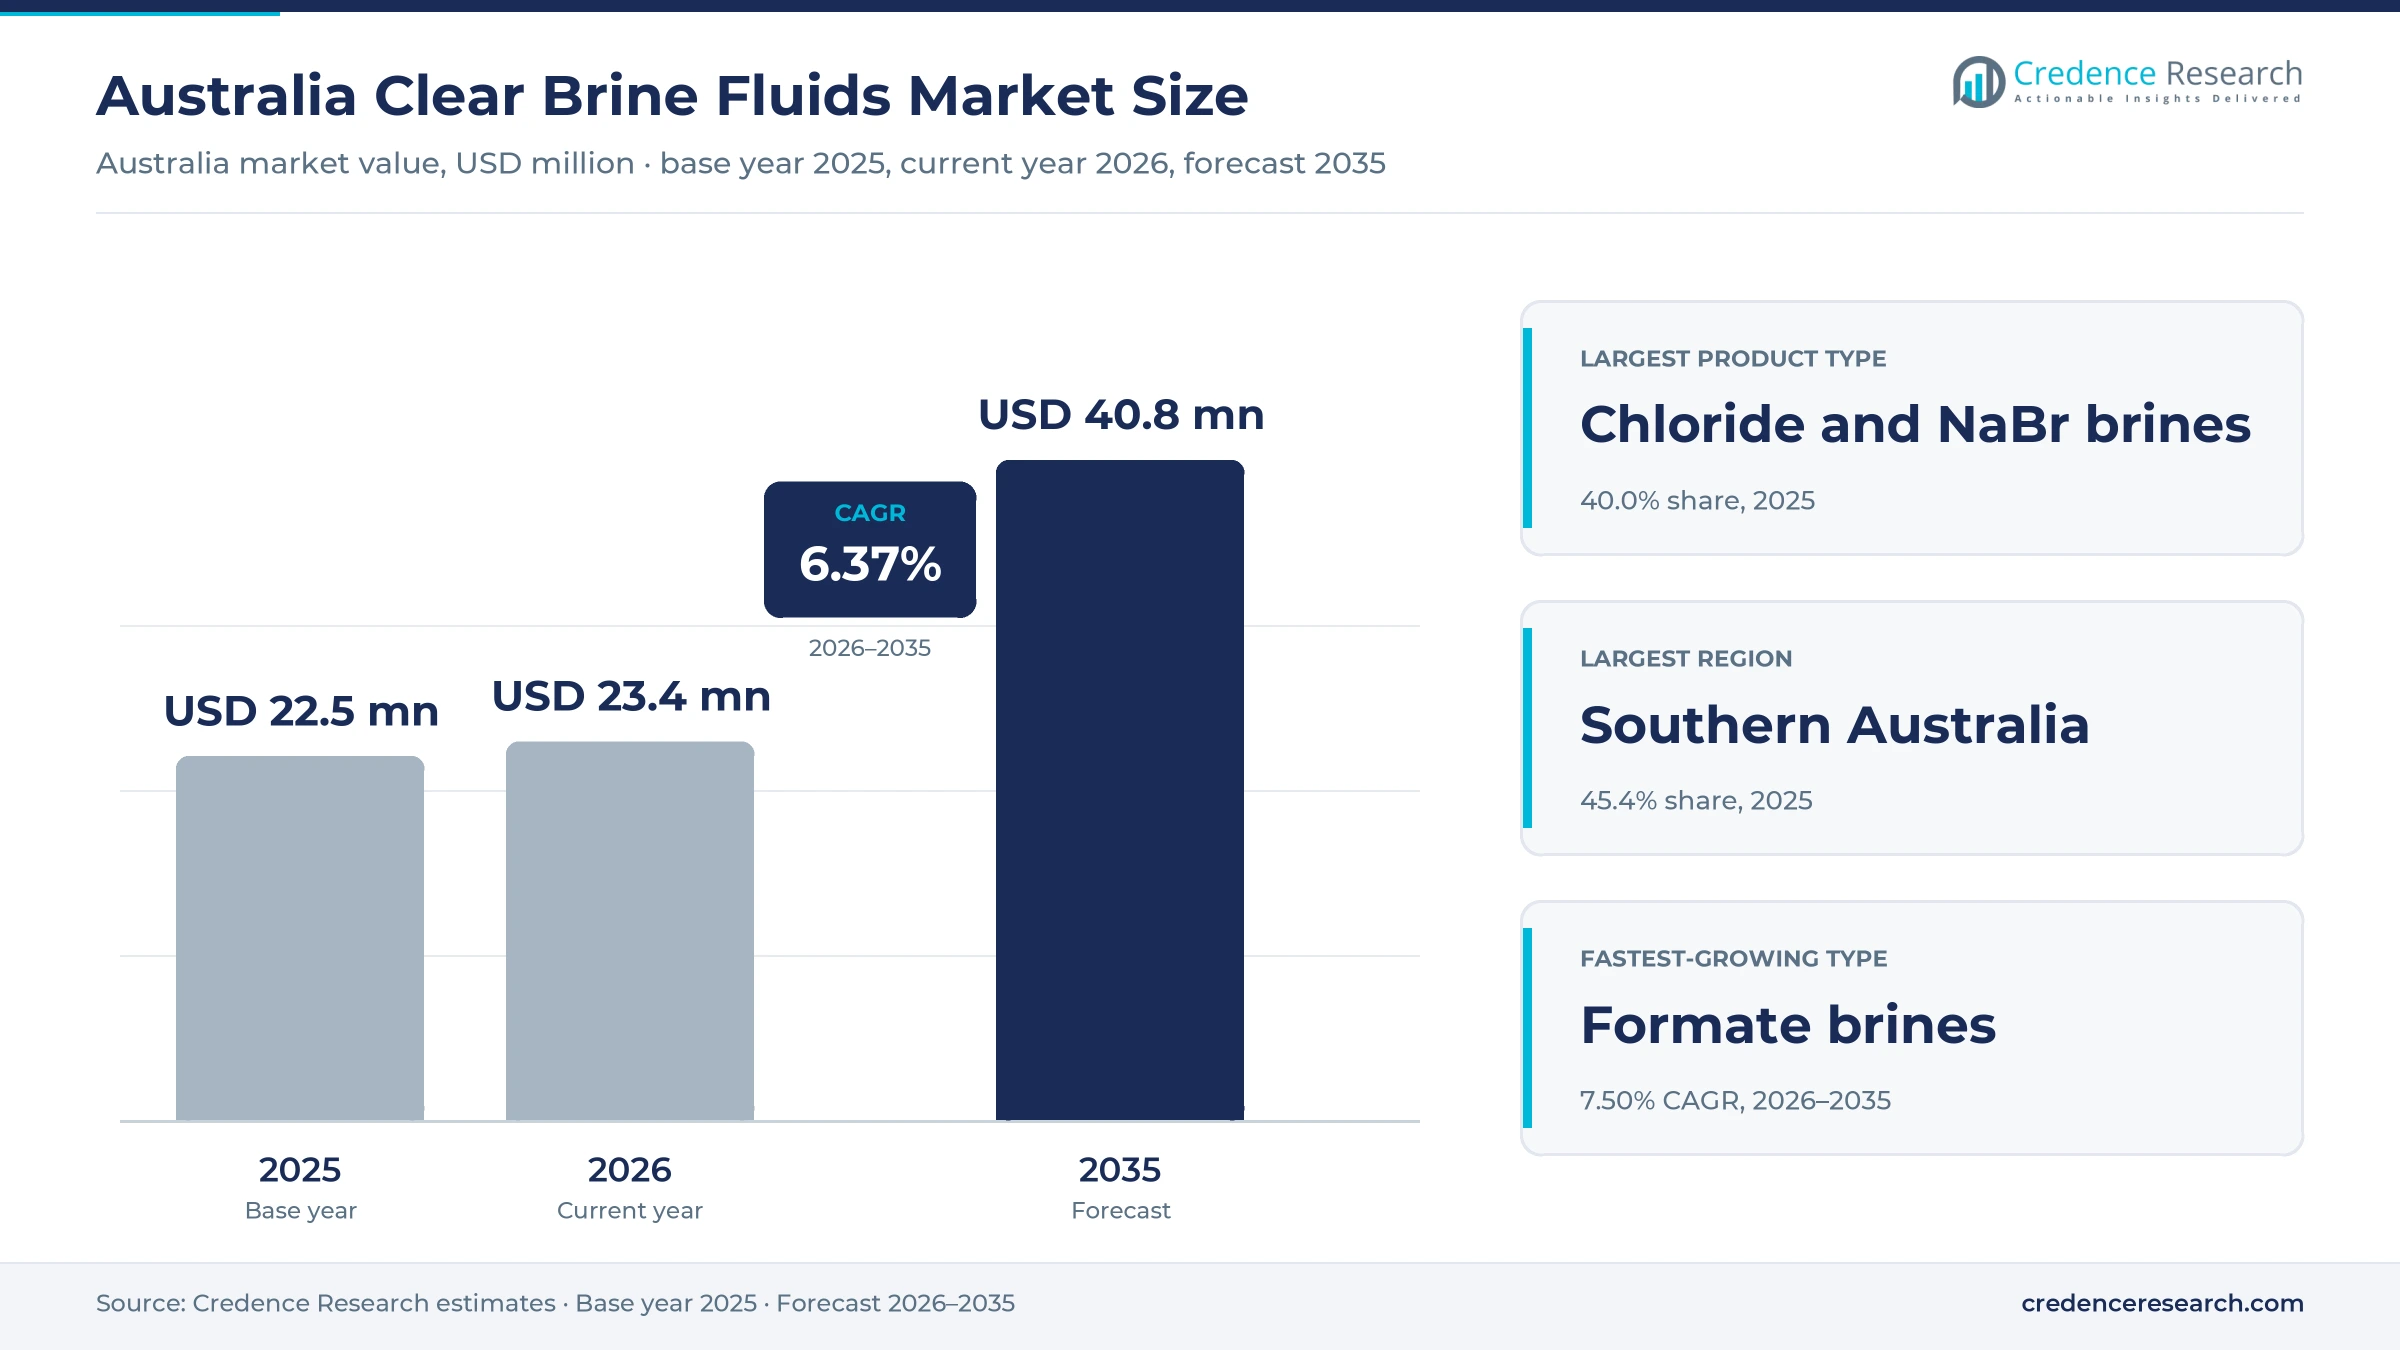
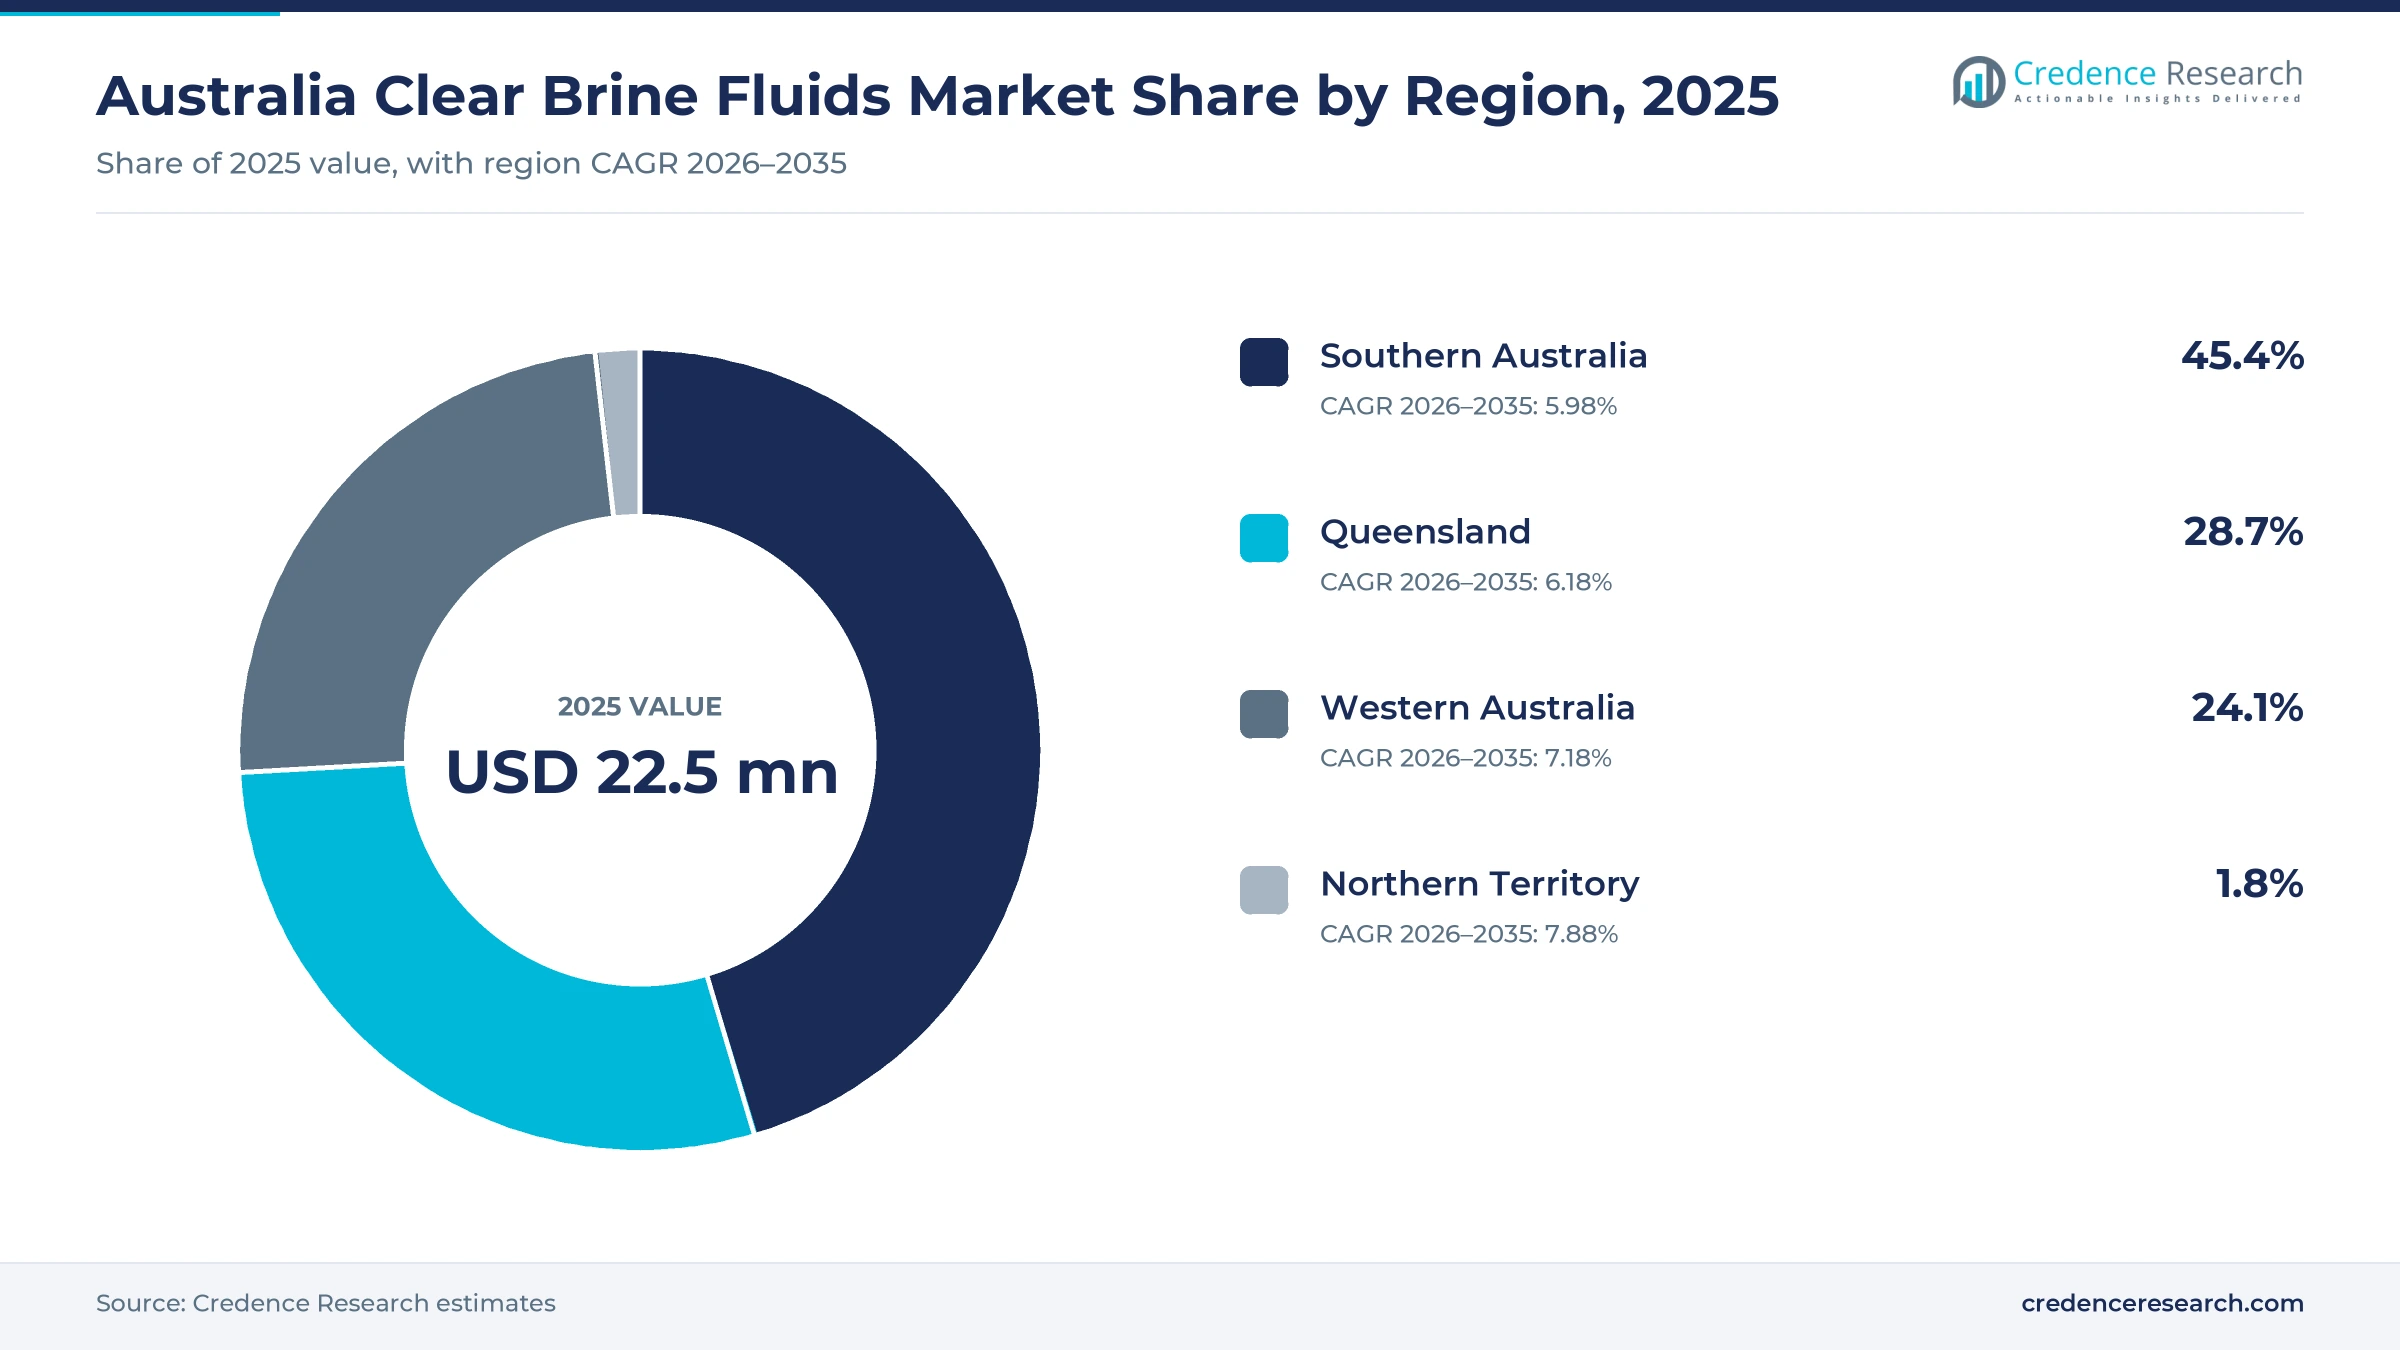
The Australia clear brine fluids market was valued at USD 22.5 million in 2025 and is projected to increase from USD 23.4 million in 2026 to USD 40.8 million by 2035, registering a CAGR of 6.37% during 2026–2035. Demand comes from LNG operators, independent gas producers and coal seam gas companies that use solids-free salt solutions to control well pressure during completion, workover and packer placement. Southern Australia held the largest regional share, 45.4% in 2025, because Bass Strait, Otway and Cooper Basin fields need steady intervention and abandonment work. The Northern Territory is the fastest-growing region at 7.88% a year, as new offshore gas wells feed export plants in Darwin. In turn, operators are moving to higher-density bromide and formate systems for deeper, hotter offshore reservoirs. Woodside also drilled eight Scarborough production wells before first gas in August 2026.
Which completion brines are counted in Australia?
The estimate measures spending in Australia on clear brine fluids, including calcium bromide, zinc-containing bromide, calcium chloride, sodium chloride, sodium bromide and formate brines, together with filtration and blending billed with the fluid. It covers well completion, well workover and packer fluid placement for LNG, conventional and coal seam gas operators. Values are stated in USD million at current prices and exclude goods and services tax.
The estimate excludes water-based and oil-based drilling muds, cementing slurries, stimulation fluids and rig day rates. The value chain runs from overseas bromide and formate producers through service companies, blending plants and supply bases in western, northern and southern Australia to offshore rigs and onshore well sites.
Australia Clear Brine Fluids Market Insights
- The Australia clear brine fluids market was valued at USD 22.5 million in 2025 and is projected to reach USD 40.8 million by 2035, at a 6.37% CAGR during 2026–2035.
- Southern Australia held 45.4% of 2025 value, as Bass Strait, Otway and Cooper Basin fields need regular intervention and abandonment work.
- Chloride and sodium bromide brines led product types with 40.0% of 2025 value, because onshore and shallow wells need lower densities.
- Woodside drilled eight of 13 planned Scarborough production wells before announcing first gas in August 2026, which added offshore completion volumes.
- Formate brines grow fastest at 7.50% a year during 2026–2035, as high-pressure, high-temperature offshore wells need dense and low-corrosion fluids.
Chloride brines lead while formate brines grow fastest
Why do chloride and sodium bromide brines lead?
Based on product type, the market is categorized into calcium bromide brines, zinc-containing bromide brines, chloride and sodium bromide brines, and formate brines. Chloride and sodium bromide brines led with 40.0% of 2025 value, because onshore, coal seam and shallow wells need low-cost, lower-density fluids. Formate brines grow fastest at 7.50% a year, as deep offshore gas wells need dense fluids with low corrosion.
Which applications use the most brine?
Based on application, the market is categorized into well completion, well workover and packer fluid placement. Well completion led with 46.0% of 2025 value, because new offshore wells use large brine volumes while screens and upper completions are installed. Well completion grows fastest at 6.80% a year, as new LNG backfill wells reach completion stage.
Which operators buy the most completion brine?
Based on end user, the market is categorized into integrated LNG operators, independent conventional operators and coal seam gas operators. Integrated LNG operators led with 52.0% of 2025 value, because offshore LNG wells need dense bromide systems in large volumes. Integrated LNG operators grow fastest at 6.85% a year, as new offshore fields replace declining supply.
How do operators source brine systems?
Based on sales channel, the market is categorized into integrated service contracts, direct specialist supply and distributor-led supply. Integrated service contracts led with 58.0% of 2025 value, because operators bundle fluids with completion tools and engineering. Integrated service contracts grow fastest at 6.54% a year, as multi-well campaigns favor one accountable contractor that manages fluid supply, filtration, storage and buyback at offshore supply bases.
| Segment Group | Leading Sub-segment | Share, 2025 | Fastest-growing Sub-segment | CAGR, 2026–2035 |
|---|---|---|---|---|
| By Product Type | Chloride and sodium bromide brines | 40.0% | Formate brines | 7.50% |
| By Application | Well completion | 46.0% | Well completion | 6.80% |
| By End User | Integrated LNG operators | 52.0% | Integrated LNG operators | 6.85% |
| By Sales Channel | Integrated service contracts | 58.0% | Integrated service contracts | 6.54% |
Request a Free Sample
Fill in your details and we'll send you a free sample report.
- Sample data tables & charts
- Research methodology
New LNG wells and producing-field work lift brine use
How do offshore completion campaigns lift heavy brine volumes?
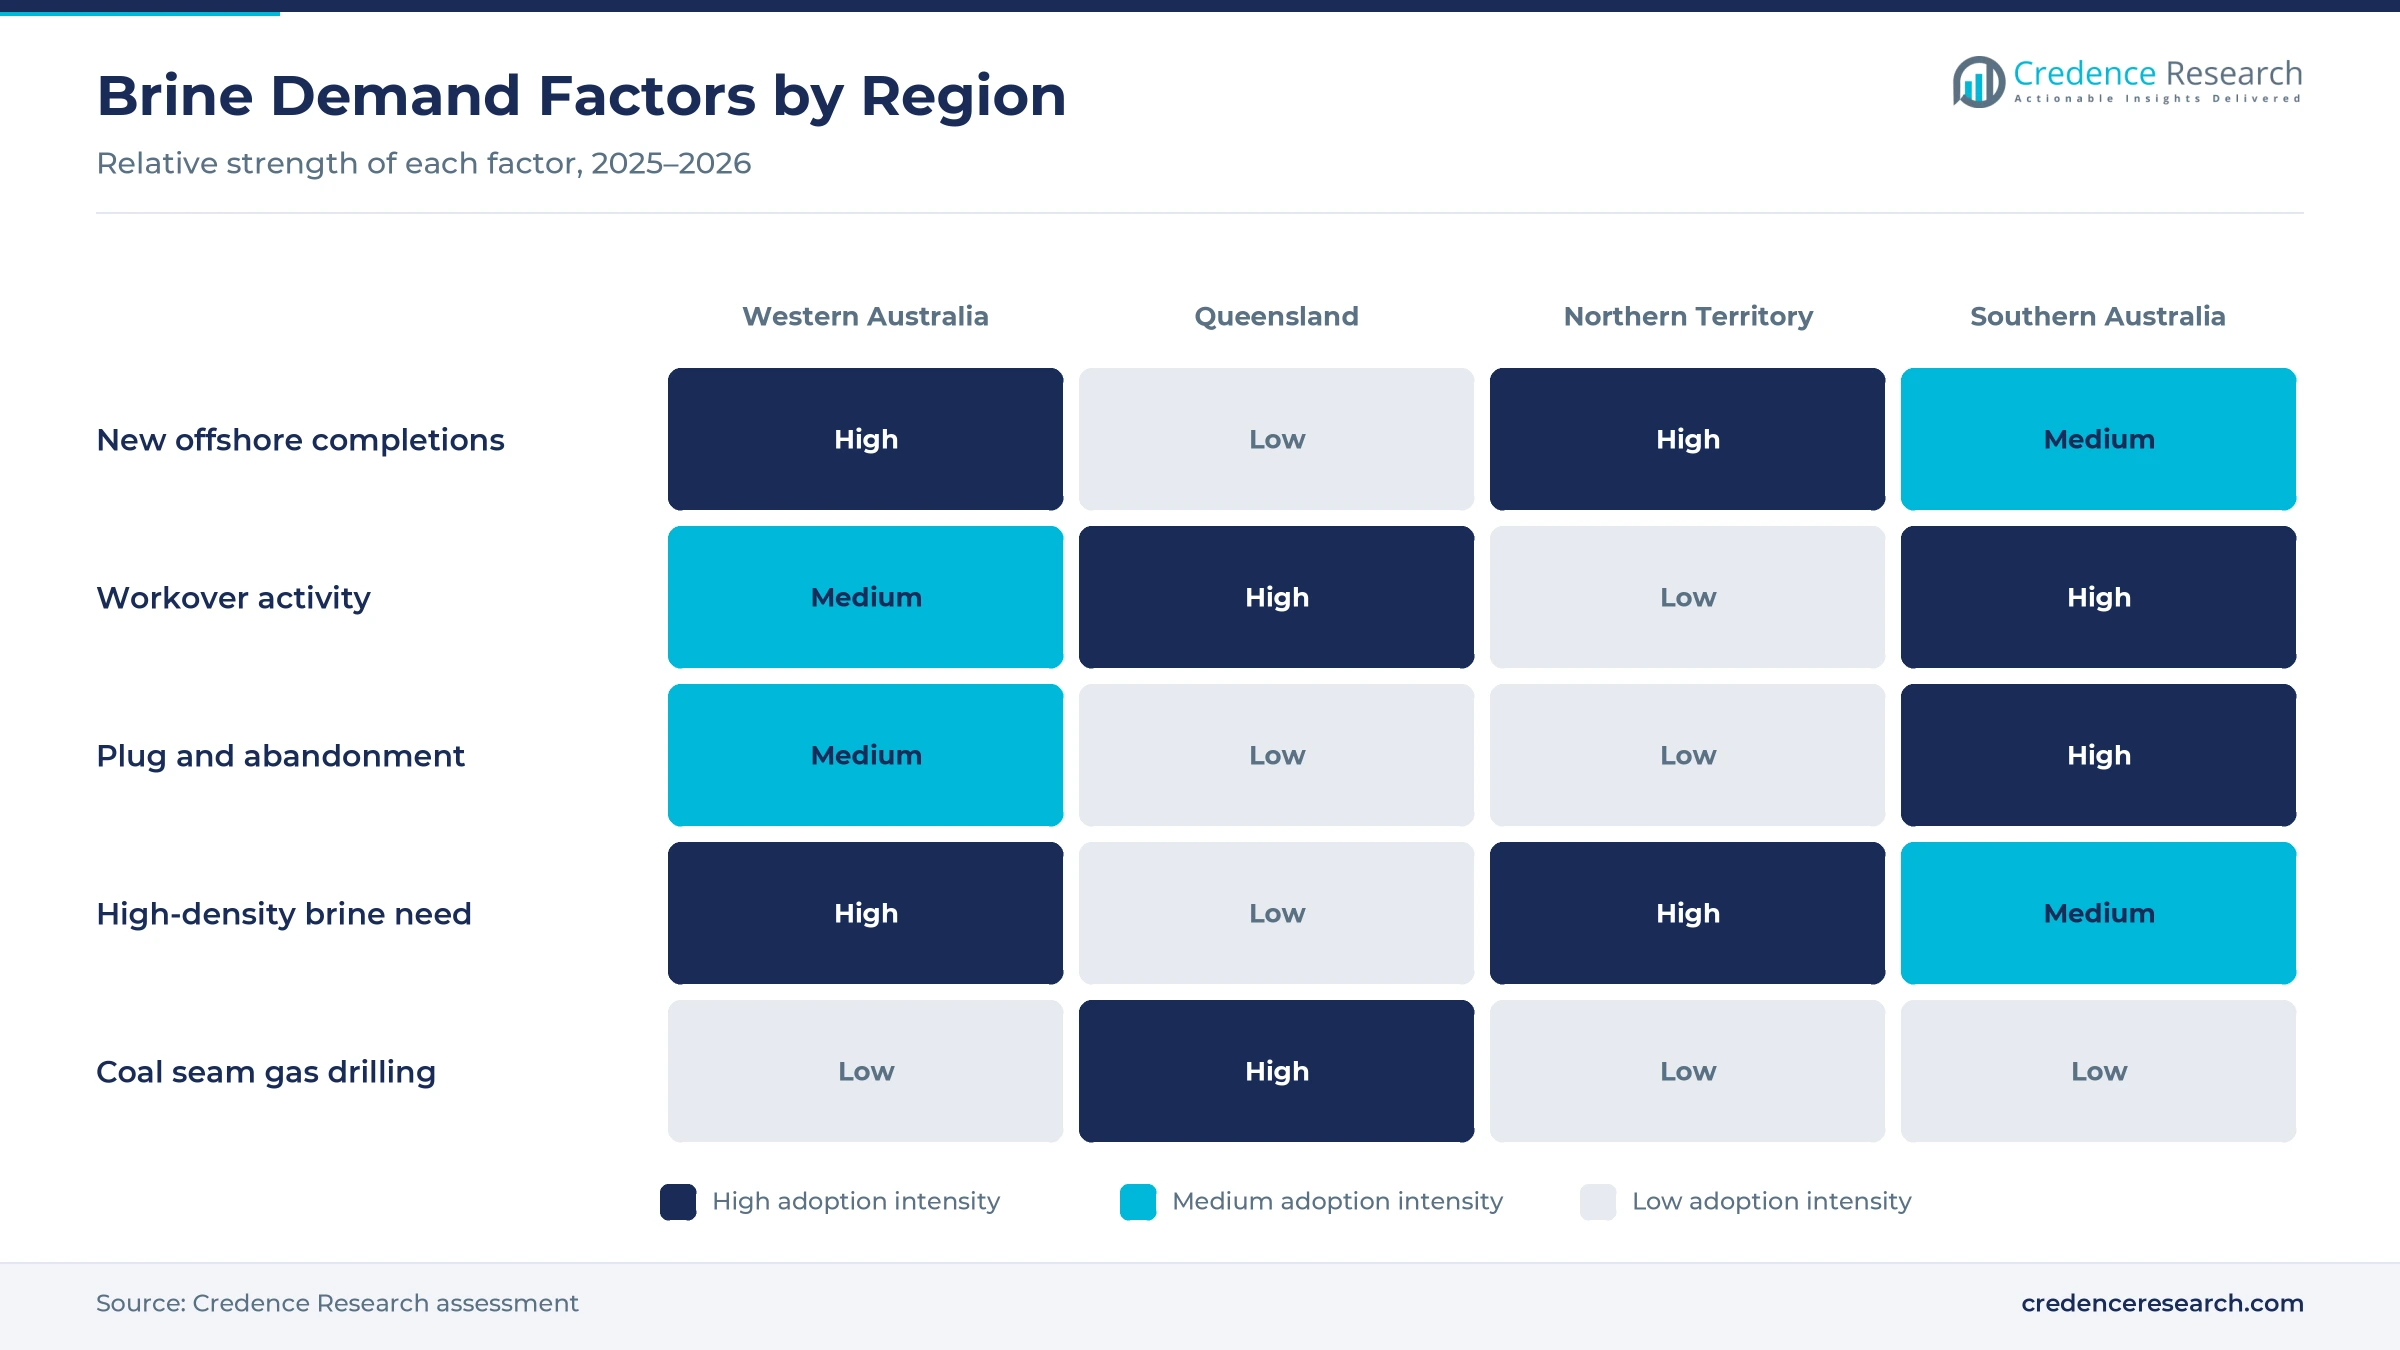
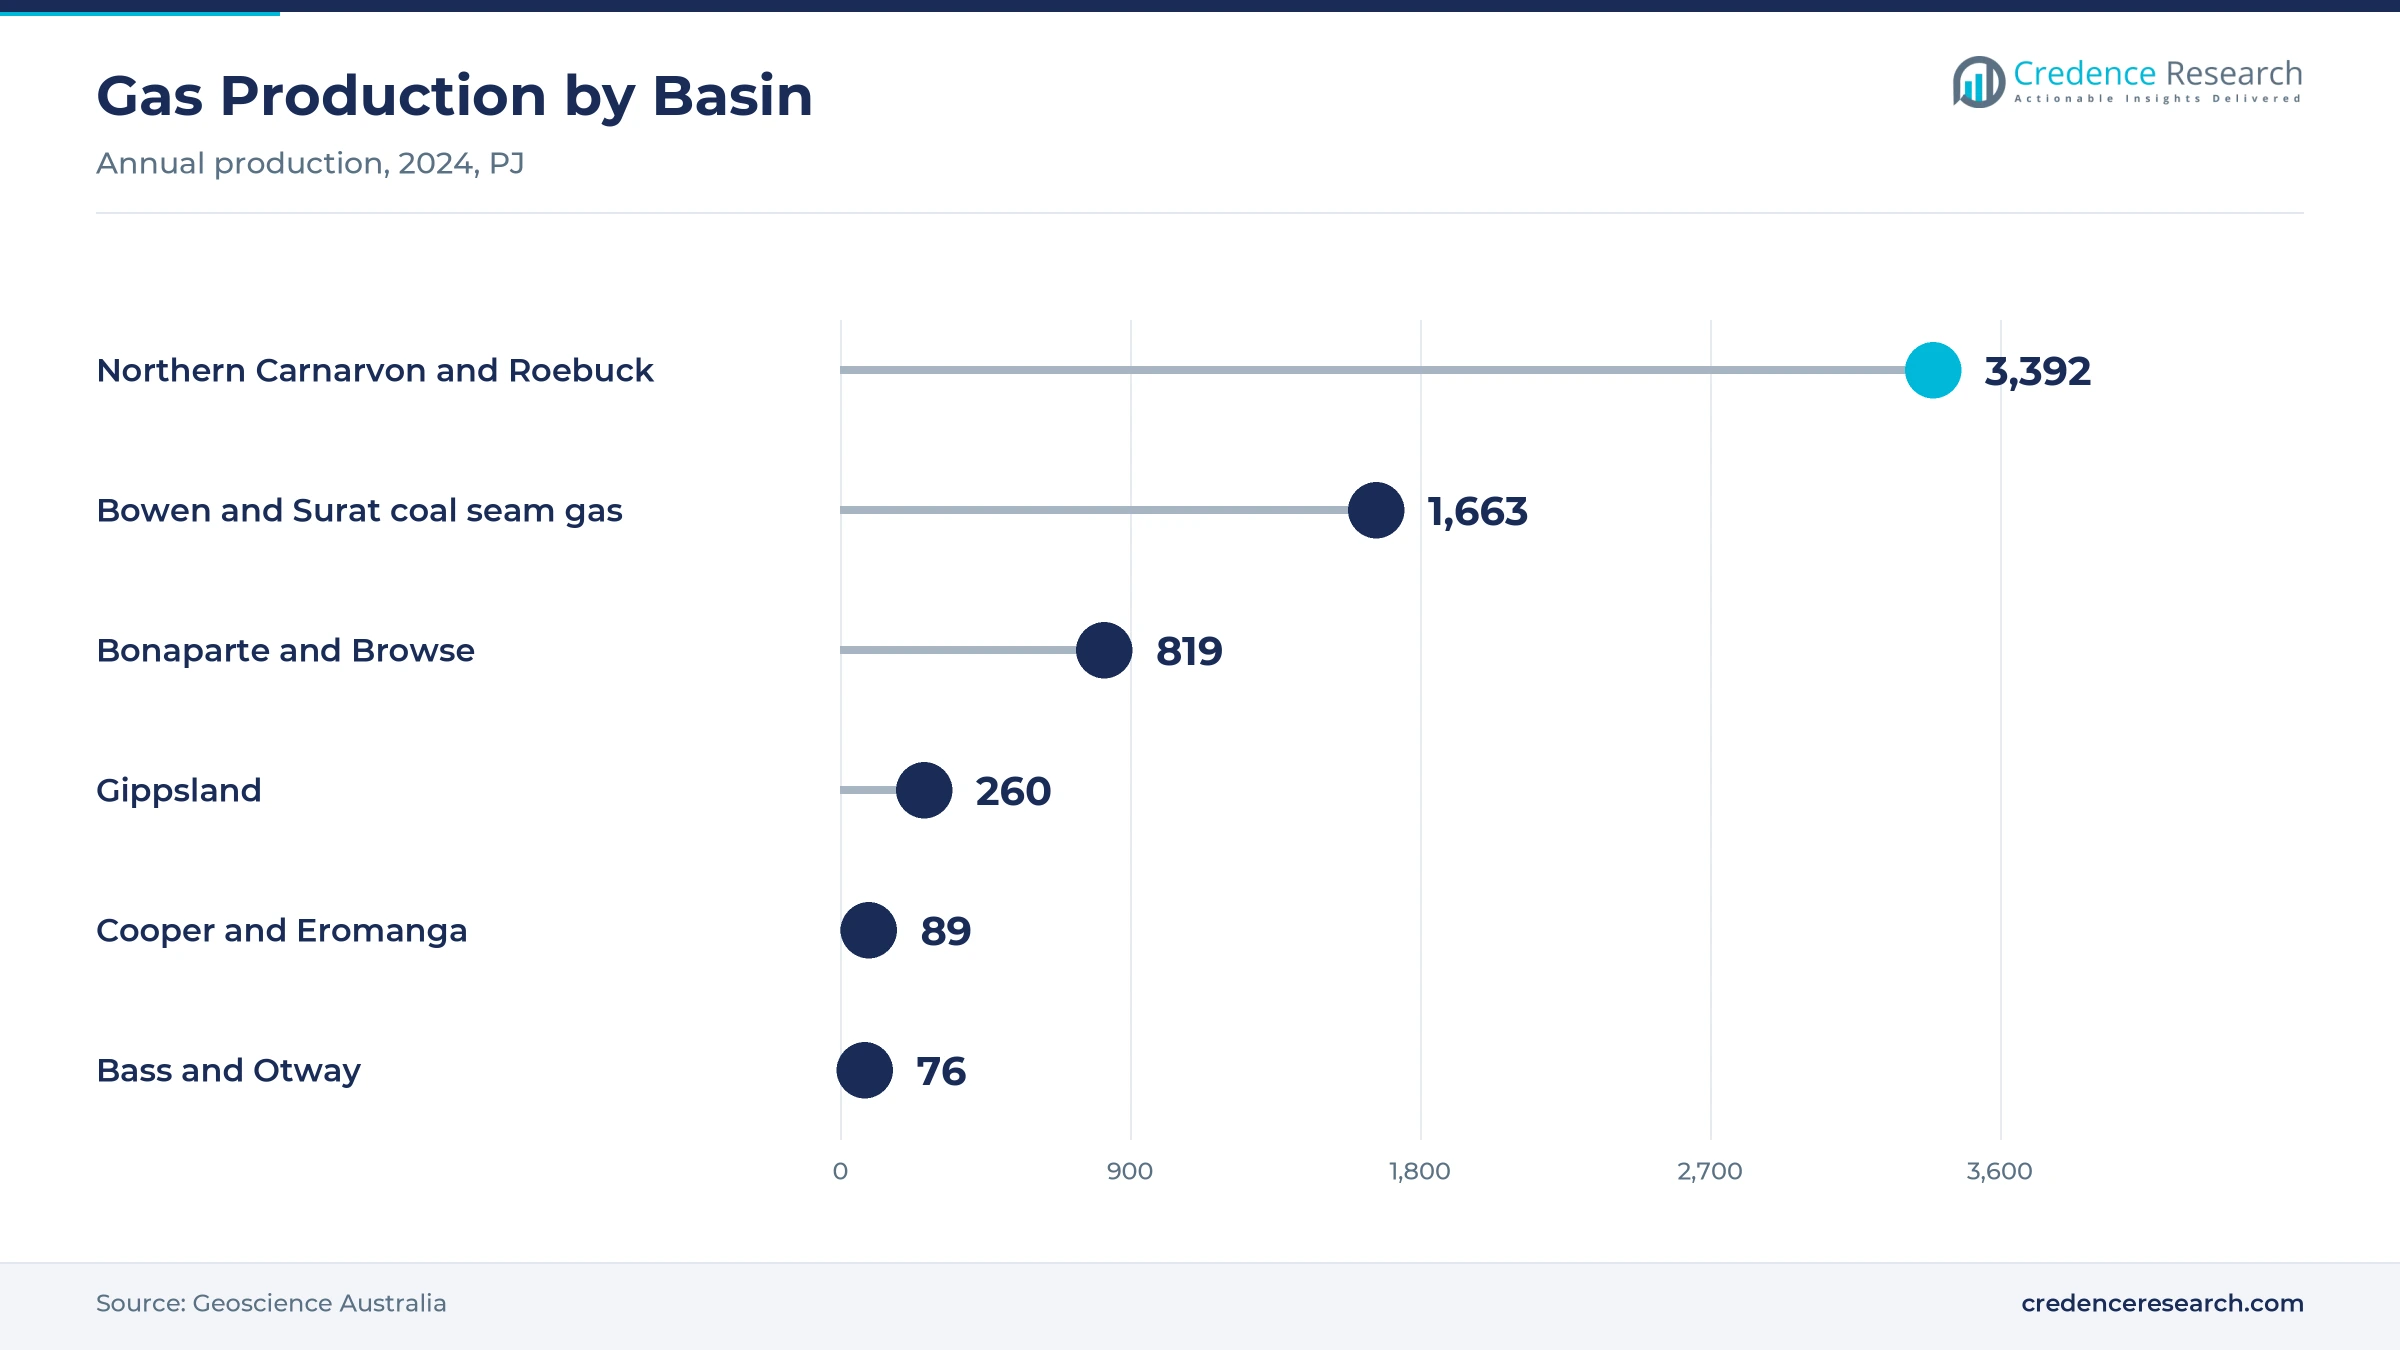
Offshore completion campaigns lift heavy brine volumes, because each subsea gas well needs solids-free fluid to hold pressure while screens and production tubing are installed. Santos completed a six-well Barossa campaign, with average well deliverability of about 300 million standard cubic feet a day. The BW Opal floating production vessel reached ready-for-start-up status on Sept. 16, 2025, which moved those wells into production. Northern Carnarvon and Roebuck basins produced 3,392 PJ of gas in 2024, out of 6,353 PJ nationally, according to Geoscience Australia. As a result, integrated LNG operators lead end users with 52.0% of 2025 value, because they run the largest and deepest completion campaigns in the country.
How do the eight initial Scarborough wells anchor demand?
The eight initial Scarborough wells anchor Western Australian demand, because each deepwater completion needs filtered, dense brine before the well is opened to flow. Woodside drilled eight of 13 planned production wells before announcing first gas in August 2026, according to a ports and shipping report. The field lies about 375 km off the Pilbara coast and links to shore through a 433 km pipeline. The project was 98% complete at first gas, and the first LNG cargo is expected in the fourth quarter of 2026. Consequently, Western Australia grows at 7.18% a year in the Australia clear brine fluids market, with five more wells still to come.
Why do producing-asset intervention needs sustain workover demand?
Producing-asset intervention needs sustain workover demand, because older wells must be cleaned, re-perforated or repaired to keep gas flowing. Santos drilled 104 wells in the Cooper Basin during 2025 and restored production from 91 wells after earlier flood disruptions. Esso still runs six Bass Strait platforms that supply gas to the domestic market, while Gippsland produced 260 PJ of gas in 2024. Each intervention uses brine to kill or balance the well before tools enter the hole. As a result, well workover remains a core application across mature southern fields, while well intervention crews draw brine from southern supply bases for each scheduled intervention campaign.
How does coal seam gas drilling sustain low-cost brine use?
Coal seam gas drilling sustains low-cost brine use, because shallow onshore wells use chloride brines for completions and pump changes. Queensland has drilled more than 12,000 wells since 2010, and the Bowen and Surat basins supply more than 95% of state gas, according to the Queensland government. Exploration spending reached AUD 320 million in 2024, nearly triple the 2016 level. Santos also drilled 21 Fairview development wells in one quarter, which lifted that program to 116 wells. Consequently, chloride and sodium bromide brines lead product types with 40.0% of 2025 value, while Queensland holds 28.7% of regional value as onshore drilling continues across the Surat Basin.
Formates, abandonment work and recycling reshape demand
Why is the shift toward formate brines rising?
The shift toward formate brines is rising, because deep offshore gas wells need dense fluids that do not corrode chrome tubing or damage the reservoir. TETRA Technologies lists halide and formate clear brine fluids within its completion fluids and products division, which serves Asian markets. Barossa wells average about 300 million standard cubic feet a day, which raises the value of low-damage completion fluids. Bonaparte and Browse basins also produced 819 PJ of gas in 2024, mostly from deep offshore fields. As a result, formate brines grow fastest at 7.50% a year in the Australia clear brine fluids market, as operators protect high-rate wells with premium fluids.
How is the rise of plug and abandonment work changing demand?
The rise of plug and abandonment work is changing demand, because each retired well must be balanced with brine before cement plugs are set. Esso Australia has permanently plugged and abandoned more than 200 Bass Strait wells, according to an offshore industry report from July 14, 2025. Thirteen of its 19 Bass Strait platforms are being decommissioned, and some carry up to 37 wells. Plug and abandonment work continues through 2027 with the Valaris 107 jackup and other vessels, before platform removal can begin. Consequently, abandonment campaigns add steady brine volumes to Gippsland supply bases, which keeps southern demand high even as output declines.
Can victorian offshore gas projects open new completion work?
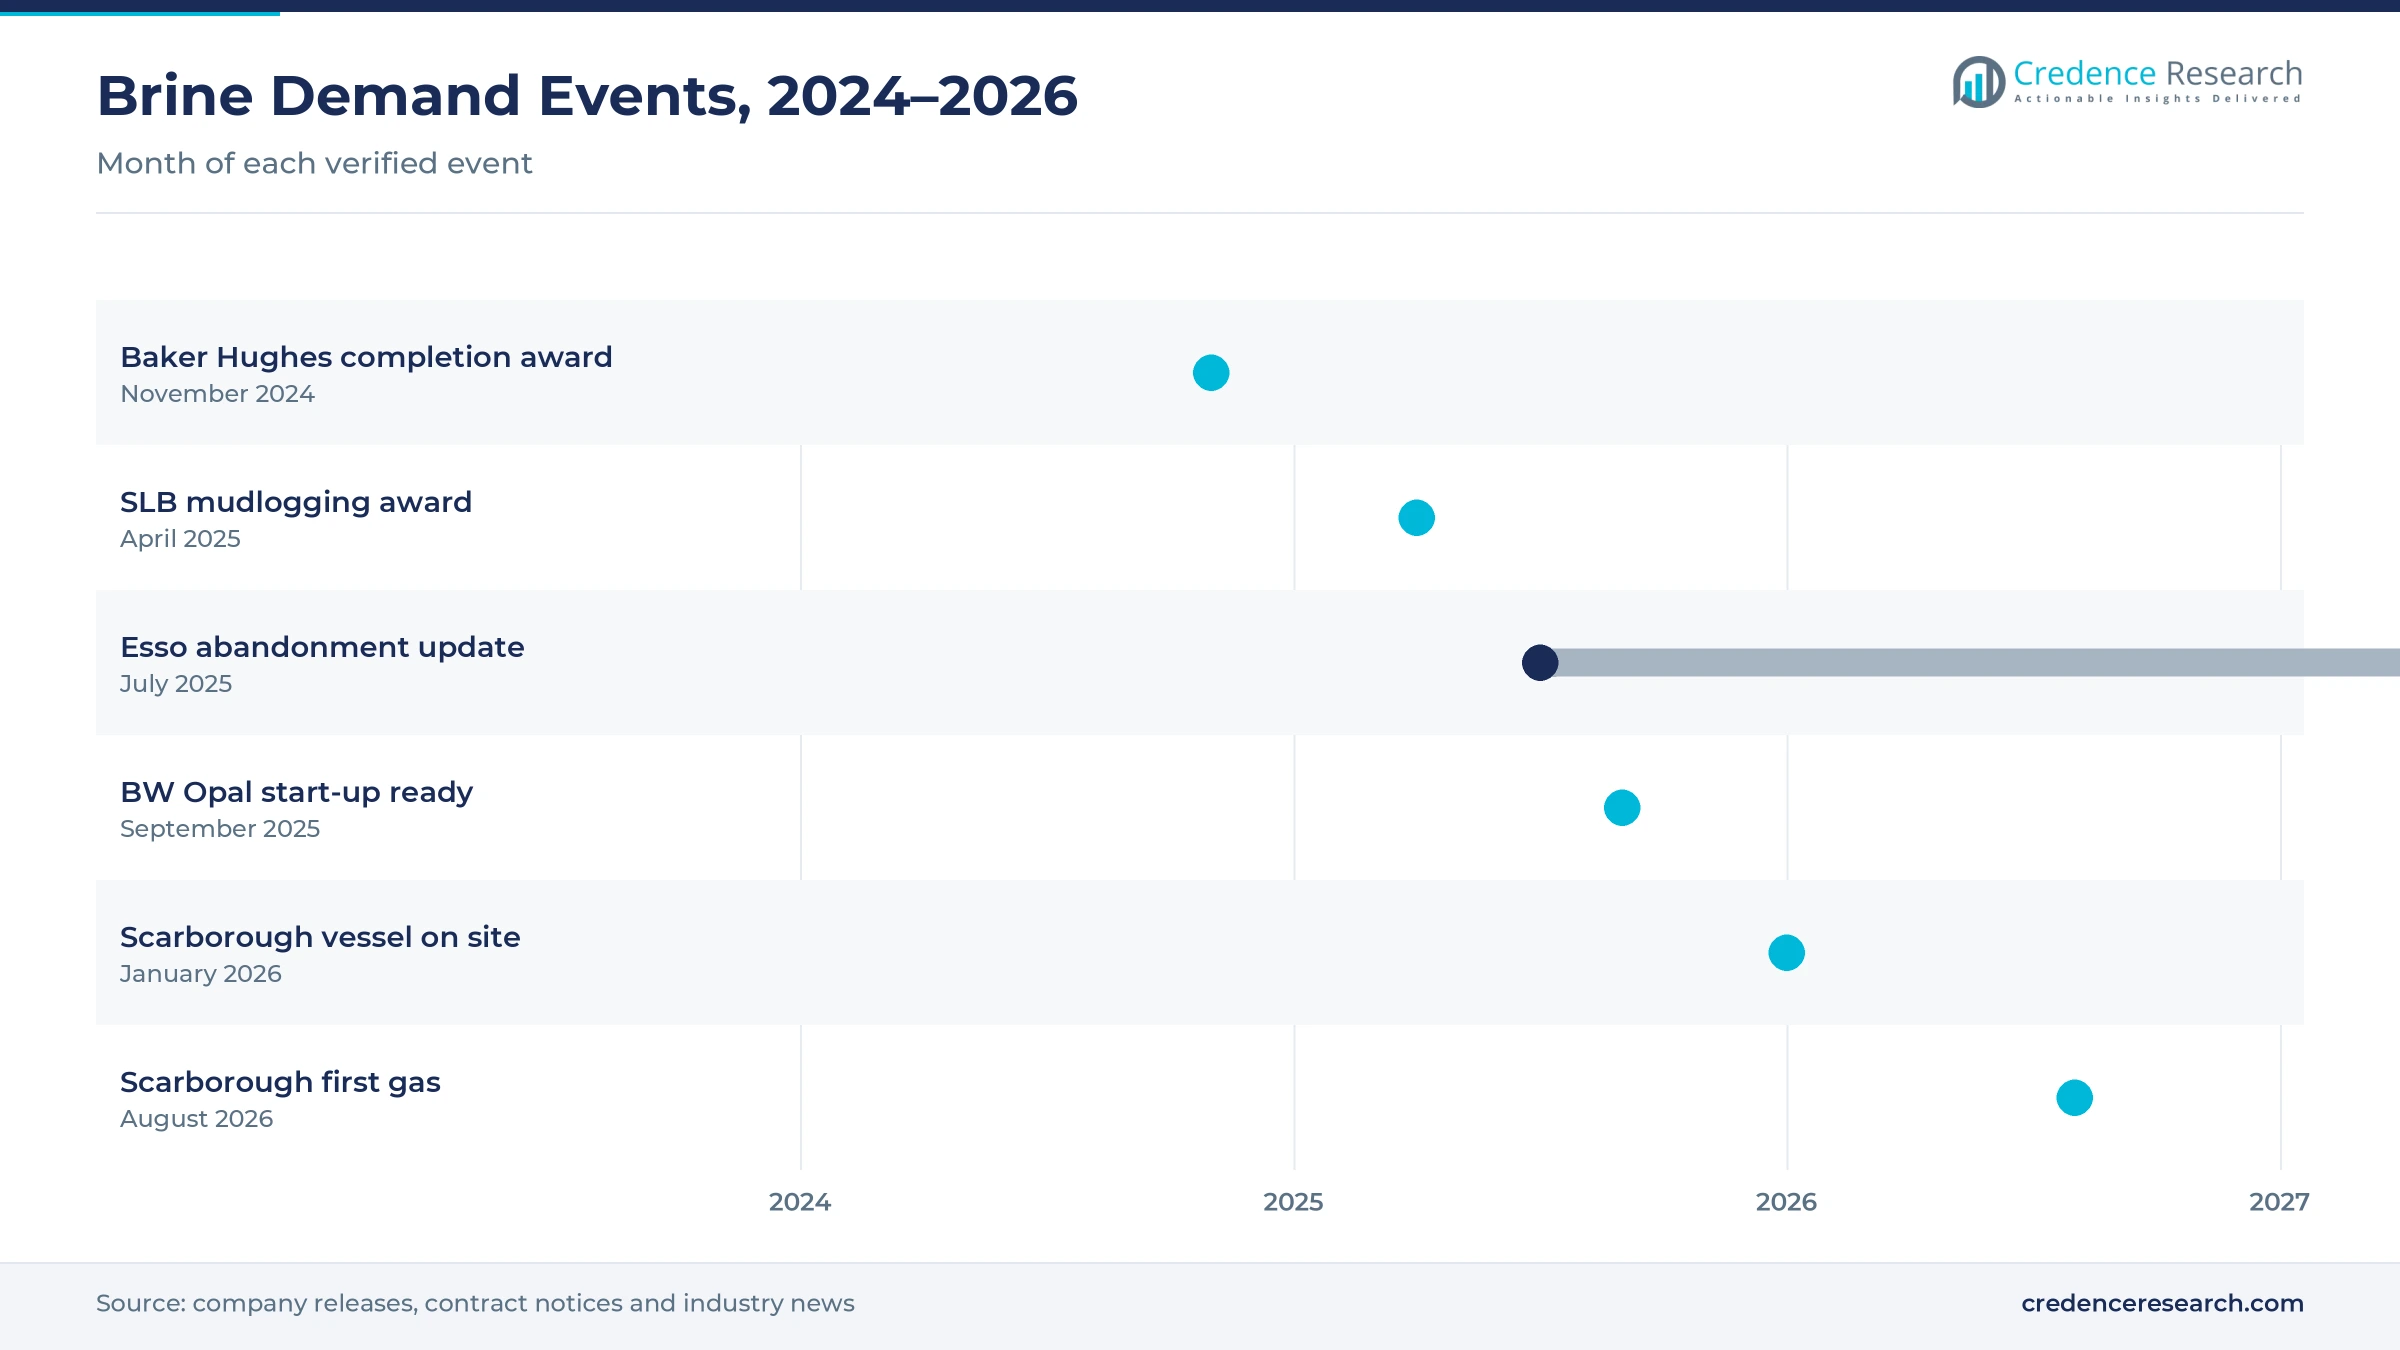
Victorian offshore gas projects open new completion work, because new Otway and Gippsland wells need brine during completion and suspension. Beach Energy awarded Baker Hughes Australia a contract for completion equipment and services on Nov. 20, 2024, for its offshore gas Victoria projects. Beach awarded SLB a mudlogging contract on April 11, 2025, and Archer Well Company a suspension packer contract on June 1, 2025. Otway and Bass basins produced 76 PJ of gas in 2024, which shows room for new supply. Therefore, well completion grows fastest among applications at 6.80% a year, as oilfield services firms mobilize for southern campaigns.
Is there room to grow with brine recovery and reuse?
Brine recovery and reuse offers a clear opening, because operators want to cut fluid costs as export earnings ease. Fuel exports fell to 26.9% of merchandise exports in 2025 from 33.2% in 2024, according to the World Bank. LNG exports still reached 81.2 Mt worth AUD 67.4 billion in 2024, which keeps offshore activity high. About 70% of national gas production was exported in 2024. As a result, service firms can win contracts by filtering, reconditioning and buying back used bromide brines after each well campaign, while corrosion inhibitor packages extend the life of reused fluids and protect tubing in later wells.
Campaign timing, logistics and disposal rules weigh
How does campaign timing create demand swings?
Campaign timing creates demand swings, because offshore drilling programs start and stop around rig availability and project approvals. Large brine volumes are needed for a few months and then fall away. As a result, suppliers must hold costly stock or risk shortages when several campaigns overlap. Long-term framework agreements and shared storage at supply bases help smooth these swings for operators and service companies.
Why do import and logistics costs weigh on margins?
Import and logistics costs weigh on margins, because bromide and formate salts are produced overseas and shipped to Perth, Darwin or Gippsland bases. Freight delays and currency moves can raise landed costs quickly. Consequently, operators face higher fluid bills on remote campaigns far from blending plants. Suppliers reduce this risk with local blending, buyback programs and early ordering for planned well campaigns.
How do disposal rules limit zinc brine use?
Disposal rules limit zinc brine use, because zinc bromide is toxic to marine life and must be handled carefully offshore. Operators need approved environment plans that cover fluid losses, returns and spills. In turn, some operators avoid zinc systems unless well pressure leaves no other option. Suppliers respond with formate and calcium bromide blends that reach high densities with lower environmental risk.
Will slower exploration cut long-term volumes?
Slower exploration can cut long-term volumes, because fewer discoveries mean fewer wells to complete after current projects finish. Approval delays and investor pressure on fossil fuels can push back new offshore fields. As a result, brine suppliers depend more on workover and abandonment work than on new wells. Firms that offer recovery, filtration and abandonment services keep steadier revenue through these cycles.
Southern basins lead while northern fields grow fastest
| Region | Value, 2025 (USD million) | Share, 2025 | CAGR, 2026–2035 |
|---|---|---|---|
| Southern Australia | 10.2 | 45.4% | 5.98% |
| Queensland | 6.5 | 28.7% | 6.18% |
| Western Australia | 5.4 | 24.1% | 7.18% |
| Northern Territory | 0.4 | 1.8% | 7.88% |
Why does Southern Australia lead brine demand?
Southern Australia held 45.4% of 2025 value and grows at 5.98% a year. The region covers Bass Strait, Otway and Cooper Basin fields, where Gippsland produced 260 PJ and Cooper and Eromanga 89 PJ of gas in 2024, which keeps intervention demand spread across many mature fields. Esso has plugged more than 200 Bass Strait wells, and Santos drilled 104 Cooper wells in 2025. As a result, workover, abandonment and onshore completions keep the largest share of brine spending here.
How does Queensland coal seam gas shape demand?
Queensland held 28.7% of 2025 value and grows at 6.18% a year, because coal seam gas wells in the Bowen and Surat basins need regular completions and pump changes. Bowen and Surat coal seam gas reached 1,663 PJ in 2024, the second-largest basin output in the country. In turn, the state buys mostly chloride brines through onshore service contracts and distributors, with fluid volumes tied to the pace of new well drilling and pump replacement.
Why does Western Australia gain from new offshore wells?
Western Australia held 24.1% of 2025 value and grows at 7.18% a year. The Northern Carnarvon and Roebuck basins produced 3,392 PJ of gas in 2024, and Scarborough added eight production wells before first gas in August 2026. Consequently, dense bromide and formate brines for deepwater completions lift state demand, supported by digital oilfield tools that track fluid use, density and losses across offshore campaigns.
Why is the Northern Territory the fastest-growing region?
The Northern Territory held 1.8% of 2025 value and grows fastest at 7.88% a year. Barossa started production after the BW Opal vessel reached ready-for-start-up status on Sept. 16, 2025. Bonaparte and Browse basins produced 819 PJ of gas in 2024. As a result, future backfill and intervention work adds brine demand from a small base.
Gas startups and service awards from 2024 to 2026
| Development | Status and market relevance |
|---|---|
| In November 2024, Beach Energy announced it had awarded Baker Hughes Australia a contract for completion equipment and services on its offshore gas Victoria projects. | Adds southern completion work |
| In April 2025, Beach Energy announced it had awarded Schlumberger Australia a mudlogging contract for the same offshore gas Victoria program. | Supports Otway drilling activity |
| In July 2025, Esso Australia reported more than 200 Bass Strait wells permanently plugged and abandoned, with work continuing through 2027. | Sustains abandonment brine demand |
| In September 2025, Santos announced that the BW Opal vessel for the Barossa gas field reached ready-for-start-up status after a six-well campaign. | Opened a new northern production hub |
| In August 2026, Woodside announced first gas at Scarborough after drilling eight of 13 planned production wells. | First LNG cargo expected in late 2026 |
Filtration, compatibility and recovery shape brine use
- Standard filtered systems pass brine through cartridge and diatomaceous earth filters, which removes solids that could plug screens and perforations.
- Enhanced compatibility systems add corrosion inhibitors, oxygen scavengers and clay control, which protects chrome tubing and sensitive sandstones.
- Closed-loop recovery systems collect returned brine for filtering and density adjustment, which lets operators reuse costly bromide fluids on the next well.
- Formate brine blends reach high densities without heavy halides, which lowers corrosion and environmental risk in deep offshore wells.
Need a Custom Version of This Report?
Tailor the scope, geography, or segments to your exact requirements.
- Custom geography or segment scope
- Direct access to our analyst team
Service majors compete on bundled well contracts
Competition centers on large well service companies that bundle fluids with completion tools, engineering and offshore logistics. Halliburton won drilling and completion services work for the INPEX Ichthys field in January 2020, including drilling and completion fluids for a three-year offshore campaign. Baker Hughes Australia won a completion equipment and services contract from Beach Energy on Nov. 20, 2024. SLB holds a mudlogging contract on the same offshore gas Victoria program. TETRA Technologies offers halide and formate clear brine fluids and runs water and flowback services in Australian basins. Suppliers compete on fluid density range, filtration quality, buyback terms, stock at supply bases and safety records. As a result, operators often choose one contractor per campaign, which favors firms with blending plants near offshore supply bases.
Companies profiled and their roles in this market
| Company | Type | Role in the market |
|---|---|---|
| Halliburton | Integrated service company | INPEX Ichthys drilling and completion fluids work |
| Baker Hughes | Integrated service company | Completion equipment and services for offshore gas Victoria |
| SLB | Integrated service company | Mudlogging contract for offshore gas Victoria |
| TETRA Technologies | Completion fluid specialist | Halide and formate brines; Australian flowback services |
Credence Research view on completion brines
Credence Research's view is that Australian completion brine demand will grow steadily through 2035, as new offshore LNG wells and producing-field work keep fluid volumes rising. Chloride and sodium bromide brines should keep the largest share, while formate brines gain most from deep, high-rate wells. Integrated LNG operators will remain the main buyers, and Southern Australia keeps the largest regional share. However, campaign timing and import costs will reward suppliers that hold local stock and offer brine buyback.
How the completion brine estimate was built
The report uses 2025 as the base year, with values in USD million at current prices. Market values come from the Credence Research model, which combines well completion and workover counts, fluid volumes per well and price tiers per billed barrel. Regional shares follow the client region split, and segment splits by product type, application, end user and sales channel are Credence Research estimates. Sources used are official statistics, government data, company contract notices and industry news, and no interviews or surveys were used.
LNG backfill and well work shape brine demand to 2035
The market is expected to reach USD 40.8 million by 2035, a 6.37% CAGR during 2026–2035, as LNG backfill wells, workovers and abandonment campaigns keep brine volumes rising. Growth should be strongest in formate brines, well completion and the Northern Territory, while Southern Australia keeps the largest share. Scarborough and Barossa will add backfill, intervention and completion work after 2026. In contrast, delayed approvals or weaker LNG prices could slow new offshore campaigns and shift demand toward cheaper workover fluids.
Frequently Asked Questions
How big is the Australia clear brine fluids market?
Which region leads brine demand?
Which region grows fastest?
Which product type holds the largest share?
How many Scarborough wells were drilled before first gas?
Which product type grows fastest?
Who are the leading companies in this market?
What are the main risks to growth?
Table of Content
Chapter 1 Market Segmentation
- 1.1 Segmentation Framework
- 1.1.1 Product and Service Classification
- 1.1.2 Application and End-Use Classification
- 1.1.3 Technology and Solution Classification
- 1.1.4 Customer and Distribution Channel Classification
- 1.1.5 Geographic Segmentation
- 1.1.6 Market Segment Definitions and Boundaries
- 1.2 By Product Type
- 1.2.1 Calcium bromide brines
- 1.2.2 Zinc-containing bromide brines
- 1.2.3 Chloride and sodium bromide brines
- 1.2.4 Formate brines
- 1.3 By Application
- 1.3.1 Well completion
- 1.3.2 Well workover
- 1.3.3 Packer fluid placement
- 1.4 By End User
- 1.4.1 Integrated LNG operators
- 1.4.2 Independent conventional operators
- 1.4.3 Coal seam gas operators
- 1.5 By Sales Channel
- 1.5.1 Integrated service contracts
- 1.5.2 Direct specialist supply
- 1.5.3 Distributor-led supply
Chapter 2 Introduction
- 2.1 Report Objectives and Scope
- 2.2 Product Definition and Industry Terminology
- 2.3 Market Inclusions and Exclusions
- 2.4 Research Process
- 2.4.1 Primary Research and Expert Interviews
- 2.4.2 Secondary Research and Source Review
- 2.4.3 Top-Down and Bottom-Up Estimation
- 2.4.4 Data Triangulation and Verification
- 2.5 Market Size Measurement Basis
- 2.5.1 2025: USD 22.5 million → 2035: USD 40.8 million
- 2.6 Historical and Forecast Reference Periods
- 2.6.1 Historical Period: 2018-2025
- 2.6.2 Base Year: 2025
- 2.6.3 Forecast Period: 2025-2035
- 2.7 Research Assumptions and Limitations
Chapter 3 Executive Summary
- 3.1 Market Snapshot and Key Findings
- 3.2 Base-Year Market Size, 2025
- 3.3 Forecast Market Size, 2035
- 3.4 Revenue and Volume Growth Outlook
- 3.5 Key Demand and Supply Indicators
- 3.6 Leading Market Segments
- 3.7 Fastest-Growing Market Opportunities
- 3.8 Regional Performance Highlights
- 3.9 Technology and Industry Transformation
- 3.10 Competitive Landscape Summary
- 3.11 Analyst View and Strategic Implications
Chapter 4 Australia Clear Brine Fluids Market Trends and Developments
- 4.1 Historical Industry Development, 2018-2025
- 4.2 Recent Market Trends and Developments
- 4.3 Demand and Customer Behavior Trends
- 4.4 Technology and Product Innovation
- 4.5 Artificial Intelligence, Automation and Digitalization
- 4.6 Local Manufacturing and Supply Chain Realignment
- 4.7 Industry Partnerships, Mergers and Acquisitions
- 4.8 Sustainability and Circular Economy Developments
- 4.9 Government and Private Sector Investment Trends
- 4.10 Emerging Business Models and Commercialization
- 4.11 Industry Developments and Announcements
Chapter 5 Australia Clear Brine Fluids Market Production, Supply and Demand Analysis
- 5.1 Demand Trend and Consumption Analysis, 2018-2025
- 5.2 Demand Forecast, 2025-2035
- 5.3 Production and Output Trend, 2018-2025
- 5.4 Production and Output Forecast, 2025-2035
- 5.5 Installed Capacity and Capacity Utilization
- 5.6 Company-Wise Production Plants and Statistics
- 5.6.1 Installed Production Capacity
- 5.6.2 Actual Production
- 5.6.3 Planned Capacity and Expansion Targets
- 5.7 Supply Chain Structure and Procurement Trends
- 5.8 Supply-Demand Gap and Bottlenecks
- 5.9 Import Dependence and Sourcing Structure
- 5.10 Contract Manufacturing and Outsourcing
- 5.11 Regional Supply and Demand Concentration
Chapter 6 Australia Clear Brine Fluids Market Pricing Analysis
- 6.1 Pricing Structure and Measurement
- 6.2 Historical Pricing Trends, 2018-2025
- 6.3 Pricing Outlook, 2025-2035
- 6.4 Average Selling Price and Unit Economics
- 6.5 Pricing by Product and Market Segment
- 6.6 Geographic Pricing Differences
- 6.7 Key Input, Energy, Labor and Logistics Costs
- 6.8 Contract Pricing and Purchasing Models
- 6.9 Pricing Sensitivity and Competitive Positioning
- 6.10 Price, Margin and Profitability Implications
Chapter 7 Australia Clear Brine Fluids Market Dynamics
- 7.1 Market Growth Drivers
- 7.1.1 Demand-Side Drivers
- 7.1.2 Technology and Innovation Drivers
- 7.1.3 Infrastructure and Investment Drivers
- 7.1.4 Regulatory and Policy Drivers
- 7.2 Market Restraints
- 7.2.1 Cost and Affordability Constraints
- 7.2.2 Technology and Adoption Barriers
- 7.2.3 Supply Chain and Operational Constraints
- 7.3 Market Challenges
- 7.3.1 Competitive Pressure and Margin Erosion
- 7.3.2 Skills, Infrastructure and Implementation Gaps
- 7.4 Emerging Market Opportunities
- 7.5 Market Dynamics Impact and Time-Horizon Assessment
Chapter 8 Australia Clear Brine Fluids Value Chain Analysis
- 8.1 Industry Value Chain Overview
- 8.2 Upstream Suppliers and Critical Inputs
- 8.3 Technology and Component Providers
- 8.4 Manufacturing or Service Delivery
- 8.5 Distribution, Channel Partners and Integrators
- 8.6 Downstream Applications and End Users
- 8.7 Value Addition and Profit Pools
- 8.8 Vertical Integration and Outsourcing
- 8.9 Supplier Concentration and Risk
- 8.10 Supply Chain Localization and Resilience
Chapter 9 Australia Clear Brine Fluids Market Regulations and Policies
- 9.1 Relevant Laws, Standards and Compliance Frameworks
- 9.2 Product, Service, Safety and Quality Requirements
- 9.3 Government Policies, Incentives and Subsidies
- 9.4 Imports, Exports and Trade Barriers
- 9.5 Public Procurement and Local Content Requirements
- 9.6 Environmental and Sustainability Compliance
- 9.7 Upcoming Policy Changes and Market Implications
Chapter 10 Australia Clear Brine Fluids Market Hotspots and Opportunities
- 10.1 Market Opportunity Mapping and Growth Hotspots
- 10.2 High-Growth Applications and Customer Groups
- 10.3 Underserved Markets and White-Space Opportunities
- 10.4 Emerging Technology and Product Opportunities
- 10.5 New Capacity and Investment Hotspots
- 10.6 Market Entry and Expansion Opportunities
- 10.7 Distribution and Partnership Opportunities
- 10.8 Near-Term and Long-Term Commercial Potential
- 10.9 Opportunity Attractiveness and Execution Risks
Chapter 11 Australia Clear Brine Fluids Market Outlook, 2025-2035
- 11.1 Market Size and Analysis
- 11.1.1 Revenue (Market Measurement: 2025: USD 22.5 million → 2035: USD 40.8 million)
- 11.1.2 Market Volume and Quantity Sold
- 11.1.3 Historical Market Size, 2018-2025
- 11.1.4 Base-Year Market Size, 2025
- 11.2 Market Forecast, 2025-2035
- 11.2.1 Revenue Forecast to 2035
- 11.2.2 Volume Forecast to 2035
- 11.2.3 CAGR and Year-on-Year Growth
- 11.2.4 Incremental Revenue Opportunity
- 11.3 Forecast Assumptions and Scenario Analysis
- 11.3.1 Base-Case Forecast
- 11.3.2 Optimistic and Conservative Scenarios
- 11.3.3 Technology, Pricing and Policy Sensitivities
- 11.4 Market Attractiveness and Growth Outlook
Chapter 12 Australia Clear Brine Fluids Market Segmentation and Outlook
- 12.1 Segmentation Summary and Market Shares, 2025
- 12.2 Largest and Fastest-Growing Segments
- 12.3 By Product Type - Market Size and Forecast, 2025-2035
- 12.3.1 Segment Definition and Scope
- 12.3.2 Historical Market Size, 2018-2025
- 12.3.3 Revenue Forecast, 2025-2035
- 12.3.4 Volume Forecast, 2025-2035
- 12.3.5 Base-Year Market Share, 2025
- 12.3.6 Segment CAGR and Growth Drivers
- 12.3.7 Subsegment Market Size and Forecast
- 12.3.7.1 Calcium bromide brines
- 12.3.7.2 Zinc-containing bromide brines
- 12.3.7.3 Chloride and sodium bromide brines
- 12.3.7.4 Formate brines
- 12.3.8 Subsegment Pricing and Adoption Trends
- 12.3.9 Leading Suppliers and Competition
- 12.3.10 Regional Demand and Opportunities
- 12.4 By Application - Market Size and Forecast, 2025-2035
- 12.4.1 Segment Definition and Scope
- 12.4.2 Historical Market Size, 2018-2025
- 12.4.3 Revenue Forecast, 2025-2035
- 12.4.4 Volume Forecast, 2025-2035
- 12.4.5 Base-Year Market Share, 2025
- 12.4.6 Segment CAGR and Growth Drivers
- 12.4.7 Subsegment Market Size and Forecast
- 12.4.7.1 Well completion
- 12.4.7.2 Well workover
- 12.4.7.3 Packer fluid placement
- 12.4.8 Subsegment Pricing and Adoption Trends
- 12.4.9 Leading Suppliers and Competition
- 12.4.10 Regional Demand and Opportunities
- 12.5 By End User - Market Size and Forecast, 2025-2035
- 12.5.1 Segment Definition and Scope
- 12.5.2 Historical Market Size, 2018-2025
- 12.5.3 Revenue Forecast, 2025-2035
- 12.5.4 Volume Forecast, 2025-2035
- 12.5.5 Base-Year Market Share, 2025
- 12.5.6 Segment CAGR and Growth Drivers
- 12.5.7 Subsegment Market Size and Forecast
- 12.5.7.1 Integrated LNG operators
- 12.5.7.2 Independent conventional operators
- 12.5.7.3 Coal seam gas operators
- 12.5.8 Subsegment Pricing and Adoption Trends
- 12.5.9 Leading Suppliers and Competition
- 12.5.10 Regional Demand and Opportunities
- 12.6 By Sales Channel - Market Size and Forecast, 2025-2035
- 12.6.1 Segment Definition and Scope
- 12.6.2 Historical Market Size, 2018-2025
- 12.6.3 Revenue Forecast, 2025-2035
- 12.6.4 Volume Forecast, 2025-2035
- 12.6.5 Base-Year Market Share, 2025
- 12.6.6 Segment CAGR and Growth Drivers
- 12.6.7 Subsegment Market Size and Forecast
- 12.6.7.1 Integrated service contracts
- 12.6.7.2 Direct specialist supply
- 12.6.7.3 Distributor-led supply
- 12.6.8 Subsegment Pricing and Adoption Trends
- 12.6.9 Leading Suppliers and Competition
- 12.6.10 Regional Demand and Opportunities
- 12.7 Segment Growth Comparison
- 12.8 Segment Attractiveness and Priority Matrix
Chapter 13 Australia Clear Brine Fluids End-Use and Application Market Outlook
- 13.1 End-Use Industry and Customer Demand Structure
- 13.2 Leading Applications and Customer Groups
- 13.3 End-Use Market Size, Share and Forecast
- 13.4 Major End-Use Industry Deep Dives
- 13.4.1 Customer Requirements and Use Cases
- 13.4.2 Demand and Replacement Cycles
- 13.4.3 Technical and Regulatory Considerations
- 13.4.4 Purchasing and Procurement Models
- 13.4.5 Leading Vendors and Distribution Channels
- 13.4.6 Forecast and Commercial Opportunities
- 13.5 Emerging Applications and Cross-Segment Demand
- 13.6 End-Use Industry Investment Priorities
Chapter 14 Australia Clear Brine Fluids Geographic Market Outlook, 2025-2035
- 14.1 Domestic Market Distribution and Demand Clusters
- 14.2 State- or Province-Wise Market Size and Forecast, 2025-2035
- 14.3 City and Metropolitan Market Outlook
- 14.4 Industrial, Manufacturing and Commercial Clusters
- 14.5 Geographic Concentration of Key End Users
- 14.6 Local Pricing and Purchasing Differences
- 14.7 Domestic Production Facilities and Capacity Map
- 14.8 Local Infrastructure and Project Pipeline
- 14.9 State-Level Policy and Incentive Differences
- 14.10 Subnational Investment Hotspots and Opportunities
- 14.11 Distribution and Logistics Networks
- 14.12 Domestic Competitive Footprint
Chapter 15 Australia Clear Brine Fluids Technology, Innovation and Sustainability Outlook
- 15.1 Technology Landscape and Maturity
- 15.2 Product, Process and Service Innovation
- 15.3 AI, Automation and Digital Tools in the Industry
- 15.4 Technology Adoption and Performance Benchmarking
- 15.5 Innovation Pipeline and R&D Investment
- 15.6 Patent and Intellectual Property Trends
- 15.7 Energy Efficiency and Resource Management
- 15.8 Sustainability, Recycling and Circularity
- 15.9 Technology Roadmap, 2025-2035
- 15.10 Risks of Obsolescence and Technology Substitution
Chapter 16 Australia Clear Brine Fluids Market Key Strategic Imperatives
- 16.1 Growth and Market Entry Priorities
- 16.2 High-Return Products and Segments
- 16.3 Pricing, Profitability and Cost Optimization
- 16.4 Technology Investment and Product Differentiation
- 16.5 Supply Chain Localization and Resilience
- 16.6 Distribution and Customer Acquisition
- 16.7 Partnership, Acquisition and Capacity Strategy
- 16.8 Regional Expansion Priorities
- 16.9 Short-, Medium- and Long-Term Actions
Chapter 17 Competition Outlook
- 17.1 Industry Competition Characteristics
- 17.2 Market Structure and Concentration
- 17.3 Market Share and Competitive Positioning, 2025
- 17.4 Company-Wise Revenue and Product Benchmarking
- 17.5 Production and Service Capacity Benchmarking
- 17.6 Technology, Pricing and Differentiation
- 17.7 Regional Footprint and Distribution Strength
- 17.8 Mergers, Acquisitions and Strategic Alliances
- 17.9 New Entrants and Competitive Threats
- 17.10 Porter's Five Forces and Industry Attractiveness
- 17.11 Competitive Outlook, 2025-2035
Chapter 18 Company Profiles
- 18.1 Company Coverage and Selection Criteria
- 18.2 SLB
- 18.2.1 Business Description
- 18.2.2 Company Ownership and Geographic Presence
- 18.2.3 Product and Service Portfolio
- 18.2.4 Manufacturing and Operating Footprint
- 18.2.5 Production Capacity and Expansion Plans
- 18.2.6 Financial Performance and Investment
- 18.2.7 Market Share and Competitive Position
- 18.2.8 Technology and Innovation Capabilities
- 18.2.9 Strategic Alliances or Partnerships
- 18.2.10 Recent Developments
- 18.2.11 Growth Strategy and Outlook
- 18.3 Halliburton
- 18.4 Baker Hughes
- 18.5 TETRA Technologies
- 18.6 Global Drilling Fluids & Chemicals
- 18.7 Other Relevant Market Participants
Note: Every listed company is profiled on the structure shown under the first company. The company list is preliminary and may change based on research findings, market developments, data availability and client requirements.
Chapter 19 Disclaimer
- 19.1 Research and Forecast Disclaimer
- 19.2 Data Source and Estimation Limitations
Note: The depth of individual sections depends on data availability for this market. Volume, capacity, trade and other unit-based metrics are included where applicable.

