
Value holds up as brewers sell fewer but dearer liters
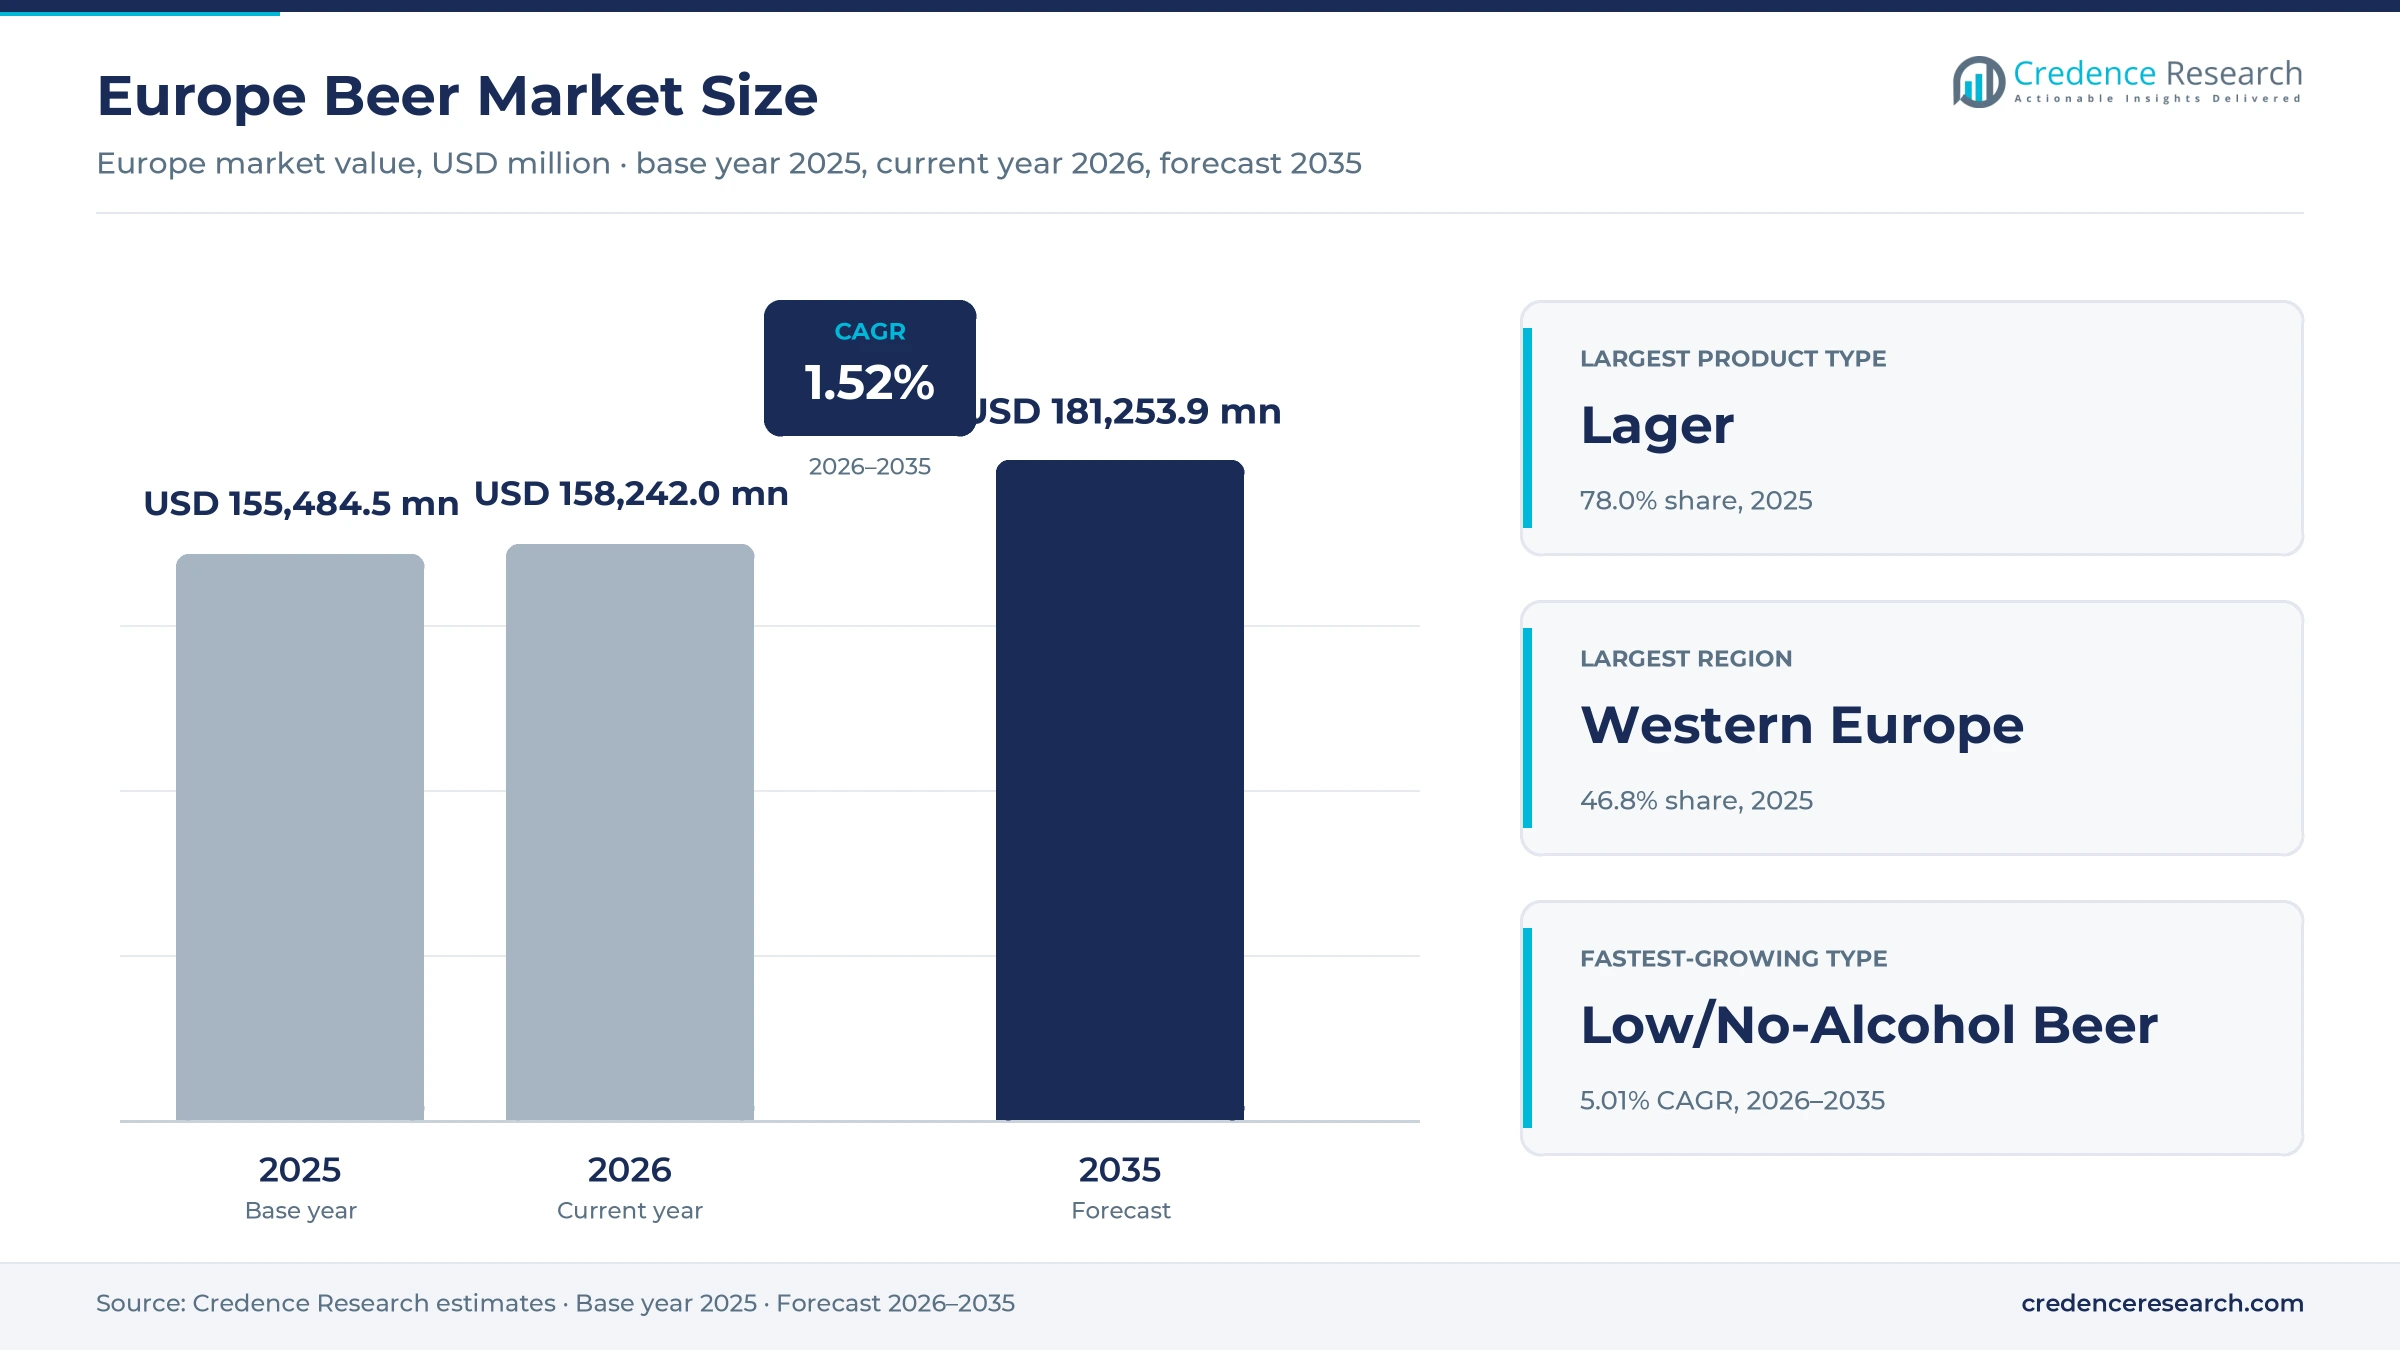
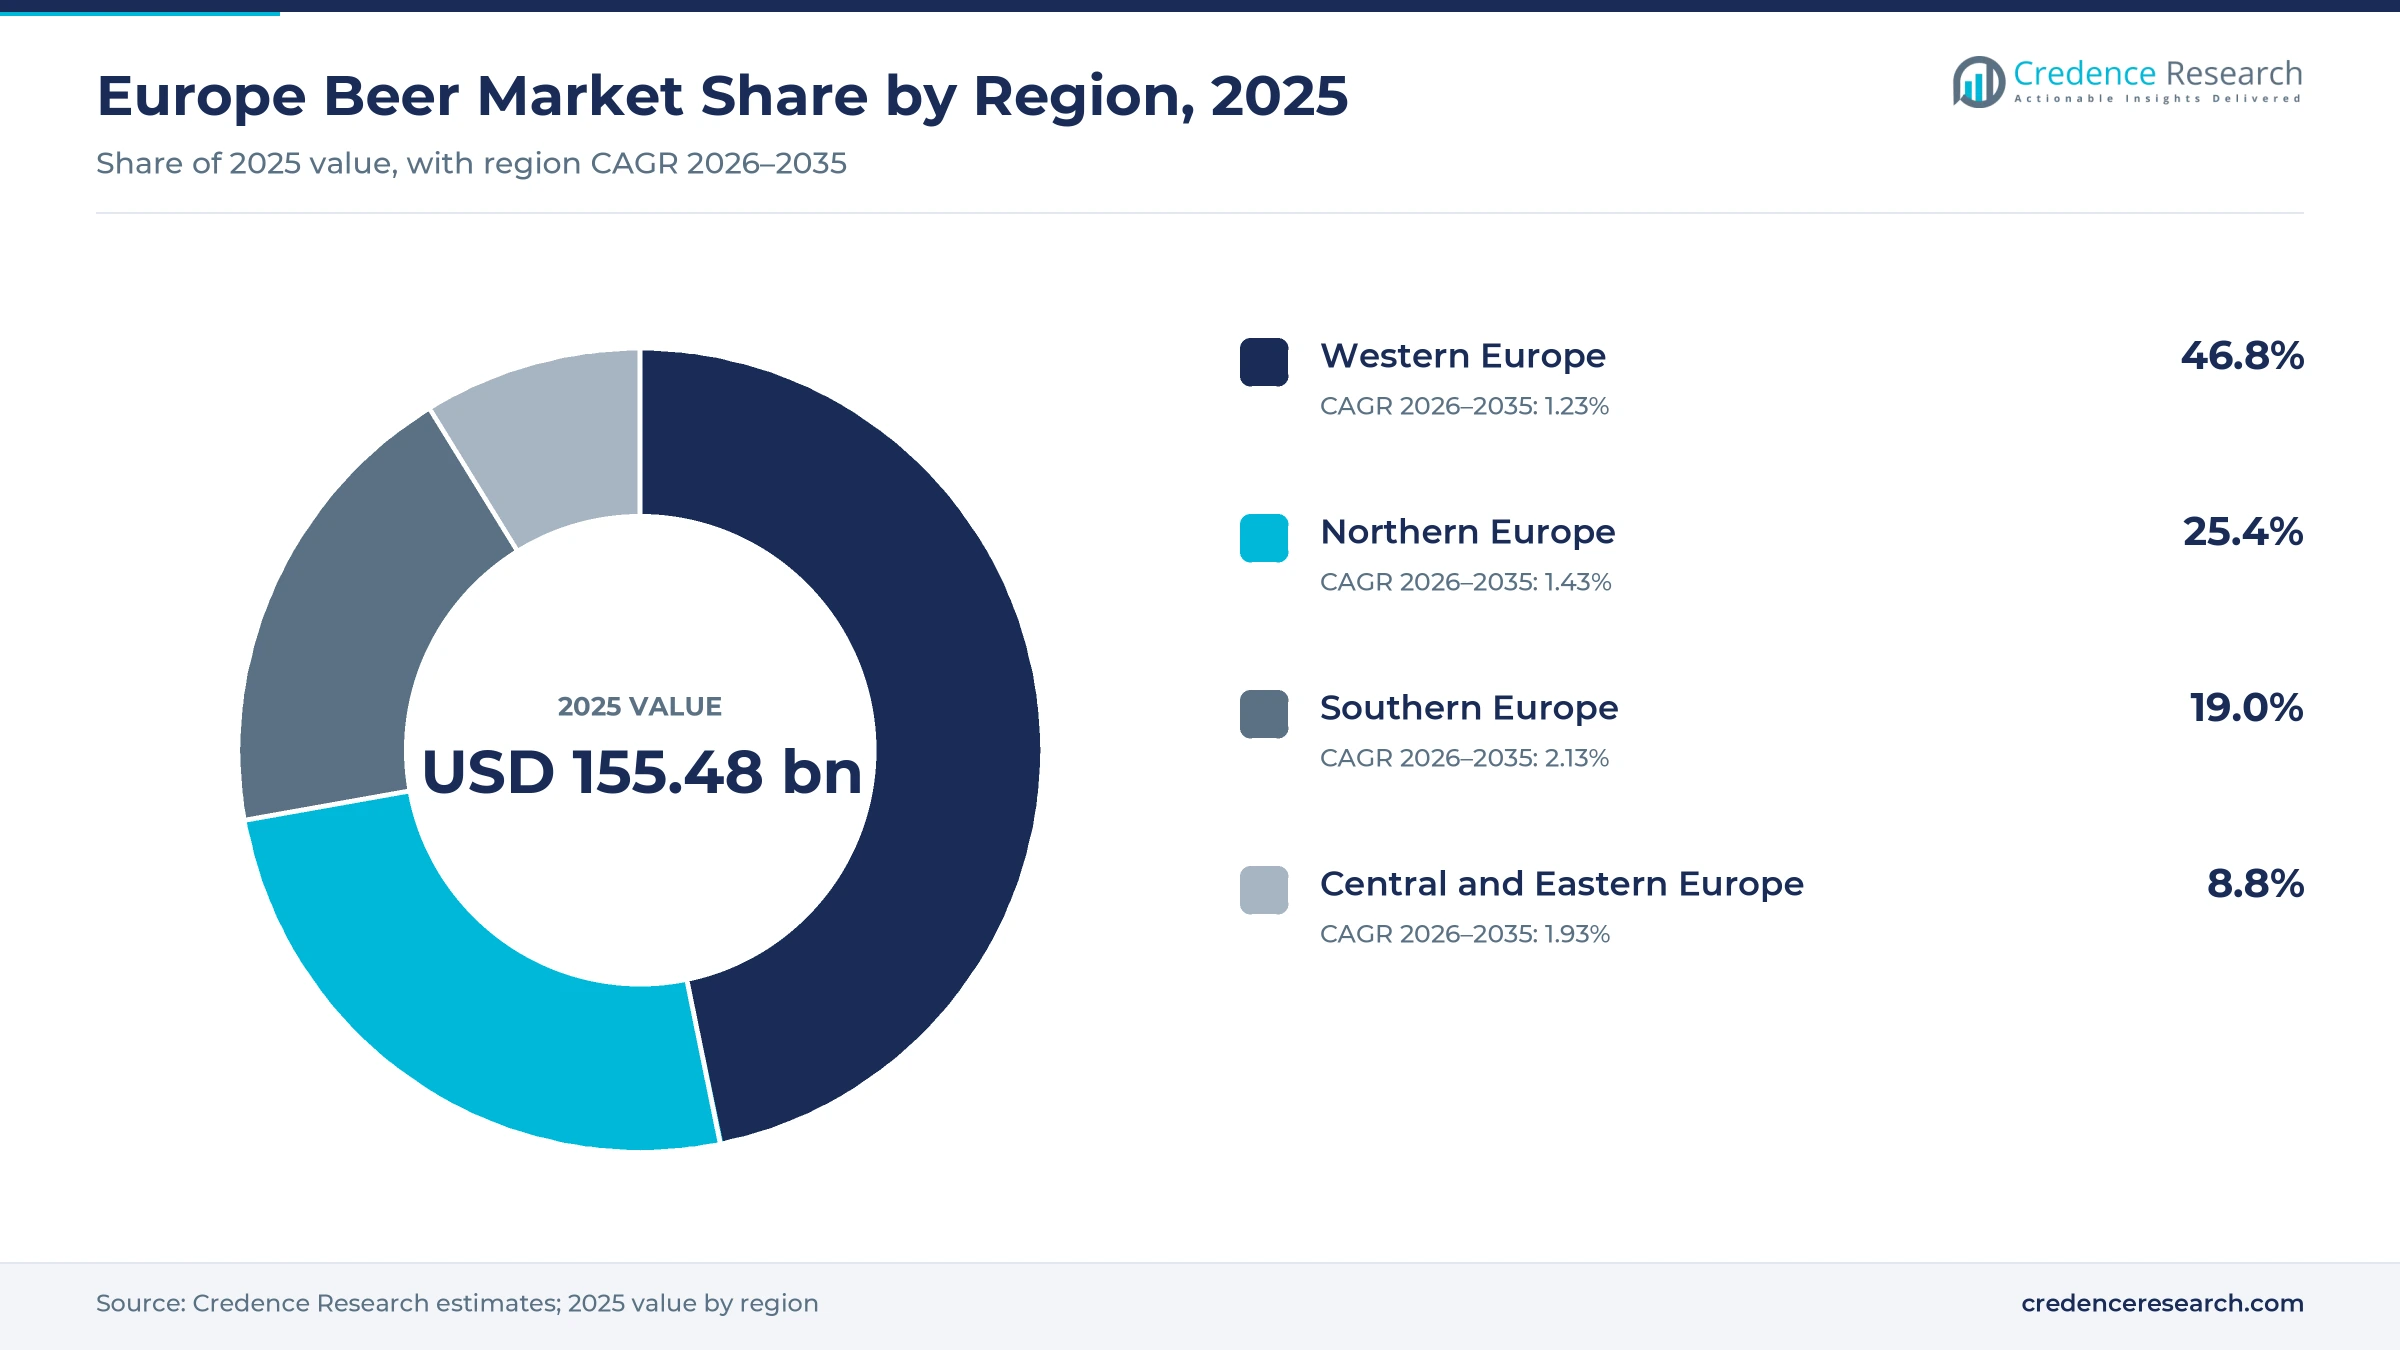
The Europe beer market was valued at USD 155.48 billion in 2025 and is projected to increase from USD 158.24 billion in 2026 to USD 181.25 billion by 2035, registering a CAGR of 1.52% during 2026–2035. Demand rests on lager drinking at home and in hospitality, while price and mix now carry more of the value because fewer liters are sold each year. Western Europe held the largest regional share, 46.8% in 2025, anchored by Germany, the largest brewing country in the European Union, along with France, the Netherlands and Belgium. Southern Europe is the fastest-growing region at 2.13% a year, supported by Spain, where most beer is still consumed in bars and restaurants. The main commercial change is the steady rise of alcohol-free brews, which The Brewers of Europe says now account for one in every twelve beers consumed in the European Union. Regulation is also shifting, since the EU packaging regulation began applying on Aug. 12, 2026.
How is beer value counted across Europe and who buys it?
The estimate counts consumer spending on lager, ale, wheat beer, stout, porter and low or no-alcohol beer, sold through pubs, bars and restaurants as well as retail stores and online channels. Households buy mostly through supermarkets on weekly trips, while hospitality venues buy kegs and bottles from brewers and wholesalers and then resell by the glass at far higher prices per liter.
The count excludes cider, flavored spirit drinks, soft drinks made by brewers and brewing equipment sold to the trade. The value chain runs from malt and hop suppliers through brewers and packaging firms to wholesalers, retailers and licensed venues, and each stage now carries extra deposit, reuse and recycling duties.
Europe Beer Market Insights
- The market moves from USD 155.48 billion in 2025 to USD 181.25 billion by 2035, a 1.52% CAGR that depends on price and mix rather than on higher liters sold.
- Western Europe held 46.8% of 2025 value, while the regional mix tilts slowly toward Spain and the south, where hospitality carries most of the beer sold.
- Lager held 78.0% of 2025 value, and low or no-alcohol beer now grows fastest as lager volumes decline in Germany and Czechia.
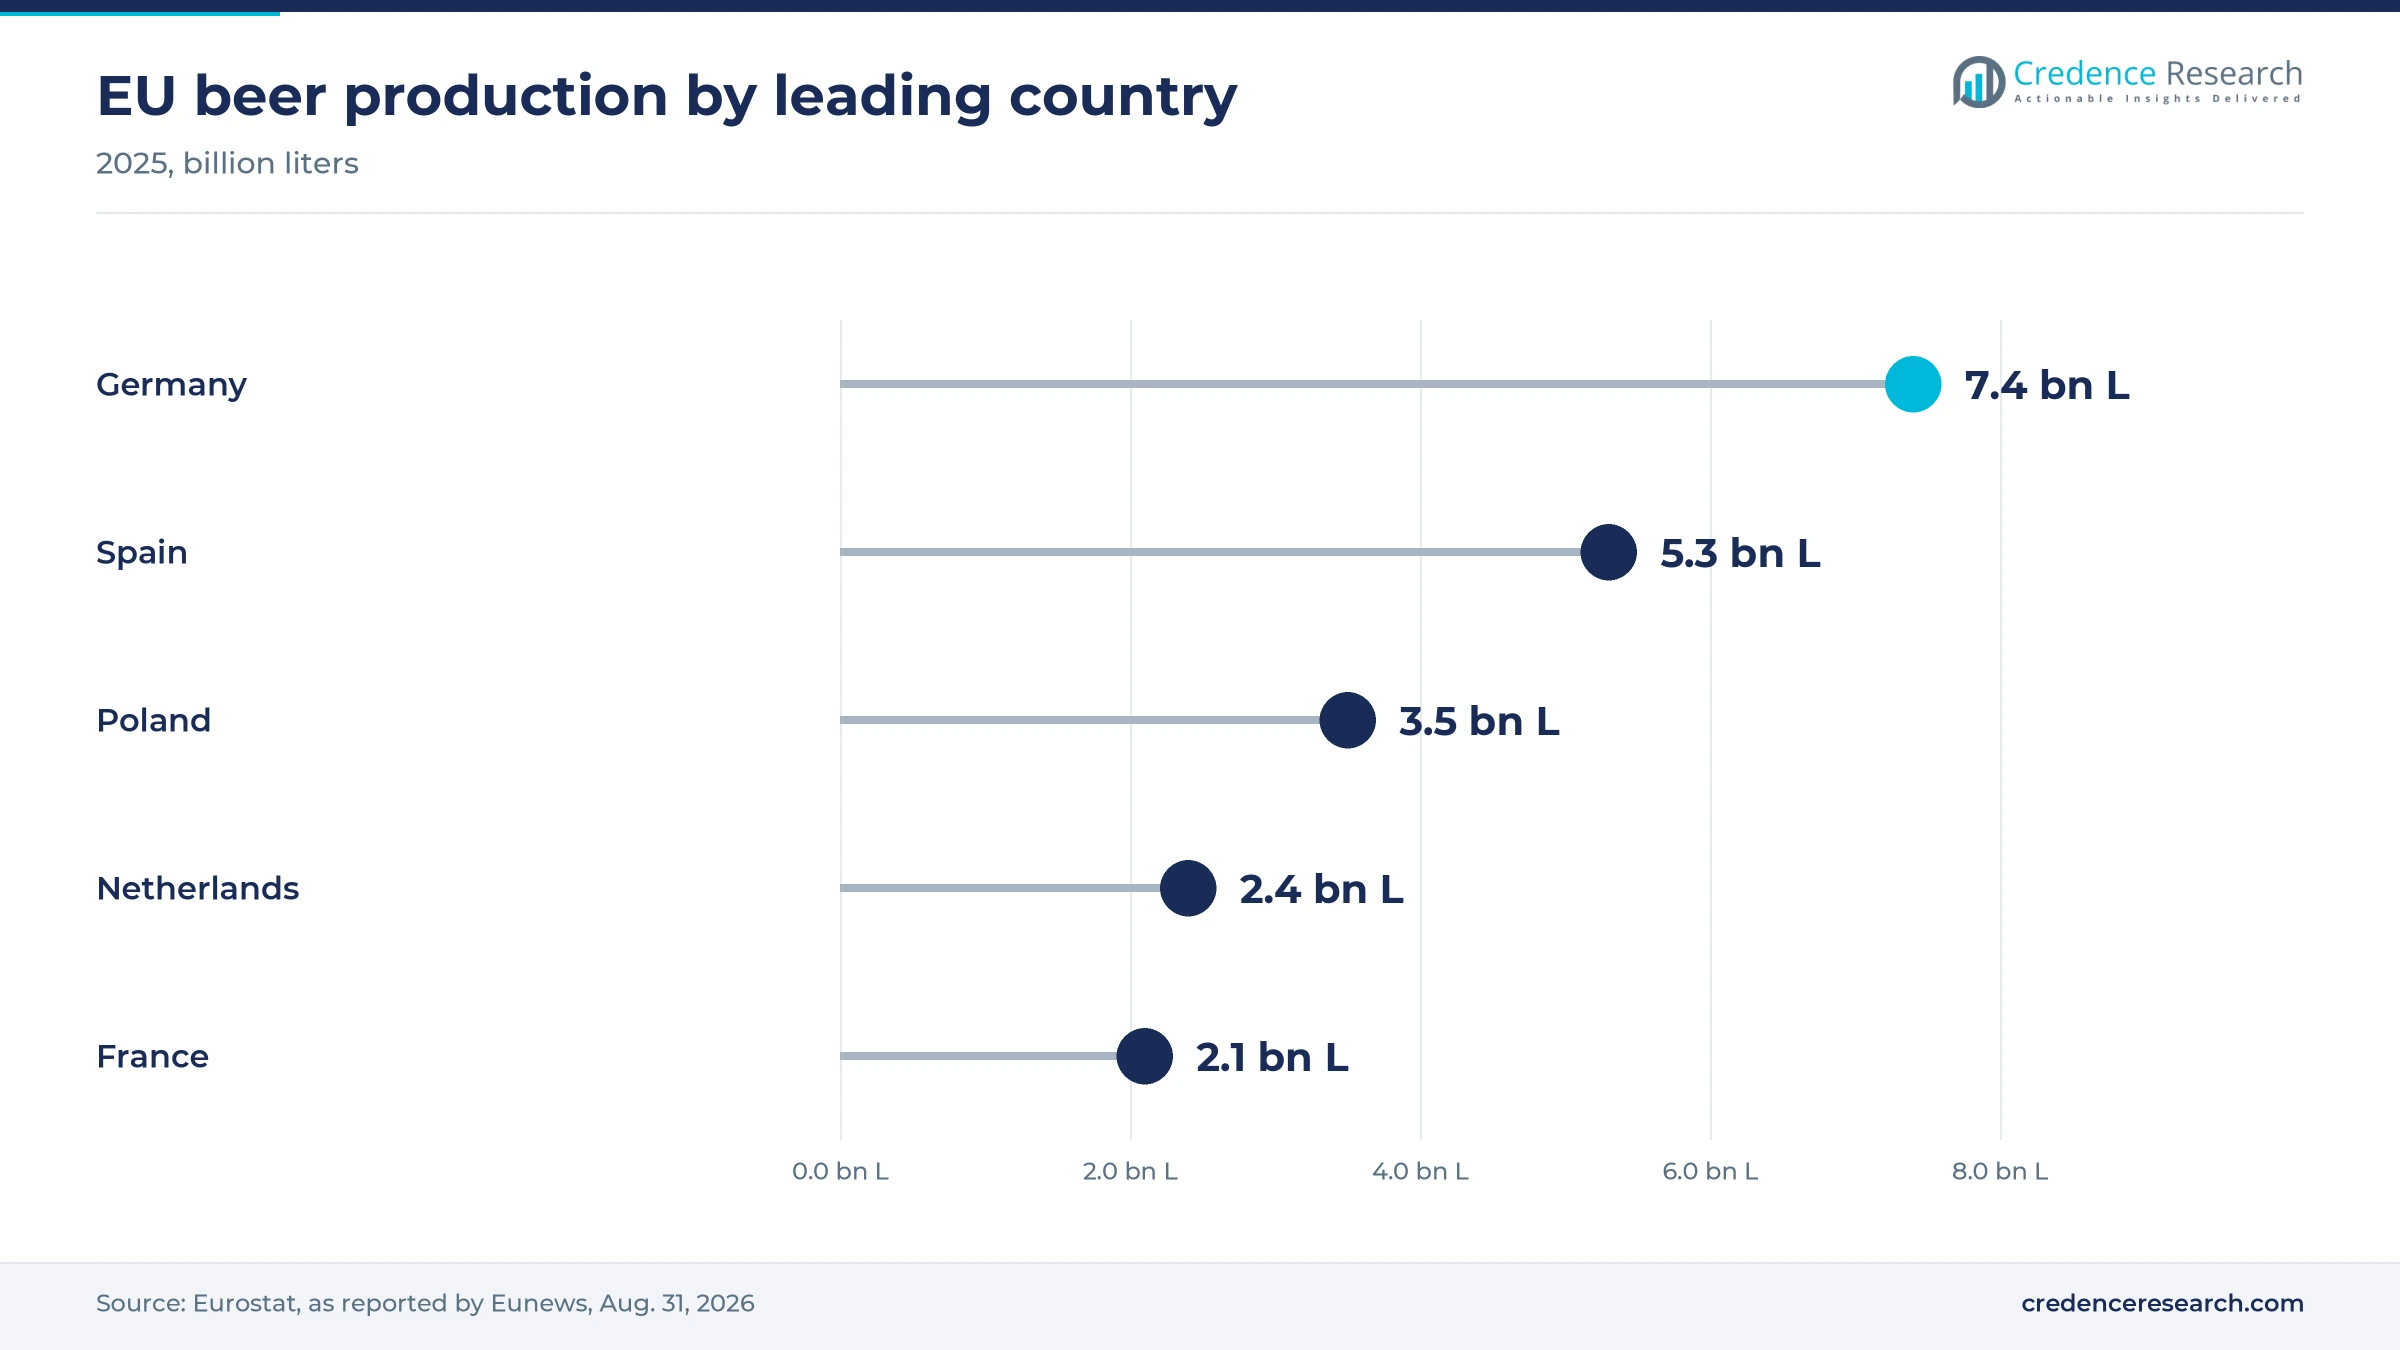
- Eurostat data show 2.1 billion liters of low or no-alcohol beer brewed in the European Union in 2025, reported by Eunews on Aug. 31, 2026.
- Large brewers are cutting capacity, with HEINEKEN planning up to 6,000 job cuts and Carlsberg planning to close the Marston brewery in Burton by summer 2027.
Lager, mainstream tiers and on-trade sales lead value
Why does lager dominate while alcohol-free beer grows fastest?
Based on product type, the market is categorized into lager, ale and wheat beer, stout and porter, and low/no-alcohol beer. Lager led with 78.0% of 2025 value because pale styles define the largest markets, with pilsner alone holding a 50% share in Germany, according to German Brewers Association and NielsenIQ data reported in February 2026. Low/No-Alcohol Beer grows fastest at 5.01% a year as alcohol-free volumes rose 5.87% in 2025, according to The Brewers of Europe. Ale faces a harder path, since Carlsberg Britvic said in October 2026 that U.K. cask volumes have more than halved in under a decade.
Why does the mainstream tier hold value as premium brands gain?
Based on price tier, the market is categorized into economy, mainstream, premium and super-premium. Mainstream led with 44.0% of 2025 value because national pilsner brands fill most German and Czech retail shelves, where lagers of 11 to 12 degrees Plato took 59.2% of 2025 consumption, the Czech Brewers and Maltsters Association reported. Premium grows fastest at 2.58% a year as drinkers trade up, a shift seen in Madrí Excepcional, whose U.K. on-trade sales rose 5.4% in 2025, the Morning Advertiser reported. Economy brands stay relevant, since Oettinger said in 2023 that it sells almost 60% below advertised rivals.
Why do pubs and restaurants lead value on a minority of volume?
Based on distribution channel, the market is categorized into pubs, bars and restaurants, supermarkets and hypermarkets, convenience and specialist retail, and e-commerce and direct-to-consumer. Pubs, Bars and Restaurants led with 52.0% of 2025 value because glass prices far exceed shelf prices, even though The Brewers of Europe puts the on-trade near one quarter of EU volume. The range is wide, with Spanish hospitality at 64% of 2025 consumption and Czech venues at 28%. E-Commerce and Direct-to-Consumer grows fastest at 4.46% a year as German beverage e-commerce grew at a double-digit rate in 2025, according to ECDB, from an online share under 5%.
Why do kegs lead value while metal cans gain the most ground?
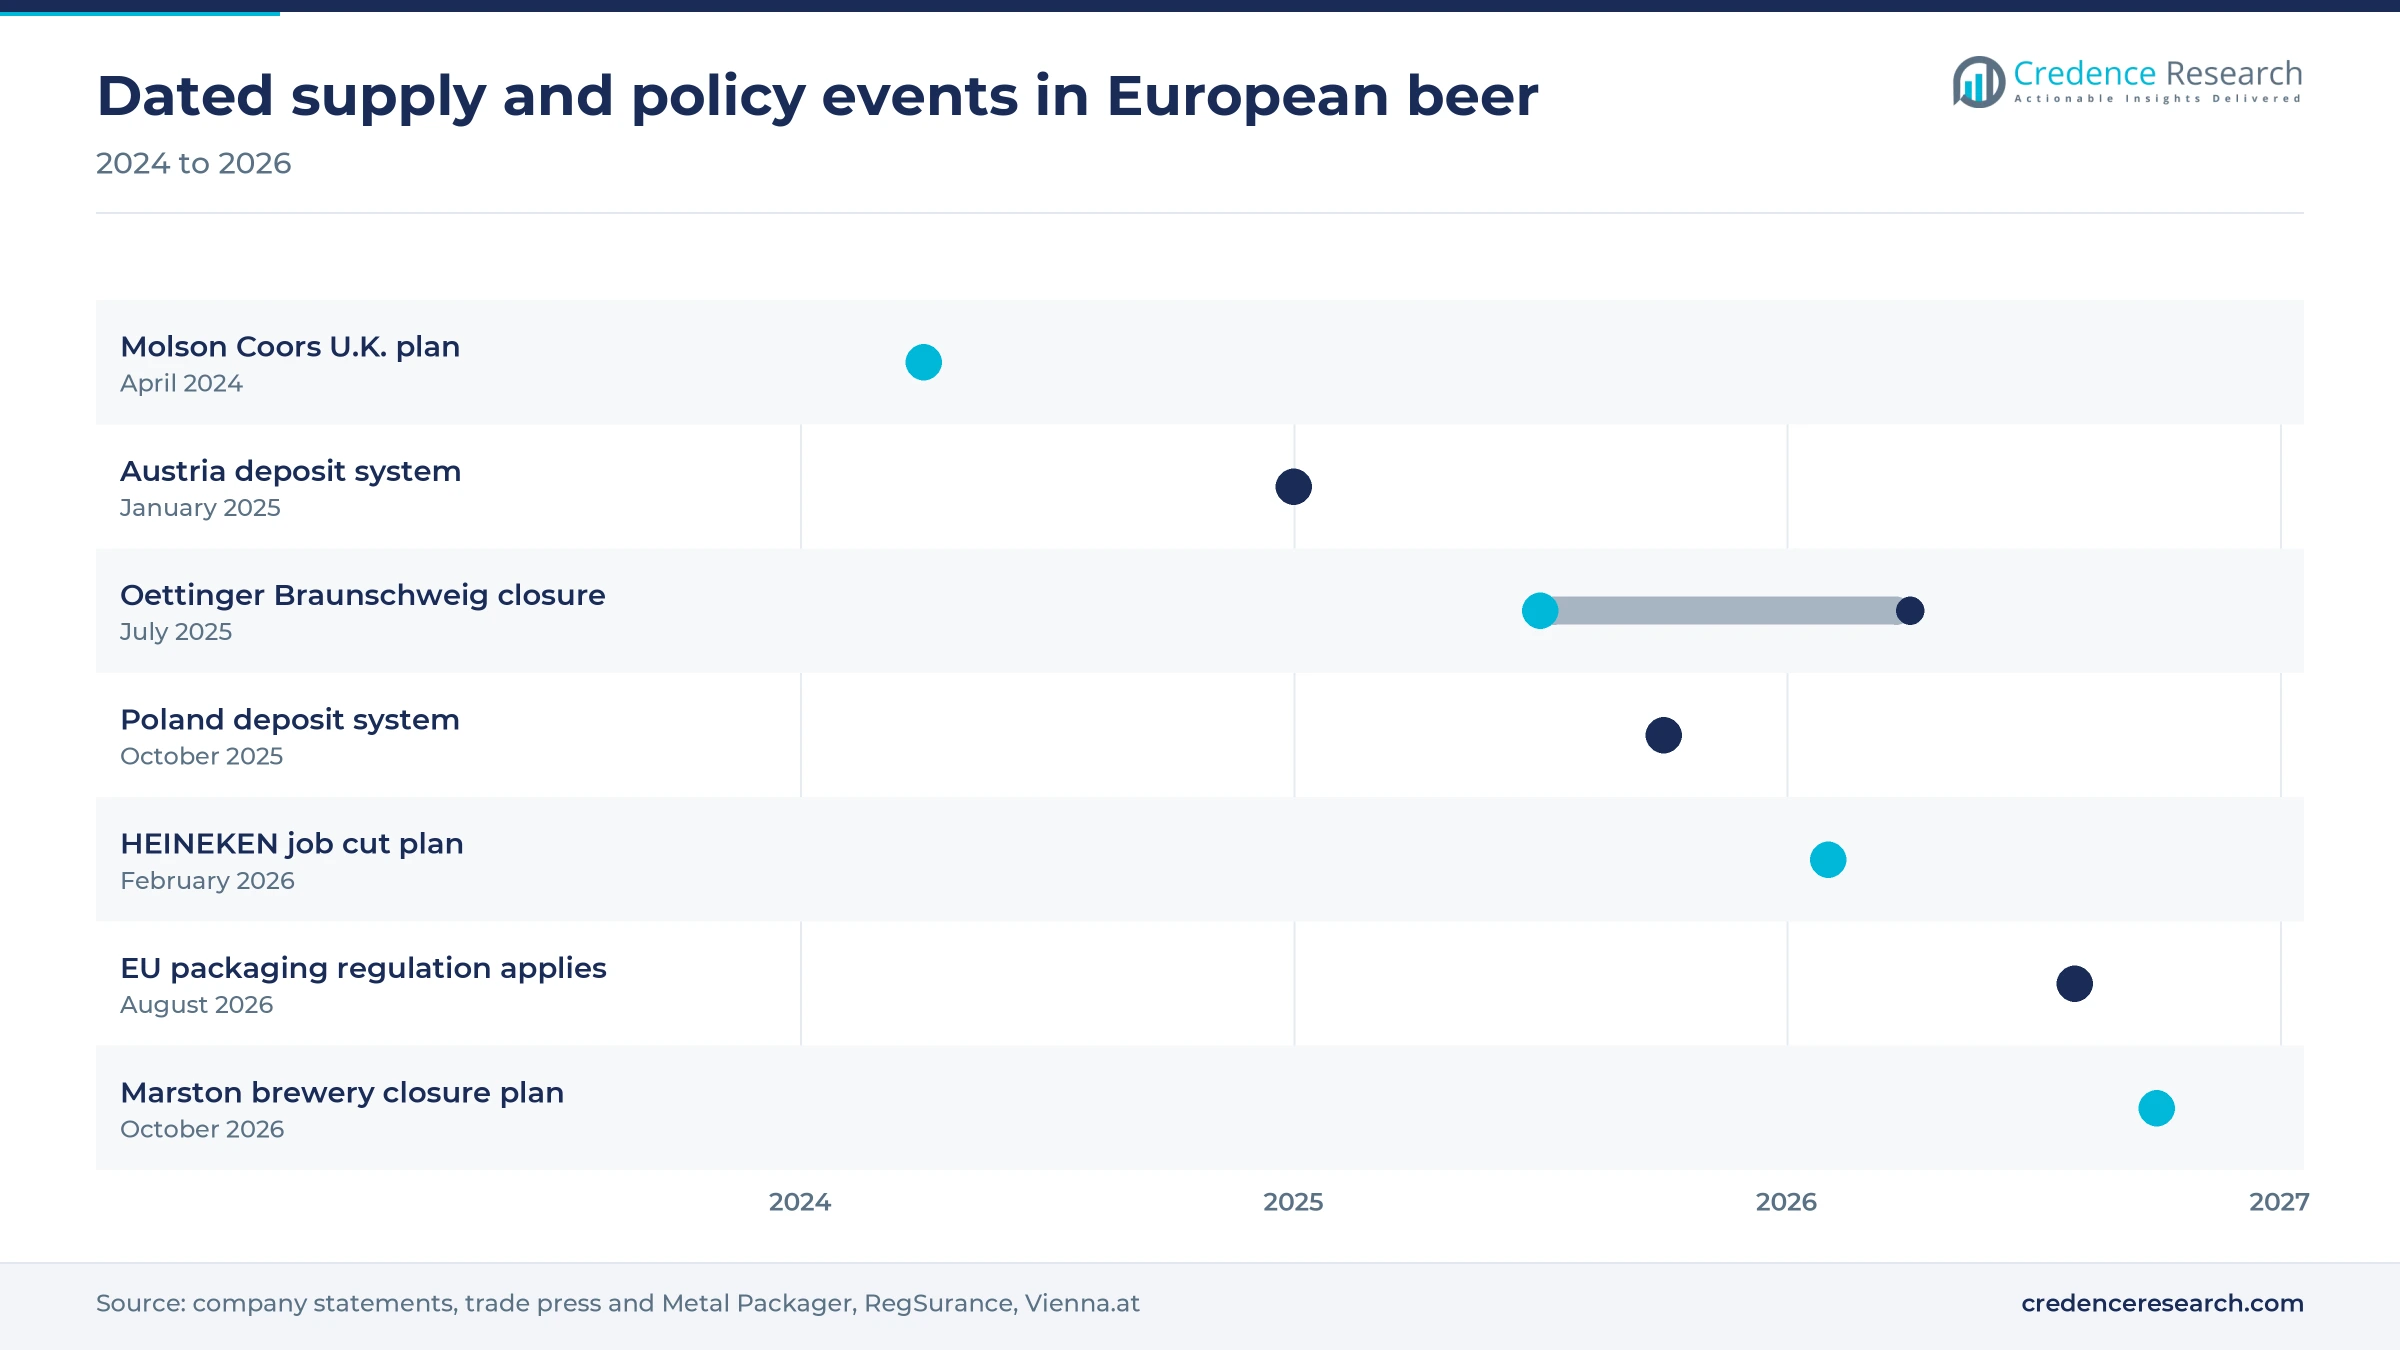
Based on packaging format, the market is categorized into returnable glass bottles, one-way glass bottles, metal cans and draught kegs. Draught Kegs led with 37.0% of 2025 value because kegs serve the highest-priced pours, and they carried 25.2% of Spanish volume in 2025, according to Cerveceros de España. Metal Cans grows fastest at 2.26% a year as brewers add capacity, including a Molson Coors line planned to fill 120,000 aluminum beverage cans per hour at Burton under a plan announced in April 2024. Returnable glass stays strong in Germany, where the German Brewers Association says nearly 80% of beer sells in reusable bottles.
| Segment Group | Leading Sub-segment | Share, 2025 | Fastest-growing Sub-segment | CAGR, 2026–2035 |
|---|---|---|---|---|
| By Product Type | Lager | 78.0% | Low/No-Alcohol Beer | 5.01% |
| By Price Tier | Mainstream | 44.0% | Premium | 2.58% |
| By Distribution Channel | Pubs, Bars and Restaurants | 52.0% | E-Commerce and Direct-to-Consumer | 4.46% |
| By Packaging Format | Draught Kegs | 37.0% | Metal Cans | 2.26% |
Request a Free Sample
Fill in your details and we'll send you a free sample report.
- Sample data tables & charts
- Research methodology
Alcohol-free volume and pricier pints support value
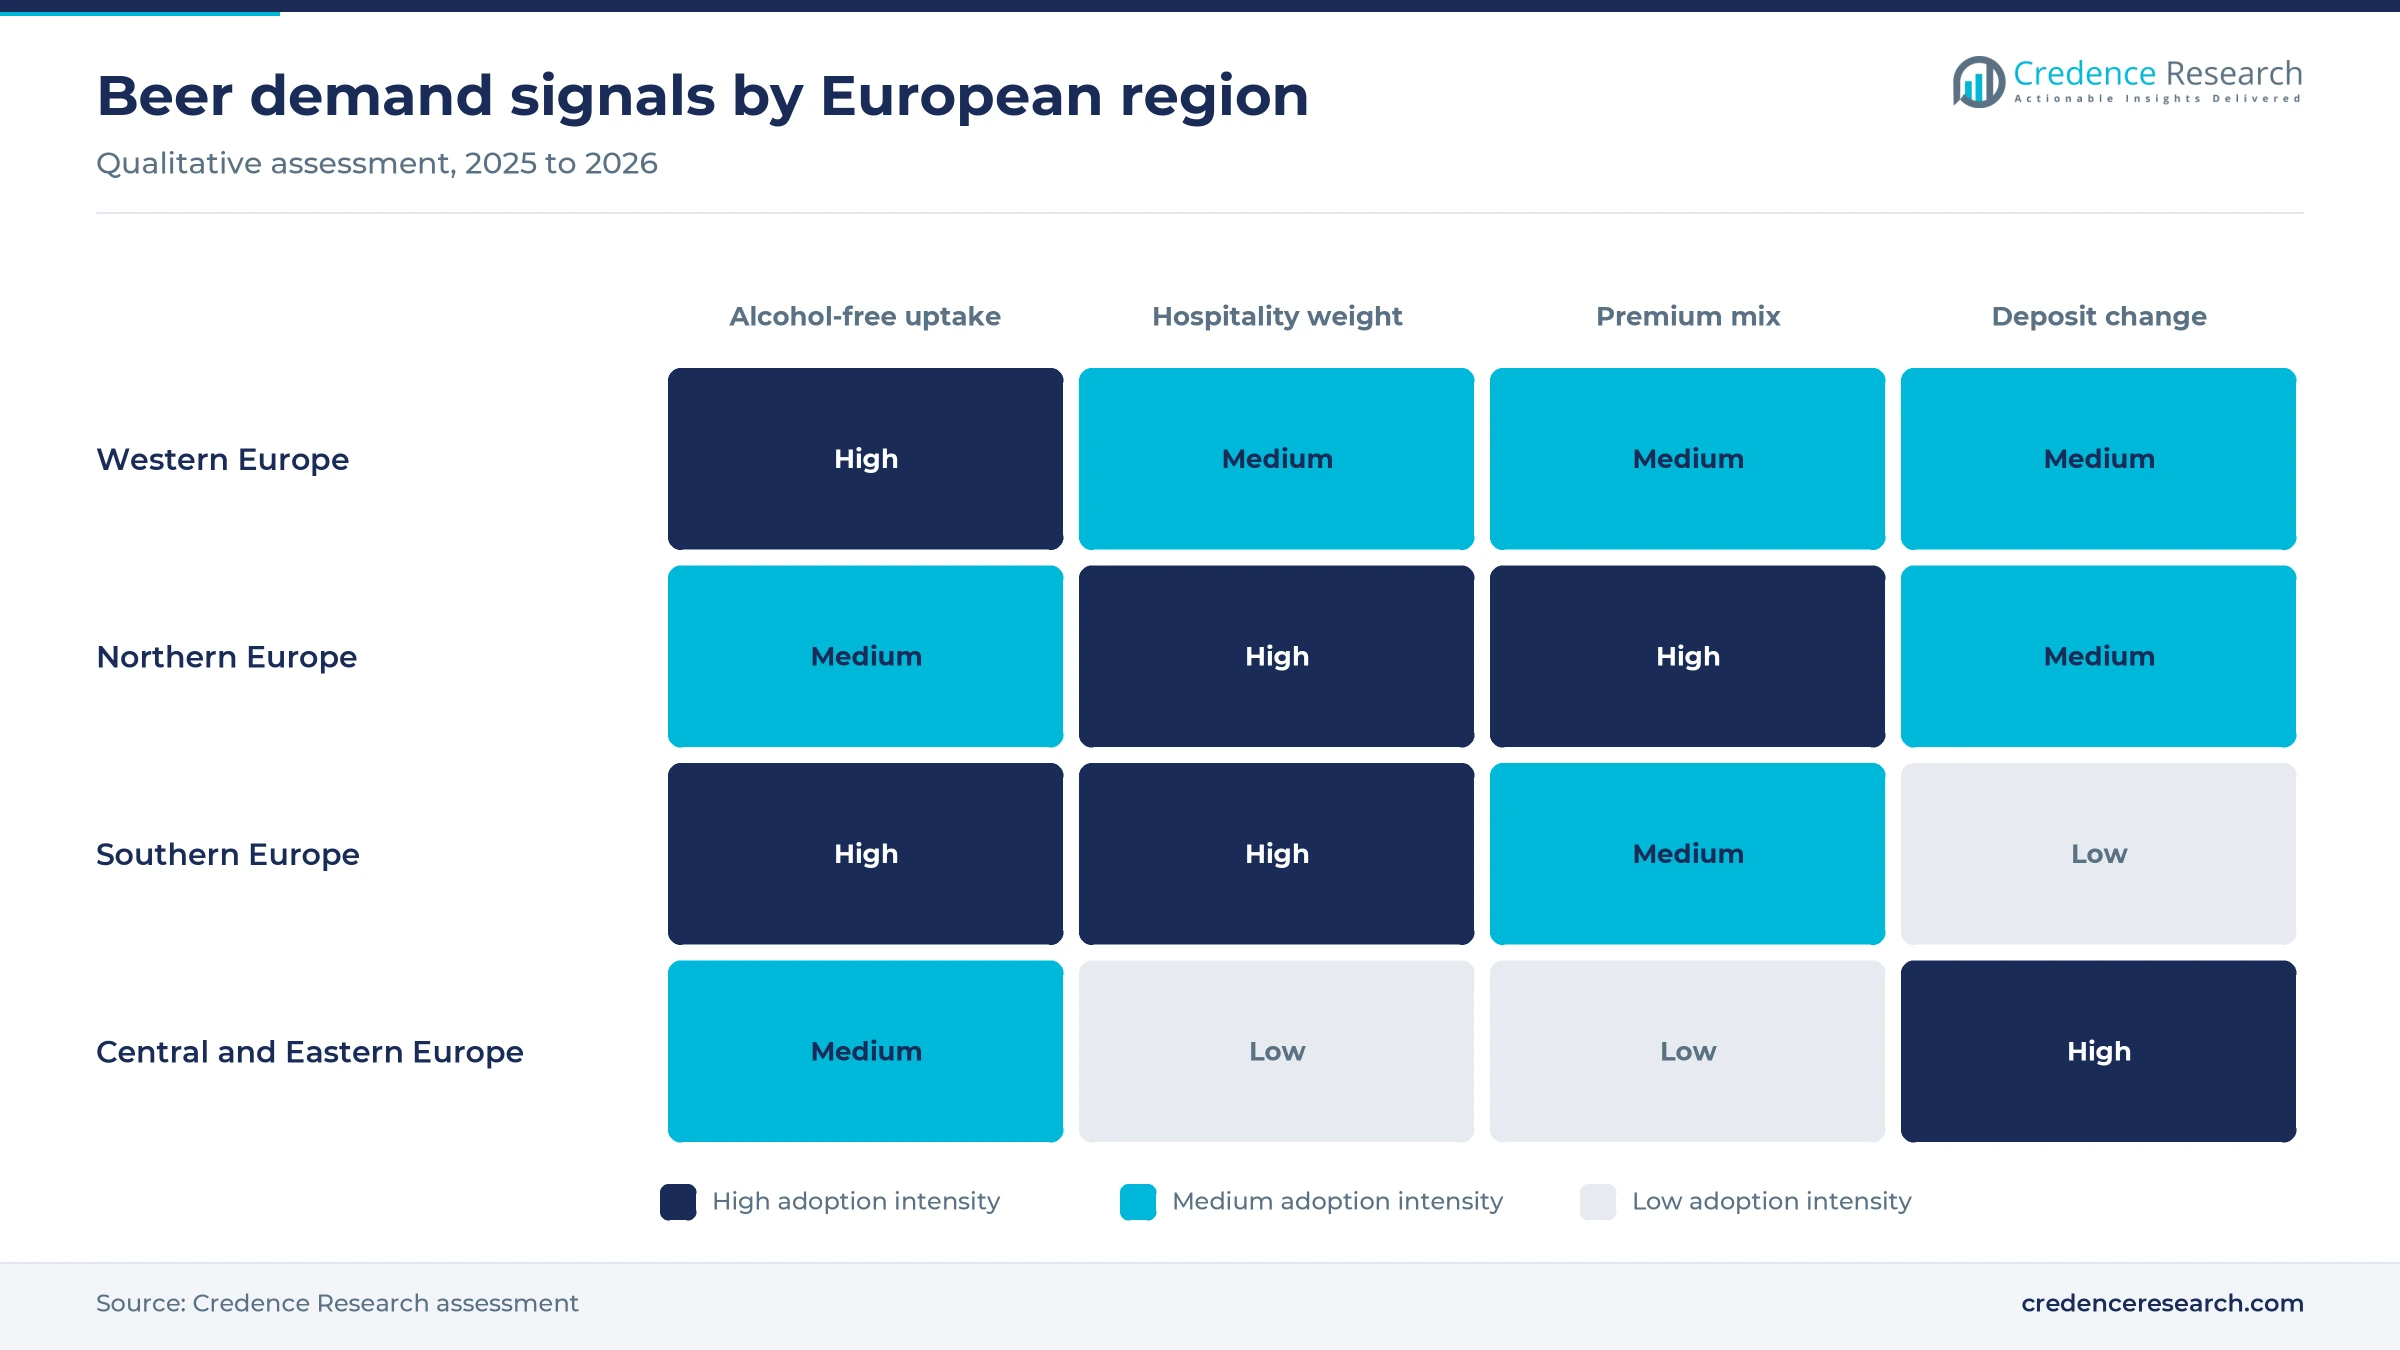
Rapid scaling of low and no-alcohol beer lifts sales
Low and no-alcohol beer is the one large category adding liters, which gives brewers a growth line while lager declines. Volumes rose 5.87% in 2025 and more than 38% over five years, The Brewers of Europe reported in July 2026, and one EU beer in twelve is now alcohol-free. German Brewers Association and NielsenIQ data show non-alcoholic brews reaching one sale in ten in Germany in 2025 for the first time. In Spain the share reached 14% on sales of 3.3 million hectoliters, according to Cerveceros de España. Carlsberg told investors in October 2025 that alcohol-free volume grew 11% a year from 2018 to 2024 in Western Europe. As a result, Low/No-Alcohol Beer grows at 5.01% a year through 2035.
Premiumization expands revenue per liter for brewers
Brewers are raising revenue per liter because volume no longer delivers growth, and premium brands give them room to do so. Molson Coors tied its plan to spend more than £100 million on U.K. sites, announced in April 2024, directly to strong demand for premium and world lagers such as Madrí Excepcional. That brand has sold more than 750 million pints since October 2020, the Morning Advertiser reported in December 2025. Carlsberg said in October 2025 that it has expanded its premium brands from three to 10 markets in Western Europe. Bitburger also raised German prices ahead of Krombacher and Veltins, Lebensmittel Praxis reported in February 2026. These moves add to demand for premium alcoholic drinks across licensed venues, and Premium grows at 2.58% a year.
High-value hospitality and experience-led drinking add value
Hospitality and visitor experiences earn far more per liter than retail, so stable venue demand matters more than its volume share suggests. In Spain, beer accounts for roughly 25% of hospitality billing, rising to about 40% in smaller businesses, according to Cerveceros de España. Munich shows the pricing power of events, since the city lists an average Oktoberfest price of 15.61 euros per liter for 2026, while organizers estimated 6.5 million liters served to about 6.5 million visitors in 2025. The Guinness Storehouse in Dublin has drawn nearly 27 million visitors in 25 years, its 2025 fact sheet says. Brewers of Europe data also show the on-trade share stabilizing in 2025, which helps demand for bar dispensing equipment and keeps Pubs, Bars and Restaurants at 52.0% of value.
Sports events give brewers a volume and activation lift
Major sporting events help brewers because they gather drinkers in venues and homes during the peak summer season, when promotion spending works hardest. AB InBev chief executive Michel Doukeris told investors in February 2026 that the World Cup held in June and July would create strong activation opportunities, the Cyprus Mail reported. Carlsberg also flagged a boost from sports for 2026 in the same report, which listed analyst forecasts of 3% beer volume growth for Carlsberg and 1.1% for HEINEKEN that year. Royal Unibrew posted 5.0% organic volume growth in the first quarter of 2026, helped by Easter timing, which shows how sensitive the category is to occasions. As a result, event calendars now shape brewing and promotion plans for large and regional brewers alike.
Deposit laws and brewery closures reshape supply
Deposit return schemes spread and shift the can economics
Deposit return is spreading quickly, and this shift raises collection rates while changing the cost of one-way packs. Austria introduced a 25-cent deposit on single-use bottles and aluminum cans from January 2025, Vienna.at reported. Poland followed on Oct. 1, 2025, with 50 groszy on cans and 1 zloty on reusable glass bottles, according to Metal Packager. Metal Packaging Europe said in February 2026 that the can recycling rate reached a record 76.3% in 2023, with Slovakia rising from 58% to 91% after its scheme began. RegSurance notes that member states must reach 90% separate collection of metal beverage containers through deposit systems by Jan. 1, 2029. In turn, Metal Cans grow at 2.26% a year as can recovery improves across Europe.
Brewery consolidation emerges as overcapacity meets lower volumes
Capacity is now shrinking as brewers adjust to lower volumes, a shift that changes regional supply and local brand availability. Destatis counted 1,415 German breweries in 2025, down 137 from 2019, and said 821 of them brew no more than 100,000 liters a year. Oettinger announced in July 2025 that it would close its Braunschweig brewery by spring 2026, affecting about 150 employees, inside.beer reported. HEINEKEN said in February 2026 that it could cut 5,000 to 6,000 roles, partly through European brewery closures, according to Food Bible. Carlsberg Britvic then announced on Oct. 8, 2026, that it plans to close the Marston brewery in Burton by summer 2027, with about 310 jobs at risk, ITV News reported. Suppliers of malt and hop ingredients now face fewer and larger buyers.
Reuse quotas open an opportunity for bottle and crate pools
The EU reuse rules create an opening for brewers that already run bottle and crate pools, since rivals must build similar systems. RegSurance reports that beer sits inside the regulation, with final distributors required to sell at least 10% of beverages in reusable packaging from 2030 and an aspirational 40% from 2040. German brewers start ahead, because the German Brewers Association says nearly 80% of beer sells in reusable bottles, above the 70% national quota. Spain sold about 15.66 million hectoliters in reusable containers in 2025, and about 82% of its hospitality beer already moves that way, Cerveceros de España reported. As a result, returnable pools could become a shared service for smaller brewers, although kegs supplied to bars do not count toward a venue's reuse target, RegSurance notes.
Digital ordering offers an opportunity in home and venue supply
Digital ordering is an opening because online beverage sales remain small but are growing faster than store sales, and brewers can capture data they never had. ECDB estimates German beverage e-commerce grew 10% to 15% in 2025, with alcoholic drinks about 70% of that revenue and an online share still below 5%. It ranks Flaschenpost, the home delivery service, as the leading retailer in the category. On the venue side, HEINEKEN built its eazle ordering platform on about 500,000 existing trade customers and more than 40 online shops, Just Drinks reported. Those tools let brewers manage returnable crates and keg deliveries with less phone-based selling. In turn, E-Commerce and Direct-to-Consumer grows at 4.46% a year, the fastest rate among sales channels.
Falling volumes and pub closures squeeze brewers
Falling consumption keeps pressure on brewery volumes
Lower consumption is the central problem, since most brewery costs are fixed. EU consumption fell 3.2% in 2025 and is down 9.2% since 2019, according to The Brewers of Europe. Germany fared worse, because Destatis reported a 6.0% sales drop in 2025, the steepest since its series began in 1993. Mid-sized regional brewers are most exposed because they lack export scale. As a result, many are cutting lines, raising prices or adding soft drinks to keep plants running.
Pub closures and venue costs threaten high-value pours
Venue closures remove the highest-value outlets for brewers and their kegs. The British Beer and Pub Association says 295 pubs closed permanently in the first nine months of 2026 and projects about 360 by year-end, with roughly 5,000 jobs lost. The association blames heavy taxes, business rates and labor costs for them. Brewers with large British keg volumes feel this first, since each closure removes draft lines and steady wholesale orders. Therefore, the association is pressing the government for relief on beer duty and business rates.
Weak exports leave European brewers with spare capacity
Exports no longer absorb spare capacity, which leaves export-oriented brewers holding idle lines. The Brewers of Europe says beer exports fell in 2025 to their lowest level since 2014. German shipments to non-EU countries fell 14.2% that year, Destatis data show and Czech exports fell 8.2%, the Czech Brewers and Maltsters Association reported. Dutch, Belgian and Irish brewers are especially exposed, given their large export volumes reported by Eurostat. Consequently, these brewers must either shrink capacity or win more domestic volume to keep plants busy.
Packaging rules add cost and uncertainty for smaller brewers
The EU packaging regulation adds cost before its details are settled, which complicates capital planning. It began applying on Aug. 12, 2026, yet Commission guidance on the scope of beverage reuse targets is not due until Feb. 12, 2027, RegSurance reports. Beer cans must also fit national deposit systems by Jan. 1, 2029. Small brewers face the hardest choice, since new labels, crates and collection fees spread over few liters. Many will therefore wait for guidance or join shared bottle pools.
Western Europe leads as Southern Europe holds firmer
| Region | Value, 2025 (USD billion) | Share, 2025 | CAGR, 2026–2035 |
|---|---|---|---|
| Western Europe | 72.77 | 46.8% | 1.23% |
| Northern Europe | 39.49 | 25.4% | 1.43% |
| Southern Europe | 29.54 | 19.0% | 2.13% |
| Central and Eastern Europe | 13.68 | 8.8% | 1.93% |
Western Europe holds the largest share despite falling German sales
Western Europe held 46.8% of 2025 value and grows at 1.23% a year, the slowest rate in the region. Germany, France, the Netherlands and Belgium anchor the total, and Eurostat data reported by Eunews put 2025 output at 7.4 billion liters in Germany and 2.4 billion in the Netherlands. However, falling German demand holds back growth across the wider region today. In France, alcohol-free beer offers some relief, and Carlsberg says it holds one third of that category in the country.
Northern Europe balances British pub losses with Nordic brand gains
Northern Europe held 25.4% of 2025 value and grows at 1.43% a year, with the U.K. carrying most of the spend. Britain lost a net 336 pubs in 2025, the Morning Advertiser reported, yet no and low beer should reach about 200 million pints that year, according to the British Beer and Pub Association. Nordic brands show some resilience, since Carlsberg reported Falcon volume up 4% in Sweden in the first half of 2025. Weather still matters, as Royal Unibrew noted after a cold Finnish spring.
Southern Europe grows fastest on strong hospitality demand
Southern Europe held 19.0% of 2025 value and grows at 2.13% a year, the fastest pace in the region. Spain leads the area with 43.4 million hectoliters consumed in 2025, about 5.2% above 2019, according to Cerveceros de España, while the EU as a whole sits well below that year. Bar culture keeps most Spanish beer in venues, with hospitality taking the larger part of consumption. Italy adds export strength through Birra Peroni, which reported over 6 million hectoliters from its plants in 2018, and Royal Unibrew cited a very strong Italian performance in early 2025.
Central and Eastern Europe gains on brewing scale and alcohol-free output
Central and Eastern Europe held 8.8% of 2025 value and grows at 1.93% a year, reflecting lower prices but solid brewing scale. Poland brewed 3.5 billion liters in 2025, including 280 million liters of low or no-alcohol beer, Eurostat figures reported by Eunews show. Czechia remains the heaviest-drinking market at 121 liters per person in 2025, although that is a record low, its brewers association says. Non-alcoholic production there rose 4% to 1.68 million hectoliters, which supports value as lager drinking fades.
Closures, deposit launches and PPWR marked 2025 and 2026
| Development | Status and market relevance |
|---|---|
| In February 2026, HEINEKEN said it could cut 5,000 to 6,000 roles over two years, with some cuts through European brewery closures. | Announced; reported by Food Bible; signals further capacity reduction |
| In July 2025, Oettinger said it would close its Braunschweig brewery by spring 2026, moving output to Oettingen and Mönchengladbach. | Announced; reported by inside.beer; affects about 150 employees |
| In October 2025, Poland launched its deposit return system covering metal cans up to 1 liter and reusable glass bottles up to 1.5 liters. | In force; reported by Metal Packager; changes retail handling of beer packs |
| In August 2026, the EU Packaging and Packaging Waste Regulation began applying, with beverage reuse targets following from 2030. | In force; summarized by RegSurance; beer falls inside the reuse targets |
| In October 2026, Carlsberg Britvic said it plans to close the Marston brewery in Burton by summer 2027, with about 310 jobs at risk. | Proposed and under consultation; reported by ITV News; reflects ale decline |
Fast can lines and dealcoholization shift brewing
- Dealcoholization capacity expanded early in Belgium, where AB InBev committed 31 million euros across Hoegaarden, Leuven and Sint-Pieters-Leeuw in 2023, RetailDetail reported.
- High-speed can filling reached 120,000 cans per hour with the line that Molson Coors planned for its Burton brewery in 2024, BeverageDaily reported.
- Digital brewery systems feature in the HEINEKEN plan for 2026, which pairs digitized breweries with selected closures to cut supply costs.
- Traceable reusable packaging became a design concern after Belgian brewers warned in 2023 that the proposed EU coding rules could scrap 1.1 billion bottles, Brauwelt reported.
Need a Custom Version of This Report?
Tailor the scope, geography, or segments to your exact requirements.
- Custom geography or segment scope
- Direct access to our analyst team
Global brewers defend scale as regional groups specialize
Competition splits between global groups that defend scale and regional brewers that specialize. HEINEKEN and AB InBev rely on international brands, while Carlsberg uses local premium labels alongside 1664 Blanc and a strong alcohol-free range in France. Molson Coors has directed investment to British sites, where Madrí Excepcional has become a major growth brand. Asahi Europe & International builds on Peroni from its Italian plants, including Padova, which Il Sole 24 Ore listed at about 1.9 million hectoliters a year. Royal Unibrew pairs beer with soft drinks, including a PepsiCo partnership in Belgium and Luxembourg, and has favored its own brands over private label. In Germany, Oettinger competes on low prices and does not supply venues, while Bitburger leans on its 0.0% range. Scale matters most in cost, while local brands still decide bar placement.
Companies profiled and their roles in this market
| Company | Type | Role in the market |
|---|---|---|
| Anheuser-Busch InBev | Global brewer | Expects World Cup activation and low-alcohol growth; invested in Belgian alcohol-free brewing |
| HEINEKEN | Global brewer | Restructuring European supply with selected brewery closures; runs the eazle trade platform |
| Carlsberg Group | Global brewer | Holds one third of French alcohol-free beer; plans to close the Marston brewery |
| Molson Coors Beverage Company | International brewer | Investing in U.K. can and keg lines to support Madrí Excepcional |
| Asahi Europe & International | International brewer | Brews Peroni in Italy at Padova, Rome and Bari |
| Royal Unibrew | Regional beverage group | Northern and Western Europe supplier prioritizing key brands over private label |
| Oettinger Brauerei GmbH | Value brewer | Low-price German brewer consolidating output after the Braunschweig closure |
| Bitburger Braugruppe GmbH | German brewer | Raised German prices and reported strong growth in its 0.0% range |
Credence Research view on a mix-led value market
Credence Research's view is that the Europe beer market will remain a value story rather than a volume story, because the evidence points the same way. Germany, Czechia and the wider EU all reported lower 2025 liters, yet alcohol-free and premium lines kept growing. Brewers with strong brands, returnable systems and good venue access should defend margin, while mid-sized regional groups carry the most risk. The key assumption is that hospitality stays stable after years of decline, so further pub closures would weaken the forecast, especially in Britain and Germany.
How the regional estimate was built
The report uses 2025 as the base year and forecasts values to 2035 from the Credence Research model. Regional and segment splits are Credence Research estimates built from public production, sales and channel data. Sources include Eurostat, Destatis, national brewer associations, company releases and trade publications. No interviews or surveys were conducted at any stage of this report. Consumer prices by channel are assumption-based estimates, so the split between on-trade and retail value carries the widest margin of error.
Alcohol-free and premium lines drive growth to 2035
The Europe beer market should reach USD 181.25 billion by 2035 at a 1.52% CAGR, with growth coming from mix and price rather than extra liters. Alcohol-free beer should keep gaining share through flavored ranges and wider venue listings, while premium lagers replace part of the lost mainstream volume. Deposit systems and reuse targets will shape packaging choices from 2029 and 2030, and this favors can recycling and shared bottle pools. Southern Europe should stay the firmest region, and the main risk remains a further drop in venue numbers across Britain and Germany.
Frequently Asked Questions
How big is the Europe beer market?
Which product type leads the Europe beer market?
Which product type grows fastest?
Which region leads European beer value?
Why are pubs and restaurants so important to value?
What is the biggest challenge for European brewers?
How will EU packaging rules affect beer?
Which companies compete in the Europe beer market?
Table of Content
Chapter 1 Market Segmentation
- 1.1 Segmentation Framework
- 1.1.1 Product and Service Classification
- 1.1.2 Application and End-Use Classification
- 1.1.3 Technology and Solution Classification
- 1.1.4 Customer and Distribution Channel Classification
- 1.1.5 Geographic Segmentation
- 1.1.6 Market Segment Definitions and Boundaries
- 1.2 By Product Type
- 1.2.1 Lager
- 1.2.2 Ale and Wheat Beer
- 1.2.3 Stout and Porter
- 1.2.4 Low/No-Alcohol Beer
- 1.3 By Price Tier
- 1.3.1 Economy
- 1.3.2 Mainstream
- 1.3.3 Premium
- 1.3.4 Super-Premium
- 1.4 By Packaging Format
- 1.4.1 Returnable Glass Bottles
- 1.4.2 One-Way Glass Bottles
- 1.4.3 Metal Cans
- 1.4.4 Draught Kegs
Chapter 2 Introduction
- 2.1 Report Objectives and Scope
- 2.2 Product Definition and Industry Terminology
- 2.3 Market Inclusions and Exclusions
- 2.4 Research Process
- 2.4.1 Primary Research and Expert Interviews
- 2.4.2 Secondary Research and Source Review
- 2.4.3 Top-Down and Bottom-Up Estimation
- 2.4.4 Data Triangulation and Verification
- 2.5 Market Size Measurement Basis
- 2.5.1 2025: USD 155.48 billion → 2035: USD 181.25 billion
- 2.6 Historical and Forecast Reference Periods
- 2.6.1 Historical Period: 2018-2025
- 2.6.2 Base Year: 2025
- 2.6.3 Forecast Period: 2025-2035
- 2.7 Research Assumptions and Limitations
Chapter 3 Executive Summary
- 3.1 Market Snapshot and Key Findings
- 3.2 Base-Year Market Size, 2025
- 3.3 Forecast Market Size, 2035
- 3.4 Revenue and Volume Growth Outlook
- 3.5 Key Demand and Supply Indicators
- 3.6 Leading Market Segments
- 3.7 Fastest-Growing Market Opportunities
- 3.8 Regional Performance Highlights
- 3.9 Technology and Industry Transformation
- 3.10 Competitive Landscape Summary
- 3.11 Analyst View and Strategic Implications
Chapter 4 Europe Beer Market Trends and Developments
- 4.1 Historical Industry Development, 2018-2025
- 4.2 Recent Market Trends and Developments
- 4.3 Demand and Customer Behavior Trends
- 4.4 Technology and Product Innovation
- 4.5 Artificial Intelligence, Automation and Digitalization
- 4.6 Local Manufacturing and Supply Chain Realignment
- 4.7 Industry Partnerships, Mergers and Acquisitions
- 4.8 Sustainability and Circular Economy Developments
- 4.9 Government and Private Sector Investment Trends
- 4.10 Emerging Business Models and Commercialization
- 4.11 Industry Developments and Announcements
Chapter 5 Europe Beer Market Production, Supply and Demand Analysis
- 5.1 Demand Trend and Consumption Analysis, 2018-2025
- 5.2 Demand Forecast, 2025-2035
- 5.3 Production and Output Trend, 2018-2025
- 5.4 Production and Output Forecast, 2025-2035
- 5.5 Installed Capacity and Capacity Utilization
- 5.6 Company-Wise Production Plants and Statistics
- 5.6.1 Installed Production Capacity
- 5.6.2 Actual Production
- 5.6.3 Planned Capacity and Expansion Targets
- 5.7 Supply Chain Structure and Procurement Trends
- 5.8 Supply-Demand Gap and Bottlenecks
- 5.9 Import Dependence and Sourcing Structure
- 5.10 Contract Manufacturing and Outsourcing
- 5.11 Regional Supply and Demand Concentration
Chapter 6 Europe Beer Market Pricing Analysis
- 6.1 Pricing Structure and Measurement
- 6.2 Historical Pricing Trends, 2018-2025
- 6.3 Pricing Outlook, 2025-2035
- 6.4 Average Selling Price and Unit Economics
- 6.5 Pricing by Product and Market Segment
- 6.6 Geographic Pricing Differences
- 6.7 Key Input, Energy, Labor and Logistics Costs
- 6.8 Contract Pricing and Purchasing Models
- 6.9 Pricing Sensitivity and Competitive Positioning
- 6.10 Price, Margin and Profitability Implications
Chapter 7 Europe Beer Market Dynamics
- 7.1 Market Growth Drivers
- 7.1.1 Demand-Side Drivers
- 7.1.2 Technology and Innovation Drivers
- 7.1.3 Infrastructure and Investment Drivers
- 7.1.4 Regulatory and Policy Drivers
- 7.2 Market Restraints
- 7.2.1 Cost and Affordability Constraints
- 7.2.2 Technology and Adoption Barriers
- 7.2.3 Supply Chain and Operational Constraints
- 7.3 Market Challenges
- 7.3.1 Competitive Pressure and Margin Erosion
- 7.3.2 Skills, Infrastructure and Implementation Gaps
- 7.4 Emerging Market Opportunities
- 7.5 Market Dynamics Impact and Time-Horizon Assessment
Chapter 8 Europe Beer Value Chain Analysis
- 8.1 Industry Value Chain Overview
- 8.2 Upstream Suppliers and Critical Inputs
- 8.3 Technology and Component Providers
- 8.4 Manufacturing or Service Delivery
- 8.5 Distribution, Channel Partners and Integrators
- 8.6 Downstream Applications and End Users
- 8.7 Value Addition and Profit Pools
- 8.8 Vertical Integration and Outsourcing
- 8.9 Supplier Concentration and Risk
- 8.10 Supply Chain Localization and Resilience
Chapter 9 Europe Beer Market Regulations and Policies
- 9.1 Relevant Laws, Standards and Compliance Frameworks
- 9.2 Product, Service, Safety and Quality Requirements
- 9.3 Government Policies, Incentives and Subsidies
- 9.4 Imports, Exports and Trade Barriers
- 9.5 Public Procurement and Local Content Requirements
- 9.6 Environmental and Sustainability Compliance
- 9.7 Upcoming Policy Changes and Market Implications
Chapter 10 Europe Beer Market Hotspots and Opportunities
- 10.1 Market Opportunity Mapping and Growth Hotspots
- 10.2 High-Growth Applications and Customer Groups
- 10.3 Underserved Markets and White-Space Opportunities
- 10.4 Emerging Technology and Product Opportunities
- 10.5 New Capacity and Investment Hotspots
- 10.6 Market Entry and Expansion Opportunities
- 10.7 Distribution and Partnership Opportunities
- 10.8 Near-Term and Long-Term Commercial Potential
- 10.9 Opportunity Attractiveness and Execution Risks
Chapter 11 Europe Beer Market Outlook, 2025-2035
- 11.1 Market Size and Analysis
- 11.1.1 Revenue (Market Measurement: 2025: USD 155.48 billion → 2035: USD 181.25 billion)
- 11.1.2 Market Volume and Quantity Sold
- 11.1.3 Historical Market Size, 2018-2025
- 11.1.4 Base-Year Market Size, 2025
- 11.2 Market Forecast, 2025-2035
- 11.2.1 Revenue Forecast to 2035
- 11.2.2 Volume Forecast to 2035
- 11.2.3 CAGR and Year-on-Year Growth
- 11.2.4 Incremental Revenue Opportunity
- 11.3 Forecast Assumptions and Scenario Analysis
- 11.3.1 Base-Case Forecast
- 11.3.2 Optimistic and Conservative Scenarios
- 11.3.3 Technology, Pricing and Policy Sensitivities
- 11.4 Market Attractiveness and Growth Outlook
Chapter 12 Europe Beer Market Segmentation and Outlook
- 12.1 Segmentation Summary and Market Shares, 2025
- 12.2 Largest and Fastest-Growing Segments
- 12.3 By Product Type - Market Size and Forecast, 2025-2035
- 12.3.1 Segment Definition and Scope
- 12.3.2 Historical Market Size, 2018-2025
- 12.3.3 Revenue Forecast, 2025-2035
- 12.3.4 Volume Forecast, 2025-2035
- 12.3.5 Base-Year Market Share, 2025
- 12.3.6 Segment CAGR and Growth Drivers
- 12.3.7 Subsegment Market Size and Forecast
- 12.3.7.1 Lager
- 12.3.7.2 Ale and Wheat Beer
- 12.3.7.3 Stout and Porter
- 12.3.7.4 Low/No-Alcohol Beer
- 12.3.8 Subsegment Pricing and Adoption Trends
- 12.3.9 Leading Suppliers and Competition
- 12.3.10 Regional Demand and Opportunities
- 12.4 By Price Tier - Market Size and Forecast, 2025-2035
- 12.4.1 Segment Definition and Scope
- 12.4.2 Historical Market Size, 2018-2025
- 12.4.3 Revenue Forecast, 2025-2035
- 12.4.4 Volume Forecast, 2025-2035
- 12.4.5 Base-Year Market Share, 2025
- 12.4.6 Segment CAGR and Growth Drivers
- 12.4.7 Subsegment Market Size and Forecast
- 12.4.7.1 Economy
- 12.4.7.2 Mainstream
- 12.4.7.3 Premium
- 12.4.7.4 Super-Premium
- 12.4.8 Subsegment Pricing and Adoption Trends
- 12.4.9 Leading Suppliers and Competition
- 12.4.10 Regional Demand and Opportunities
- 12.5 By Packaging Format - Market Size and Forecast, 2025-2035
- 12.5.1 Segment Definition and Scope
- 12.5.2 Historical Market Size, 2018-2025
- 12.5.3 Revenue Forecast, 2025-2035
- 12.5.4 Volume Forecast, 2025-2035
- 12.5.5 Base-Year Market Share, 2025
- 12.5.6 Segment CAGR and Growth Drivers
- 12.5.7 Subsegment Market Size and Forecast
- 12.5.7.1 Returnable Glass Bottles
- 12.5.7.2 One-Way Glass Bottles
- 12.5.7.3 Metal Cans
- 12.5.7.4 Draught Kegs
- 12.5.8 Subsegment Pricing and Adoption Trends
- 12.5.9 Leading Suppliers and Competition
- 12.5.10 Regional Demand and Opportunities
- 12.6 Segment Growth Comparison
- 12.7 Segment Attractiveness and Priority Matrix
Chapter 13 Europe Beer Geographic Market Outlook, 2025-2035
- 13.1 Regional Market Size and Country-Level Shares, 2025
- 13.2 Country Market Size Comparison, 2025
- 13.3 Country Market Forecasts, 2025-2035
- 13.4 Subregional Industrial and Demand Clusters
- 13.5 Intra-Regional Pricing and Cost Differences
- 13.6 Cross-Border Trade and Supply Networks
- 13.7 Regional Supply and Demand Balances
- 13.8 Country Opportunity Comparison and Prioritization
Note: Every listed country is covered on the structure shown under the first country.
Chapter 14 Europe Beer Technology, Innovation and Sustainability Outlook
- 14.1 Technology Landscape and Maturity
- 14.2 Product, Process and Service Innovation
- 14.3 AI, Automation and Digital Tools in the Industry
- 14.4 Technology Adoption and Performance Benchmarking
- 14.5 Innovation Pipeline and R&D Investment
- 14.6 Patent and Intellectual Property Trends
- 14.7 Energy Efficiency and Resource Management
- 14.8 Sustainability, Recycling and Circularity
- 14.9 Technology Roadmap, 2025-2035
- 14.10 Risks of Obsolescence and Technology Substitution
Chapter 15 Europe Beer Market Key Strategic Imperatives
- 15.1 Growth and Market Entry Priorities
- 15.2 High-Return Products and Segments
- 15.3 Pricing, Profitability and Cost Optimization
- 15.4 Technology Investment and Product Differentiation
- 15.5 Supply Chain Localization and Resilience
- 15.6 Distribution and Customer Acquisition
- 15.7 Partnership, Acquisition and Capacity Strategy
- 15.8 Regional Expansion Priorities
- 15.9 Short-, Medium- and Long-Term Actions
Chapter 16 Competition Outlook
- 16.1 Industry Competition Characteristics
- 16.2 Market Structure and Concentration
- 16.3 Market Share and Competitive Positioning, 2025
- 16.4 Company-Wise Revenue and Product Benchmarking
- 16.5 Production and Service Capacity Benchmarking
- 16.6 Technology, Pricing and Differentiation
- 16.7 Regional Footprint and Distribution Strength
- 16.8 Mergers, Acquisitions and Strategic Alliances
- 16.9 New Entrants and Competitive Threats
- 16.10 Porter's Five Forces and Industry Attractiveness
- 16.11 Competitive Outlook, 2025-2035
Chapter 17 Company Profiles
- 17.1 Company Coverage and Selection Criteria
- 17.2 Anheuser-Busch InBev
- 17.2.1 Business Description
- 17.2.2 Company Ownership and Geographic Presence
- 17.2.3 Product and Service Portfolio
- 17.2.4 Manufacturing and Operating Footprint
- 17.2.5 Production Capacity and Expansion Plans
- 17.2.6 Financial Performance and Investment
- 17.2.7 Market Share and Competitive Position
- 17.2.8 Technology and Innovation Capabilities
- 17.2.9 Strategic Alliances or Partnerships
- 17.2.10 Recent Developments
- 17.2.11 Growth Strategy and Outlook
- 17.3 HEINEKEN
- 17.4 Carlsberg Group
- 17.5 Asahi Europe & International
- 17.6 Molson Coors Beverage Company
- 17.7 Royal Unibrew
- 17.8 Mahou San Miguel
- 17.9 Damm
- 17.10 Oettinger Brauerei GmbH
- 17.11 Bitburger Braugruppe GmbH
- 17.12 Other Relevant Market Participants
Note: Every listed company is profiled on the structure shown under the first company. The company list is preliminary and may change based on research findings, market developments, data availability and client requirements.
Chapter 18 Disclaimer
- 18.1 Research and Forecast Disclaimer
- 18.2 Data Source and Estimation Limitations
Note: The depth of individual sections depends on data availability for this market. Volume, capacity, trade and other unit-based metrics are included where applicable.

