
India sports nutrition and supplements moves past the gym
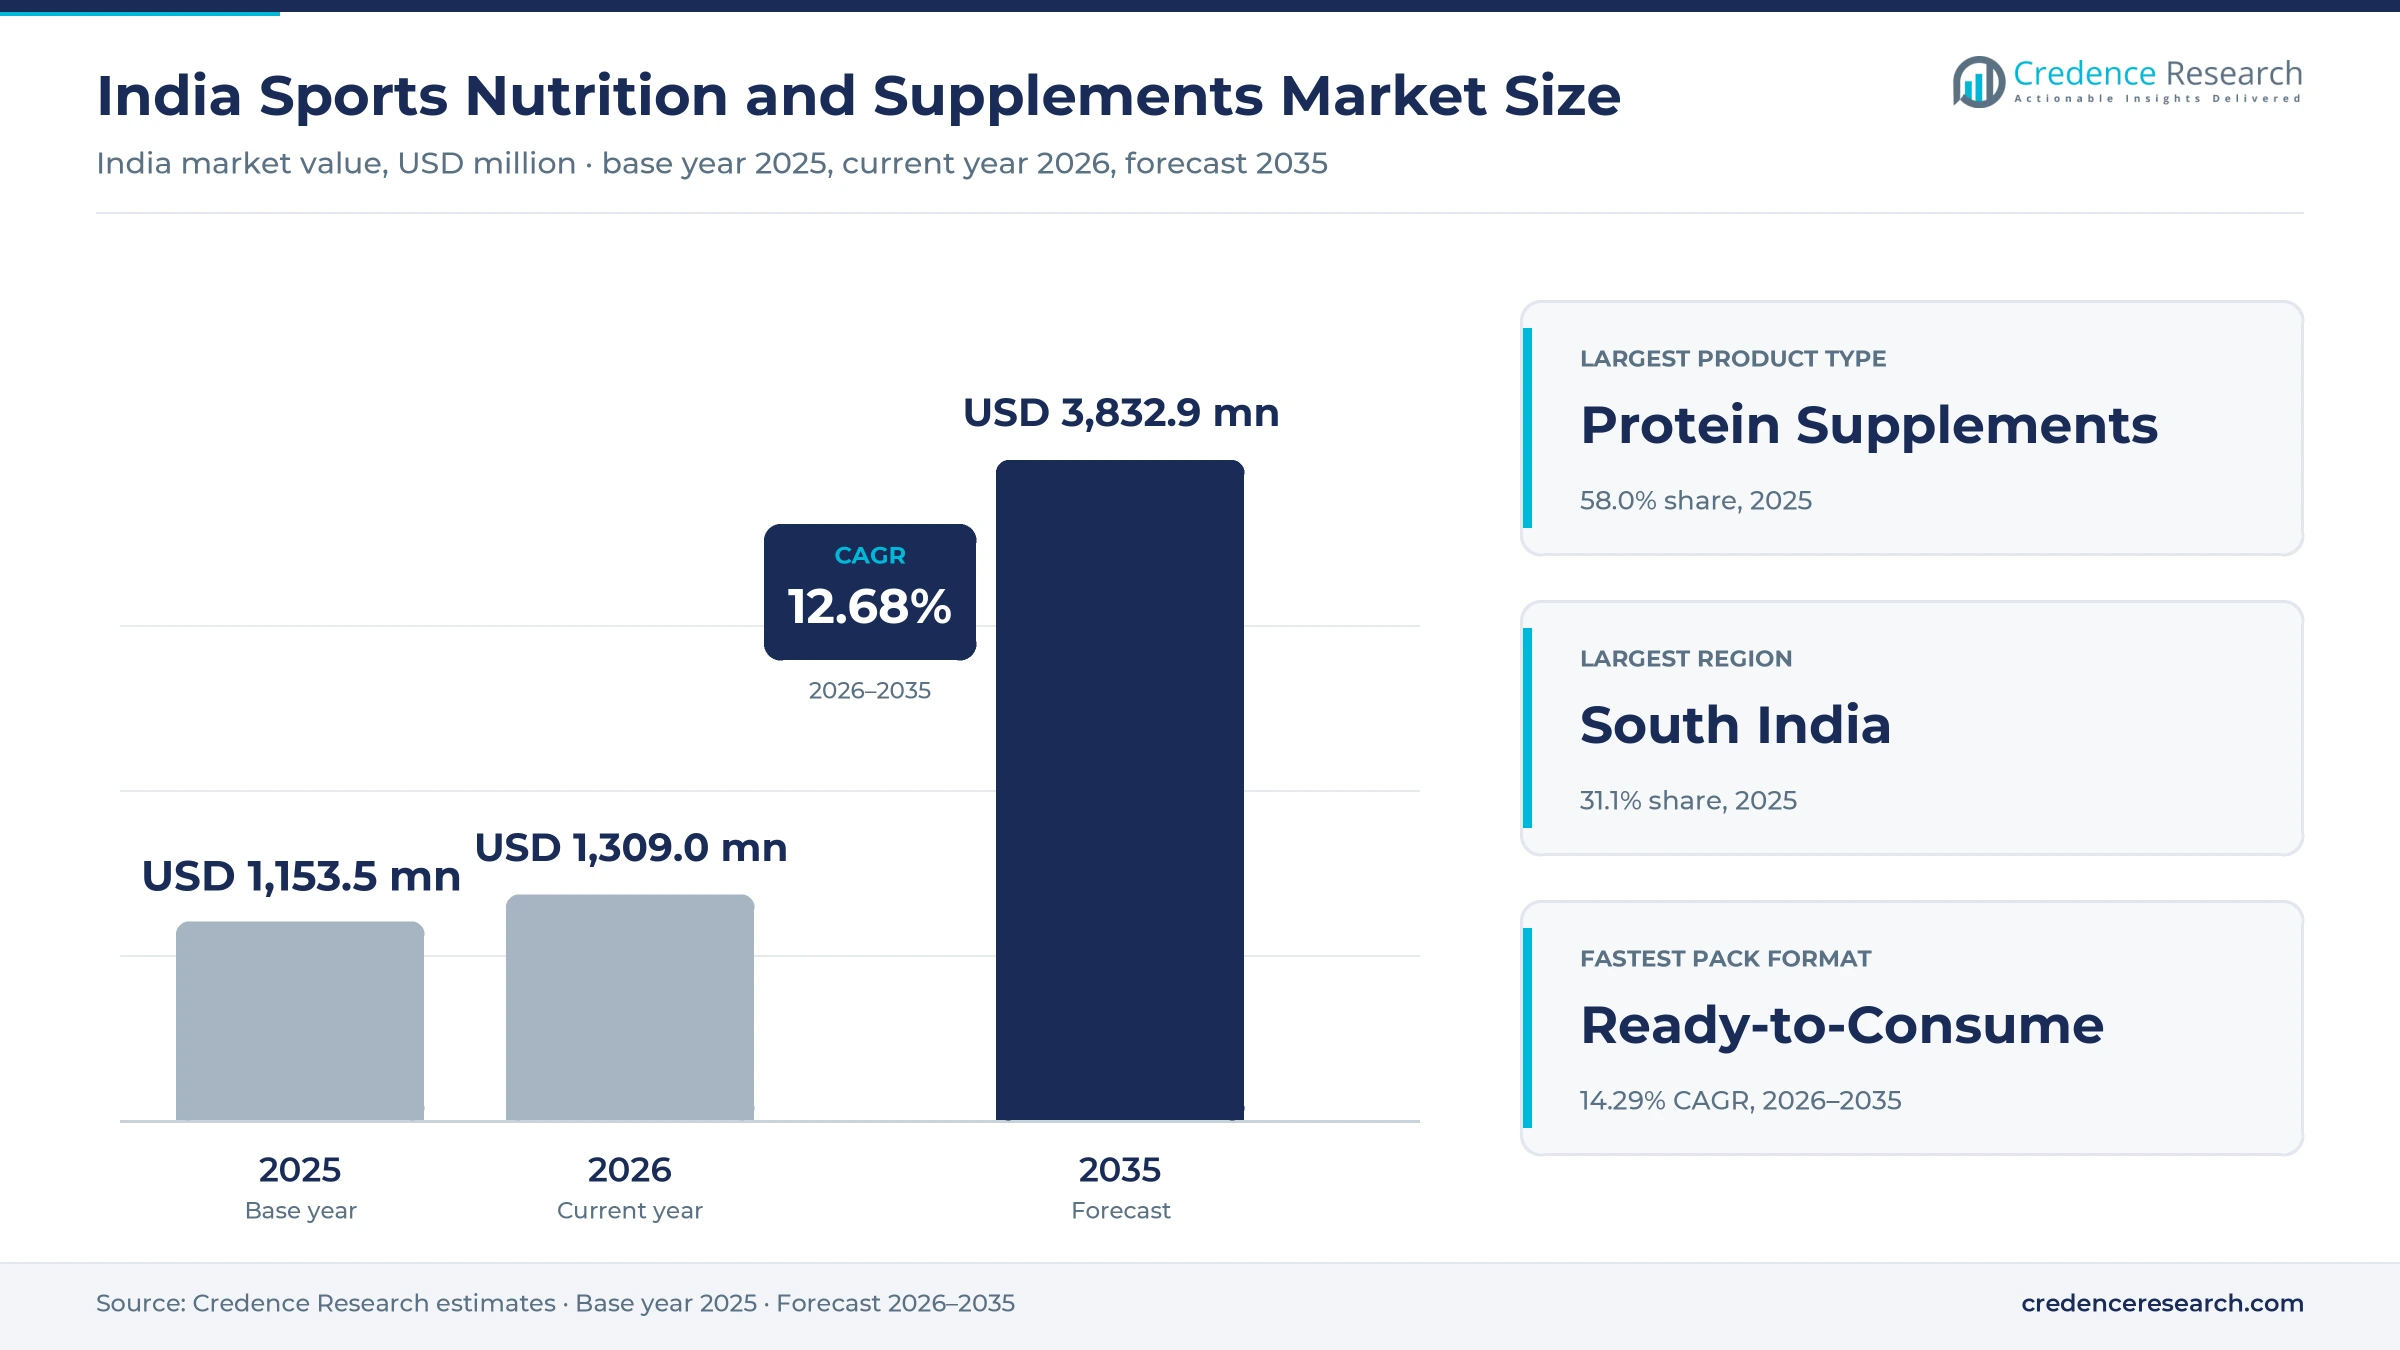
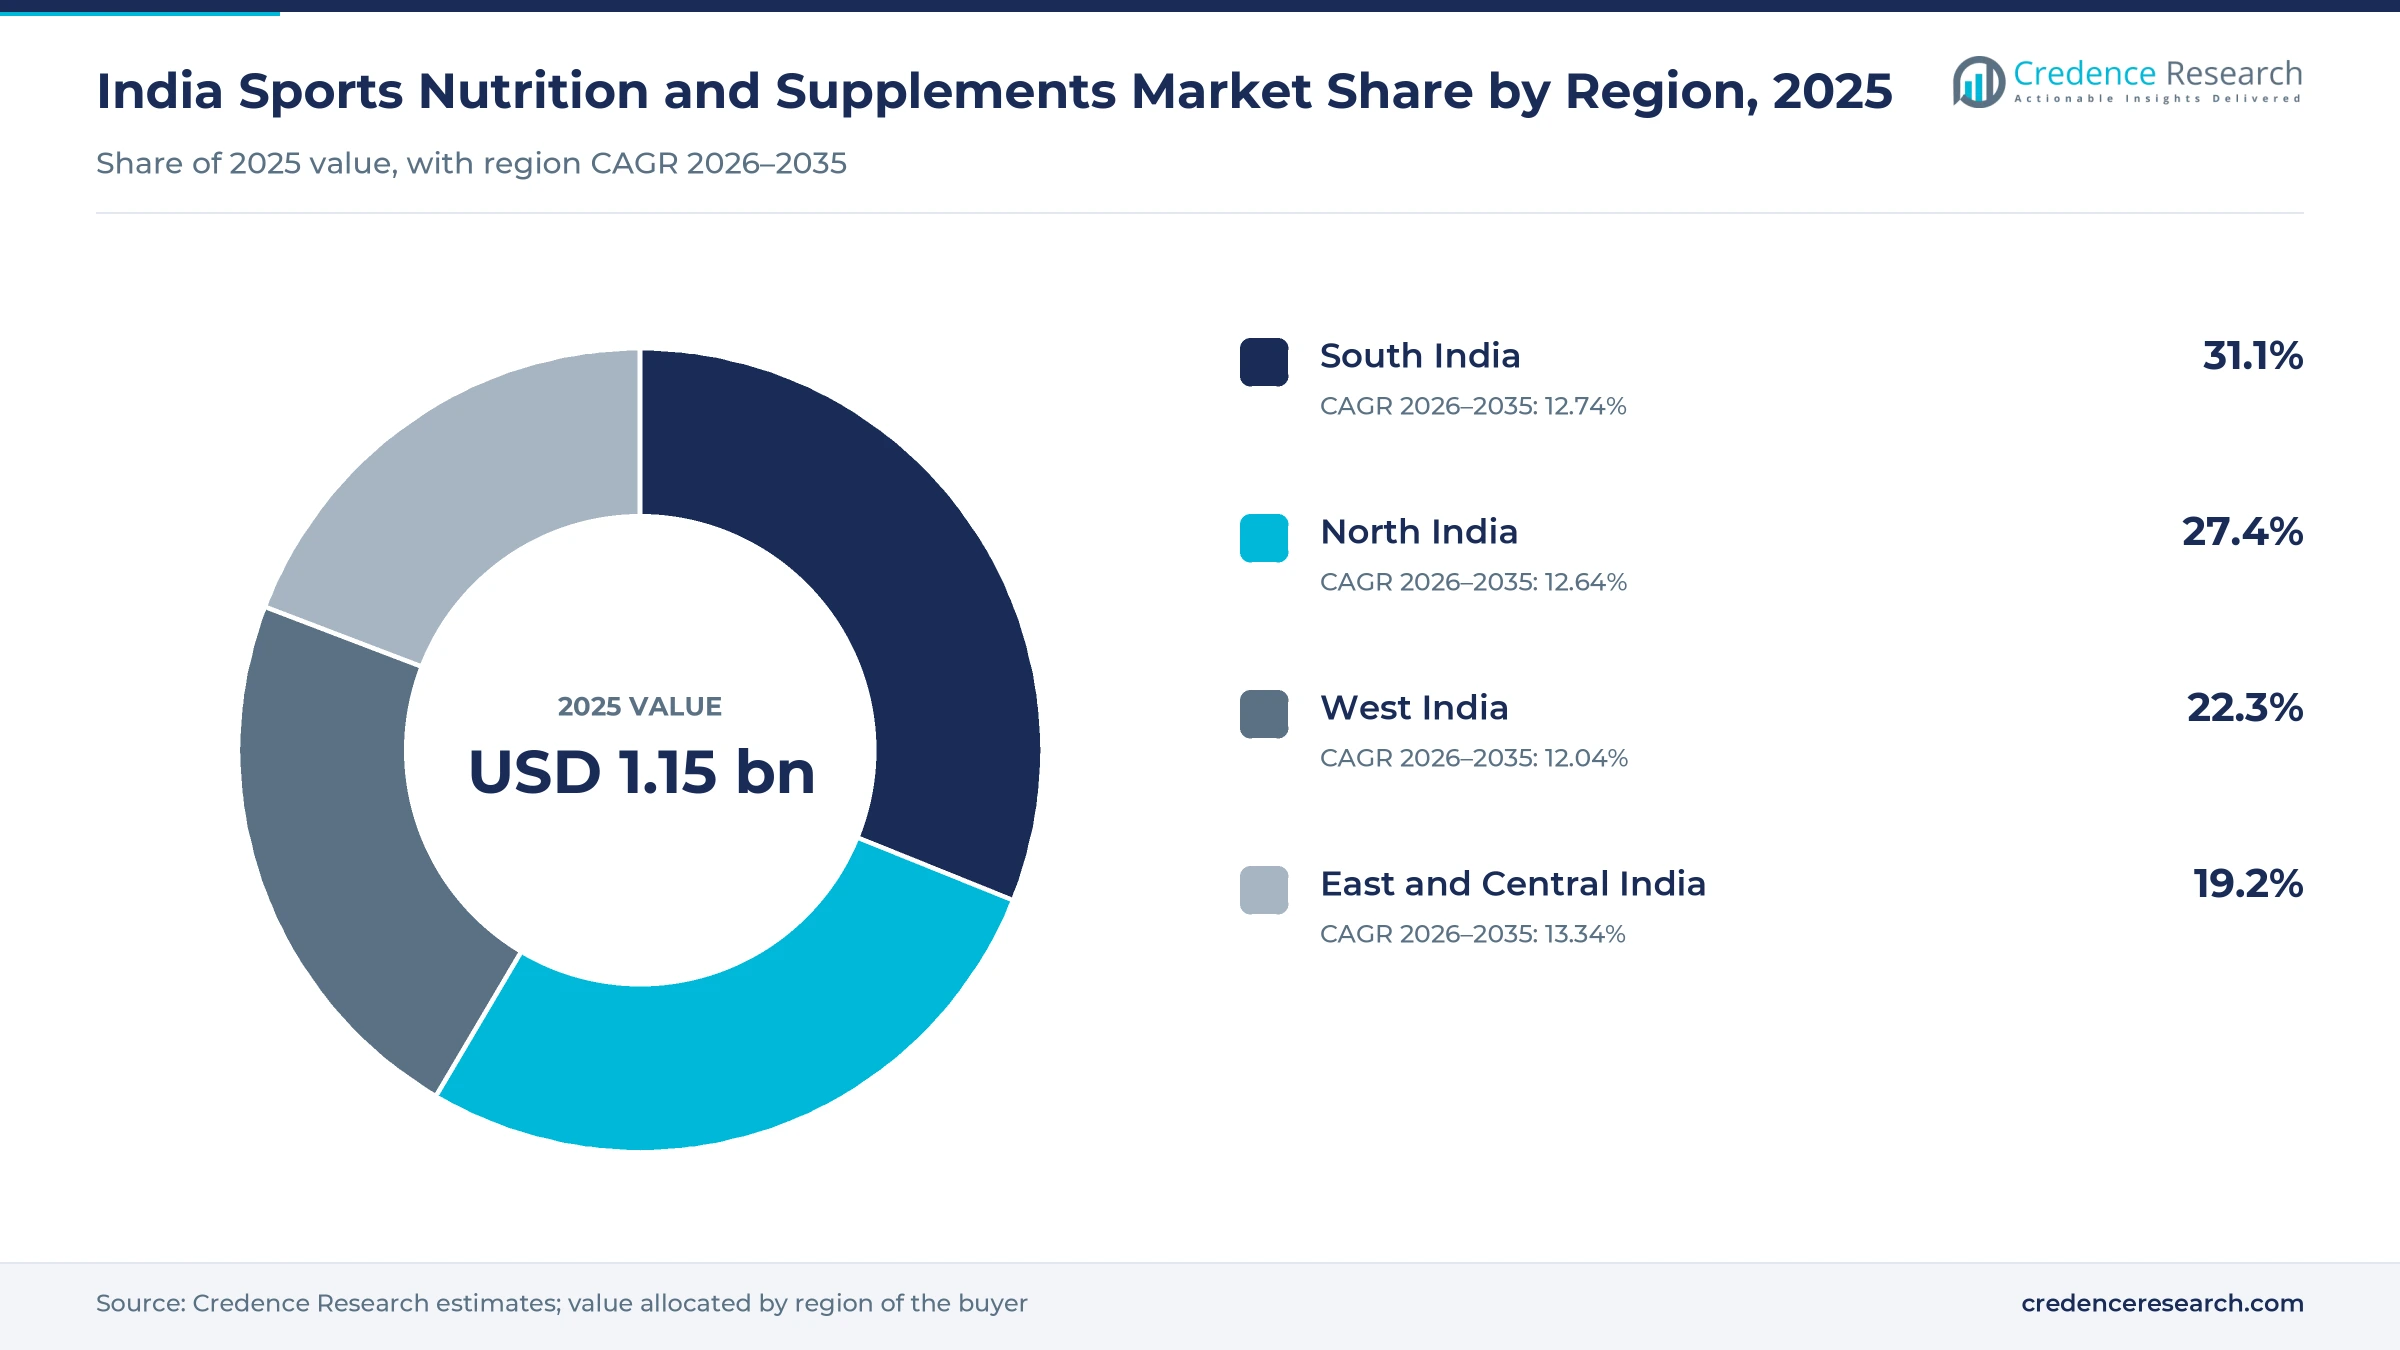
The India sports nutrition and supplements market was valued at USD 1.15 billion in 2025 and is projected to increase from USD 1.31 billion in 2026 to USD 3.83 billion by 2035, registering a CAGR of 12.68% during 2026–2035. Demand comes from gym members, recreational runners and a widening group of households that now buy protein for daily intake rather than for competition. South India held the largest regional share, 31.1% in 2025, helped by high urban spending in Telangana, Tamil Nadu and Karnataka and by strong protein ordering in Bengaluru. East and Central India is the fastest-growing region at 13.34% a year as retailers move into Tier 2 and Tier 3 cities. The main commercial change is a tax cut, since the goods and services tax on nutraceuticals fell from 18% to 5% in September 2025. However, imported whey costs have since absorbed much of that relief and pushed shelf prices higher.
Which products and buyers does this market count?
The market counts branded protein powders, amino acids, creatine, pre-workout blends, hydration mixes and sports foods sold to consumers across India. Buyers range from first-time gym members to endurance athletes, and most of them purchase through marketplaces, brand websites, specialty stores, gyms and pharmacies.
Whole foods such as eggs and paneer, general vitamins without a performance claim, and clinical nutrition sold on prescription are excluded. The value chain runs from imported or domestic whey through contract manufacturing and testing to brand owners, retailers and quick commerce platforms.
India Sports Nutrition and Supplements Market Insights
- The market grows from USD 1.15 billion in 2025 to USD 3.83 billion by 2035, a 12.68% CAGR, as protein moves from gym shelves into household shopping baskets.
- South India led with 31.1% of value in 2025, while East and Central India grows fastest at 13.34% a year through 2035.
- Protein Supplements held 58.0% of value in 2025, even after imported whey concentrate prices more than tripled from early 2024 levels.
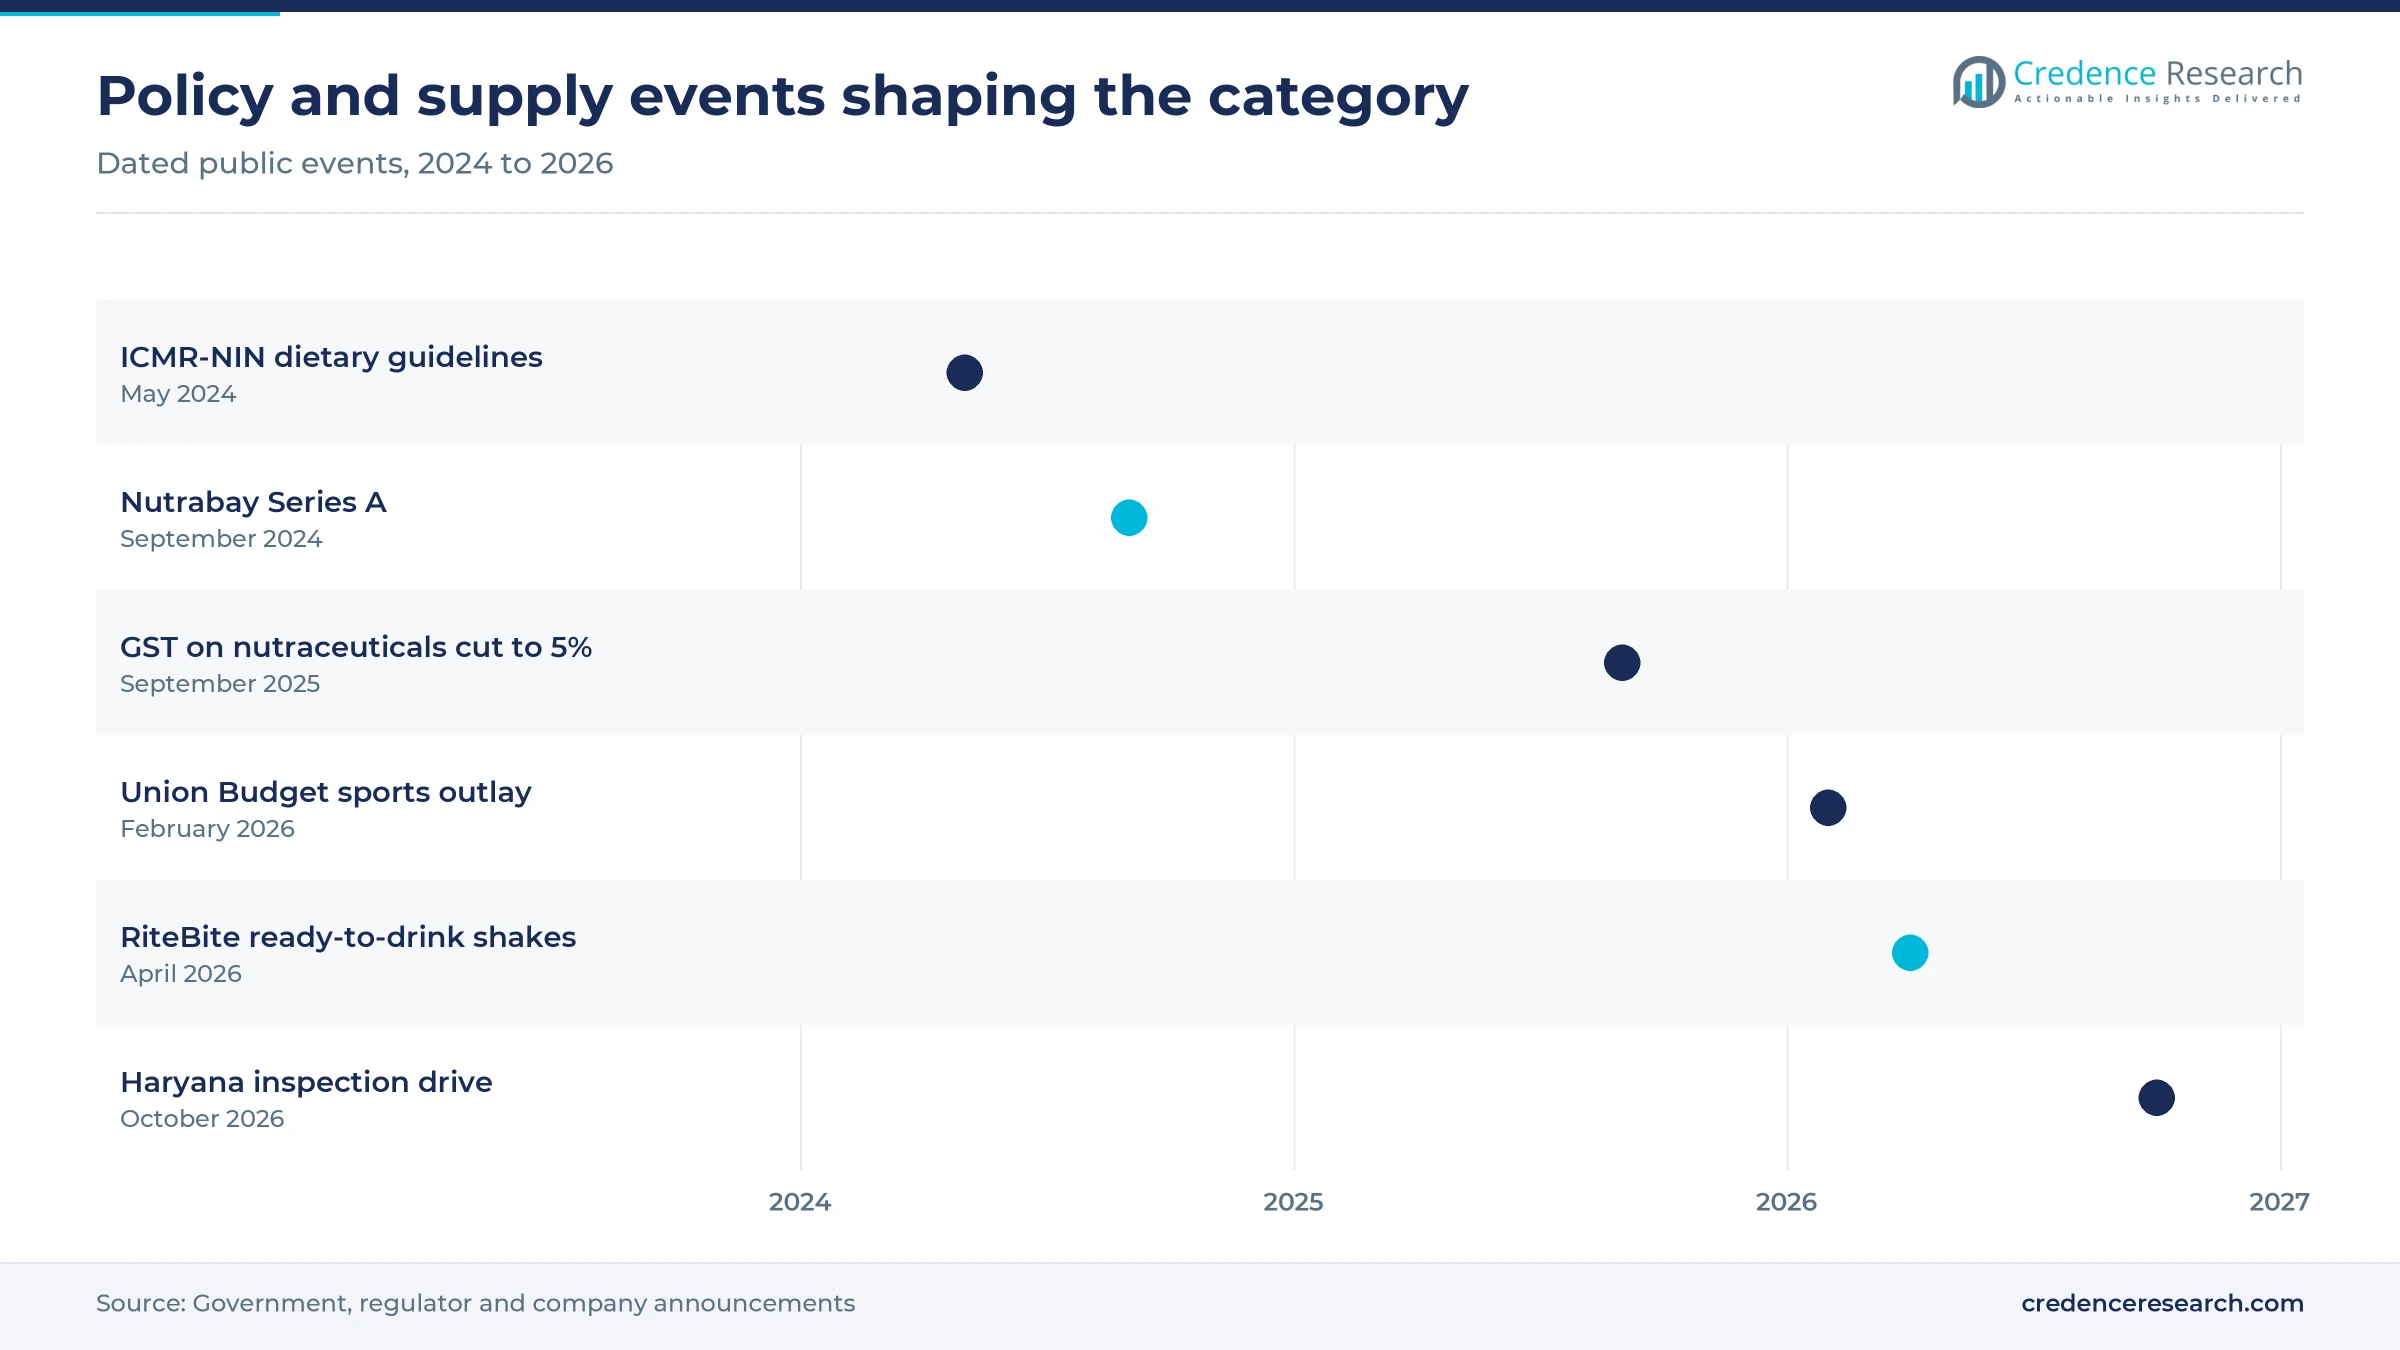
- The goods and services tax on nutraceuticals fell from 18% to 5% on Sept. 22, 2025, the first such cut in eight years for the sector.
- HealthKart ran 240 company-owned stores in 140 cities by December 2025, showing how domestic platforms now combine digital reach with physical retail.
Whey tubs lead while ready-to-consume formats gain
Why does protein still dominate the product mix?
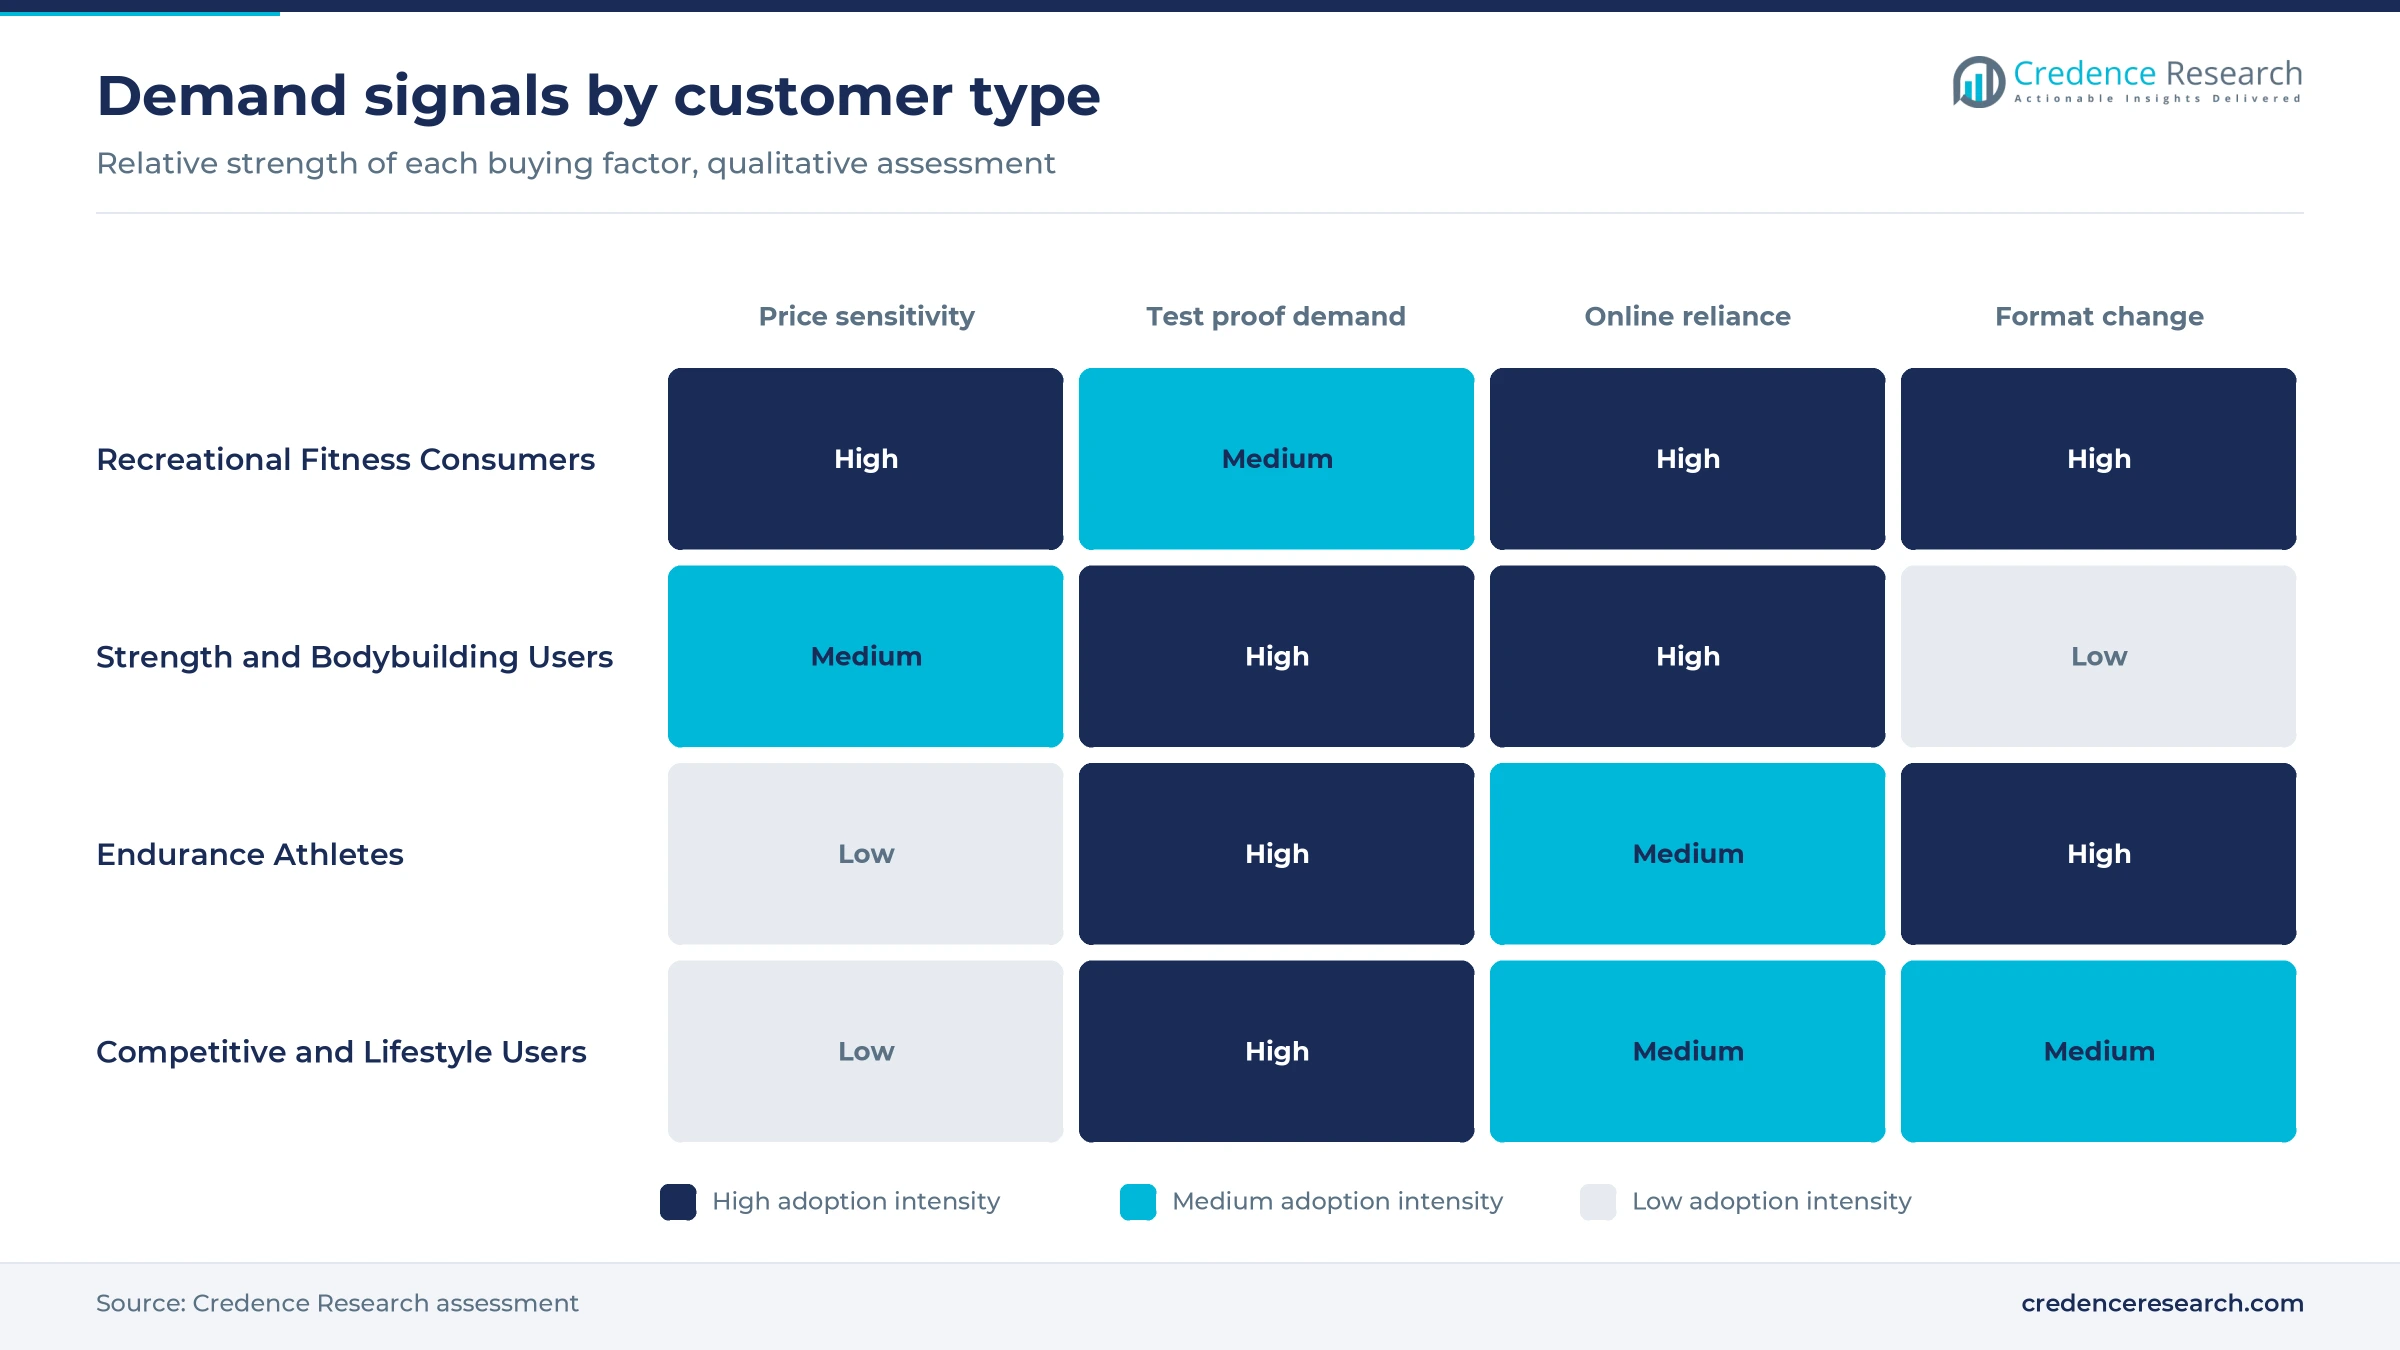
Based on product type, the market is categorized into protein supplements, performance amino acids, pre-workout and creatine, and hydration and sports foods. Protein Supplements led with 58.0% of 2025 value because whey remains the anchor purchase, and demand held even though all 11 bestselling whey products compared on Amazon India by BW Retail World became more expensive over two years. Hydration and Sports Foods grows fastest at 14.05% a year as everyday formats widen the category, with Instamart reporting in May 2026 that protein milk and shakes rose 225% and protein snacks nearly 300% year on year.
Which customers set the volume and which add the most growth?
Based on customer type, the market is categorized into recreational fitness consumers, strength and bodybuilding users, endurance athletes and competitive and lifestyle users. Recreational Fitness Consumers led with 44.0% of 2025 value because Health Club Management reported 12.3 million gym memberships for 2024, a base far larger than the competitive athletics community. Endurance Athletes grow fastest at 13.89% a year as participation climbs, with the January 2026 Tata Mumbai Marathon recording 69,100 registrations and a record 14,059 full marathon runners, according to organizer Procam.
How are online and physical channels dividing sales?
Based on distribution channel, the market is categorized into brand D2C websites, online marketplaces, health and nutrition specialty stores, and fitness and pharmacy channels. Online Marketplaces led with 38.0% of 2025 value because shoppers now compare whey prices on these platforms, and HealthKart told Indian Retailer in December 2025 that about 40% of its sales came through e-commerce and quick commerce. Online Marketplaces also grow fastest at 13.52% a year as quick commerce adds range, with Instamart listing nearly 10,000 protein products by May 2026 after protein orders rose 150% over two years.
Why are smaller and drinkable packs gaining ground?
Based on packaging format, the market is categorized into tubs and jars, stand-up pouches, single-serve formats and ready-to-consume formats. Tubs and Jars led with 62.0% of 2025 value because repeat buyers still favor large tubs, even as Iron Asylum founder Vishu Menon told BW Retail World in July 2026 that first-time buyers no longer prefer 5 lb or 10 lb tubs. Ready-to-Consume Formats grow fastest at 14.29% a year as brands add convenience, shown by the RiteBite Max Protein shake of 26 grams per 250 milliliters that Zydus Wellness introduced in April 2026.
| Segment Group | Leading Sub-segment | Share, 2025 | Fastest-growing Sub-segment | CAGR, 2026–2035 |
|---|---|---|---|---|
| By Product Type | Protein Supplements | 58.0% | Hydration and Sports Foods | 14.05% |
| By Customer Type | Recreational Fitness Consumers | 44.0% | Endurance Athletes | 13.89% |
| By Distribution Channel | Online Marketplaces | 38.0% | Online Marketplaces | 13.52% |
| By Packaging Format | Tubs and Jars | 62.0% | Ready-to-Consume Formats | 14.29% |
Request a Free Sample
Fill in your details and we'll send you a free sample report.
- Sample data tables & charts
- Research methodology
Gym memberships, tax relief and online reach lift buying
How is India's fitness and sports ecosystem widening the buyer base?
A larger paid fitness base is the strongest demand lever, because gym members buy protein on a routine schedule. Health Club Management reported in August 2026 that memberships are projected to rise from 12.3 million in 2024 to 23.2 million in 2030. Public money points the same way, since the 2026-27 Union Budget set the sports ministry outlay at INR 4,479.88 crore, up from the INR 3,346 crore revised estimate, and announced a decade-long Khelo India Mission. Event formats add another buyer group, as Hyrox Mumbai drew more than 3,350 athletes from 50 countries in September 2025, nearly double its debut, The Tribune reported.
What is pulling protein into everyday and preventive nutrition?
Protein has moved from gym shelves into household shopping, which enlarges the category well beyond athletes. A February 2026 LocalCircles and Country Delight survey with more than 207,000 responses across 25 districts found six in 10 urban Indians do not eat protein-rich foods daily, and nearly three-quarters did not know their recommended intake. As a result, brands now sell a daily protein gap rather than a muscle goal. The World Health Organization also puts insufficient physical activity at 49.4% of Indian adults in 2022, including 57.2% of women, which keeps preventive health on the household agenda. Recreational buyers already hold 44.0% of value, and this group is where that message lands first.
How are digital distribution and formal brands changing access?
Formal brands and digital platforms have reduced the role of unorganized supplement shops, which raises both reach and trust. HealthKart operated 240 company-owned stores across 140 cities in December 2025 and targets more than 500 within three to four years. Nutrabay, a Gurugram retailer carrying over 100 brands, raised a USD 5 million Series A led by RPSG Capital Ventures in September 2024, according to Entrackr. Myprotein moved from a distributor model to its own Indian entity about three years before August 2025, as afaqs reported. This shift also feeds wider e-commerce growth, since replenishment purchases repeat on a monthly cycle and suit stored payment and delivery habits.
Did tax relief and local manufacturing lower the entry price?
Lower tax and local processing have widened the affordable tier, even with costly imports. The goods and services tax on protein powder and other nutraceuticals fell from 18% to 5% on Sept. 22, 2025, the first cut in eight years, and Commerce Minister Piyush Goyal urged firms to pass on the saving. Upstox reported in August 2025 that Amul whey sold at about INR 2.67 per gram, against INR 3.43 for MuscleBlaze and INR 5.08 for Optimum Nutrition. Parag Milk Foods has also invested INR 200 crore to INR 250 crore in a whey filtration plant, which gives its Avvatar brand a domestic supply base that imported-whey rivals lack.
Tested labels and tier 2 cities reshape the category
Shift toward tested and traceable labels
Proof of quality is becoming a selling point, because buyers have seen public evidence of failures. The Citizens Protein Project, published in the journal Medicine and reported by Business Standard in July 2025, tested 36 popular protein powders and found that 70% misrepresented their protein content. It also reported aflatoxins in 14% of samples and pesticide residues in 8.3%. Brands have responded with visible testing claims, since HealthKart launched a home protein testing kit and SuperYou says each batch of its creatine is NABL laboratory tested. In turn, third-party certificates are moving from fine print to the front of the pack.
Rise of creatine, drinkable and snack formats
Newer formats are pulling in buyers who would not open a large tub of powder. SuperYou launched a 100-gram creatine monohydrate pouch at INR 599 in March 2026, a price point that invites trial. Zydus Wellness extended RiteBite Max Protein into ready-to-drink shakes with 26 grams of protein per 250 milliliters in April 2026, according to FoodTechBiz. Instamart data published in May 2026 showed protein yogurt up about 280% and protein snacks up nearly 300% year on year. These signals explain why Hydration and Sports Foods is the fastest product group at 14.05% a year, and why brands are now building ranges beyond powder.
Opportunity in tier 2 and tier 3 city retail
Smaller cities offer the clearest open ground for brands with sharp pricing and local stores. IBEF reported in May 2026 that protein consumption growth in Tier 2 and Tier 3 cities is outpacing larger urban centers. About 50% of Myprotein sales in India reportedly come from those cities, according to afaqs in August 2025. HealthKart is directing its next stores to Tier 2 and Tier 3 markets in Southwest, East and Central India, while BigMuscles Nutrition told NutraIngredients in April 2026 that it is moving to an omnichannel model for the same towns. Brands that pair trial packs with assisted selling can reach these buyers before habits and loyalties harden.
Opportunity in domestic whey processing
Local whey capacity is the largest supply-side opening, because imports leave brands exposed on both price and currency. India imports an estimated 80% to 90% of supplement-grade whey, and the Financial Express reported in March 2026 that domestic production meets less than a tenth of demand. Amul has access to nearly 3 million liters of whey a day and targets a five-fold rise in protein capacity, according to Upstox in August 2025. Parag Milk Foods announced in June 2025 that it will double cheese capacity from 60 to 120 metric tons, which also lifts whey output. Processors that supply whey protein ingredients to contract manufacturers could capture margin that now leaves the country.
Whey costs and product quality test brand trust
How far have whey costs squeezed brands?
Imported whey concentrate rose from about INR 700 to INR 800 per kilogram in early 2024 to INR 2,300 to INR 3,000 by July 2026, according to BW Retail World, and prices of 11 bestselling products rose 32% on average. Only What's Needed told NutraIngredients that its whey raw material cost INR 3,700 per kilogram in June 2026, against INR 1,475 a year earlier. HealthKart, which owns MuscleBlaze, said whey concentrate costs have more than tripled in two years and that it raised prices while absorbing part of the increase, The Core reported in 2026.
Can buyers trust what is on the label?
Label accuracy remains a serious weakness, since the Food Safety and Standards Authority of India does not approve dietary supplements before sale, as Business Standard noted in July 2025. Enforcement is now rising at state level, and Haryana inspectors covered 61 sites and collected 73 samples of supplements and energy beverages in October 2026, according to ThePrint. Honest brands therefore carry testing costs that low-priced rivals avoid, so certification and retailer screening are the practical defenses for now.
Does official dietary advice slow mainstream adoption?
Official caution limits how far protein powder can move into general health messaging. The National Institute of Nutrition, under the Indian Council of Medical Research, urged consumers in May 2024 to avoid protein supplements for muscle gain, citing bone mineral loss and kidney damage from long-term high intake, according to ThePrint. The same guidelines attribute 56.4% of the national disease burden to unhealthy diets, so the advice carries weight with families. Consequently, brands must rely on dosing clarity, clinical references and food-based formats to win skeptical households in smaller towns.
Will spending power cap reach beyond the top cities?
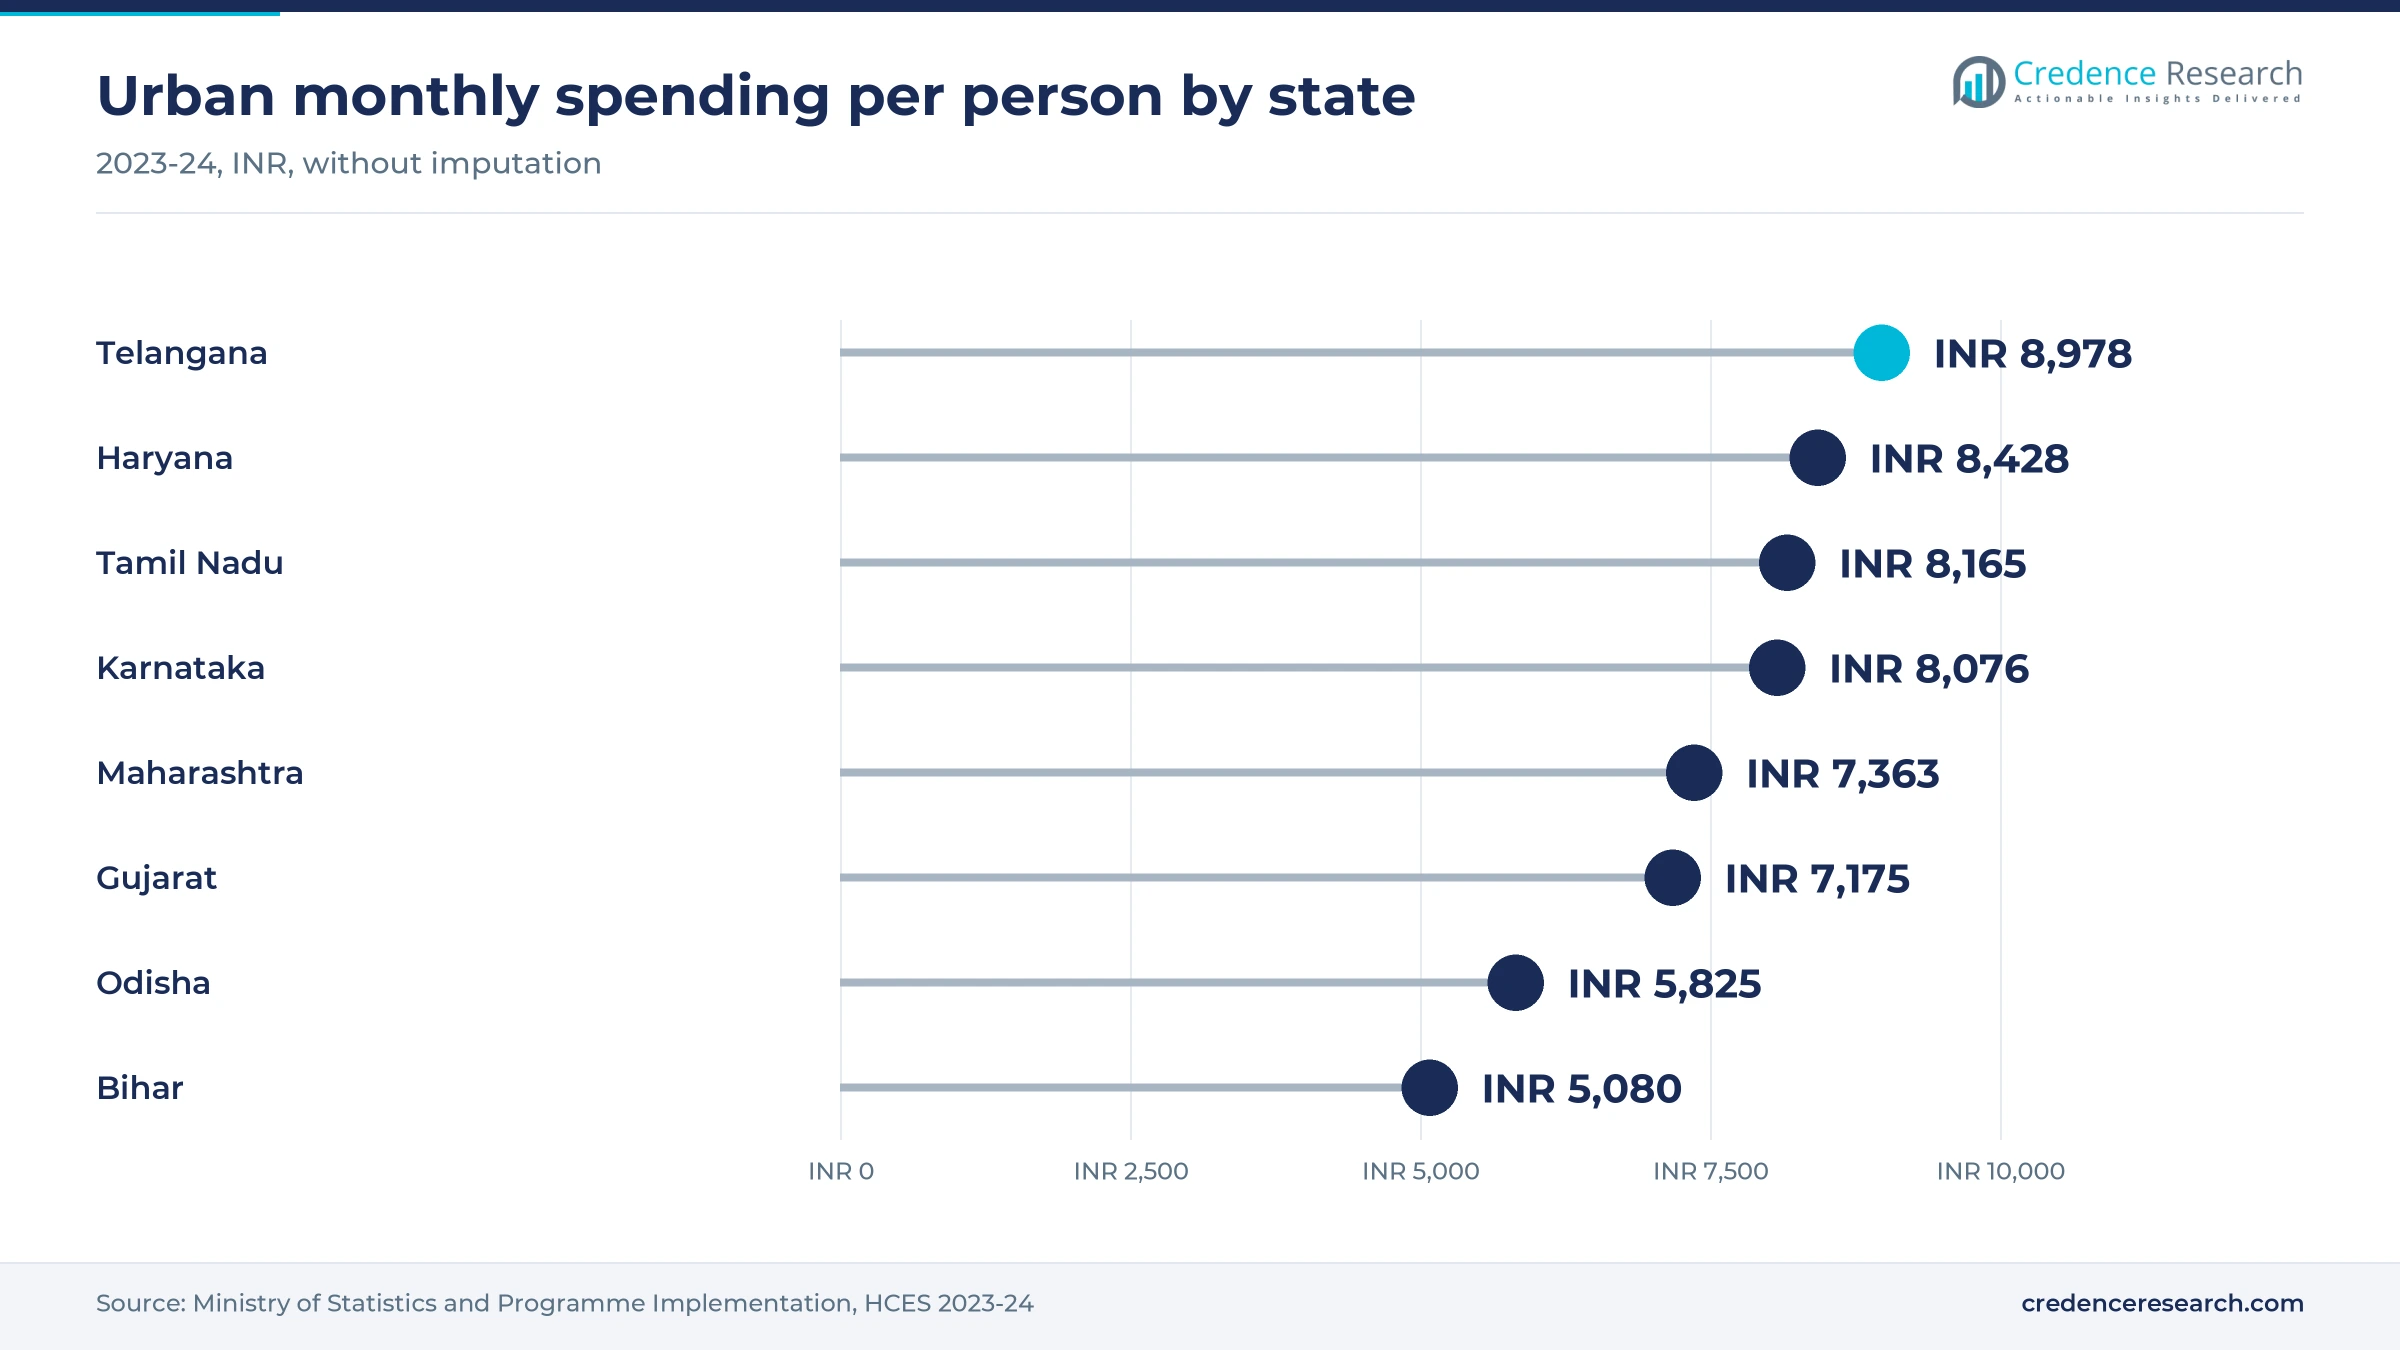
Household budgets restrict repeat purchases outside the higher-income states, even after the tax cut. Ministry of Statistics data show urban monthly spending per person of INR 5,080 in Bihar and INR 4,927 in Chhattisgarh in 2023-24, against INR 8,978 in Telangana. BeastLife co-founder Raj Vikram Gupta told BW Retail World in July 2026 that a user who was paying INR 2,500 to INR 3,000 per kilogram of protein now faces a much higher price. That is a large monthly commitment, so smaller packs matter for reach.
South India leads as East and Central zones catch up
| Region | Value, 2025 (USD billion) | Share, 2025 | CAGR, 2026–2035 |
|---|---|---|---|
| South India | 0.36 | 31.1% | 12.74% |
| North India | 0.32 | 27.4% | 12.64% |
| West India | 0.26 | 22.3% | 12.04% |
| East and Central India | 0.22 | 19.2% | 13.34% |
South India leads on income and protein ordering
The South India region held a 31.1% share of 2025 value and grows at 12.74% a year. Urban monthly spending per person reached INR 8,978 in Telangana, INR 8,165 in Tamil Nadu and INR 8,076 in Karnataka, according to the Household Consumption Expenditure Survey 2023-24, all above the national INR 6,996. Instamart also names Bengaluru as the city leading protein demand, while Vizag features among its fast-rising smaller markets. Bengaluru also hosts Hyrox events, which adds a visible performance audience in this zone.
North India pairs high spending with supply and enforcement
The North India region held a 27.4% share of 2025 value and grows at 12.64% a year. Haryana records urban monthly spending of INR 8,428 per person, and Delhi hosts Hyrox events while Noida is an announced next venue, according to Health Club Management. The zone also holds supply, since Optimum Nutrition partnered with Tirupati Life Sciences in Himachal Pradesh in August 2021 for local production, and Nutrabay is based in Gurugram. Enforcement is also visible here, following the Haryana drive that began in October 2026.
West India draws on events and dairy processing
The West India region held a 22.3% share of 2025 value and grows at 12.04% a year. Mumbai anchors endurance demand through the Tata Mumbai Marathon and the Hyrox race, which drew more than 3,350 athletes in 2025, while Ahmedabad is an announced Hyrox venue. Urban monthly spending stood at INR 7,363 in Maharashtra and INR 7,175 in Gujarat in 2023-24. The zone also adds dairy inputs, since Parag Milk Foods plans a 500-acre greenfield facility at Bota in Nashik, according to Dairy Business MEA in June 2025.
East and Central India grows from a lower base
The East and Central India region held a 19.2% share of 2025 value and is the fastest zone at 13.34% a year. Urban monthly spending remains lower, at INR 5,775 in West Bengal, INR 5,825 in Odisha and INR 5,538 in Madhya Pradesh in 2023-24. However, Instamart lists Bhubaneswar, Guwahati and Nagpur among its key smaller protein markets, and HealthKart has said its next stores will target East and Central India. Pack size and price therefore decide adoption across this zone.
Athlete deals and new formats mark the past two years
| Development | Status and market relevance |
|---|---|
| In September 2026, Herbalife India announced a partnership as Official Nutrition Partner for the Indian contingent at the 20th Asian Games in Aichi-Nagoya. | Announced; raises sports credibility for its daily and performance ranges |
| In April 2026, Zydus Wellness introduced RiteBite Max Protein ready-to-drink shakes with 26 grams of protein per 250 milliliters. | Launched; widens ready-to-consume choice in mainstream retail |
| In March 2026, SuperYou launched a 100-gram creatine monohydrate pouch at INR 599 under its Pro line. | Launched; lowers the trial price for creatine |
| In December 2025, HealthKart said it would expand from 240 stores toward about 300 by the end of the next financial year. | Under way; focuses on Tier 2 and Tier 3 cities |
| In June 2025, Parag Milk Foods announced a plan to invest INR 400 crore over three to four years, including capacity for its Avvatar business. | Under way; supports domestic whey-based supply |
Testing, filtration and format science set product edges
- Batch testing gives brands a checkable claim, since SuperYou says each creatine batch goes through an accredited laboratory.
- Home protein test kits let buyers verify a label themselves, and HealthKart has launched one, which shifts part of the checking to the customer.
- Whey filtration allows a dairy company to turn a cheese by-product into a protein ingredient, which is the basis of the Parag Milk Foods plant.
- Micronized creatine is the form SuperYou Pro uses, in a 200-mesh grade with an added probiotic, which gives a specification buyers can compare.
- Drinkable processing packs 26 grams of protein into a 250-milliliter serving, as the RiteBite Max Protein shake shows.
Need a Custom Version of This Report?
Tailor the scope, geography, or segments to your exact requirements.
- Custom geography or segment scope
- Direct access to our analyst team
Domestic platforms press global whey brands on price
Competition splits into domestic platforms, global whey brands and dairy-backed entrants. HealthKart combines MuscleBlaze with its own stores and websites, while Nutrabay pairs a multi-brand store with private labels. Optimum Nutrition holds the premium end, and its Gold Standard Whey rose only about 10.9% in the BW Retail World price comparison, the smallest rise among 11 products. MuscleBlaze Biozyme Performance moved far more, from about INR 1,800 to INR 3,599. Dairy-backed Avvatar and Amul compete from a raw material position that pure brands lack. Herbalife leans on athlete partnerships, including its 2026 Asian Games role for the Indian contingent. Fast&Up spans hydration, protein and weight management and parent Fullife Healthcare, which sells more than 100 products in over 40 countries, raised INR 300 crore in a round led by Elev8 in March 2026, Outlook Business reported. Price, proof of testing and access to whey now decide share.
Companies profiled and their roles in this market
| Company | Type | Role in the market |
|---|---|---|
| Bright Lifecare Pvt Ltd (HealthKart / MuscleBlaze) | Domestic platform | 240 company-owned stores in 140 cities plus own websites, as of December 2025 |
| Glanbia Performance Nutrition India Pvt Ltd (Optimum Nutrition) | Global brand | Local production with Tirupati Life Sciences in Himachal Pradesh since August 2021 |
| Herbalife International India Pvt Ltd | Global brand | Official Nutrition Partner for the Indian contingent at the 2026 Asian Games |
| Aeronutrix Sports Products Pvt Ltd (Fast&Up) | Domestic brand | Hydration and sports range under parent Fullife Healthcare; INR 300 crore round in March 2026 |
| Parag Milk Foods Ltd (Avvatar) | Dairy-backed brand | Vegetarian whey from its own filtration plant |
| Nutrabay Retail Pvt Ltd | Multi-brand retailer | Over 100 brands plus private labels; Series A in September 2024 |
| BigMuscles Nutrition Pvt Ltd | Domestic brand | Moving to an omnichannel model for Tier 2 and Tier 3 cities in 2026 |
| THG Nutrition Ltd (Myprotein) | Global brand | Own Indian entity; expanding beyond its website into marketplaces and gyms |
| GNC Holdings LLC | Global brand | Guardian Healthcare Services named sole India reseller, reported in March 2018 |
| Iovate Health Sciences International Inc (MuscleTech) | Global brand | Launched Platinum Series 100% Whey Isolate in India in April 2023 |
Sourcing control will separate winners from followers
Credence Research's view is that access to affordable whey will matter more than marketing over the next five years. Prices for imported concentrate more than tripled from early 2024, so brands without dairy links or long-term contracts face a margin squeeze that advertising cannot fix. The opportunity sits with companies that can secure domestic protein, prove quality in public and sell smaller packs in lower-income states. The India sports nutrition and supplements market can sustain 12.68% annual growth on this view, yet that assumes whey prices stabilize and that enforcement removes the worst products without damaging confidence in the category as a whole.
How the estimates were built and what they rest on
The report uses 2025 as the base year and forecasts through 2035, with market values from the Credence Research model. Segment and regional splits are Credence Research estimates, informed by public evidence on prices, channels, participation and urban spending. Source types include government statistics, regulators, company announcements, trade publications and academic research. A bottom-up check using gym memberships, buyer share and annual spending supported the size of the market. No interviews or surveys were conducted for this report, and third-party survey results are cited only where a named publisher reported them.
Everyday protein habits shape demand through 2035
The India sports nutrition and supplements market should reach USD 3.83 billion by 2035 as protein becomes a routine household purchase rather than a gym product. Demand should broaden fastest in smaller cities, helped by physical stores, quick commerce and lower-priced trial packs. Supply is the main swing factor, because domestic whey capacity from dairy companies could ease the import burden and steady prices during the second half of the forecast. Regulation should tighten as states follow Haryana in testing products on sale. Brands that show their test results and manage input costs well are likely to gain the most share across the period.
Frequently Asked Questions
How big is the India sports nutrition and supplements market?
Which product type leads the market?
Which region holds the largest share?
What did the 2025 tax change do for supplements?
Why have whey protein prices risen in India?
Which channel grows fastest?
How reliable are protein product labels in India?
Who are the main companies in this market?
Table of Content
Chapter 1 Market Segmentation
- 1.1 Segmentation Framework
- 1.1.1 Product and Service Classification
- 1.1.2 Application and End-Use Classification
- 1.1.3 Technology and Solution Classification
- 1.1.4 Customer and Distribution Channel Classification
- 1.1.5 Geographic Segmentation
- 1.1.6 Market Segment Definitions and Boundaries
- 1.2 By Product Type
- 1.2.1 Protein Supplements
- 1.2.2 Performance Amino Acids
- 1.2.3 Pre-Workout and Creatine
- 1.2.4 Hydration and Sports Foods
- 1.3 By Customer Type
- 1.3.1 Recreational Fitness Consumers
- 1.3.2 Strength and Bodybuilding Users
- 1.3.3 Endurance Athletes
- 1.3.4 Competitive and Lifestyle Users
- 1.4 By Packaging Format
- 1.4.1 Tubs and Jars
- 1.4.2 Stand-Up Pouches
- 1.4.3 Single-Serve Formats
- 1.4.4 Ready-to-Consume Formats
Chapter 2 Introduction
- 2.1 Report Objectives and Scope
- 2.2 Product Definition and Industry Terminology
- 2.3 Market Inclusions and Exclusions
- 2.4 Research Process
- 2.4.1 Primary Research and Expert Interviews
- 2.4.2 Secondary Research and Source Review
- 2.4.3 Top-Down and Bottom-Up Estimation
- 2.4.4 Data Triangulation and Verification
- 2.5 Market Size Measurement Basis
- 2.5.1 2025: USD 1.15 billion → 2035: USD 3.83 billion
- 2.6 Historical and Forecast Reference Periods
- 2.6.1 Historical Period: 2018-2025
- 2.6.2 Base Year: 2025
- 2.6.3 Forecast Period: 2025-2035
- 2.7 Research Assumptions and Limitations
Chapter 3 Executive Summary
- 3.1 Market Snapshot and Key Findings
- 3.2 Base-Year Market Size, 2025
- 3.3 Forecast Market Size, 2035
- 3.4 Revenue and Volume Growth Outlook
- 3.5 Key Demand and Supply Indicators
- 3.6 Leading Market Segments
- 3.7 Fastest-Growing Market Opportunities
- 3.8 Regional Performance Highlights
- 3.9 Technology and Industry Transformation
- 3.10 Competitive Landscape Summary
- 3.11 Analyst View and Strategic Implications
Chapter 4 India Sports Nutrition and Supplements Market Trends and Developments
- 4.1 Historical Industry Development, 2018-2025
- 4.2 Recent Market Trends and Developments
- 4.3 Demand and Customer Behavior Trends
- 4.4 Technology and Product Innovation
- 4.5 Artificial Intelligence, Automation and Digitalization
- 4.6 Local Manufacturing and Supply Chain Realignment
- 4.7 Industry Partnerships, Mergers and Acquisitions
- 4.8 Sustainability and Circular Economy Developments
- 4.9 Government and Private Sector Investment Trends
- 4.10 Emerging Business Models and Commercialization
- 4.11 Industry Developments and Announcements
Chapter 5 India Sports Nutrition and Supplements Market Production, Supply and Demand Analysis
- 5.1 Demand Trend and Consumption Analysis, 2018-2025
- 5.2 Demand Forecast, 2025-2035
- 5.3 Production and Output Trend, 2018-2025
- 5.4 Production and Output Forecast, 2025-2035
- 5.5 Installed Capacity and Capacity Utilization
- 5.6 Company-Wise Production Plants and Statistics
- 5.6.1 Installed Production Capacity
- 5.6.2 Actual Production
- 5.6.3 Planned Capacity and Expansion Targets
- 5.7 Supply Chain Structure and Procurement Trends
- 5.8 Supply-Demand Gap and Bottlenecks
- 5.9 Import Dependence and Sourcing Structure
- 5.10 Contract Manufacturing and Outsourcing
- 5.11 Regional Supply and Demand Concentration
Chapter 6 India Sports Nutrition and Supplements Market Pricing Analysis
- 6.1 Pricing Structure and Measurement
- 6.2 Historical Pricing Trends, 2018-2025
- 6.3 Pricing Outlook, 2025-2035
- 6.4 Average Selling Price and Unit Economics
- 6.5 Pricing by Product and Market Segment
- 6.6 Geographic Pricing Differences
- 6.7 Key Input, Energy, Labor and Logistics Costs
- 6.8 Contract Pricing and Purchasing Models
- 6.9 Pricing Sensitivity and Competitive Positioning
- 6.10 Price, Margin and Profitability Implications
Chapter 7 India Sports Nutrition and Supplements Market Dynamics
- 7.1 Market Growth Drivers
- 7.1.1 Demand-Side Drivers
- 7.1.2 Technology and Innovation Drivers
- 7.1.3 Infrastructure and Investment Drivers
- 7.1.4 Regulatory and Policy Drivers
- 7.2 Market Restraints
- 7.2.1 Cost and Affordability Constraints
- 7.2.2 Technology and Adoption Barriers
- 7.2.3 Supply Chain and Operational Constraints
- 7.3 Market Challenges
- 7.3.1 Competitive Pressure and Margin Erosion
- 7.3.2 Skills, Infrastructure and Implementation Gaps
- 7.4 Emerging Market Opportunities
- 7.5 Market Dynamics Impact and Time-Horizon Assessment
Chapter 8 India Sports Nutrition and Supplements Value Chain Analysis
- 8.1 Industry Value Chain Overview
- 8.2 Upstream Suppliers and Critical Inputs
- 8.3 Technology and Component Providers
- 8.4 Manufacturing or Service Delivery
- 8.5 Distribution, Channel Partners and Integrators
- 8.6 Downstream Applications and End Users
- 8.7 Value Addition and Profit Pools
- 8.8 Vertical Integration and Outsourcing
- 8.9 Supplier Concentration and Risk
- 8.10 Supply Chain Localization and Resilience
Chapter 9 India Sports Nutrition and Supplements Market Regulations and Policies
- 9.1 Relevant Laws, Standards and Compliance Frameworks
- 9.2 Product, Service, Safety and Quality Requirements
- 9.3 Government Policies, Incentives and Subsidies
- 9.4 Imports, Exports and Trade Barriers
- 9.5 Public Procurement and Local Content Requirements
- 9.6 Environmental and Sustainability Compliance
- 9.7 Upcoming Policy Changes and Market Implications
Chapter 10 India Sports Nutrition and Supplements Market Hotspots and Opportunities
- 10.1 Market Opportunity Mapping and Growth Hotspots
- 10.2 High-Growth Applications and Customer Groups
- 10.3 Underserved Markets and White-Space Opportunities
- 10.4 Emerging Technology and Product Opportunities
- 10.5 New Capacity and Investment Hotspots
- 10.6 Market Entry and Expansion Opportunities
- 10.7 Distribution and Partnership Opportunities
- 10.8 Near-Term and Long-Term Commercial Potential
- 10.9 Opportunity Attractiveness and Execution Risks
Chapter 11 India Sports Nutrition and Supplements Market Outlook, 2025-2035
- 11.1 Market Size and Analysis
- 11.1.1 Revenue (Market Measurement: 2025: USD 1.15 billion → 2035: USD 3.83 billion)
- 11.1.2 Market Volume and Quantity Sold
- 11.1.3 Historical Market Size, 2018-2025
- 11.1.4 Base-Year Market Size, 2025
- 11.2 Market Forecast, 2025-2035
- 11.2.1 Revenue Forecast to 2035
- 11.2.2 Volume Forecast to 2035
- 11.2.3 CAGR and Year-on-Year Growth
- 11.2.4 Incremental Revenue Opportunity
- 11.3 Forecast Assumptions and Scenario Analysis
- 11.3.1 Base-Case Forecast
- 11.3.2 Optimistic and Conservative Scenarios
- 11.3.3 Technology, Pricing and Policy Sensitivities
- 11.4 Market Attractiveness and Growth Outlook
Chapter 12 India Sports Nutrition and Supplements Market Segmentation and Outlook
- 12.1 Segmentation Summary and Market Shares, 2025
- 12.2 Largest and Fastest-Growing Segments
- 12.3 By Product Type - Market Size and Forecast, 2025-2035
- 12.3.1 Segment Definition and Scope
- 12.3.2 Historical Market Size, 2018-2025
- 12.3.3 Revenue Forecast, 2025-2035
- 12.3.4 Volume Forecast, 2025-2035
- 12.3.5 Base-Year Market Share, 2025
- 12.3.6 Segment CAGR and Growth Drivers
- 12.3.7 Subsegment Market Size and Forecast
- 12.3.7.1 Protein Supplements
- 12.3.7.2 Performance Amino Acids
- 12.3.7.3 Pre-Workout and Creatine
- 12.3.7.4 Hydration and Sports Foods
- 12.3.8 Subsegment Pricing and Adoption Trends
- 12.3.9 Leading Suppliers and Competition
- 12.3.10 Regional Demand and Opportunities
- 12.4 By Customer Type - Market Size and Forecast, 2025-2035
- 12.4.1 Segment Definition and Scope
- 12.4.2 Historical Market Size, 2018-2025
- 12.4.3 Revenue Forecast, 2025-2035
- 12.4.4 Volume Forecast, 2025-2035
- 12.4.5 Base-Year Market Share, 2025
- 12.4.6 Segment CAGR and Growth Drivers
- 12.4.7 Subsegment Market Size and Forecast
- 12.4.7.1 Recreational Fitness Consumers
- 12.4.7.2 Strength and Bodybuilding Users
- 12.4.7.3 Endurance Athletes
- 12.4.7.4 Competitive and Lifestyle Users
- 12.4.8 Subsegment Pricing and Adoption Trends
- 12.4.9 Leading Suppliers and Competition
- 12.4.10 Regional Demand and Opportunities
- 12.5 By Packaging Format - Market Size and Forecast, 2025-2035
- 12.5.1 Segment Definition and Scope
- 12.5.2 Historical Market Size, 2018-2025
- 12.5.3 Revenue Forecast, 2025-2035
- 12.5.4 Volume Forecast, 2025-2035
- 12.5.5 Base-Year Market Share, 2025
- 12.5.6 Segment CAGR and Growth Drivers
- 12.5.7 Subsegment Market Size and Forecast
- 12.5.7.1 Tubs and Jars
- 12.5.7.2 Stand-Up Pouches
- 12.5.7.3 Single-Serve Formats
- 12.5.7.4 Ready-to-Consume Formats
- 12.5.8 Subsegment Pricing and Adoption Trends
- 12.5.9 Leading Suppliers and Competition
- 12.5.10 Regional Demand and Opportunities
- 12.6 Segment Growth Comparison
- 12.7 Segment Attractiveness and Priority Matrix
Chapter 13 India Sports Nutrition and Supplements End-Use and Application Market Outlook
- 13.1 End-Use Industry and Customer Demand Structure
- 13.2 Leading Applications and Customer Groups
- 13.3 End-Use Market Size, Share and Forecast
- 13.4 Major End-Use Industry Deep Dives
- 13.4.1 Customer Requirements and Use Cases
- 13.4.2 Demand and Replacement Cycles
- 13.4.3 Technical and Regulatory Considerations
- 13.4.4 Purchasing and Procurement Models
- 13.4.5 Leading Vendors and Distribution Channels
- 13.4.6 Forecast and Commercial Opportunities
- 13.5 Emerging Applications and Cross-Segment Demand
- 13.6 End-Use Industry Investment Priorities
Chapter 14 India Sports Nutrition and Supplements Geographic Market Outlook, 2025-2035
- 14.1 Domestic Market Distribution and Demand Clusters
- 14.2 State- or Province-Wise Market Size and Forecast, 2025-2035
- 14.3 City and Metropolitan Market Outlook
- 14.4 Industrial, Manufacturing and Commercial Clusters
- 14.5 Geographic Concentration of Key End Users
- 14.6 Local Pricing and Purchasing Differences
- 14.7 Domestic Production Facilities and Capacity Map
- 14.8 Local Infrastructure and Project Pipeline
- 14.9 State-Level Policy and Incentive Differences
- 14.10 Subnational Investment Hotspots and Opportunities
- 14.11 Distribution and Logistics Networks
- 14.12 Domestic Competitive Footprint
Chapter 15 India Sports Nutrition and Supplements Technology, Innovation and Sustainability Outlook
- 15.1 Technology Landscape and Maturity
- 15.2 Product, Process and Service Innovation
- 15.3 AI, Automation and Digital Tools in the Industry
- 15.4 Technology Adoption and Performance Benchmarking
- 15.5 Innovation Pipeline and R&D Investment
- 15.6 Patent and Intellectual Property Trends
- 15.7 Energy Efficiency and Resource Management
- 15.8 Sustainability, Recycling and Circularity
- 15.9 Technology Roadmap, 2025-2035
- 15.10 Risks of Obsolescence and Technology Substitution
Chapter 16 India Sports Nutrition and Supplements Market Key Strategic Imperatives
- 16.1 Growth and Market Entry Priorities
- 16.2 High-Return Products and Segments
- 16.3 Pricing, Profitability and Cost Optimization
- 16.4 Technology Investment and Product Differentiation
- 16.5 Supply Chain Localization and Resilience
- 16.6 Distribution and Customer Acquisition
- 16.7 Partnership, Acquisition and Capacity Strategy
- 16.8 Regional Expansion Priorities
- 16.9 Short-, Medium- and Long-Term Actions
Chapter 17 Competition Outlook
- 17.1 Industry Competition Characteristics
- 17.2 Market Structure and Concentration
- 17.3 Market Share and Competitive Positioning, 2025
- 17.4 Company-Wise Revenue and Product Benchmarking
- 17.5 Production and Service Capacity Benchmarking
- 17.6 Technology, Pricing and Differentiation
- 17.7 Regional Footprint and Distribution Strength
- 17.8 Mergers, Acquisitions and Strategic Alliances
- 17.9 New Entrants and Competitive Threats
- 17.10 Porter's Five Forces and Industry Attractiveness
- 17.11 Competitive Outlook, 2025-2035
Chapter 18 Company Profiles
- 18.1 Company Coverage and Selection Criteria
- 18.2 Bright Lifecare Pvt Ltd (HealthKart / MuscleBlaze)
- 18.2.1 Business Description
- 18.2.2 Company Ownership and Geographic Presence
- 18.2.3 Product and Service Portfolio
- 18.2.4 Manufacturing and Operating Footprint
- 18.2.5 Production Capacity and Expansion Plans
- 18.2.6 Financial Performance and Investment
- 18.2.7 Market Share and Competitive Position
- 18.2.8 Technology and Innovation Capabilities
- 18.2.9 Strategic Alliances or Partnerships
- 18.2.10 Recent Developments
- 18.2.11 Growth Strategy and Outlook
- 18.3 Glanbia Performance Nutrition India Pvt Ltd (Optimum Nutrition)
- 18.4 Herbalife International India Pvt Ltd
- 18.5 Aeronutrix Sports Products Pvt Ltd (Fast&Up)
- 18.6 Parag Milk Foods Ltd (Avvatar)
- 18.7 Nutrabay Retail Pvt Ltd
- 18.8 BigMuscles Nutrition Pvt Ltd
- 18.9 THG Nutrition Ltd (Myprotein)
- 18.10 GNC Holdings LLC
- 18.11 Iovate Health Sciences International Inc (MuscleTech)
- 18.12 Other Relevant Market Participants
Note: Every listed company is profiled on the structure shown under the first company. The company list is preliminary and may change based on research findings, market developments, data availability and client requirements.
Chapter 19 Disclaimer
- 19.1 Research and Forecast Disclaimer
- 19.2 Data Source and Estimation Limitations
Note: The depth of individual sections depends on data availability for this market. Volume, capacity, trade and other unit-based metrics are included where applicable.

