
Sparkling launches reset the flavored water shelf
The North America flavored water market was valued at USD 9.95 billion in 2025 and is projected to increase from USD 10.81 billion in 2026 to USD 22.06 billion by 2035, registering a CAGR of 8.25% during 2026–2035. Demand comes from shoppers replacing soda and sweetened drinks with zero-sugar options sold across supermarkets, warehouse clubs, convenience coolers and online grocery. The United States held the largest share, 89.0% in 2025, because national brands and retail chains built the category there first. Mexico is the fastest-growing country at 9.78% a year, as higher excise rates on sweetened drinks in 2026 widened the price gap with unsweetened products. The most important commercial change is the shift toward cans and limited-edition flavors, with PepsiCo, Talking Rain and Polar Beverages all using short-run flavors to win trial. New federal dietary guidance issued in January 2026 and Canadian front-of-package labels in force from January 2026 also favor products with little or no sugar.
Which drinks and sales routes does this study count?
The report counts retail and foodservice value of flavored sparkling and flavored still water sold in the United States, Canada, Mexico and the rest of North America. Products include seltzers with natural flavors, zero-sugar sparkling drinks with added vitamins, and still waters infused with fruit essence. Households buy most of this volume in multipacks, while individuals buy single bottles from store coolers.
Plain still water, plain mineral water, carbonated soft drinks, juice drinks and hard seltzers are excluded from the value shown here. The value chain runs from water sources and flavor houses through bottling and can filling to direct store delivery networks, retail chains and online grocery platforms.
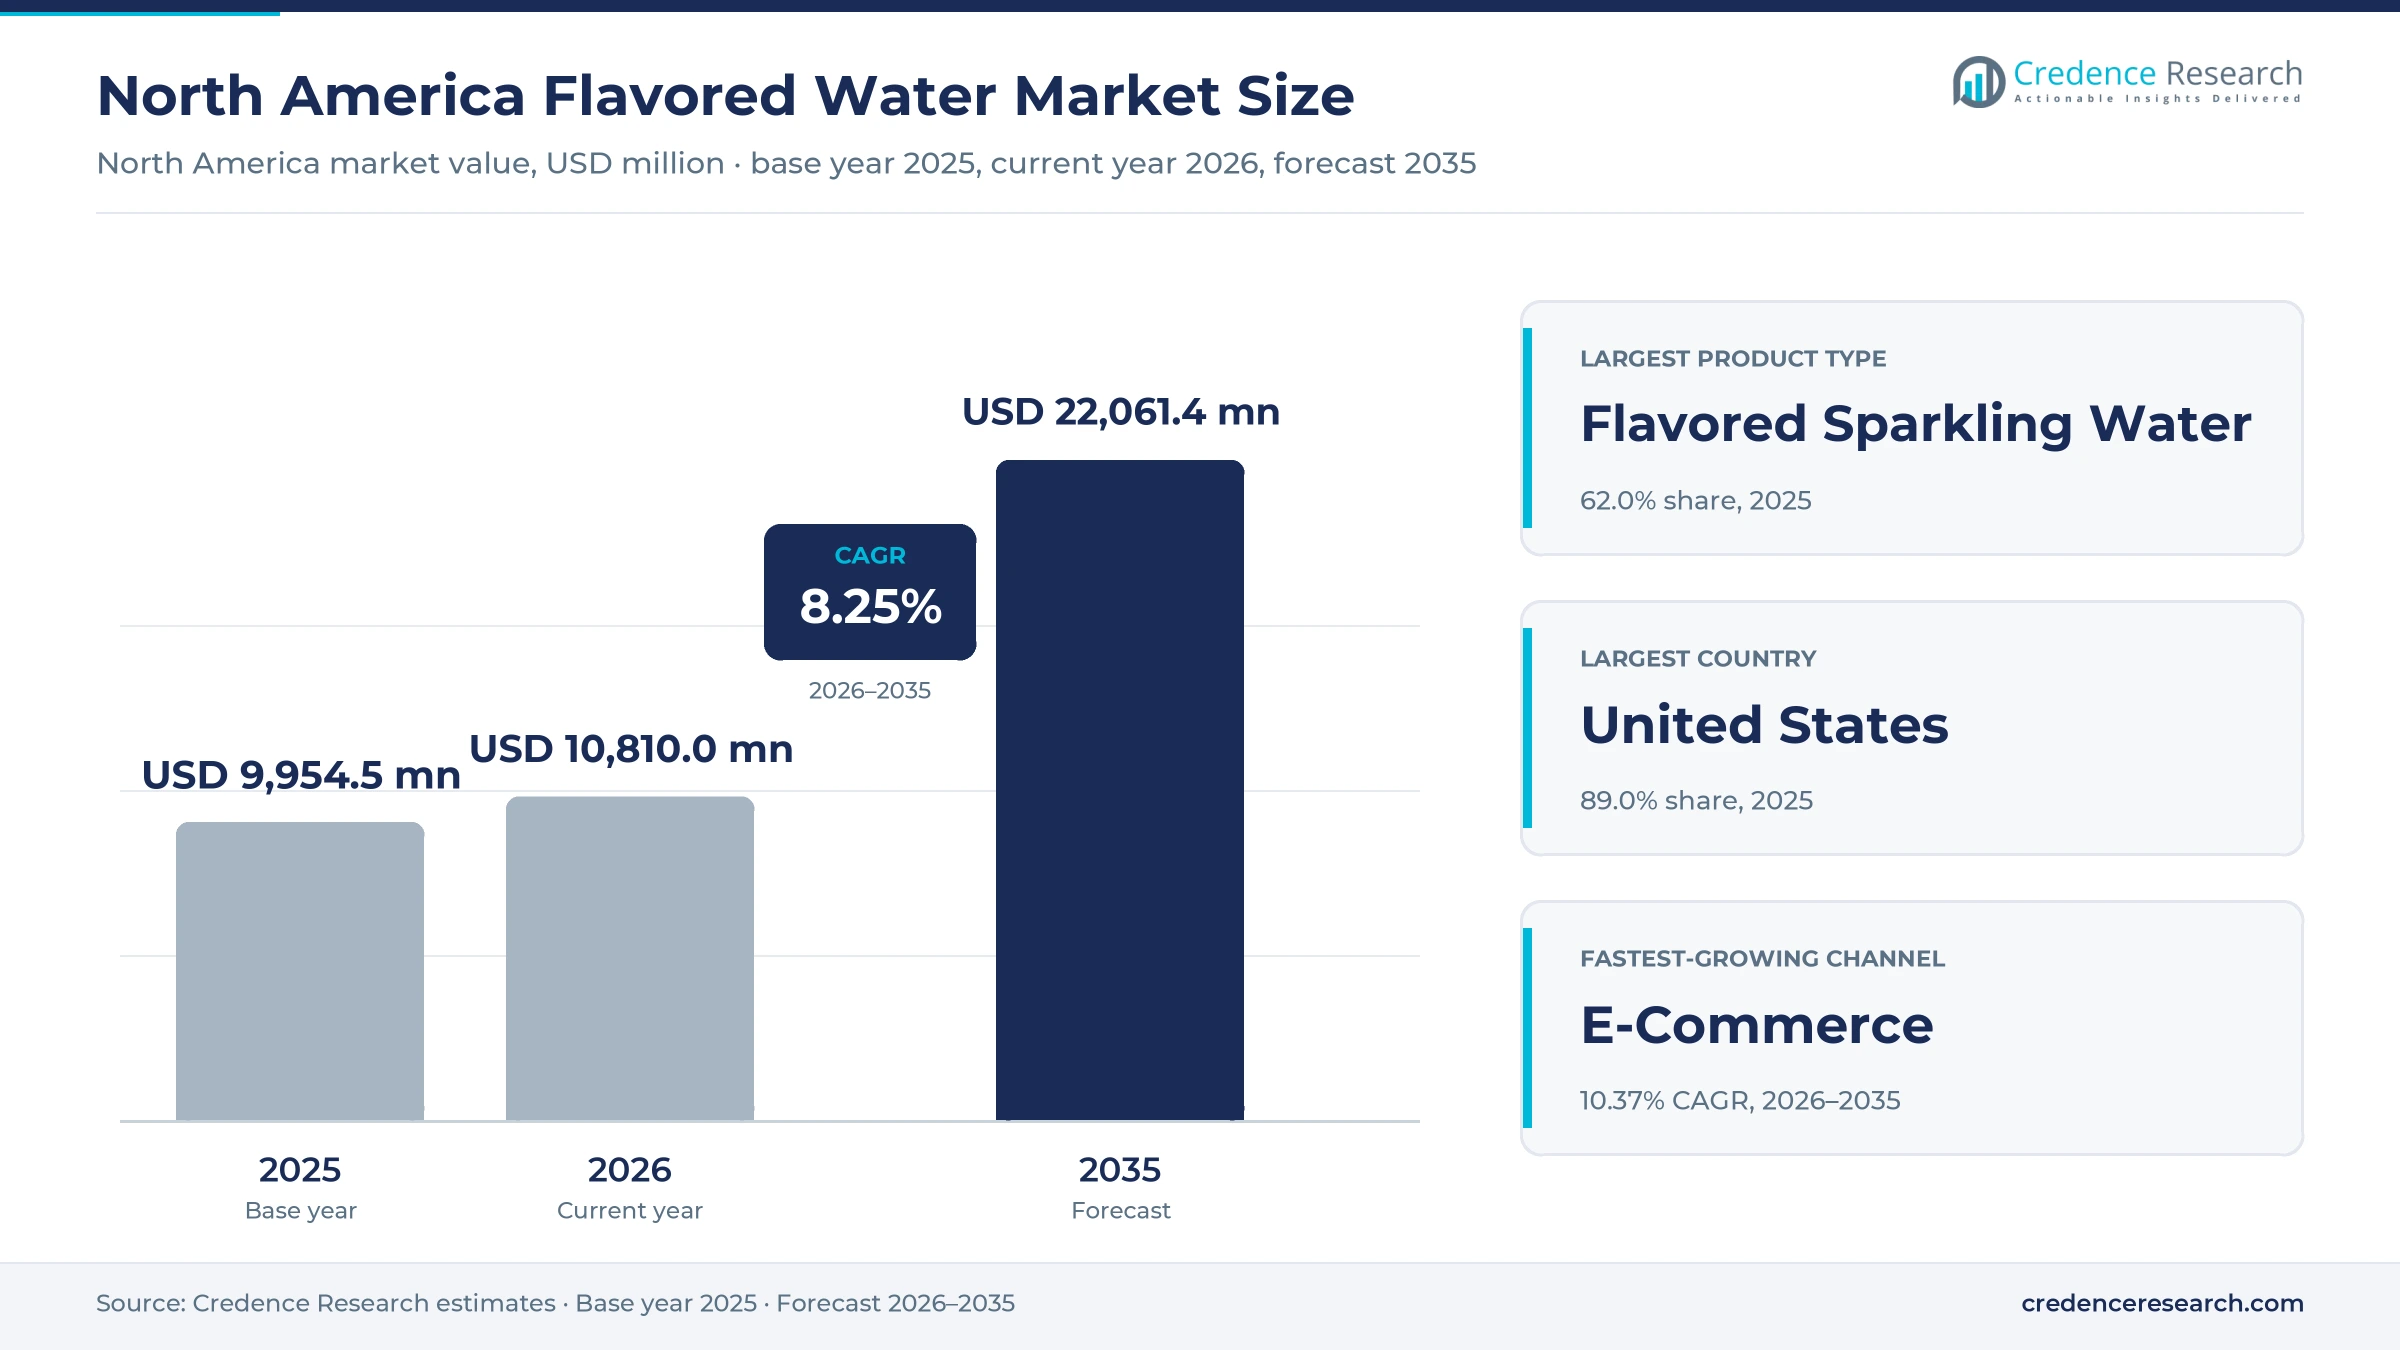
North America Flavored Water Market Insights
- The market grows from USD 9.95 billion in 2025 to USD 22.06 billion by 2035, at an 8.25% CAGR, as zero-sugar flavored drinks keep taking occasions from soda and sweetened beverages.
- The United States held 89.0% of 2025 value, supported by national brands, warehouse clubs and the deepest supermarket distribution in the region.
- Flavored sparkling water led product types with 62.0% of 2025 value, and it remains the format receiving most new flavor launches from major brands.
- Canada made front-of-package nutrition symbols mandatory on Jan. 1, 2026, which gives unsweetened and zero-sugar flavored drinks a clearer labeling advantage over sugary rivals.
- E-Commerce grows fastest among channels at 10.37% a year, helped by online grocery exceeding 19% of U.S. grocery spending in the first quarter of 2026.
Sparkling, mainstream and PET formats hold top shares
Why flavored sparkling water leads the product mix
Based on product type, the market is categorized into flavored sparkling water and flavored still water. Flavored Sparkling Water led with 62.0% of 2025 value because carbonated formats dominate tracked retail, and retail data cited by Food Dive in February 2026 put U.S. flavored sparkling, seltzer and mineral water sales at USD 5.5 billion in 2025, up from USD 3.8 billion five years earlier. Flavored Sparkling Water also grows fastest at 8.62% a year, as International Bottled Water Association data show domestic sparkling volume up 4.1% in 2024 while value-added water fell 1.33%.
How mainstream prices anchor the flavored water aisle
Based on price tier, the market is categorized into value, mainstream and premium. Mainstream led with 54.0% of 2025 value because national brands sit near USD 1 a bottle, with a Walmart.com listing a 12-pack of 17-ounce Sparkling Ice at USD 12.47, and because PepsiCo sells its fall bubly flavors in 8-packs of 12-ounce cans at national retailers. Premium grows fastest at 9.09% a year, as a Walmart.com listing prices 18 Hint bottles at USD 35.99, about USD 2 each, roughly double that level.
Why supermarkets remain the main route to shoppers
Based on distribution channel, the market is categorized into grocery and drug retail, mass and club retail, convenience and foodservice, and e-commerce. Grocery and Drug Retail led with 39.0% of 2025 value because regional chains carry wide flavor sets, and Waterloo named Kroger, Albertsons Safeway, Whole Foods, Aldi and Meijer in its Feb. 25, 2025, launch. E-Commerce grows fastest at 10.37% a year, as Chain Store Age reported online orders above 19% of U.S. grocery spending in the first quarter of 2026, after six straight quarters of growth above 20%.
Plastic bottles lead while cans gain ground
Based on packaging format, the market is categorized into aluminum cans, plastic bottles and glass and alternative packs. Plastic Bottles led with 52.0% of 2025 value because single-serve PET held 70.7% of 2024 U.S. bottled water volume, according to the International Bottled Water Association, and Sparkling Ice sells its core range in 17-ounce bottles. Aluminum Cans grows fastest at 8.99% a year, as PepsiCo launched bubly fall flavors in 12-ounce can 8-packs in September 2026 and Talking Rain promoted Sparkling Ice Caffeine in cans from January 2025.
| Segment Group | Leading Sub-segment | Share, 2025 | Fastest-growing Sub-segment | CAGR, 2026–2035 |
|---|---|---|---|---|
| By Product Type | Flavored Sparkling Water | 62.0% | Flavored Sparkling Water | 8.62% |
| By Price Tier | Mainstream | 54.0% | Premium | 9.09% |
| By Distribution Channel | Grocery and Drug Retail | 39.0% | E-Commerce | 10.37% |
| By Packaging Format | Plastic Bottles | 52.0% | Aluminum Cans | 8.99% |
Request a Free Sample
Fill in your details and we'll send you a free sample report.
- Sample data tables & charts
- Research methodology
Sugar limits and retail reach lift zero-sugar drinks
Sugar-reduction substitution moves shoppers away from soda
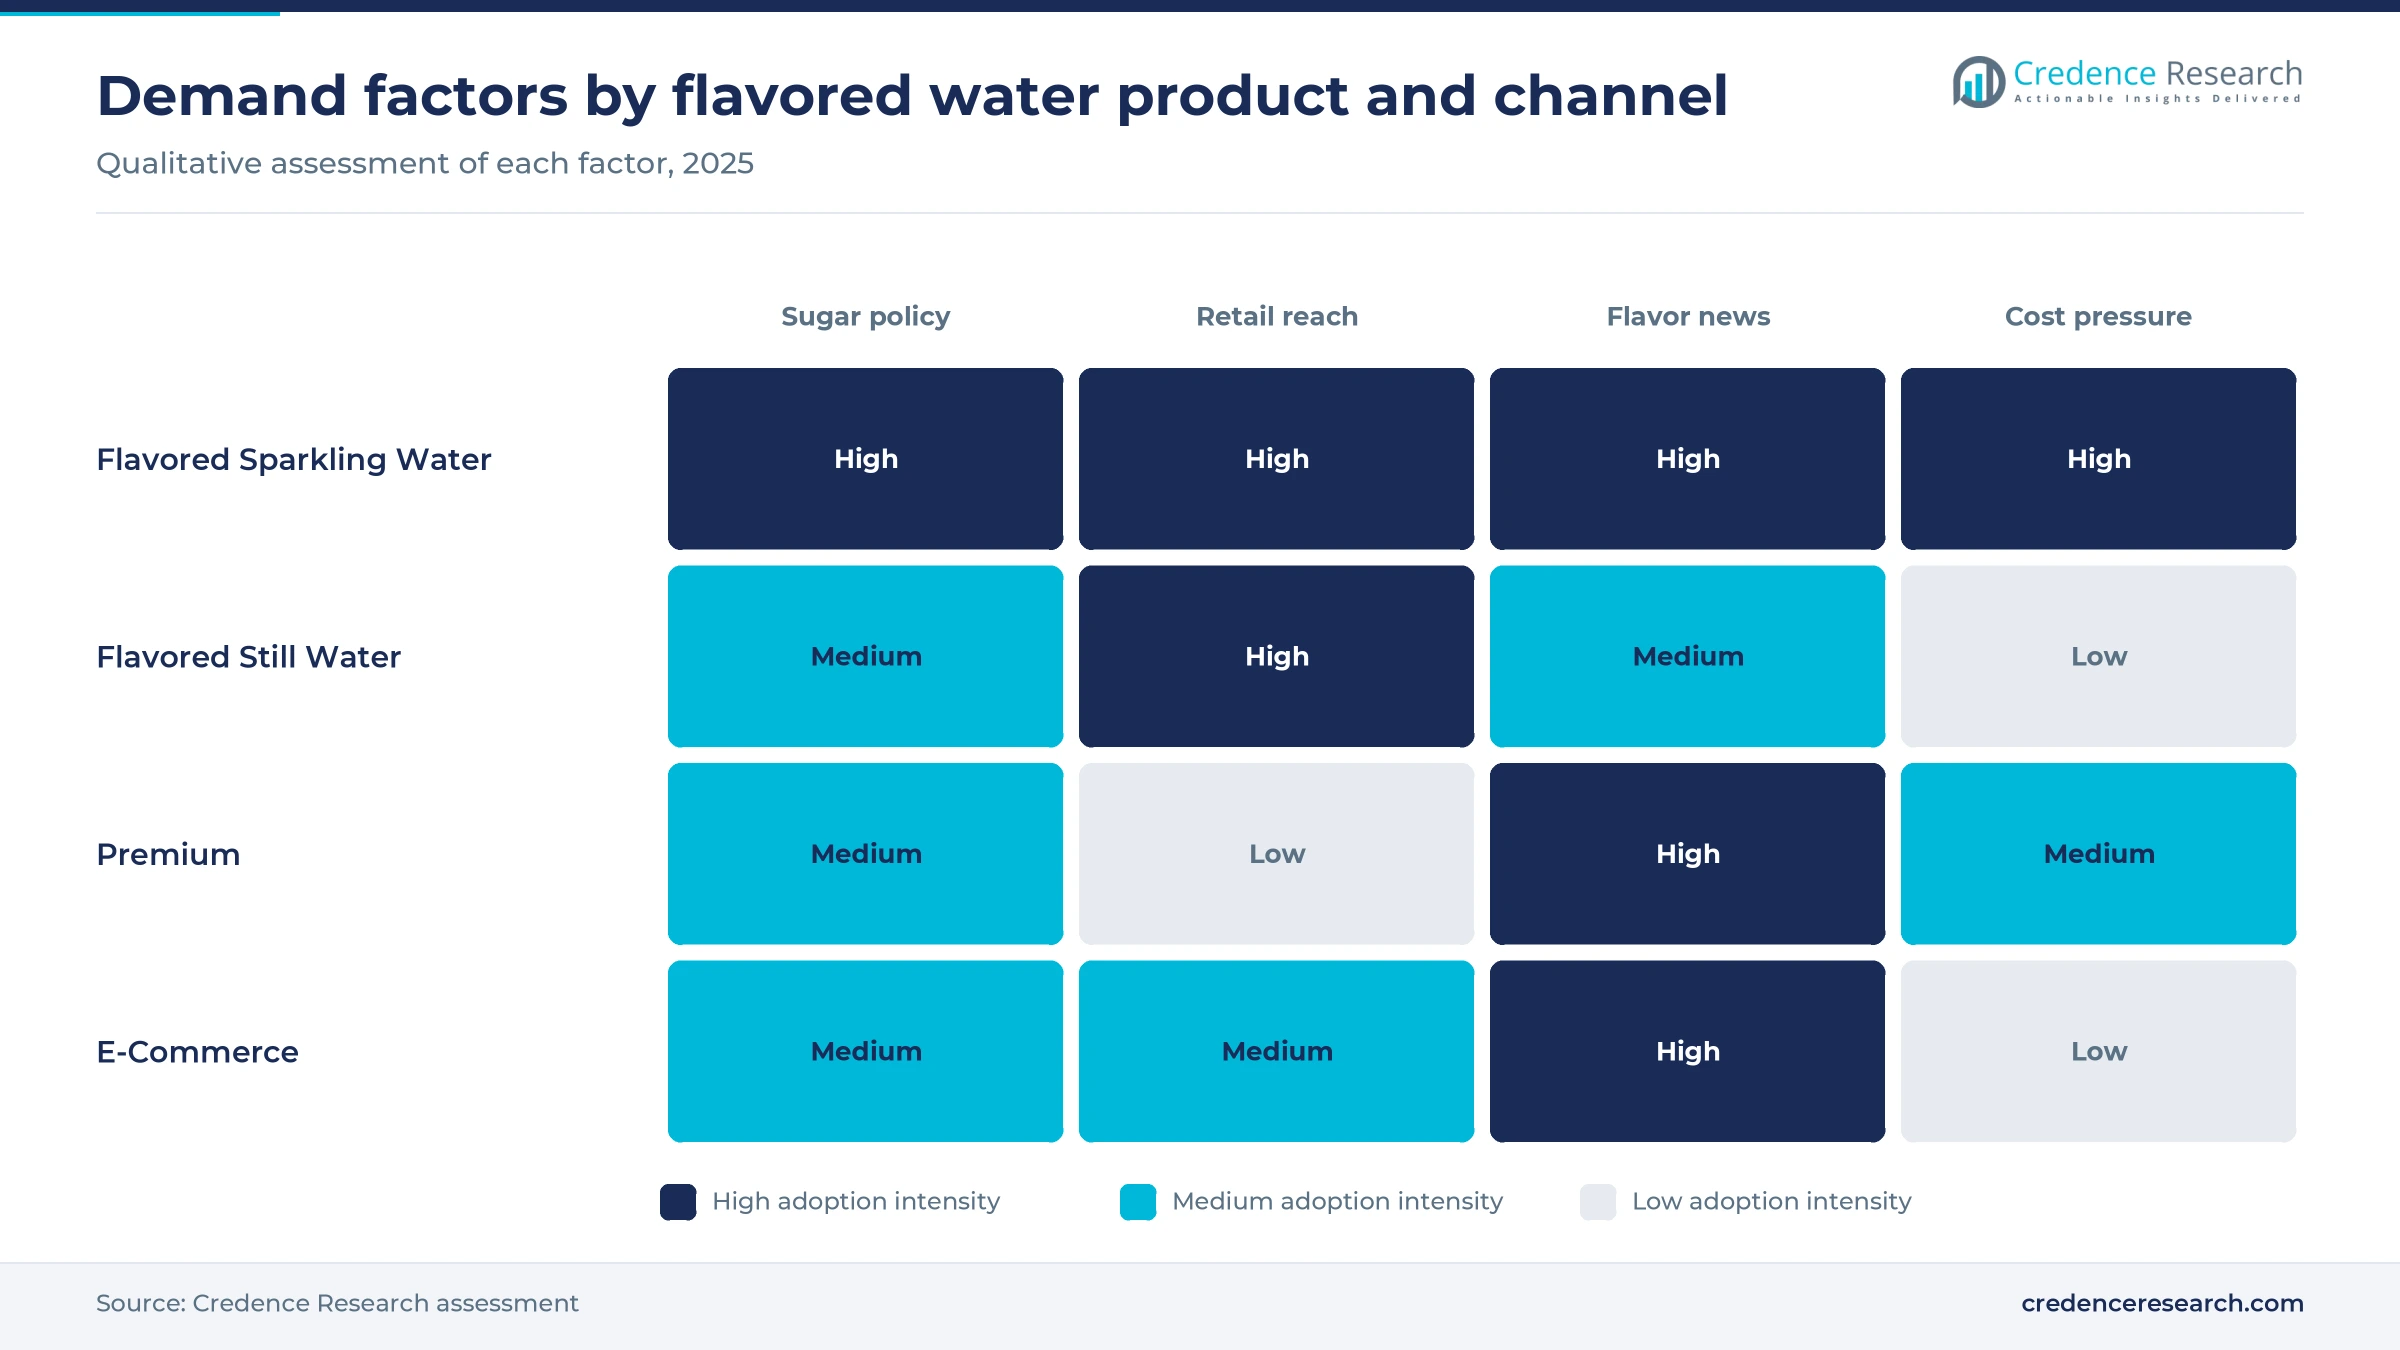
Federal and provincial nutrition policy now pushes shoppers toward drinks without sugar, and flavored water is the closest replacement for soda. The 2025–2030 Dietary Guidelines, issued in January 2026, suggest no more than 10 grams of added sugar in a meal, according to Pharmacy Times. Canada followed with mandatory front-of-package symbols for foods high in sugar from Jan. 1, 2026, according to JD Supra. These rules also lift interest in sugar substitutes, although many seltzers use none. Sparkling Ice reported that consumers bought 14% more of the brand in 2024, according to its January 2025 release. In turn, Flavored Sparkling Water holds 62.0% of 2025 value because it delivers flavor with zero sugar.
Multi-channel availability widens purchase occasions
Flavored water now reaches shoppers through almost every food retail format, so one household can buy multipacks and single bottles in the same week. Keurig Dr Pepper agreed on July 30, 2020, to carry Polar Seltzer nationally when the brand reached less than 35% of the country. Talking Rain hired a convenience channel vice president in February 2025 and said it expects convenience sales to more than double within three years. Waterloo listed Target, Kroger divisions, Whole Foods, Aldi and Amazon among its outlets for its February 2025 flavors. Because of this reach, Grocery and Drug Retail holds 39.0% of 2025 value while convenience coolers and club pallets add occasions that supermarkets alone would miss.
Premium flavor differentiation raises average spending
Brands use unusual flavors to justify higher prices and to keep repeat buyers from drifting to private labels. Talking Rain said in January 2025 that its earlier Starburst-inspired flavors shipped 2.4 million cases from January to March 2024, with 29.1% of new buyers choosing them. PepsiCo then used mocktail themes, adding Berry Sparkle Sangria and Paradise Paloma to bubly in September 2026. Waterloo added Guava Berry and Ruby Red Tangerine on Feb. 25, 2025, without sugar or sweeteners. As a result, Premium grows at 9.09% a year, since shoppers who pay about USD 2 for a bottle of Hint expect a distinct flavor and a clean ingredient list.
Bottled water habit gives flavors a large base to convert
Flavored products draw from a very large bottled water habit, which lowers the effort needed to win trial. The International Bottled Water Association reported U.S. bottled water volume of 16.4 billion gallons in 2024, up 2.9% from 2023. Per capita consumption reached 47.3 gallons in the same year, and retail sales topped USD 50.5 billion. Sparkling water averaged only about 2.5 gallons per person, which leaves room for flavor-led demand among regular bottled water buyers. The final FDA healthy rule of December 2024 also lets water, tea and coffee under five calories per serving carry that claim, according to law firm Haynes Boone. This base keeps the United States ahead, and neighboring markets are following from a much smaller starting point.
Cans, caffeine and limited editions reshape the aisle
Shift toward aluminum cans across flavored ranges
Brands that built their names in bottles are now adding cans, and new launches increasingly start in that format. Talking Rain built its 2025 campaign around Sparkling Ice Caffeine in an aluminum can, with 70 milligrams of caffeine and zero sugar, according to its January 2025 release. PepsiCo sold its fall 2026 bubly flavors in 8-packs of 12-ounce cans, while Waterloo uses cans with BPA-NI liners. These moves tie the category more closely to beverage can supply than in earlier years. Consequently, Aluminum Cans grows at 8.99% a year even though PET still accounted for 70.7% of 2024 U.S. bottled water volume.
Rise of limited-time flavors as a trial tool
Short-run flavors have become a routine way to create news without building permanent production lines. Polar Seltzer announced Prickly Pear Guava Punch, Kiwi Lemonade and Pineapple Tangerine Dream for summer 2026, according to The Boston Globe in April 2026, and gave packs to 50 fans before retail sale. PepsiCo said its bubly Berry Sparkle Sangria and Paradise Paloma would stay on shelves only while supplies last in fall 2026. Talking Rain added Starburst Fruit Punch and Watermelon on Jan. 28, 2025, through a 12-pack sold first on Amazon. Because these programs reward frequent shoppers, Mainstream brands at 54.0% of 2025 value can defend shelf space without cutting prices.
Opportunity in functional line extensions from water brands
Water brands have an opening in adjacent functional drinks, since their buyers already accept zero-sugar formulas and bold flavors. Talking Rain launched Popwell, a six-flavor prebiotic soda with one gram of sugar per can, on Feb. 27, 2025, through major retailers and Amazon. Its Sparkling Ice Caffeine line also sits between coffee and energy drinks, at 70 milligrams of caffeine. PepsiCo Canada added bubly POP, a soda with no more than 3 grams of sugar per can, according to its April 22, 2026, release. Together these launches show that Flavored Sparkling Water brands can stretch into higher-priced occasions while keeping the same bottling network and retail buyers.
Opportunity in online multipacks and same-day delivery
Heavy multipacks suit delivery, so online grocery gives flavored water suppliers a route to larger baskets and less price comparison in store. Chain Store Age reported that online orders passed 19% of U.S. grocery spending in the first quarter of 2026, up from under 15% at the end of the third quarter of 2024. Same-day orders made up nearly 80% of delivery orders for grocery demand, and Walmart approached 40% of online grocery sales. Talking Rain first sold its 2025 Starburst 12-pack on Amazon before rolling it out to stores in February. This pattern supports E-Commerce, which grows at 10.37% a year, particularly for premium brands that lack full supermarket distribution.
Tariffs, taxes and source limits pressure producers
Aluminum tariffs raise can costs for producers
Can users face higher metal costs because the 50% Section 232 aluminum tariff pushed the Midwest premium to a record in November 2025, according to Food Dive. Global News reported in February 2026 that one Ottawa brewer saw can costs rise from about 15 cents to about 35 cents. Flavored water brands moving into cans carry the same exposure, especially in Canada. Suppliers can respond by keeping PET options and locking longer can contracts.
Sweetened flavored drinks now face Mexican excise tax
Mexico charges 1.50 pesos per liter on drinks with non-caloric sweeteners in 2026, which were previously exempt, while sugared drinks moved from 1.64 to 3.08 pesos, according to El Imparcial in May 2026. Zero-sugar flavored waters using sweeteners therefore lose part of their earlier price advantage. Importers and local bottlers carry the pricing decision, and thin margins on value packs suffer first. Producers can respond with unsweetened formulas that rely on natural flavors alone.
Source and quality events can empty the shelves
Water source problems can remove a brand quickly, as Coca-Cola paused Topo Chico Mineral Water for the United States in February 2026 during source and plant upgrades in Mexico, according to Food Dive. The same report cited a limited Topo Chico recall in five states the previous summer over potential pseudomonas contamination. Retail buyers then reassign shelf space to rivals, which is costly to win back. Producers can reduce this risk with several qualified sources and tighter testing.
Crowded flavor ranges make some brands hard to sustain
Large companies have already retreated when a new label failed to hold shelf space, and Beverage Digest reported on Oct. 12, 2023, that Coca-Cola would scale back AHA in 2024 after Publix delisted it. The International Bottled Water Association also recorded a 1.33% fall in value-added water volume in 2024. Smaller brands face the same pressure from retailer ranges and private labels such as Kirkland Signature. Focused flavor ranges and regional strength offer them the safest defense.
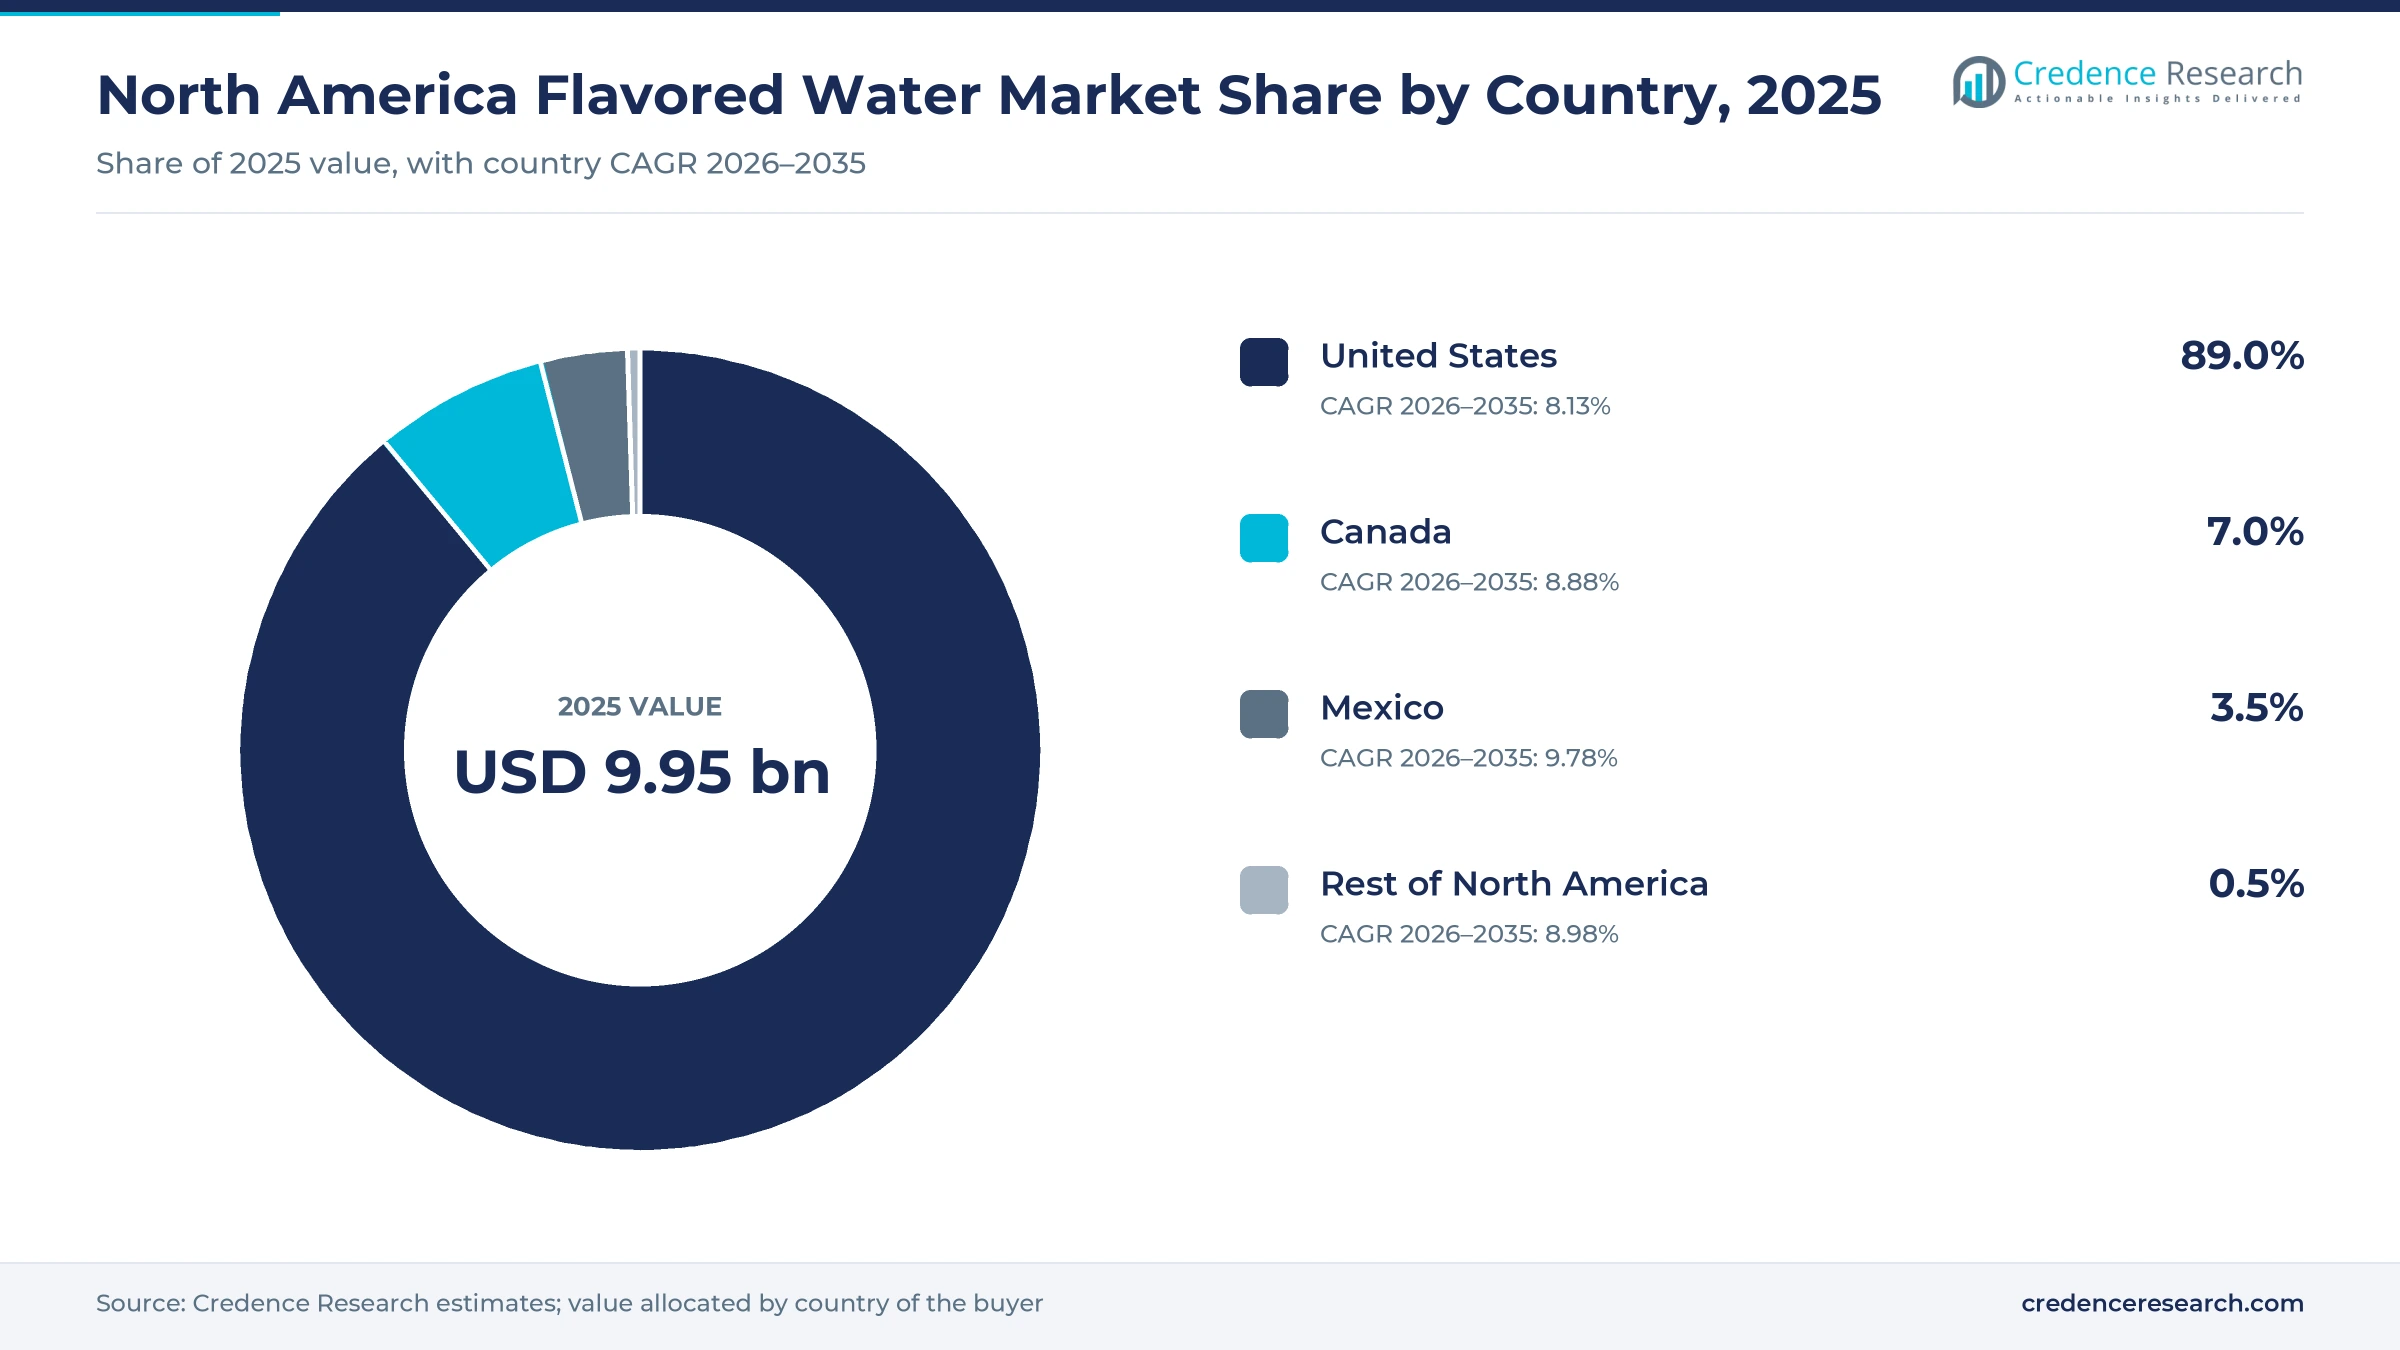
United States demand dwarfs its neighbors in value
| Country | Value, 2025 (USD billion) | Share, 2025 | CAGR, 2026–2035 |
|---|---|---|---|
| United States | 8.86 | 89.0% | 8.13% |
| Canada | 0.70 | 7.0% | 8.88% |
| Mexico | 0.35 | 3.5% | 9.78% |
| Rest of North America | 0.05 | 0.5% | 8.98% |
United States holds most value through national brands
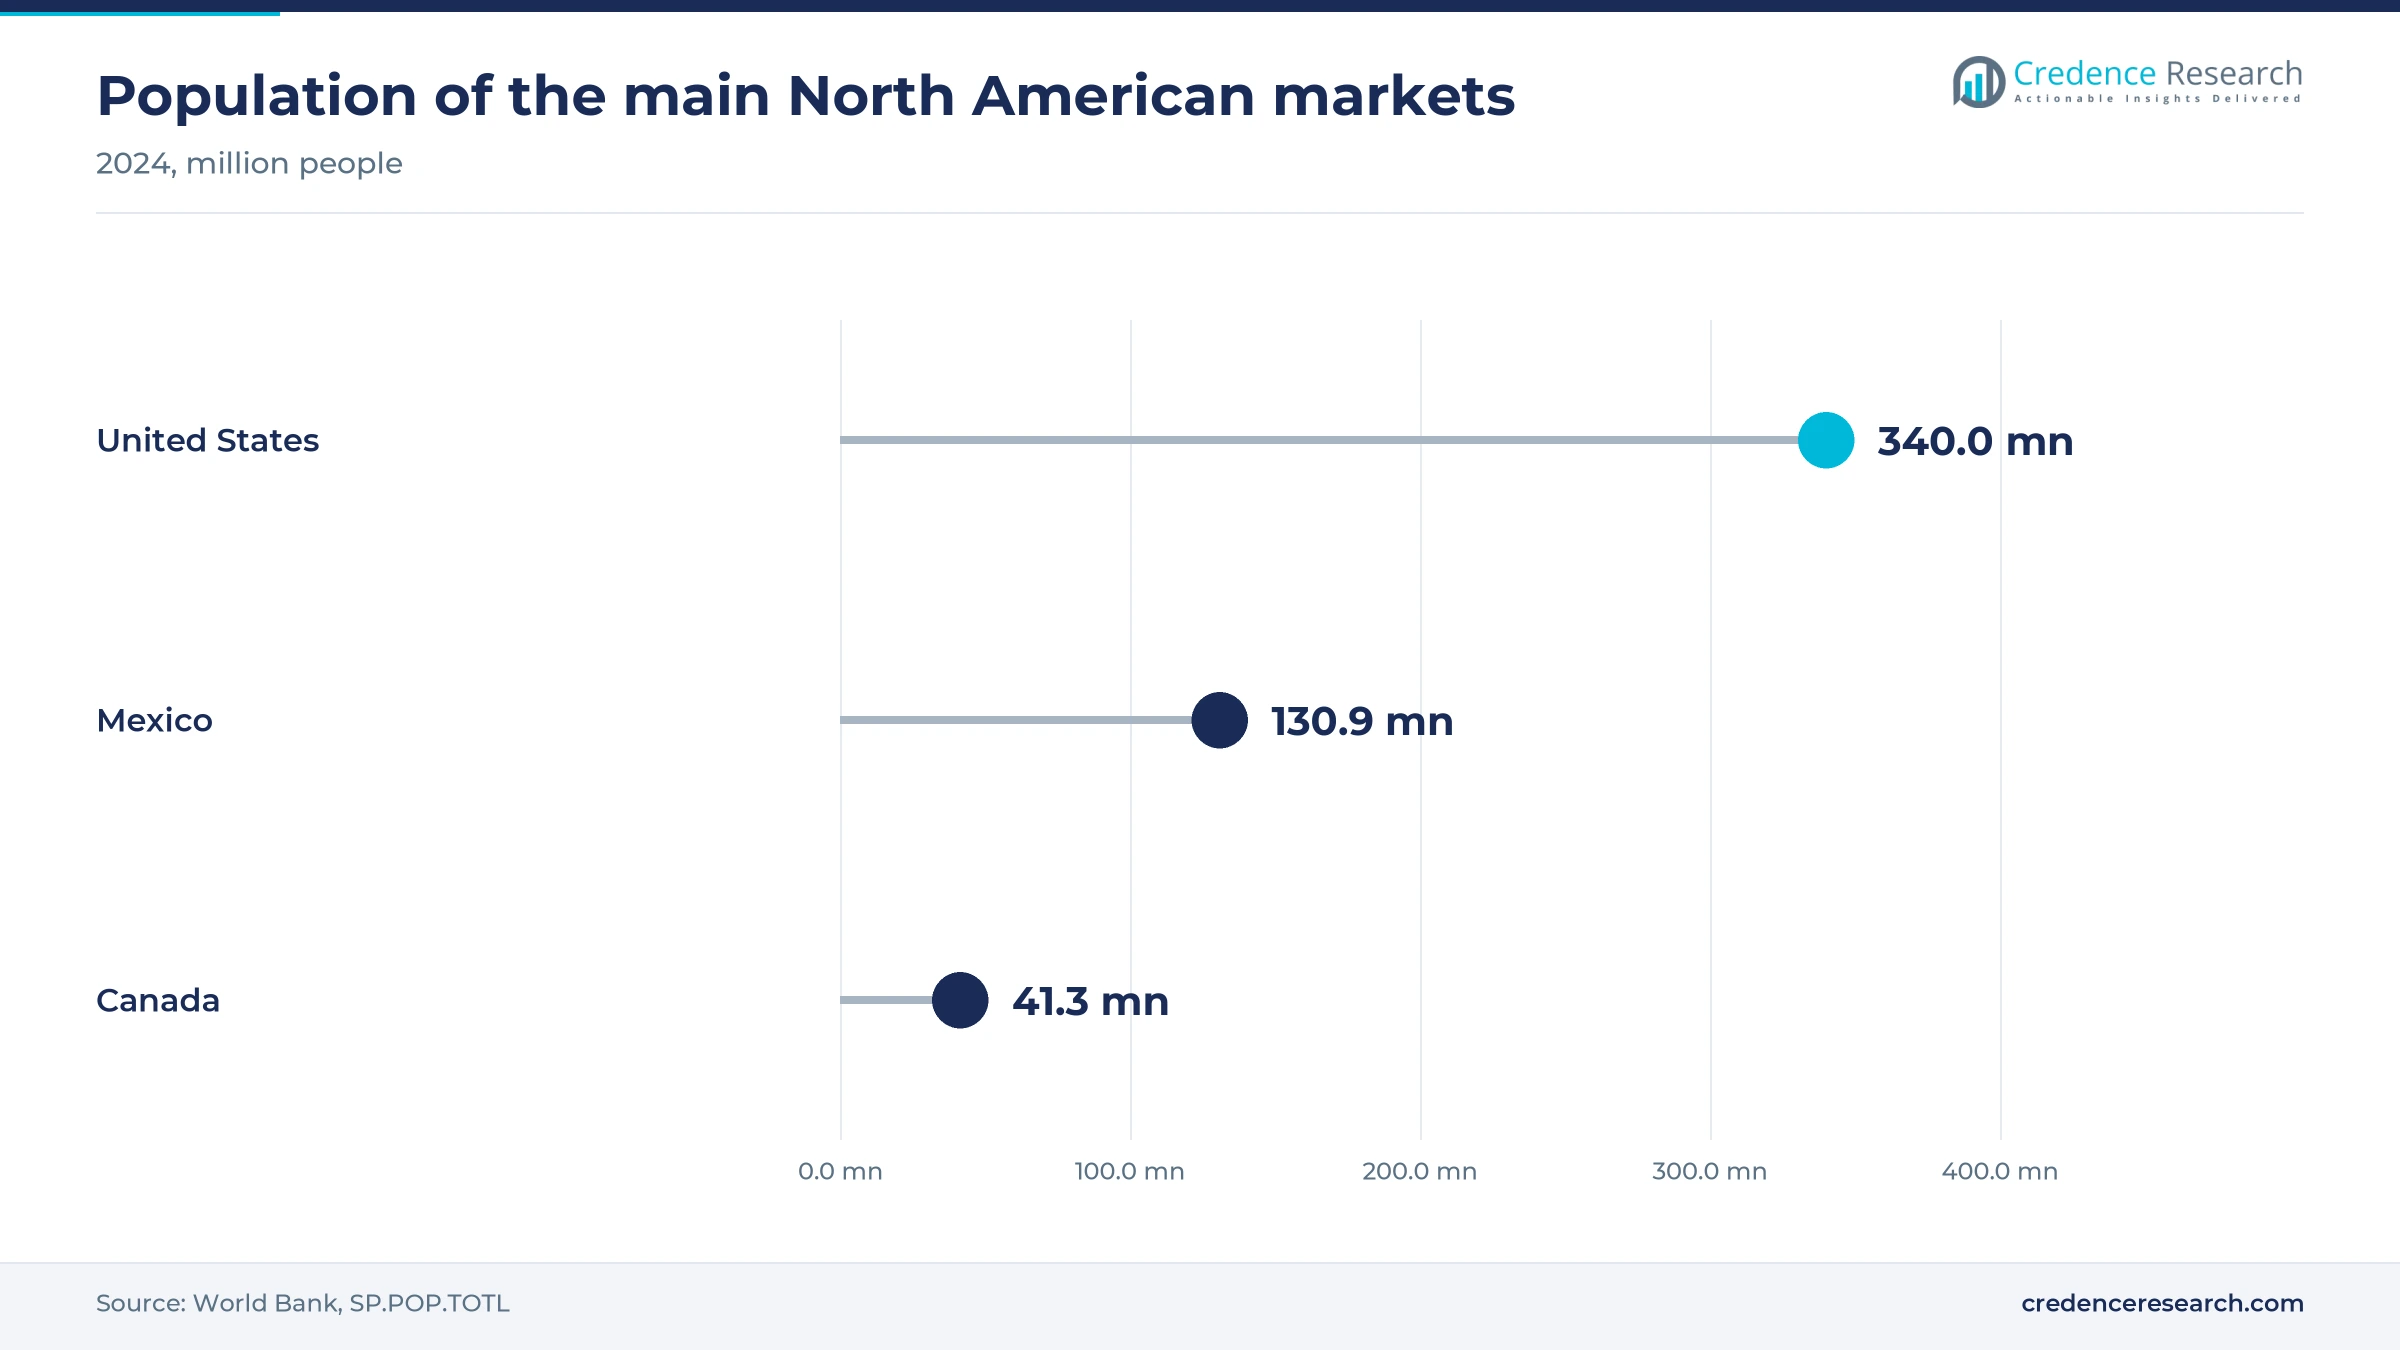
The United States held 89.0% of 2025 value and grows at 8.13% a year, close to the regional pace. Scale explains the lead, since World Bank data show 340.0 million residents in 2024 and the International Bottled Water Association reports 47.3 gallons of bottled water per person. The named companies operate national or near-national distribution here, and Costco, Walmart, Kroger and Target give brands immediate reach. Dietary guidance issued in January 2026 adds a further reason for shoppers to leave sugary drinks.
Canada gains from new front-of-package sugar symbols
Canada held 7.0% of 2025 value and grows at 8.88% a year, above the regional rate. Front-of-package symbols became mandatory on Jan. 1, 2026, which makes sugary drinks easier to spot on shelf. The Conference Board of Canada reported in November 2025 that Canadian beverage demand was large, as households spent CAD 12.5 billion on non-alcoholic beverages in 2024, with preferences shifting toward reduced sugar. PepsiCo Canada is also active in this shift through its low-sugar bubly POP launch. Can costs remain a concern because Canadian supply depends on U.S. can sheet.
Mexico grows fastest as excise rates reset drink prices
Mexico held 3.5% of 2025 value and is the fastest-growing country at 9.78% a year. The sugared drink excise rose from 1.64 to 3.08 pesos per liter in 2026, and first-quarter collections still ran 1,239 million pesos below the Finance Ministry projection, according to El Imparcial. That shortfall suggests sweetened drink buying patterns may be moving in Mexico. The 2026 revenue law projects 75,290 million pesos from the flavored beverage excise for the full year, according to the same report.
Rest of North America stays small but follows sugar taxes
Rest of North America, covering Central America and the Caribbean, held 0.5% of 2025 value and grows at 8.98% a year. Barbados raised its sugary drink tax from 10% to 20% in April 2022, and health officials reported weekly sales of those drinks down 4.3%, according to Caribbean National Weekly. The Pan American Health Organization said in May 2026 that Latin America and the Caribbean have the highest sugary drink consumption worldwide. The group stays small in this model because its combined retail base sits far below the three main countries.
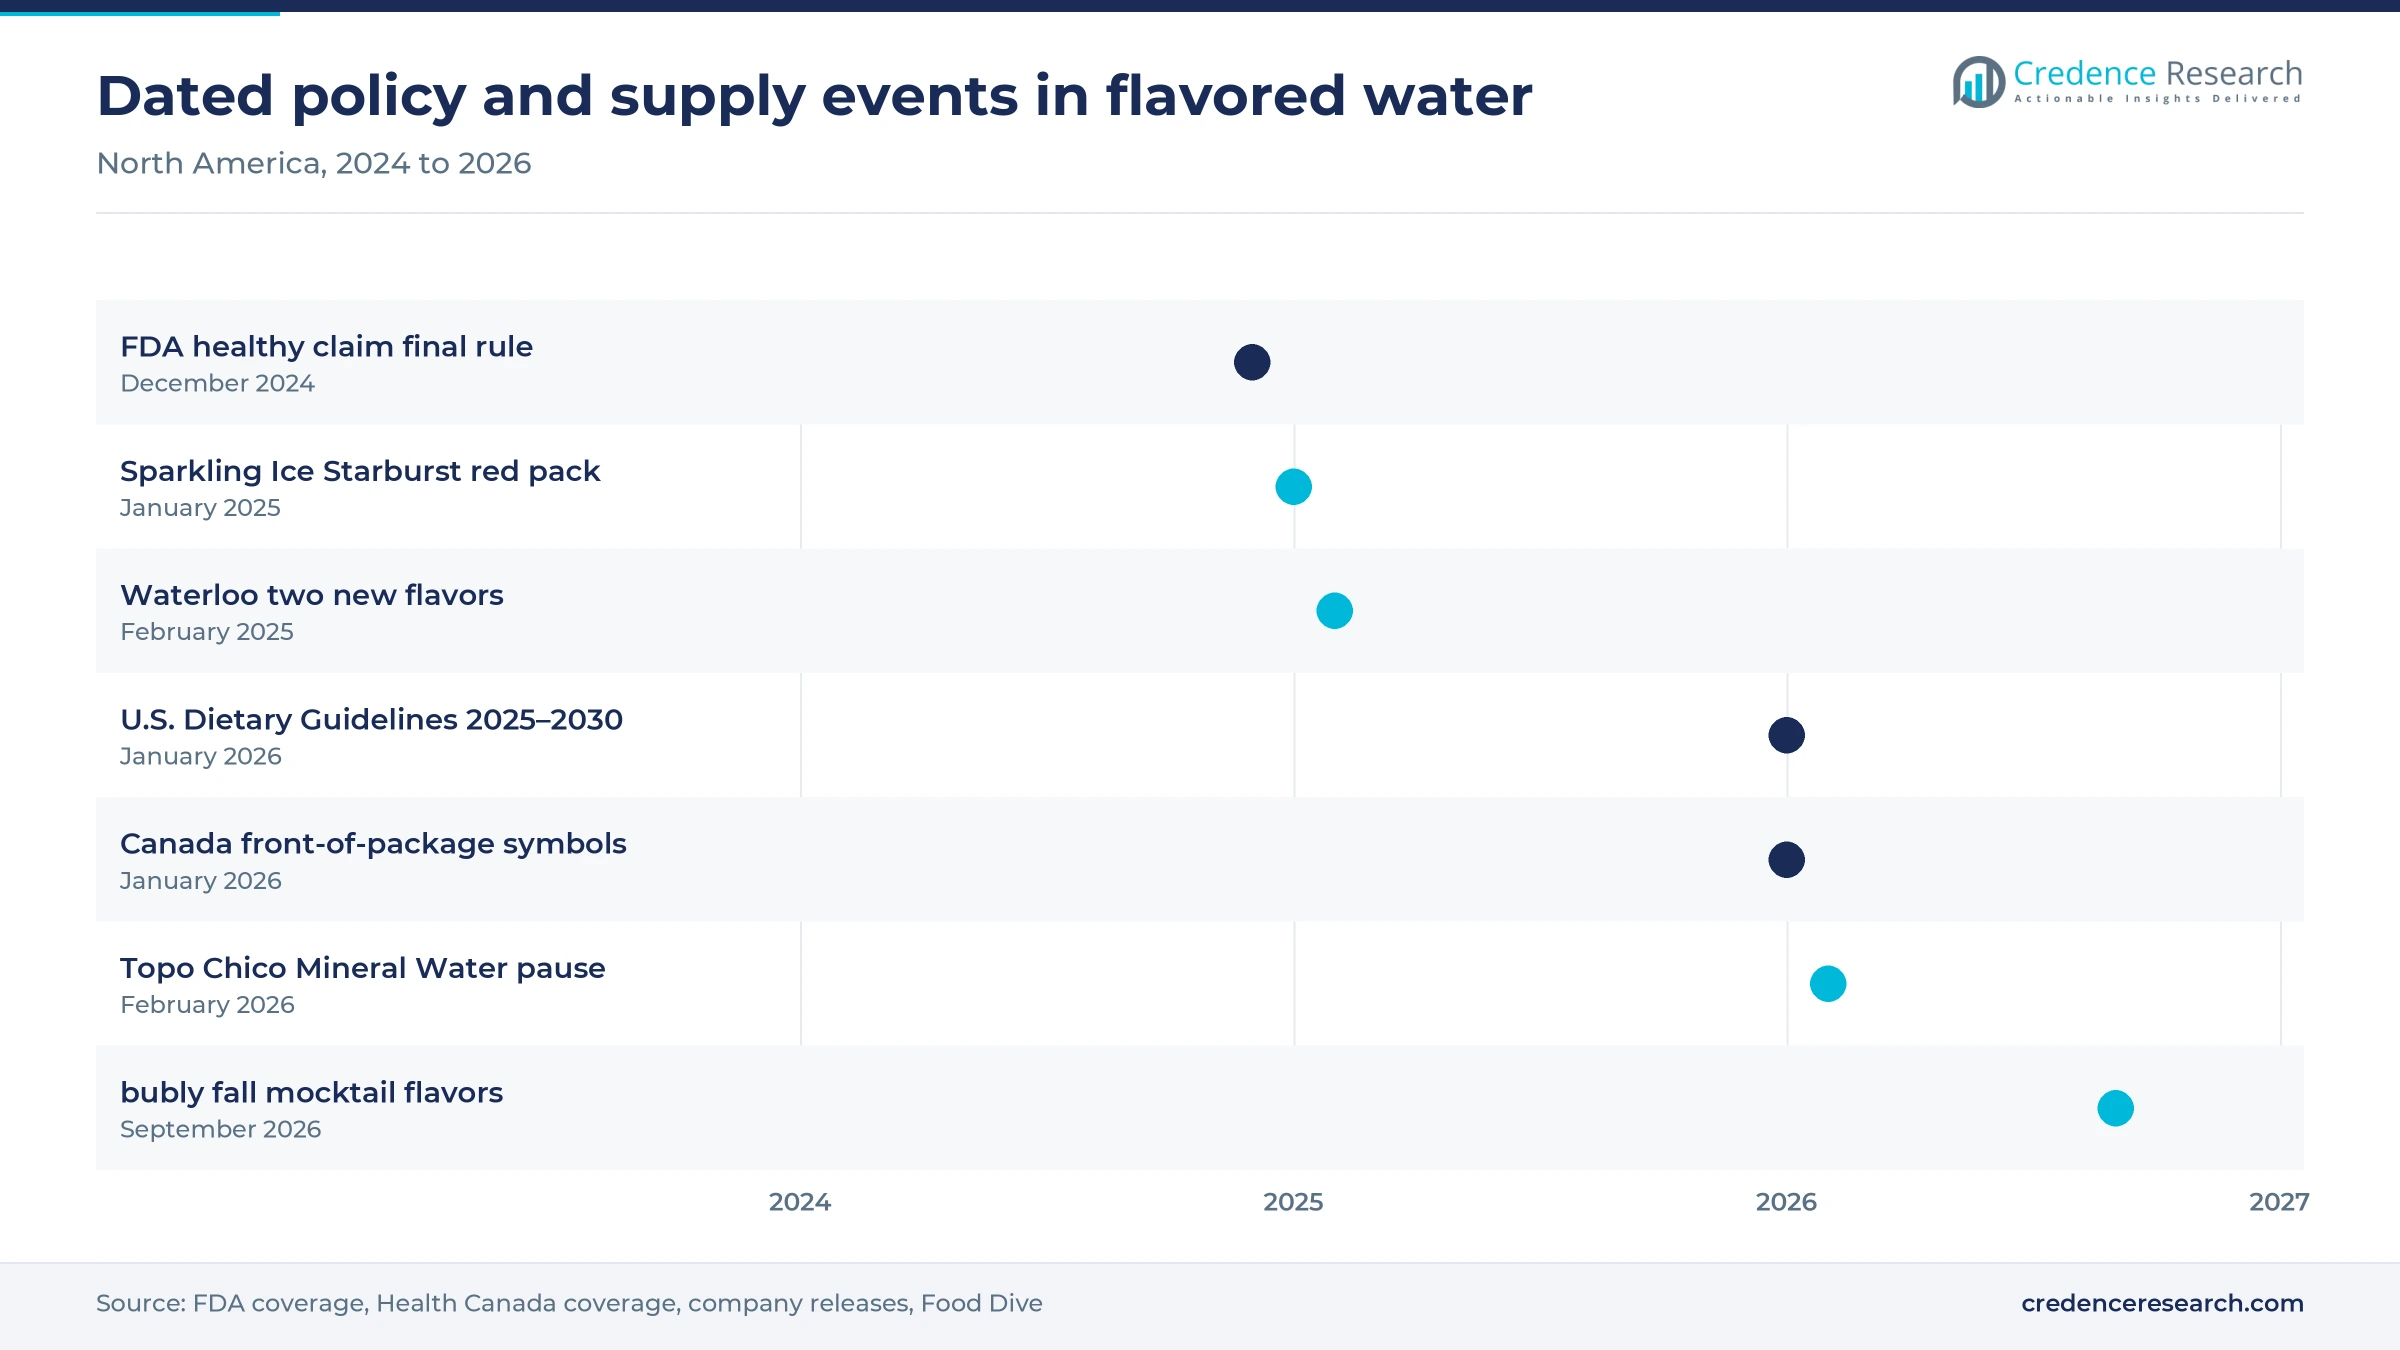
Launches and rules that moved the market since 2024
| Development | Status and market relevance |
|---|---|
| In January 2025, Talking Rain launched Starburst Fruit Punch and Watermelon flavors for Sparkling Ice in a 12-pack sold first on Amazon. | Launched, with a nationwide retail rollout from February 2025 |
| In February 2025, Waterloo introduced Guava Berry and Ruby Red Tangerine sparkling waters without sugar or sweeteners. | Rolling out year-round, with select Costco divisions added that spring |
| In January 2026, Canada began requiring front-of-package nutrition symbols on foods high in sugar, sodium or saturated fat. | In force, with older inventory allowed to sell through |
| In February 2026, Coca-Cola paused Topo Chico Mineral Water for the United States during source and plant upgrades in Mexico. | Temporary, and flavored Topo Chico drinks were not affected |
| In September 2026, PepsiCo released bubly Berry Sparkle Sangria and Paradise Paloma as limited-time flavors across U.S. retailers. | On sale in 8-packs while supplies last |
Formulation and pack choices separate the brands
- Sweetener-free flavoring relies on natural flavors in carbonated water, as with Waterloo, which lists no calories, sugar or sweeteners on its 2025 launches.
- Vitamin and antioxidant fortification gives Talking Rain a functional claim, since its company description says all its drinks have zero sugar and are enriched with vitamins and antioxidants.
- Caffeine addition moves flavored water into afternoon occasions, with Sparkling Ice Caffeine carrying 70 milligrams of naturally derived caffeine in an aluminum can.
- BPA-NI can linings answer shopper questions about packaging materials, and Waterloo states on its February 2025 release that its aluminum cans use these liners.
Need a Custom Version of This Report?
Tailor the scope, geography, or segments to your exact requirements.
- Custom geography or segment scope
- Direct access to our analyst team
Beverage groups and independents vie for flavor and shelf
Competition centers on flavor news, shelf access and distribution muscle rather than on water source. Talking Rain Beverage Company, based in Preston, Washington, relies on bold flavors, licensed candy partnerships and zero-sugar formulas, and it is adding convenience sales capability. PepsiCo uses bubly and its national delivery system to place seasonal cans in stores across the United States, while its Canadian unit extends the name into low-sugar soda. The Coca-Cola Company has narrowed its focus after scaling back AHA and now leans on flavored Topo Chico, which stayed on sale when its plain mineral water was paused in early 2026. Polar Beverages, based in Worcester, Massachusetts, combines its own territory with Keurig Dr Pepper distribution, which it secured in 2020. Private labels such as Kirkland Signature set the low end of the price ladder, and that pressure keeps branded suppliers launching flavors rather than discounting.
Companies profiled and their roles in this market
| Company | Type | Role in the market |
|---|---|---|
| Talking Rain Beverage Company | Independent brand owner | Sells Sparkling Ice in bottles and cans, plus Popwell prebiotic soda, through retail and Amazon |
| PepsiCo | Multinational beverage group | Sells bubly nationally in the United States and runs bubly POP through PepsiCo Canada |
| The Coca-Cola Company | Multinational beverage group | Owns Topo Chico, with flavored lines unaffected by the 2026 mineral water pause |
| Polar Beverages | Independent bottler | Sells Polar Seltzer through its own territory and a Keurig Dr Pepper franchise agreement |
| Keurig Dr Pepper | Beverage group and distributor | Makes, distributes and sells Polar Seltzer across most of its direct store delivery footprint under the 2020 agreement |
| Waterloo Sparkling Water | Independent brand owner | Sells unsweetened flavored sparkling water in aluminum cans through Target, Kroger divisions, Whole Foods, Aldi and Amazon |
Credence Research sees sparkling keeping its lead
Credence Research's view is that flavored sparkling water keeps its lead through 2035, because policy and retail trends both favor zero-sugar drinks with strong flavors. Dietary guidance from January 2026 and Canadian labels reinforce that direction, while online grocery lets smaller premium brands reach buyers without full store distribution. The largest near-term risk is can cost, since brands are moving into aluminum as tariffs keep the Midwest premium high. Mexico deserves close attention, but growth there depends on unsweetened formulas that avoid the new excise charge.
How Credence Research built these estimates
The report uses 2025 as the base year and 2035 as the forecast year, with market values taken from the Credence Research market model. Country, segment and price-tier splits are Credence Research estimates, informed by trade association statistics, company releases, government data, retailer price listings and news reports opened during preparation. Mexico and the rest of North America are Credence Research assumptions scaled from population, because no public flavored water sales series was found for them. No interviews or surveys were conducted for this edition, and readers should treat the shares as modeled estimates.
Premium, online and Mexico set the growth pace to 2035
The market is expected to reach USD 22.06 billion by 2035, with growth led by premium ranges, online orders and Mexico from a small base. Sparkling formats should keep most new launches, and cans should take share from PET as brands add caffeine and functional variants. Tariff policy will shape how fast that pack shift happens. Sugar rules are unlikely to reverse, since WHO has urged countries to raise real prices of sugary drinks by at least 50% by 2035. Suppliers with reliable water sources and strong retail coverage are best placed.
Frequently Asked Questions
How big is the North America flavored water market?
Which country leads the North America flavored water market?
Which country grows fastest in this market?
Which product type holds the largest share?
Which distribution channel grows fastest?
Why are aluminum cans gaining share in flavored water?
What are the main challenges facing this market?
Who are the key companies in this market?
Table of Content
Chapter 1 Market Segmentation
- 1.1 Segmentation Framework
- 1.1.1 Product and Service Classification
- 1.1.2 Application and End-Use Classification
- 1.1.3 Technology and Solution Classification
- 1.1.4 Customer and Distribution Channel Classification
- 1.1.5 Geographic Segmentation
- 1.1.6 Market Segment Definitions and Boundaries
- 1.2 By Product Type
- 1.2.1 Flavored Sparkling Water
- 1.2.2 Flavored Still Water
- 1.3 By Price Tier
- 1.3.1 Value
- 1.3.2 Mainstream
- 1.3.3 Premium
- 1.4 By Packaging Format
- 1.4.1 Plastic Bottles
- 1.4.2 Aluminum Cans
- 1.4.3 Glass and Alternative Packs
- 1.5 By Country
- 1.5.1 United States
- 1.5.2 Canada
- 1.5.3 Mexico
- 1.5.4 Rest of North America
Chapter 2 Introduction
- 2.1 Report Objectives and Scope
- 2.2 Product Definition and Industry Terminology
- 2.3 Market Inclusions and Exclusions
- 2.4 Research Process
- 2.4.1 Primary Research and Expert Interviews
- 2.4.2 Secondary Research and Source Review
- 2.4.3 Top-Down and Bottom-Up Estimation
- 2.4.4 Data Triangulation and Verification
- 2.5 Market Size Measurement Basis
- 2.5.1 2025: USD 9.95 billion → 2035: USD 22.06 billion
- 2.6 Historical and Forecast Reference Periods
- 2.6.1 Historical Period: 2018-2025
- 2.6.2 Base Year: 2025
- 2.6.3 Forecast Period: 2025-2035
- 2.7 Research Assumptions and Limitations
Chapter 3 Executive Summary
- 3.1 Market Snapshot and Key Findings
- 3.2 Base-Year Market Size, 2025
- 3.3 Forecast Market Size, 2035
- 3.4 Revenue and Volume Growth Outlook
- 3.5 Key Demand and Supply Indicators
- 3.6 Leading Market Segments
- 3.7 Fastest-Growing Market Opportunities
- 3.8 Regional Performance Highlights
- 3.9 Technology and Industry Transformation
- 3.10 Competitive Landscape Summary
- 3.11 Analyst View and Strategic Implications
Chapter 4 North America Flavored Water Market Trends and Developments
- 4.1 Historical Industry Development, 2018-2025
- 4.2 Recent Market Trends and Developments
- 4.3 Demand and Customer Behavior Trends
- 4.4 Technology and Product Innovation
- 4.5 Artificial Intelligence, Automation and Digitalization
- 4.6 Local Manufacturing and Supply Chain Realignment
- 4.7 Industry Partnerships, Mergers and Acquisitions
- 4.8 Sustainability and Circular Economy Developments
- 4.9 Government and Private Sector Investment Trends
- 4.10 Emerging Business Models and Commercialization
- 4.11 Industry Developments and Announcements
Chapter 5 North America Flavored Water Market Production, Supply and Demand Analysis
- 5.1 Demand Trend and Consumption Analysis, 2018-2025
- 5.2 Demand Forecast, 2025-2035
- 5.3 Production and Output Trend, 2018-2025
- 5.4 Production and Output Forecast, 2025-2035
- 5.5 Installed Capacity and Capacity Utilization
- 5.6 Company-Wise Production Plants and Statistics
- 5.6.1 Installed Production Capacity
- 5.6.2 Actual Production
- 5.6.3 Planned Capacity and Expansion Targets
- 5.7 Supply Chain Structure and Procurement Trends
- 5.8 Supply-Demand Gap and Bottlenecks
- 5.9 Import Dependence and Sourcing Structure
- 5.10 Contract Manufacturing and Outsourcing
- 5.11 Regional Supply and Demand Concentration
Chapter 6 North America Flavored Water Market Pricing Analysis
- 6.1 Pricing Structure and Measurement
- 6.2 Historical Pricing Trends, 2018-2025
- 6.3 Pricing Outlook, 2025-2035
- 6.4 Average Selling Price and Unit Economics
- 6.5 Pricing by Product and Market Segment
- 6.6 Geographic Pricing Differences
- 6.7 Key Input, Energy, Labor and Logistics Costs
- 6.8 Contract Pricing and Purchasing Models
- 6.9 Pricing Sensitivity and Competitive Positioning
- 6.10 Price, Margin and Profitability Implications
Chapter 7 North America Flavored Water Market Dynamics
- 7.1 Market Growth Drivers
- 7.1.1 Demand-Side Drivers
- 7.1.2 Technology and Innovation Drivers
- 7.1.3 Infrastructure and Investment Drivers
- 7.1.4 Regulatory and Policy Drivers
- 7.2 Market Restraints
- 7.2.1 Cost and Affordability Constraints
- 7.2.2 Technology and Adoption Barriers
- 7.2.3 Supply Chain and Operational Constraints
- 7.3 Market Challenges
- 7.3.1 Competitive Pressure and Margin Erosion
- 7.3.2 Skills, Infrastructure and Implementation Gaps
- 7.4 Emerging Market Opportunities
- 7.5 Market Dynamics Impact and Time-Horizon Assessment
Chapter 8 North America Flavored Water Value Chain Analysis
- 8.1 Industry Value Chain Overview
- 8.2 Upstream Suppliers and Critical Inputs
- 8.3 Technology and Component Providers
- 8.4 Manufacturing or Service Delivery
- 8.5 Distribution, Channel Partners and Integrators
- 8.6 Downstream Applications and End Users
- 8.7 Value Addition and Profit Pools
- 8.8 Vertical Integration and Outsourcing
- 8.9 Supplier Concentration and Risk
- 8.10 Supply Chain Localization and Resilience
Chapter 9 North America Flavored Water Market Regulations and Policies
- 9.1 Relevant Laws, Standards and Compliance Frameworks
- 9.2 Product, Service, Safety and Quality Requirements
- 9.3 Government Policies, Incentives and Subsidies
- 9.4 Imports, Exports and Trade Barriers
- 9.5 Public Procurement and Local Content Requirements
- 9.6 Environmental and Sustainability Compliance
- 9.7 Upcoming Policy Changes and Market Implications
Chapter 10 North America Flavored Water Market Hotspots and Opportunities
- 10.1 Market Opportunity Mapping and Growth Hotspots
- 10.2 High-Growth Applications and Customer Groups
- 10.3 Underserved Markets and White-Space Opportunities
- 10.4 Emerging Technology and Product Opportunities
- 10.5 New Capacity and Investment Hotspots
- 10.6 Market Entry and Expansion Opportunities
- 10.7 Distribution and Partnership Opportunities
- 10.8 Near-Term and Long-Term Commercial Potential
- 10.9 Opportunity Attractiveness and Execution Risks
Chapter 11 North America Flavored Water Market Outlook, 2025-2035
- 11.1 Market Size and Analysis
- 11.1.1 Revenue (Market Measurement: 2025: USD 9.95 billion → 2035: USD 22.06 billion)
- 11.1.2 Market Volume and Quantity Sold
- 11.1.3 Historical Market Size, 2018-2025
- 11.1.4 Base-Year Market Size, 2025
- 11.2 Market Forecast, 2025-2035
- 11.2.1 Revenue Forecast to 2035
- 11.2.2 Volume Forecast to 2035
- 11.2.3 CAGR and Year-on-Year Growth
- 11.2.4 Incremental Revenue Opportunity
- 11.3 Forecast Assumptions and Scenario Analysis
- 11.3.1 Base-Case Forecast
- 11.3.2 Optimistic and Conservative Scenarios
- 11.3.3 Technology, Pricing and Policy Sensitivities
- 11.4 Market Attractiveness and Growth Outlook
Chapter 12 North America Flavored Water Market Segmentation and Outlook
- 12.1 Segmentation Summary and Market Shares, 2025
- 12.2 Largest and Fastest-Growing Segments
- 12.3 By Product Type - Market Size and Forecast, 2025-2035
- 12.3.1 Segment Definition and Scope
- 12.3.2 Historical Market Size, 2018-2025
- 12.3.3 Revenue Forecast, 2025-2035
- 12.3.4 Volume Forecast, 2025-2035
- 12.3.5 Base-Year Market Share, 2025
- 12.3.6 Segment CAGR and Growth Drivers
- 12.3.7 Subsegment Market Size and Forecast
- 12.3.7.1 Flavored Sparkling Water
- 12.3.7.2 Flavored Still Water
- 12.3.8 Subsegment Pricing and Adoption Trends
- 12.3.9 Leading Suppliers and Competition
- 12.3.10 Regional Demand and Opportunities
- 12.4 By Price Tier - Market Size and Forecast, 2025-2035
- 12.4.1 Segment Definition and Scope
- 12.4.2 Historical Market Size, 2018-2025
- 12.4.3 Revenue Forecast, 2025-2035
- 12.4.4 Volume Forecast, 2025-2035
- 12.4.5 Base-Year Market Share, 2025
- 12.4.6 Segment CAGR and Growth Drivers
- 12.4.7 Subsegment Market Size and Forecast
- 12.4.7.1 Value
- 12.4.7.2 Mainstream
- 12.4.7.3 Premium
- 12.4.8 Subsegment Pricing and Adoption Trends
- 12.4.9 Leading Suppliers and Competition
- 12.4.10 Regional Demand and Opportunities
- 12.5 By Packaging Format - Market Size and Forecast, 2025-2035
- 12.5.1 Segment Definition and Scope
- 12.5.2 Historical Market Size, 2018-2025
- 12.5.3 Revenue Forecast, 2025-2035
- 12.5.4 Volume Forecast, 2025-2035
- 12.5.5 Base-Year Market Share, 2025
- 12.5.6 Segment CAGR and Growth Drivers
- 12.5.7 Subsegment Market Size and Forecast
- 12.5.7.1 Plastic Bottles
- 12.5.7.2 Aluminum Cans
- 12.5.7.3 Glass and Alternative Packs
- 12.5.8 Subsegment Pricing and Adoption Trends
- 12.5.9 Leading Suppliers and Competition
- 12.5.10 Regional Demand and Opportunities
- 12.6 By Country - Market Size and Forecast, 2025-2035
- 12.6.1 Segment Definition and Scope
- 12.6.2 Historical Market Size, 2018-2025
- 12.6.3 Revenue Forecast, 2025-2035
- 12.6.4 Volume Forecast, 2025-2035
- 12.6.5 Base-Year Market Share, 2025
- 12.6.6 Segment CAGR and Growth Drivers
- 12.6.7 Subsegment Market Size and Forecast
- 12.6.7.1 United States
- 12.6.7.2 Canada
- 12.6.7.3 Mexico
- 12.6.7.4 Rest of North America
- 12.6.8 Subsegment Pricing and Adoption Trends
- 12.6.9 Leading Suppliers and Competition
- 12.6.10 Regional Demand and Opportunities
- 12.7 Segment Growth Comparison
- 12.8 Segment Attractiveness and Priority Matrix
Chapter 13 North America Flavored Water Geographic Market Outlook, 2025-2035
- 13.1 Regional Market Size and Country-Level Shares, 2025
- 13.2 Country Market Size Comparison, 2025
- 13.3 Country Market Forecasts, 2025-2035
- 13.4 Subregional Industrial and Demand Clusters
- 13.5 Intra-Regional Pricing and Cost Differences
- 13.6 Cross-Border Trade and Supply Networks
- 13.7 Regional Supply and Demand Balances
- 13.8 Country Opportunity Comparison and Prioritization
Note: Every listed country is covered on the structure shown under the first country.
Chapter 14 North America Flavored Water Technology, Innovation and Sustainability Outlook
- 14.1 Technology Landscape and Maturity
- 14.2 Product, Process and Service Innovation
- 14.3 AI, Automation and Digital Tools in the Industry
- 14.4 Technology Adoption and Performance Benchmarking
- 14.5 Innovation Pipeline and R&D Investment
- 14.6 Patent and Intellectual Property Trends
- 14.7 Energy Efficiency and Resource Management
- 14.8 Sustainability, Recycling and Circularity
- 14.9 Technology Roadmap, 2025-2035
- 14.10 Risks of Obsolescence and Technology Substitution
Chapter 15 North America Flavored Water Market Key Strategic Imperatives
- 15.1 Growth and Market Entry Priorities
- 15.2 High-Return Products and Segments
- 15.3 Pricing, Profitability and Cost Optimization
- 15.4 Technology Investment and Product Differentiation
- 15.5 Supply Chain Localization and Resilience
- 15.6 Distribution and Customer Acquisition
- 15.7 Partnership, Acquisition and Capacity Strategy
- 15.8 Regional Expansion Priorities
- 15.9 Short-, Medium- and Long-Term Actions
Chapter 16 Competition Outlook
- 16.1 Industry Competition Characteristics
- 16.2 Market Structure and Concentration
- 16.3 Market Share and Competitive Positioning, 2025
- 16.4 Company-Wise Revenue and Product Benchmarking
- 16.5 Production and Service Capacity Benchmarking
- 16.6 Technology, Pricing and Differentiation
- 16.7 Regional Footprint and Distribution Strength
- 16.8 Mergers, Acquisitions and Strategic Alliances
- 16.9 New Entrants and Competitive Threats
- 16.10 Porter's Five Forces and Industry Attractiveness
- 16.11 Competitive Outlook, 2025-2035
Chapter 17 Company Profiles
- 17.1 Company Coverage and Selection Criteria
- 17.2 Talking Rain Beverage Company
- 17.2.1 Business Description
- 17.2.2 Company Ownership and Geographic Presence
- 17.2.3 Product and Service Portfolio
- 17.2.4 Manufacturing and Operating Footprint
- 17.2.5 Production Capacity and Expansion Plans
- 17.2.6 Financial Performance and Investment
- 17.2.7 Market Share and Competitive Position
- 17.2.8 Technology and Innovation Capabilities
- 17.2.9 Strategic Alliances or Partnerships
- 17.2.10 Recent Developments
- 17.2.11 Growth Strategy and Outlook
- 17.3 PepsiCo
- 17.4 The Coca-Cola Company
- 17.5 Polar Beverages
- 17.6 Keurig Dr Pepper
- 17.7 Waterloo Sparkling Water
- 17.8 Other Relevant Market Participants
Note: Every listed company is profiled on the structure shown under the first company. The company list is preliminary and may change based on research findings, market developments, data availability and client requirements.
Chapter 18 Disclaimer
- 18.1 Research and Forecast Disclaimer
- 18.2 Data Source and Estimation Limitations
Note: The depth of individual sections depends on data availability for this market. Volume, capacity, trade and other unit-based metrics are included where applicable.

