
Food makers drop E14xx starches from U.K. recipes
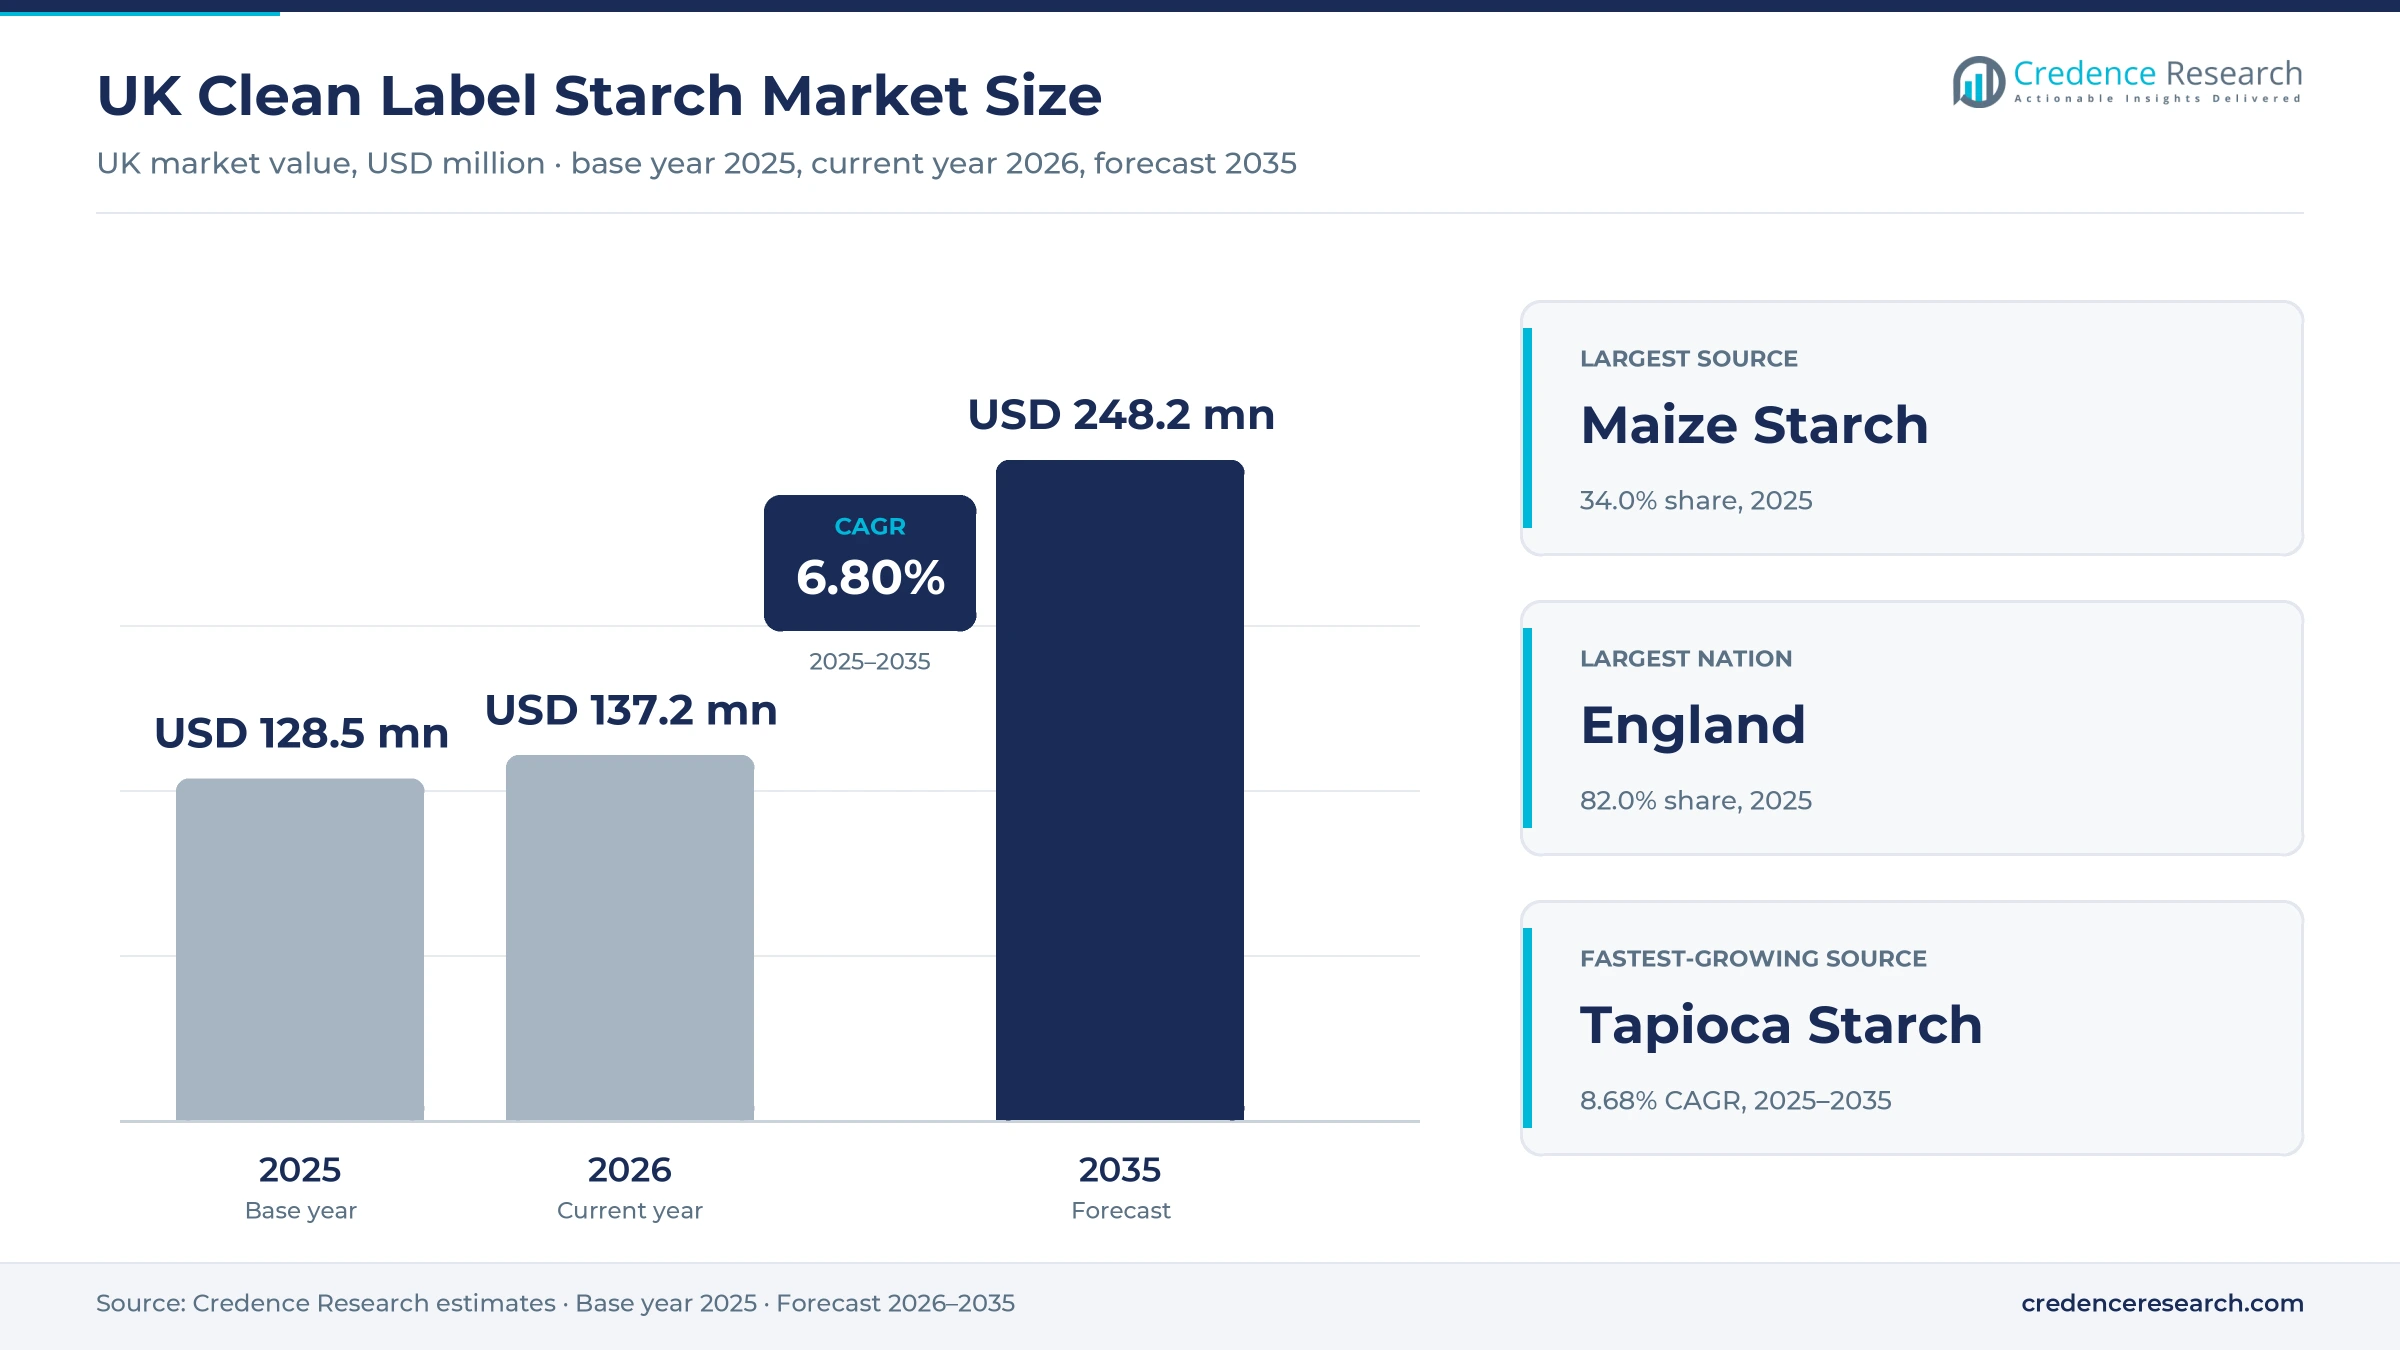
The U.K. clean label starch market was valued at USD 128.5 million in 2025 and is projected to increase from USD 137.2 million in 2026 to USD 248.2 million by 2035, registering a CAGR of 6.80% during 2025–2035. Demand comes from manufacturers of sauces, soups, bakery goods, desserts and ready meals that are removing chemically modified E14xx starches from ingredient lists, often at the request of supermarkets whose own-label ranges limit E-numbers. England held the largest share, 82.0% in 2025, because most U.K. food manufacturing sits there. The U.K. imports most of this starch, and in 2023 it bought USD 79.6 million of potato starch and USD 69.4 million of maize starch from abroad. The main regulatory change is the restriction on advertising less healthy food, in effect since Jan. 5, 2026, which pushes brands to cut sugar and fat and to restore texture with starch.
Which starches count as clean label in the U.K.?
The scope covers native starches and physically modified, or functional native, starches from maize, potato, tapioca, wheat, rice and other crops. These starches let a label read simply "starch" or "potato starch" while giving body, gel strength and shelf life to sauces, desserts and baked goods. Value is allocated to the U.K. nation where the food is manufactured, not where it is eaten.
Chemically modified food starches labeled E1404 to E1452 are excluded, as are glucose syrups and other starch sweeteners and starch used in paper, textiles and adhesives. Flours sold as flour rather than starch are also excluded.
UK Clean Label Starch Market Insights
- The U.K. clean label starch market is projected to grow from USD 137.2 million in 2026 to USD 248.2 million by 2035, a 6.80% CAGR, as manufacturers drop E14xx starches.
- England held 82.0% of 2025 value, the largest share among U.K. nations, because most sauce, ready meal, bakery and dessert plants supplying supermarkets are there.
- Maize starch accounted for 34.0% of 2025 value, the largest source, because it is widely available in Europe and milled in the U.K.
- U.K. restrictions on advertising less healthy food took effect on Jan. 5, 2026, pushing brands to cut sugar and fat and restore texture with native starch.
- Tapioca starch is the fastest-growing source at 8.68% a year from 2025, as waxy and specialty grades replace modified starch in sauces and desserts.
Maize and sauces lead as tapioca and desserts grow fastest
Maize starch leads by source while tapioca starch grows fastest
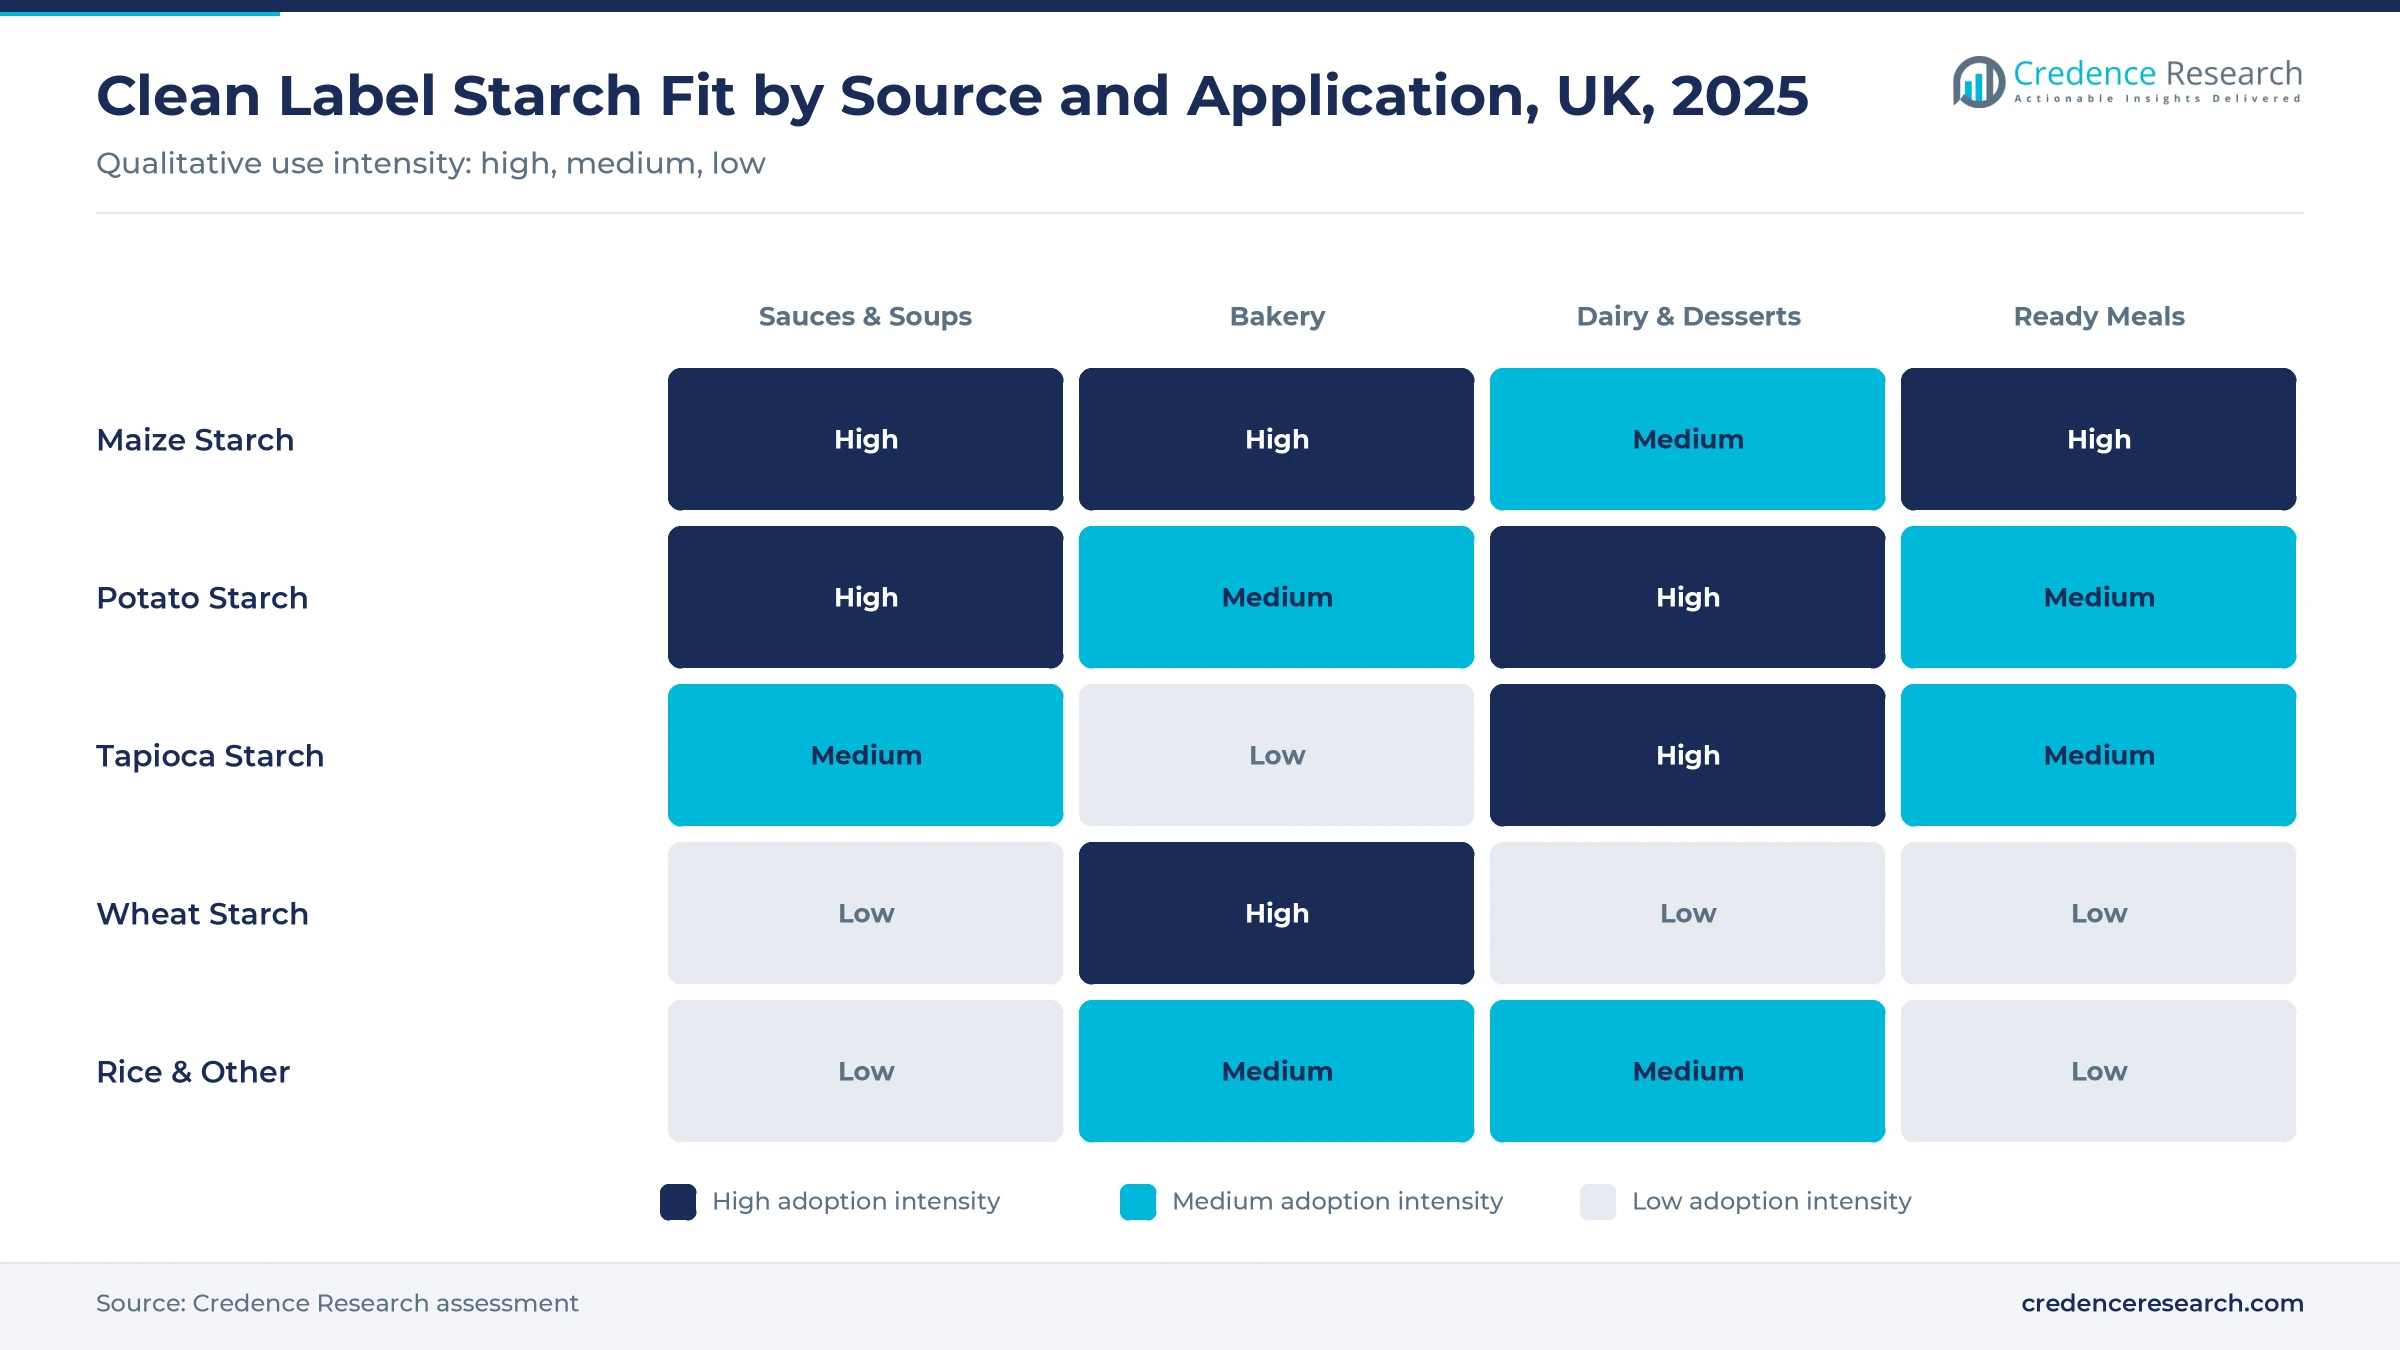
Based on source, the market is categorized into maize starch, potato starch, tapioca starch, wheat starch and rice and other starches. Maize starch led with 34.0% of 2025 value, because it is the most widely available starch in Europe. Tapioca starch grows fastest at 8.68% a year, as waxy tapioca grades give neutral taste and freeze stability, which favors suppliers with Thai and other Asian sourcing.
Soups, sauces and dressings lead applications while dairy and desserts grow fastest
Based on application, the market is categorized into soups, sauces and dressings, bakery and confectionery, dairy and desserts, ready meals and meat products, and beverages, infant and other foods. Soups, sauces and dressings led with 26.0% of 2025 value, as own-label sauce ranges reformulate whole lines at once. Dairy and desserts grow fastest at 7.63% a year, because yogurts, custards and plant-based desserts need creamy texture with a short label.
| Segment Group | Leading Sub-segment | Share, 2025 | Fastest-growing Sub-segment | CAGR, 2025–2035 |
|---|---|---|---|---|
| By Source | Maize Starch | 34.0% | Tapioca Starch | 8.68% |
| By Application | Soups, Sauces & Dressings | 26.0% | Dairy & Desserts | 7.63% |
Request a Free Sample
Fill in your details and we'll send you a free sample report.
- Sample data tables & charts
- Research methodology
Retailer policies and ad limits pull E14xx from recipes
Supermarket own-label policies reformulate whole ranges at once
U.K. supermarkets sell a large share of food under their own labels, and their technical teams set ingredient policies for suppliers. Many own-label ranges now limit E-numbers and other cues that shoppers link to ultra-processed food, so makers of soups, sauces and ready meals reformulate whole ranges in a single project. Soups, sauces and dressings, the largest application at 26.0% of 2025 value, carry most of this demand over the next 3 to five years, mainly in England.
Advertising limits on less healthy food push sugar and fat out of recipes
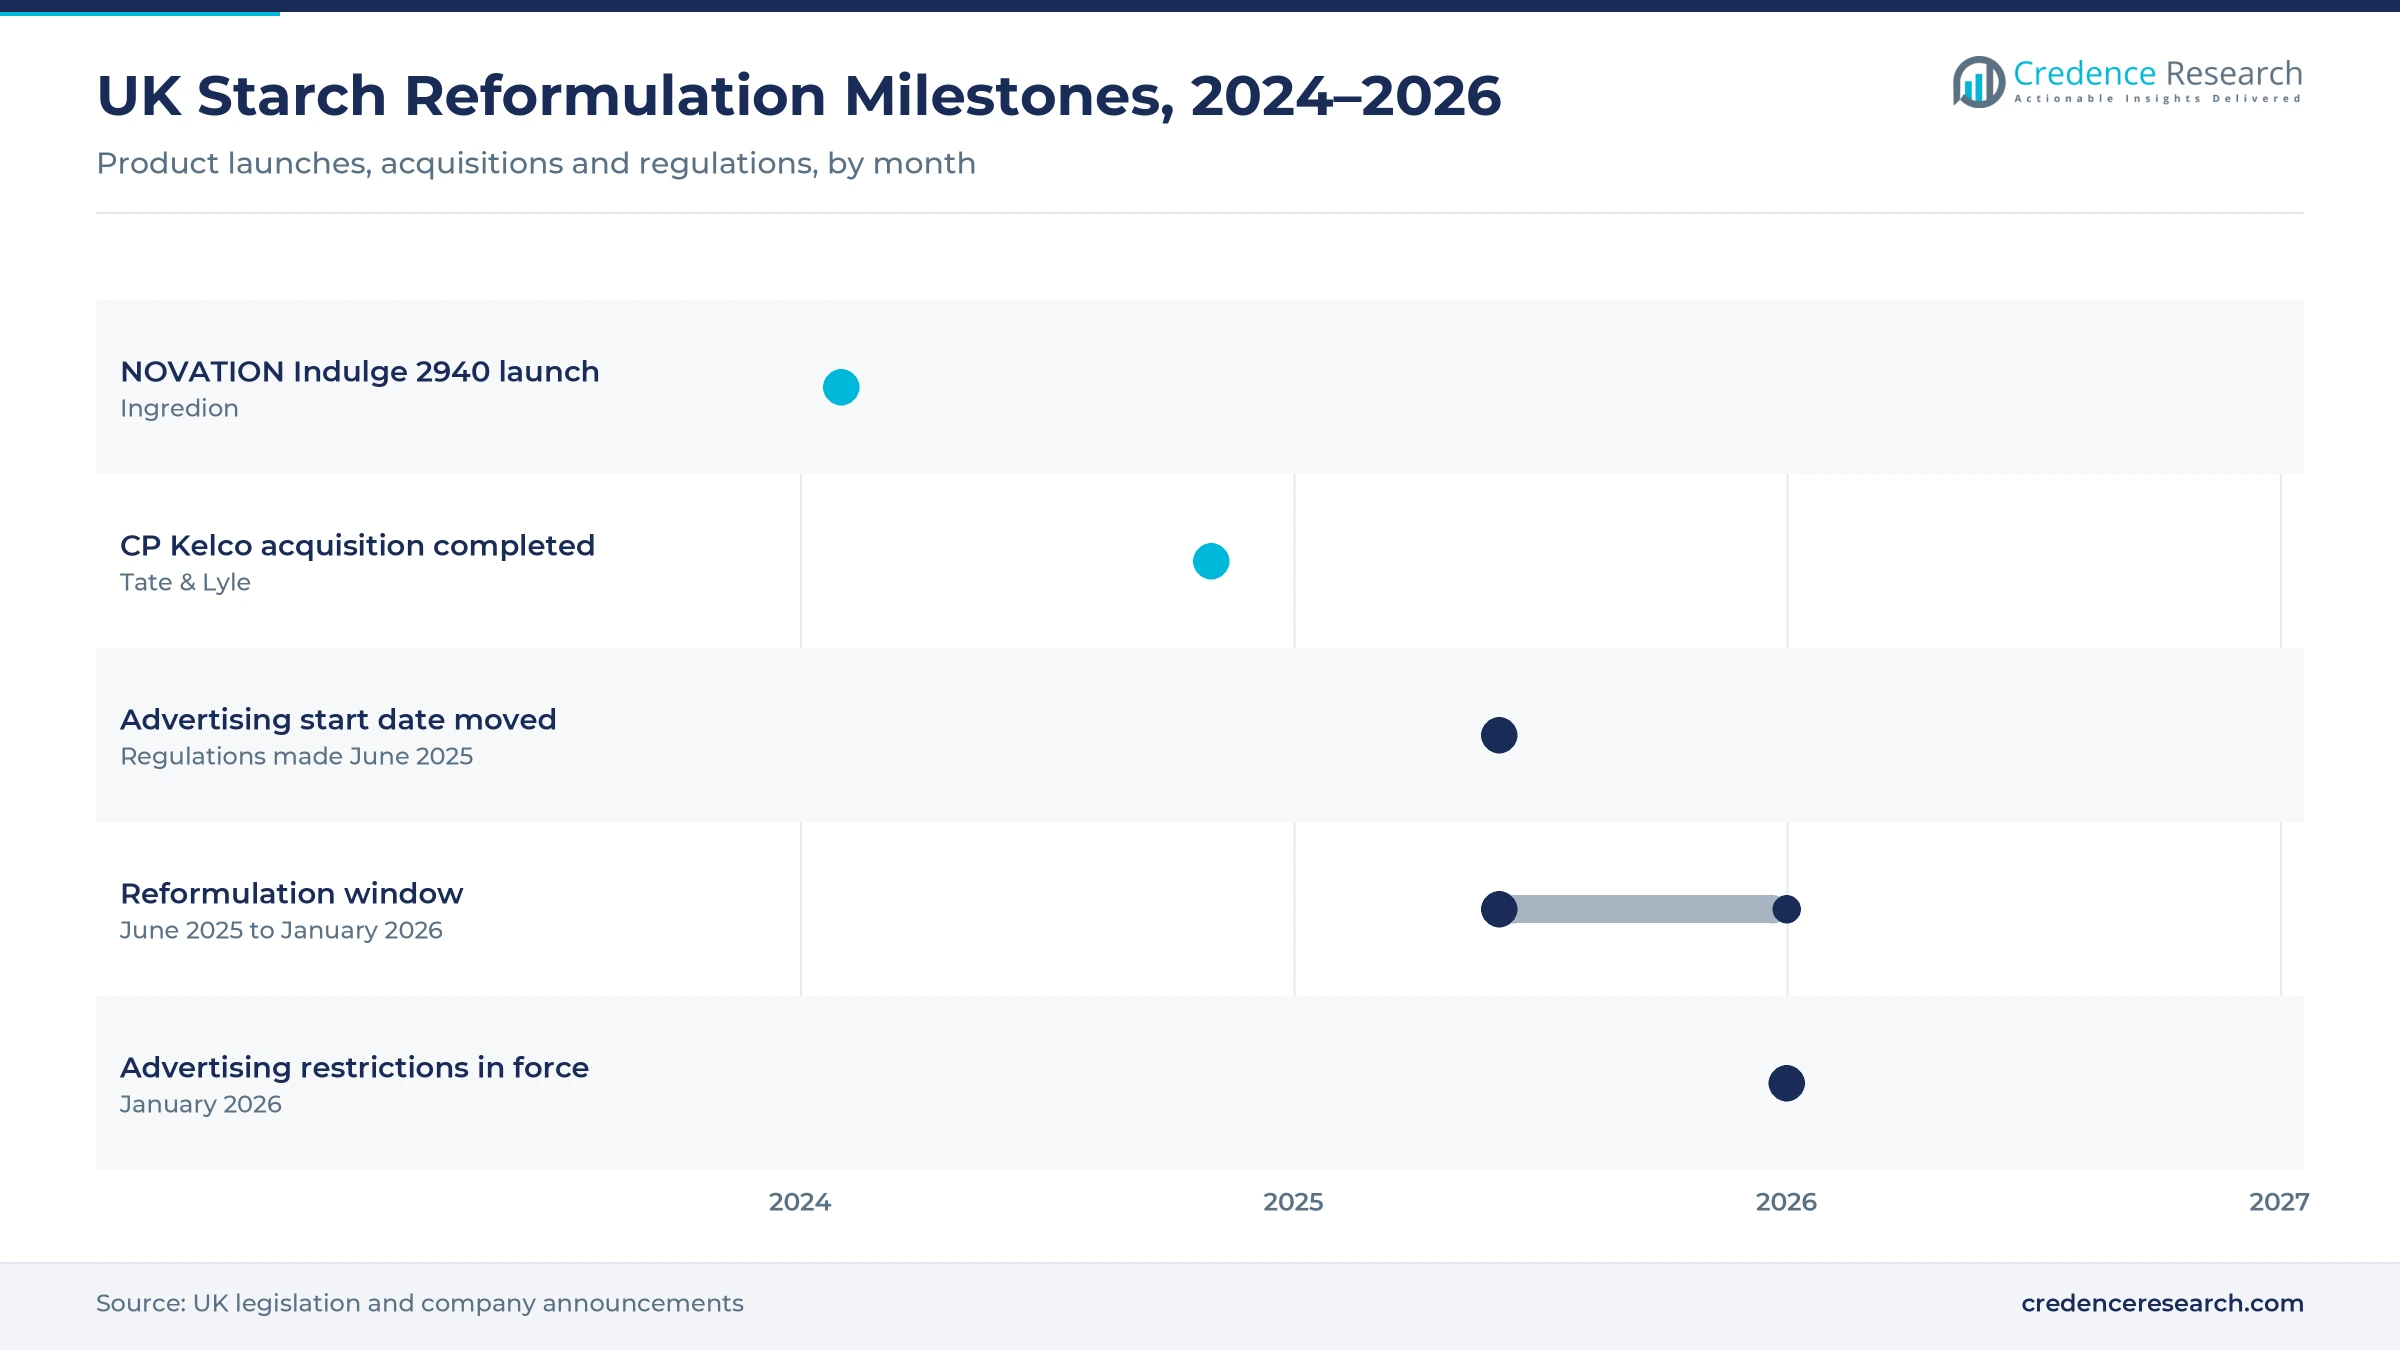
Under regulations made on June 3, 2025, and published on legislation.gov.uk, U.K. restrictions on advertising less healthy food on TV and online took effect on Jan. 5, 2026, moved back from Oct. 1, 2025. Brands that cut sugar and fat to keep products advertisable lose body and mouthfeel, and native starch helps restore both. The effect is medium term and strongest for desserts, sauces and bakery goods sold by national brands across all 4 U.K. nations.
Functional native starches now match modified grades in most recipes
Older native starches broke down under heat, acid and freezing, which is why manufacturers used chemically modified grades. Physically treated native starches now give similar stability with a simple label, so reformulation no longer means a weaker product. In February 2024, Ingredion launched NOVATION Indulge 2940, a functional native corn starch for dairy, alternative dairy and desserts, according to Ingredion. Suppliers with these ranges win the switch from E14xx grades.
Imports supply the grades U.K. recipes need
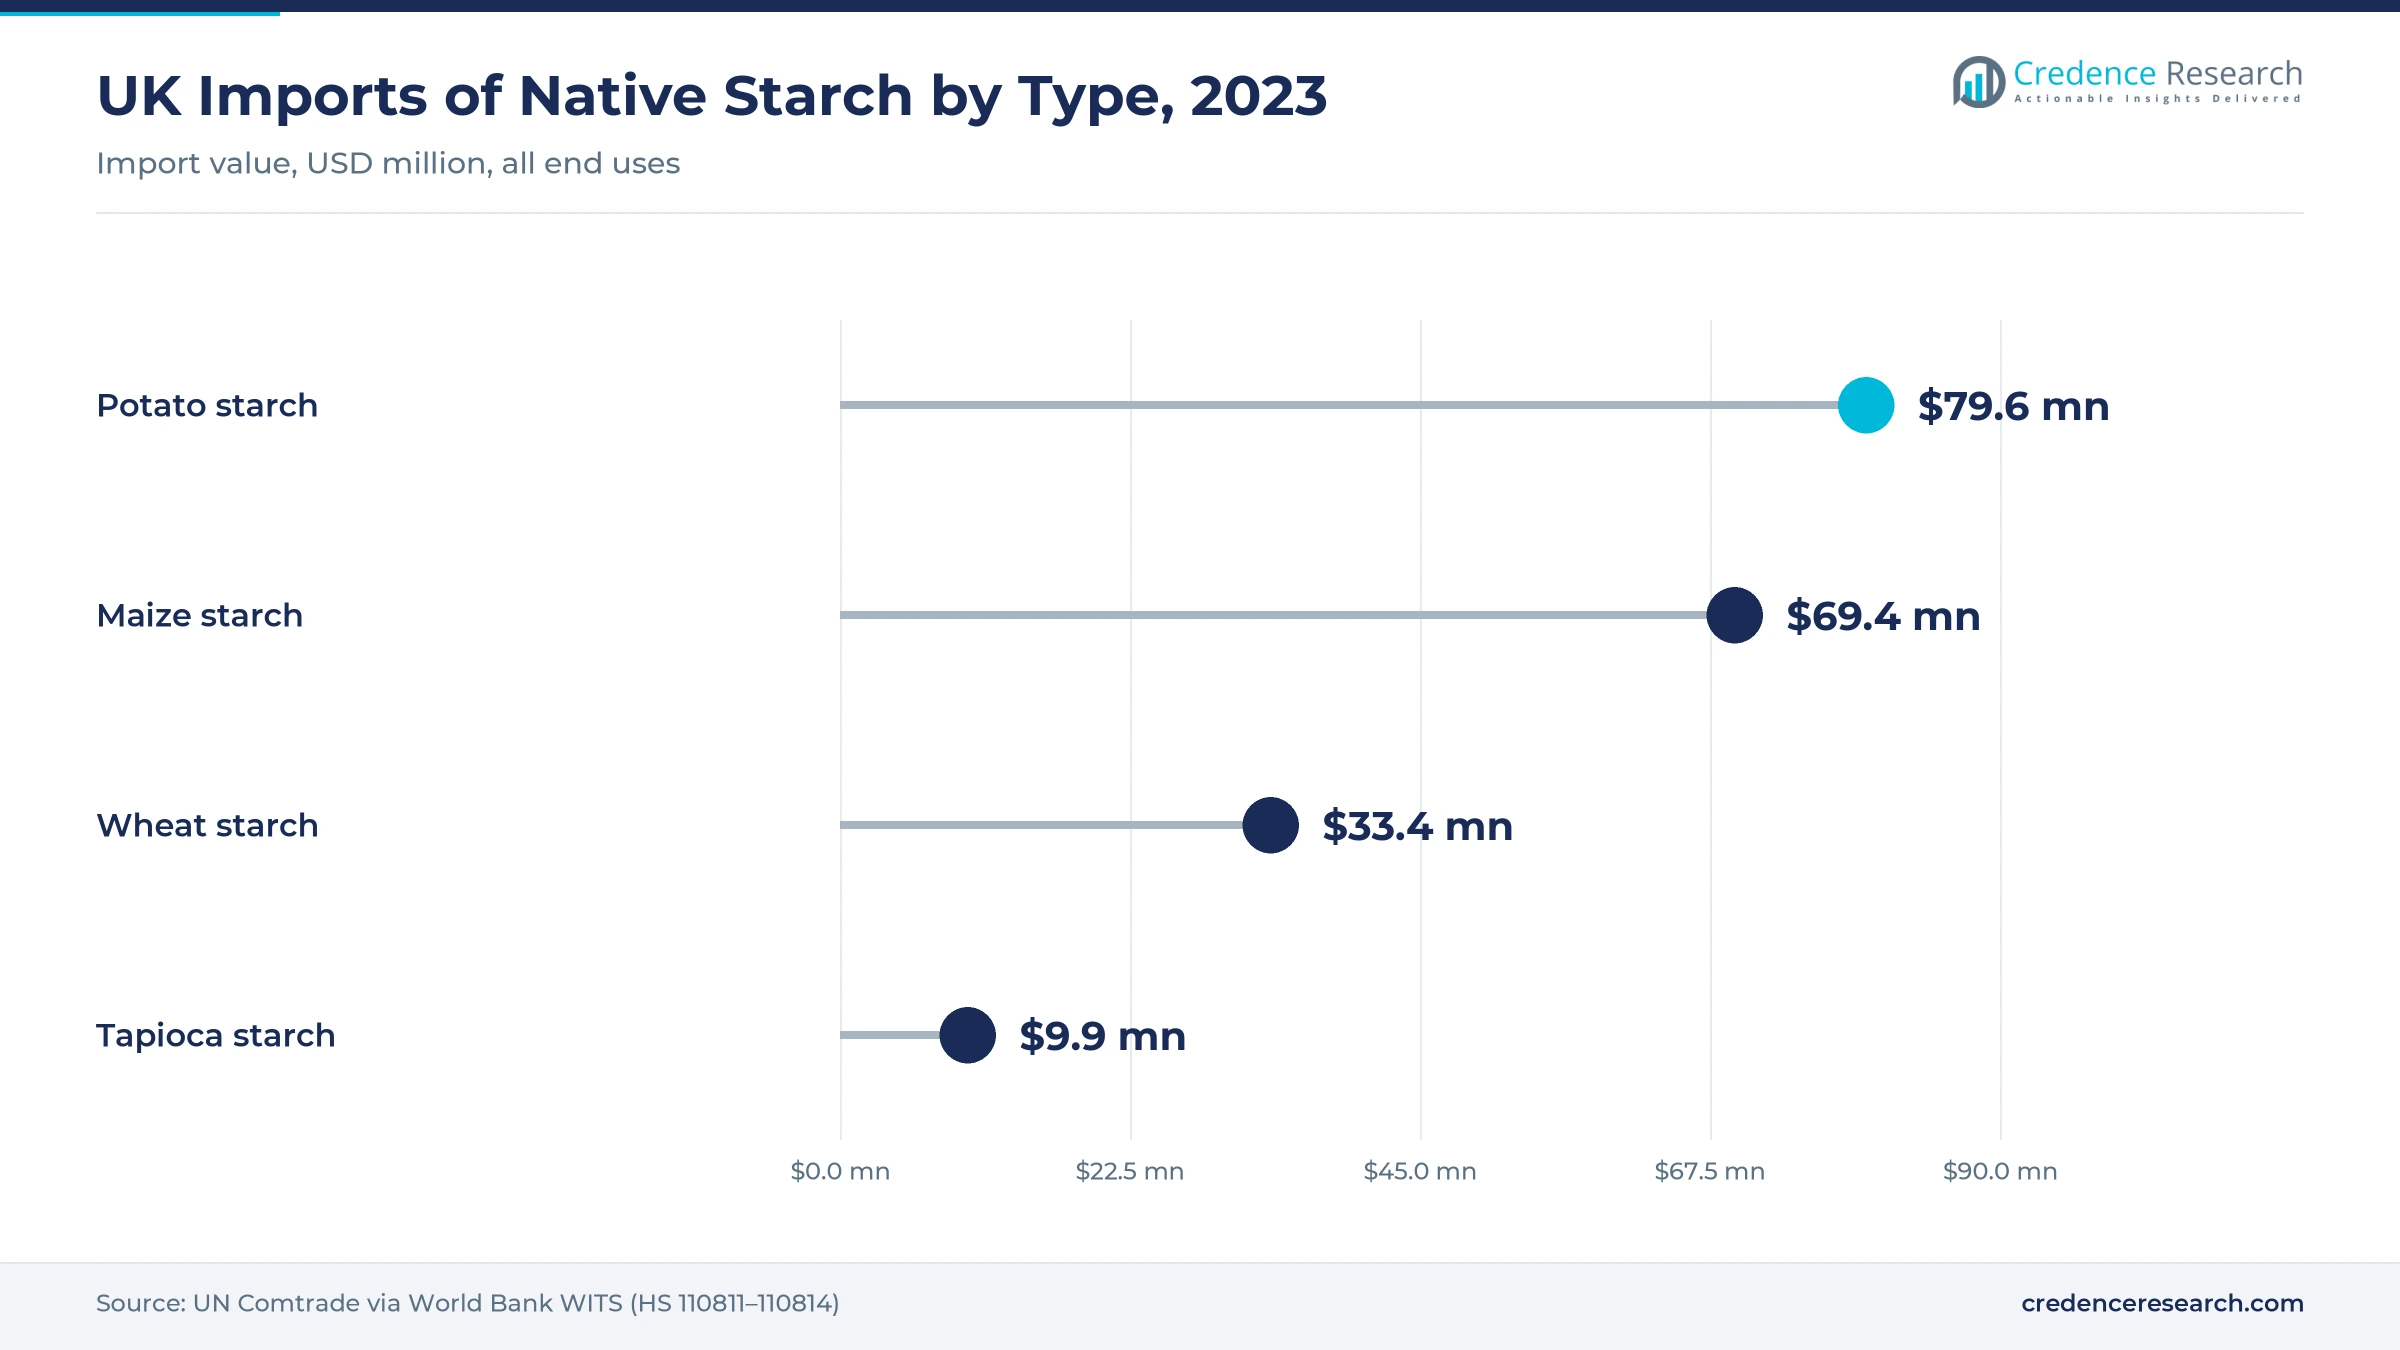
The U.K. imported USD 79.6 million of potato starch, USD 69.4 million of maize starch, USD 33.4 million of wheat starch and USD 9.9 million of tapioca starch in 2023, according to UN Comtrade data on World Bank WITS. Denmark alone supplied USD 33.7 million of potato starch, and Germany USD 18.5 million of maize starch. These flows give U.K. food makers access to waxy, specialty and organic native grades that domestic milling does not produce at scale, which keeps imports central to reformulation.
Waxy grades and texture systems change starch buying
Waxy and specialty native grades increasingly replace modified starch
Waxy maize, potato and tapioca starches hold texture better than standard grades through cooking, chilling and freezing, so they are replacing modified starch in sauces and desserts. Tapioca starch is the fastest-growing source at 8.68% a year, although the U.K. imported only 10,602 metric tons of it in 2023, mostly from Thailand. This trend favors suppliers with secure cassava sourcing and lifts the value share of premium native grades.
Buyers shift from single-starch purchases to texture systems
Ingredient makers increasingly sell blends of native starch, fibers and gums as one texture system, which simplifies reformulation for mid-sized manufacturers. In November 2024, for example, Tate & Lyle completed its CP Kelco acquisition, adding pectin and specialty gums to its texture portfolio, as reported by Baking Business. Buyers thus gain 1 supplier for texture, stability and label claims, while single-product starch sellers face pressure to partner or sell through specialist blenders.
Dairy and plant-based desserts needing short-label creaminess open an opportunity
Yogurts, custards, puddings and plant-based desserts need starch for creamy texture, and many brands want labels listing only familiar ingredients. Dairy and desserts are the fastest-growing application at 7.63% a year, and plant-based dairy alternatives add demand because they lack milk protein structure. Suppliers offering gelling native starches tested on U.K. dairy lines can win multi-year agreements with dessert makers and their retail customers.
Gluten-free bakery and free-from ready meals offer an opportunity
Gluten-free bakery, meat alternatives and free-from ready meals depend on starch for structure, since wheat flour and gluten cannot be used. Rice, pea and tapioca starches suit these recipes, so growing free-from ranges lift demand for allergen-controlled supply. The opening favors specialists such as Beneo for rice starch and potato co-operatives for clear, neutral gels, though volumes per account stay small.
Cost, import dependence and heat limits slow reformulation
Functional native starches cost more per recipe
Functional native starches cost more than the modified grades they replace, and recipes may need a higher dose for the same viscosity. Because own-label suppliers work on tight margins, cost slows reformulation in value ranges and where shoppers rarely read labels. Manufacturers therefore reformulate premium and mid-tier ranges first, use dose-cutting blends and negotiate annual contracts that smooth price swings across 2 or more harvests.
Import dependence exposes prices to EU harvests and sterling
Most U.K. clean label starch is imported, so prices follow EU potato and maize harvests, Thai cassava supply and sterling. Potato starch imports reached 66,227 metric tons in 2023, so a poor European potato crop can raise sauce and dessert makers' costs within 1 season, while post-Brexit border checks add paperwork and lead time. Buyers mitigate by dual sourcing across maize, potato and tapioca and holding safety stock.
Retorted, frozen and long-life products still need modified starch
Retorted sauces, frozen meals and long-life desserts face extreme heat, shear or freeze-thaw cycles that only chemically modified starch handles reliably. These categories reformulate last, limiting clean label penetration in ready meals and canned foods. Suppliers address the gap with new physically treated grades and customer-line trials, but full replacement in the hardest recipes may take most of the decade to 2035.
No legal definition of clean label in the U.K.
Without a legal U.K. definition of clean label, each retailer and brand sets its own rules on which starches and processes qualify. Demand is therefore uneven, since a supplier qualified with one retailer may need new trials for another and policy changes can stall projects. Suppliers mitigate by documenting processing methods, offering several label options per grade and engaging retailer technical teams before policies are finalized.
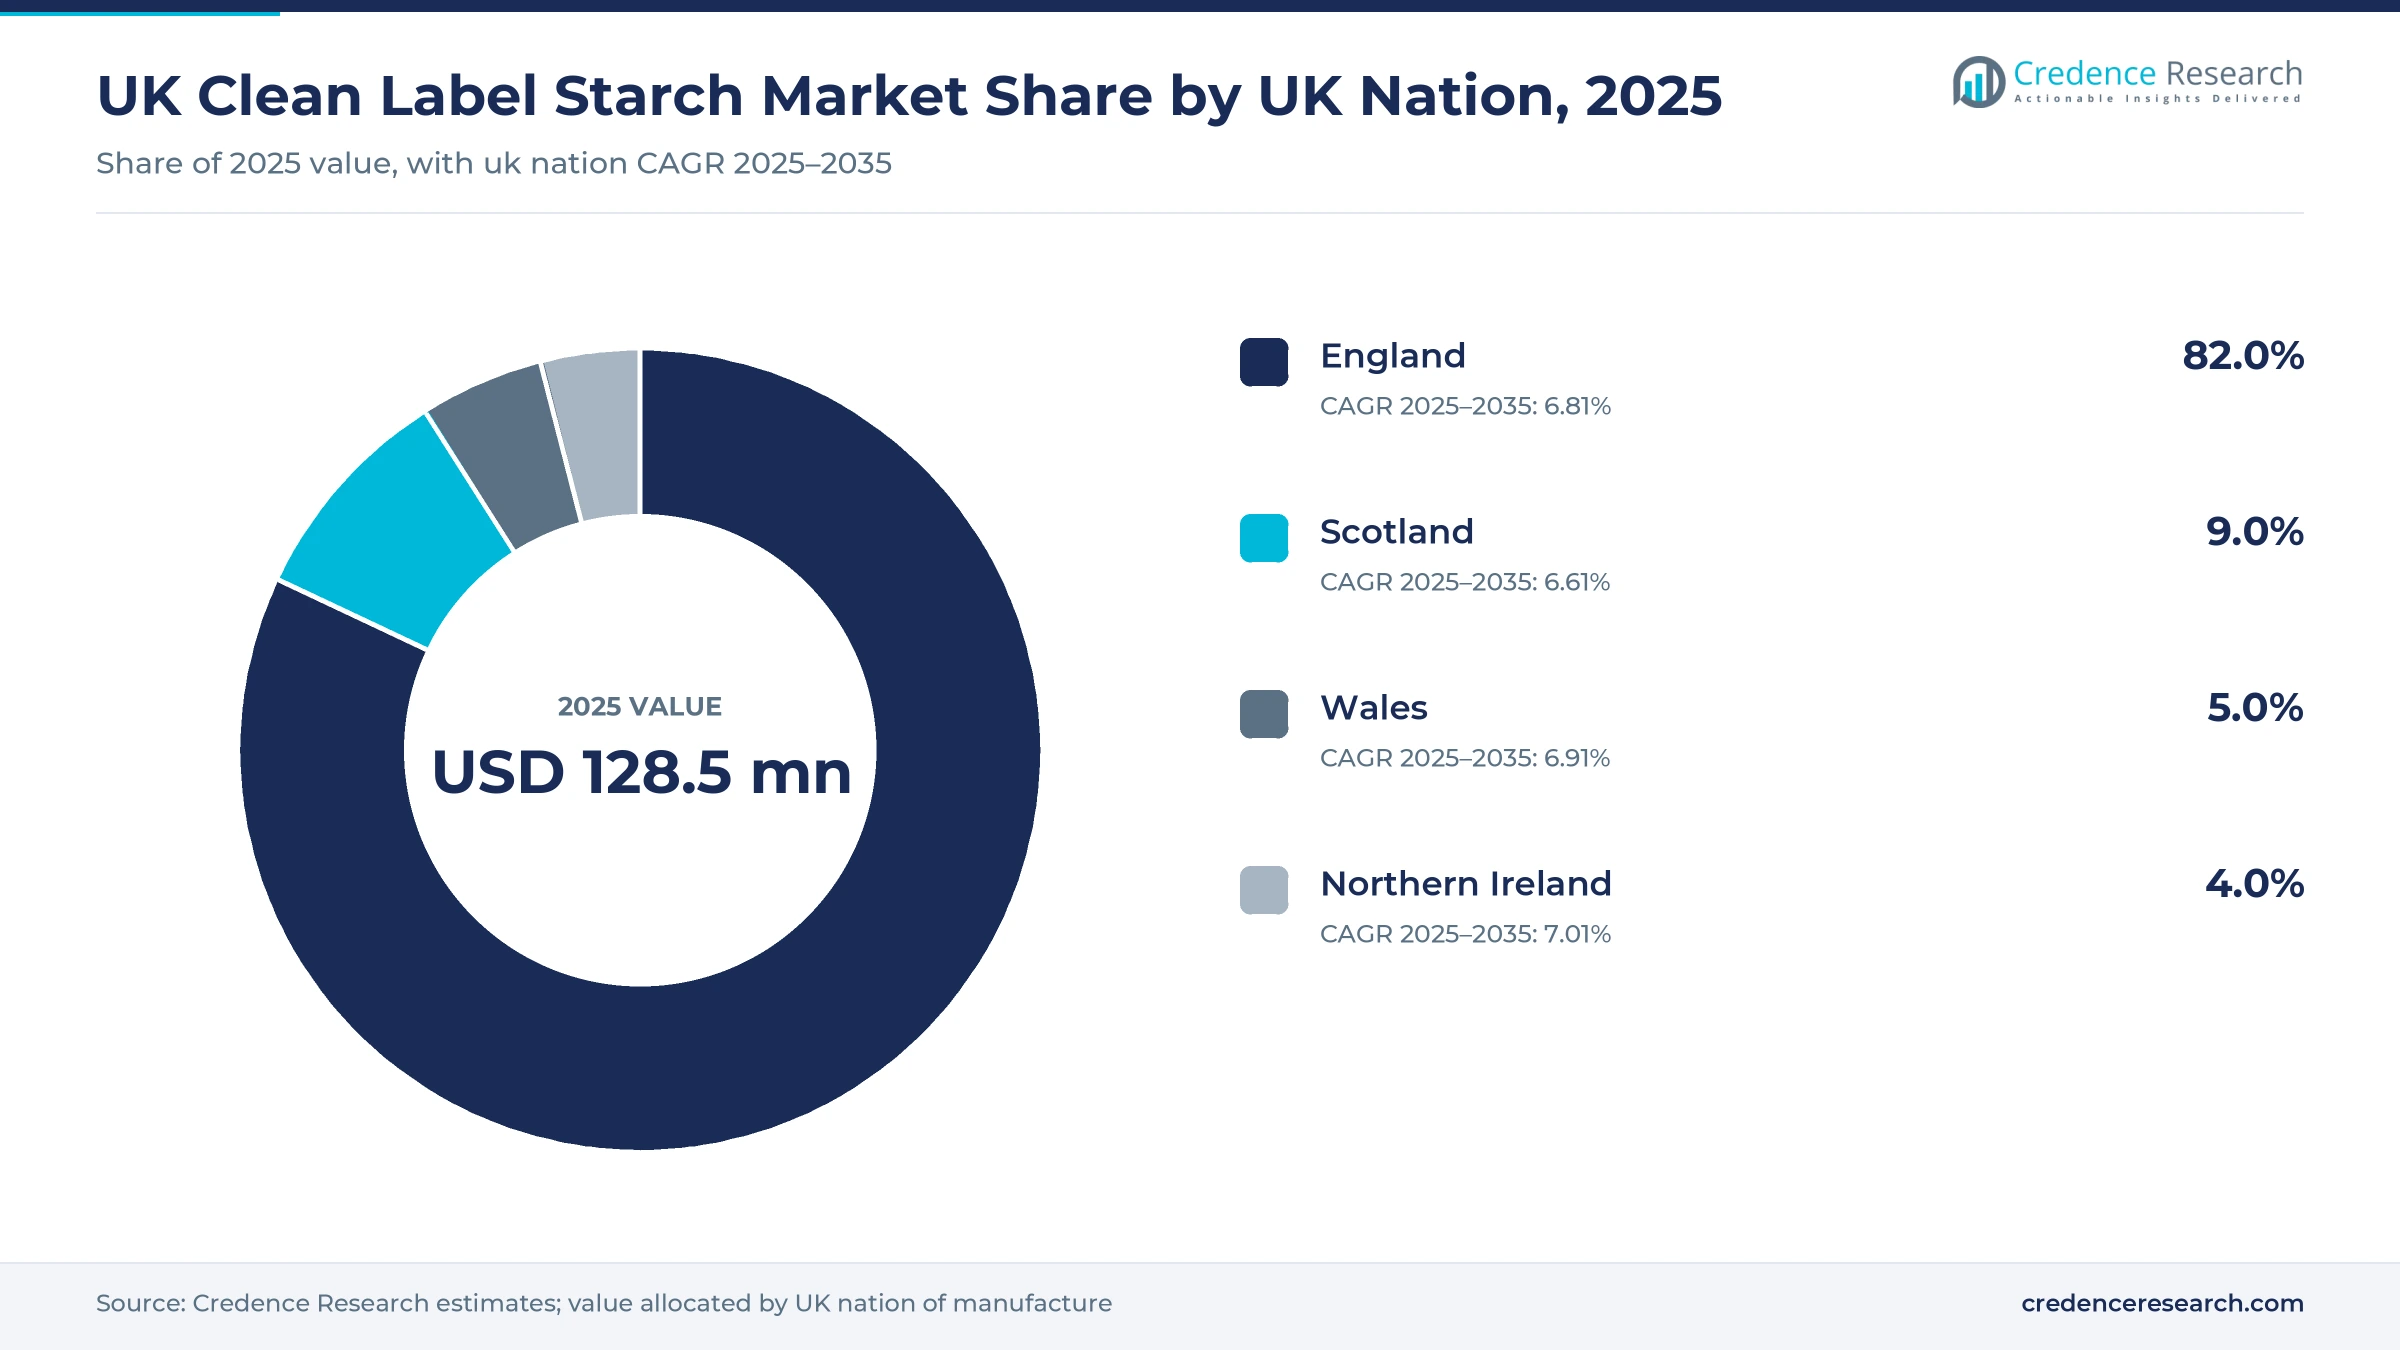
England leads demand while Northern Ireland grows fastest
| U.K. Nation | Share, 2025 | CAGR, 2025–2035 |
|---|---|---|
| England | 82.0% | 6.81% |
| Scotland | 9.0% | 6.61% |
| Wales | 5.0% | 6.91% |
| Northern Ireland | 4.0% | 7.01% |
England demand is anchored by own-label and branded food plants
England held 82.0% of 2025 value and grows at 6.81% a year. Sauce, ready meal, bakery and dessert plants in the Midlands, Yorkshire, the North West and East Anglia supply the major supermarkets, so retailer ingredient policies reach them first. Cargill's Manchester maize wet mill gives England the U.K.'s main domestic starch base, while potato starch from Denmark, worth USD 33.7 million in 2023, and from the Netherlands and Germany serves sauce and dessert lines.
Scotland's soups, bakery and prepared foods follow retailer policies
Scotland held 9.0% of 2025 value and grows at 6.61% a year, the slowest rate among the four nations. Demand comes from makers of soups, bakery goods and prepared foods, many supplying the same national supermarkets as English plants under the same own-label rules. Smaller Scottish bakeries and sauce makers buy mainly through distributors, so application support often reaches them later.
Wales adds above-average growth from dairy and convenience food plants
Wales held 5.0% of 2025 value and grows at 6.91% a year, slightly above the U.K. rate of 6.80%. Dairy and convenience food plants account for most Welsh demand, and because dairy desserts are the fastest-growing application nationally, Wales has above-average exposure to gelling native starches for yogurts, custards and puddings. Welsh convenience food makers follow the same supermarket reformulation programs as English plants.
Northern Ireland grows fastest on dairy, meat and convenience makers
Northern Ireland held 4.0% of 2025 value and is the fastest-growing U.K. nation at 7.01% a year. Dairy, meat and convenience food makers there supply both U.K. and EU markets, so they must satisfy retailer policies on both sides.
A dairy starch launch and a texture deal mark 2024–2026
| Development | Status and market relevance |
|---|---|
| In January 2026, U.K. restrictions on advertising less healthy food on TV and online came into force on Jan. 5. | In force. Adds pressure on brands to reformulate, often with starch-based texture. |
| In June 2025, the U.K. made regulations moving the start of the less healthy food advertising restrictions from Oct. 1, 2025, to Jan. 5, 2026. | Made. Set the final timetable for reformulation work. |
| In November 2024, Tate & Lyle acquired CP Kelco, a maker of pectin and specialty gums. | Completed. Combines starch texturants with gums in one portfolio. |
| In February 2024, Ingredion launched NOVATION Indulge 2940, a functional native corn starch for dairy, alternative dairy and desserts. | Launched. Extends clean label texture into dairy desserts. |
Physical treatment and waxy grades shape starch technology
- Physical treatment with heat and moisture makes native starch resist heat, acid and shear without chemical modification, so the label can read simply "starch".
- Waxy native grades of maize, potato and tapioca starch give stable, creamy textures through chilling and freezing for sauces and desserts.
- Texture systems that blend native starch, fibers and gums let one ingredient replace a modified starch and stabilizer pair in a recipe.
- Application testing in supplier labs runs trials on customer lines to match texture, process stability and retailer label rules before a switch.
Need a Custom Version of This Report?
Tailor the scope, geography, or segments to your exact requirements.
- Custom geography or segment scope
- Direct access to our analyst team
Texture firms and potato co-operatives compete for accounts
Three supplier groups serve U.K. food makers, led by global starch and texture companies Ingredion, Cargill, Tate & Lyle and Roquette, which sell physically modified native ranges for sauces, dairy and bakery. European potato starch producers, including Avebe and KMC with Dutch and Danish growers and Emsland Group from Germany, supply clear, neutral potato starches. Beneo supplies rice starch, while Tereos and ADM supply maize and wheat starch. Distributors and blenders, the third group, serve smaller bakeries and sauce makers. U.K. buyers choose suppliers through application trials on their own lines rather than price lists, which favors companies with U.K. technical centers or distributor labs. No supplier publishes U.K. clean label starch sales, so no share ranking is given.
Starch suppliers profiled and their roles
| Company | Type | Role in the market |
|---|---|---|
| Ingredion | Global texture company | Functional native ranges, including NOVATION Indulge 2940 for dairy and desserts |
| Cargill | Global texture company | Maize wet milling in Manchester and clean label texturizers |
| Tate & Lyle | Global texture company | Starch texturants plus pectin and gums after the CP Kelco acquisition |
| Roquette | Global starch maker | Native and functional starches for sauces, dairy and bakery |
| Avebe | Potato co-operative | Potato starches from Dutch growers |
| KMC | Potato co-operative | Potato starches from Danish growers |
| Emsland Group | Potato starch producer | Potato starches from Germany |
| Beneo | Specialty supplier | Rice starch |
| Tereos | Starch producer | Maize and wheat starch |
| ADM | Starch producer | Maize and wheat starch |
Retailer rules, not shoppers alone, set the switching pace
Credence Research's view is that U.K. retailers' ingredient policies, more than shopper demand alone, set the pace at which E14xx starches leave recipes. Once a retailer rewrites its own-label rules, whole sauce, dessert and ready meal ranges switch together, which is why sauces lead value and desserts lead growth. Suppliers with U.K. application labs, waxy native grades and secure imported supply are best placed, while the main risk is cost pressure in value ranges.
How Credence Research sized U.K. clean label starch demand
The report uses 2025 as the base year and forecasts to 2035, with CAGR calculated over 2025–2035. Market values come from Credence Research's market model, built from U.K. imports of native starch with the food share separated from industrial use, U.K. food production by category times typical starch use and the share already reformulated; source, application and nation splits are Credence Research estimates. Supporting evidence comes from UN Comtrade data, U.K. legislation and company announcements.
Desserts, sauces and imported grades lead growth to 2035
Through 2035, clean label starch will move from premium ranges into mainstream own-label sauces, desserts and ready meals as retailers extend ingredient policies. Dairy desserts and plant-based foods will add the fastest growth, and tapioca and rice starches will gain share in specialty uses. Imports, which included 66,227 metric tons of potato starch in 2023, will remain the main supply route, so prices will track European harvests and sterling. The pace will depend on whether new physically treated grades can handle retorted and frozen products.
Frequently Asked Questions
What was the size of the U.K. clean label starch market in 2025?
What is the forecast value and CAGR of the U.K. clean label starch market?
What drives demand for clean label starch in the U.K.?
Which U.K. nation holds the largest share of the clean label starch market?
Which starch source leads the U.K. clean label starch market?
Who are the major companies in the U.K. clean label starch market?
Where does U.K. clean label starch come from?
What challenges could slow the U.K. clean label starch market?
Table of Content
Chapter 1 Market Segmentation
- 1.1 Segmentation Framework
- 1.1.1 Product and Service Classification
- 1.1.2 Application and End-Use Classification
- 1.1.3 Technology and Solution Classification
- 1.1.4 Customer and Distribution Channel Classification
- 1.1.5 Geographic Segmentation
- 1.1.6 Market Segment Definitions and Boundaries
- 1.2 By Source
- 1.2.1 Maize Starch
- 1.2.2 Potato Starch
- 1.2.3 Tapioca Starch
- 1.2.4 Wheat Starch
- 1.2.5 Rice & Other Starches
- 1.3 By Application
- 1.3.1 Soups, Sauces & Dressings
- 1.3.2 Bakery & Confectionery
- 1.3.3 Dairy & Desserts
- 1.3.4 Ready Meals & Meat Products
- 1.3.5 Beverages, Infant & Other
- 1.4 By UK Nation
- 1.4.1 England
- 1.4.2 Scotland
- 1.4.3 Wales
- 1.4.4 Northern Ireland
Chapter 2 Introduction
- 2.1 Report Objectives and Scope
- 2.2 Product Definition and Industry Terminology
- 2.3 Market Inclusions and Exclusions
- 2.4 Research Process
- 2.4.1 Primary Research and Expert Interviews
- 2.4.2 Secondary Research and Source Review
- 2.4.3 Top-Down and Bottom-Up Estimation
- 2.4.4 Data Triangulation and Verification
- 2.5 Market Size Measurement Basis
- 2.5.1 2025: USD 128.5 million → 2035: USD 248.2 million
- 2.6 Historical and Forecast Reference Periods
- 2.6.1 Historical Period: 2018-2025
- 2.6.2 Base Year: 2025
- 2.6.3 Forecast Period: 2025-2035
- 2.7 Research Assumptions and Limitations
Chapter 3 Executive Summary
- 3.1 Market Snapshot and Key Findings
- 3.2 Base-Year Market Size, 2025
- 3.3 Forecast Market Size, 2035
- 3.4 Revenue and Volume Growth Outlook
- 3.5 Key Demand and Supply Indicators
- 3.6 Leading Market Segments
- 3.7 Fastest-Growing Market Opportunities
- 3.8 Regional Performance Highlights
- 3.9 Technology and Industry Transformation
- 3.10 Competitive Landscape Summary
- 3.11 Analyst View and Strategic Implications
Chapter 4 UK Clean Label Starch Market Trends and Developments
- 4.1 Historical Industry Development, 2018-2025
- 4.2 Recent Market Trends and Developments
- 4.3 Demand and Customer Behavior Trends
- 4.4 Technology and Product Innovation
- 4.5 Artificial Intelligence, Automation and Digitalization
- 4.6 Local Manufacturing and Supply Chain Realignment
- 4.7 Industry Partnerships, Mergers and Acquisitions
- 4.8 Sustainability and Circular Economy Developments
- 4.9 Government and Private Sector Investment Trends
- 4.10 Emerging Business Models and Commercialization
- 4.11 Industry Developments and Announcements
Chapter 5 UK Clean Label Starch Market Production, Supply and Demand Analysis
- 5.1 Demand Trend and Consumption Analysis, 2018-2025
- 5.2 Demand Forecast, 2025-2035
- 5.3 Production and Output Trend, 2018-2025
- 5.4 Production and Output Forecast, 2025-2035
- 5.5 Installed Capacity and Capacity Utilization
- 5.6 Company-Wise Production Plants and Statistics
- 5.6.1 Installed Production Capacity
- 5.6.2 Actual Production
- 5.6.3 Planned Capacity and Expansion Targets
- 5.7 Supply Chain Structure and Procurement Trends
- 5.8 Supply-Demand Gap and Bottlenecks
- 5.9 Import Dependence and Sourcing Structure
- 5.10 Contract Manufacturing and Outsourcing
- 5.11 Regional Supply and Demand Concentration
Chapter 6 UK Clean Label Starch Market Pricing Analysis
- 6.1 Pricing Structure and Measurement
- 6.2 Historical Pricing Trends, 2018-2025
- 6.3 Pricing Outlook, 2025-2035
- 6.4 Average Selling Price and Unit Economics
- 6.5 Pricing by Product and Market Segment
- 6.6 Geographic Pricing Differences
- 6.7 Key Input, Energy, Labor and Logistics Costs
- 6.8 Contract Pricing and Purchasing Models
- 6.9 Pricing Sensitivity and Competitive Positioning
- 6.10 Price, Margin and Profitability Implications
Chapter 7 UK Clean Label Starch Market Dynamics
- 7.1 Market Growth Drivers
- 7.1.1 Demand-Side Drivers
- 7.1.2 Technology and Innovation Drivers
- 7.1.3 Infrastructure and Investment Drivers
- 7.1.4 Regulatory and Policy Drivers
- 7.2 Market Restraints
- 7.2.1 Cost and Affordability Constraints
- 7.2.2 Technology and Adoption Barriers
- 7.2.3 Supply Chain and Operational Constraints
- 7.3 Market Challenges
- 7.3.1 Competitive Pressure and Margin Erosion
- 7.3.2 Skills, Infrastructure and Implementation Gaps
- 7.4 Emerging Market Opportunities
- 7.5 Market Dynamics Impact and Time-Horizon Assessment
Chapter 8 UK Clean Label Starch Value Chain Analysis
- 8.1 Industry Value Chain Overview
- 8.2 Upstream Suppliers and Critical Inputs
- 8.3 Technology and Component Providers
- 8.4 Manufacturing or Service Delivery
- 8.5 Distribution, Channel Partners and Integrators
- 8.6 Downstream Applications and End Users
- 8.7 Value Addition and Profit Pools
- 8.8 Vertical Integration and Outsourcing
- 8.9 Supplier Concentration and Risk
- 8.10 Supply Chain Localization and Resilience
Chapter 9 UK Clean Label Starch Market Regulations and Policies
- 9.1 Relevant Laws, Standards and Compliance Frameworks
- 9.2 Product, Service, Safety and Quality Requirements
- 9.3 Government Policies, Incentives and Subsidies
- 9.4 Imports, Exports and Trade Barriers
- 9.5 Public Procurement and Local Content Requirements
- 9.6 Environmental and Sustainability Compliance
- 9.7 Upcoming Policy Changes and Market Implications
Chapter 10 UK Clean Label Starch Market Hotspots and Opportunities
- 10.1 Market Opportunity Mapping and Growth Hotspots
- 10.2 High-Growth Applications and Customer Groups
- 10.3 Underserved Markets and White-Space Opportunities
- 10.4 Emerging Technology and Product Opportunities
- 10.5 New Capacity and Investment Hotspots
- 10.6 Market Entry and Expansion Opportunities
- 10.7 Distribution and Partnership Opportunities
- 10.8 Near-Term and Long-Term Commercial Potential
- 10.9 Opportunity Attractiveness and Execution Risks
Chapter 11 UK Clean Label Starch Market Outlook, 2025-2035
- 11.1 Market Size and Analysis
- 11.1.1 Revenue (Market Measurement: 2025: USD 128.5 million → 2035: USD 248.2 million)
- 11.1.2 Market Volume and Quantity Sold
- 11.1.3 Historical Market Size, 2018-2025
- 11.1.4 Base-Year Market Size, 2025
- 11.2 Market Forecast, 2025-2035
- 11.2.1 Revenue Forecast to 2035
- 11.2.2 Volume Forecast to 2035
- 11.2.3 CAGR and Year-on-Year Growth
- 11.2.4 Incremental Revenue Opportunity
- 11.3 Forecast Assumptions and Scenario Analysis
- 11.3.1 Base-Case Forecast
- 11.3.2 Optimistic and Conservative Scenarios
- 11.3.3 Technology, Pricing and Policy Sensitivities
- 11.4 Market Attractiveness and Growth Outlook
Chapter 12 UK Clean Label Starch Market Segmentation and Outlook
- 12.1 Segmentation Summary and Market Shares, 2025
- 12.2 Largest and Fastest-Growing Segments
- 12.3 By Source - Market Size and Forecast, 2025-2035
- 12.3.1 Segment Definition and Scope
- 12.3.2 Historical Market Size, 2018-2025
- 12.3.3 Revenue Forecast, 2025-2035
- 12.3.4 Volume Forecast, 2025-2035
- 12.3.5 Base-Year Market Share, 2025
- 12.3.6 Segment CAGR and Growth Drivers
- 12.3.7 Subsegment Market Size and Forecast
- 12.3.7.1 Maize Starch
- 12.3.7.2 Potato Starch
- 12.3.7.3 Tapioca Starch
- 12.3.7.4 Wheat Starch
- 12.3.7.5 Rice & Other Starches
- 12.3.8 Subsegment Pricing and Adoption Trends
- 12.3.9 Leading Suppliers and Competition
- 12.3.10 Regional Demand and Opportunities
- 12.4 By Application - Market Size and Forecast, 2025-2035
- 12.4.1 Segment Definition and Scope
- 12.4.2 Historical Market Size, 2018-2025
- 12.4.3 Revenue Forecast, 2025-2035
- 12.4.4 Volume Forecast, 2025-2035
- 12.4.5 Base-Year Market Share, 2025
- 12.4.6 Segment CAGR and Growth Drivers
- 12.4.7 Subsegment Market Size and Forecast
- 12.4.7.1 Soups, Sauces & Dressings
- 12.4.7.2 Bakery & Confectionery
- 12.4.7.3 Dairy & Desserts
- 12.4.7.4 Ready Meals & Meat Products
- 12.4.7.5 Beverages, Infant & Other
- 12.4.8 Subsegment Pricing and Adoption Trends
- 12.4.9 Leading Suppliers and Competition
- 12.4.10 Regional Demand and Opportunities
- 12.5 By UK Nation - Market Size and Forecast, 2025-2035
- 12.5.1 Segment Definition and Scope
- 12.5.2 Historical Market Size, 2018-2025
- 12.5.3 Revenue Forecast, 2025-2035
- 12.5.4 Volume Forecast, 2025-2035
- 12.5.5 Base-Year Market Share, 2025
- 12.5.6 Segment CAGR and Growth Drivers
- 12.5.7 Subsegment Market Size and Forecast
- 12.5.7.1 England
- 12.5.7.2 Scotland
- 12.5.7.3 Wales
- 12.5.7.4 Northern Ireland
- 12.5.8 Subsegment Pricing and Adoption Trends
- 12.5.9 Leading Suppliers and Competition
- 12.5.10 Regional Demand and Opportunities
- 12.6 Segment Growth Comparison
- 12.7 Segment Attractiveness and Priority Matrix
Chapter 13 UK Clean Label Starch End-Use and Application Market Outlook
- 13.1 End-Use Industry and Customer Demand Structure
- 13.2 Leading Applications and Customer Groups
- 13.3 End-Use Market Size, Share and Forecast
- 13.4 Major End-Use Industry Deep Dives
- 13.4.1 Customer Requirements and Use Cases
- 13.4.2 Demand and Replacement Cycles
- 13.4.3 Technical and Regulatory Considerations
- 13.4.4 Purchasing and Procurement Models
- 13.4.5 Leading Vendors and Distribution Channels
- 13.4.6 Forecast and Commercial Opportunities
- 13.5 Emerging Applications and Cross-Segment Demand
- 13.6 End-Use Industry Investment Priorities
Chapter 14 UK Clean Label Starch Geographic Market Outlook, 2025-2035
- 14.1 Domestic Market Distribution and Demand Clusters
- 14.2 State- or Province-Wise Market Size and Forecast, 2025-2035
- 14.3 City and Metropolitan Market Outlook
- 14.4 Industrial, Manufacturing and Commercial Clusters
- 14.5 Geographic Concentration of Key End Users
- 14.6 Local Pricing and Purchasing Differences
- 14.7 Domestic Production Facilities and Capacity Map
- 14.8 Local Infrastructure and Project Pipeline
- 14.9 State-Level Policy and Incentive Differences
- 14.10 Subnational Investment Hotspots and Opportunities
- 14.11 Distribution and Logistics Networks
- 14.12 Domestic Competitive Footprint
Chapter 15 UK Clean Label Starch Technology, Innovation and Sustainability Outlook
- 15.1 Technology Landscape and Maturity
- 15.2 Product, Process and Service Innovation
- 15.3 AI, Automation and Digital Tools in the Industry
- 15.4 Technology Adoption and Performance Benchmarking
- 15.5 Innovation Pipeline and R&D Investment
- 15.6 Patent and Intellectual Property Trends
- 15.7 Energy Efficiency and Resource Management
- 15.8 Sustainability, Recycling and Circularity
- 15.9 Technology Roadmap, 2025-2035
- 15.10 Risks of Obsolescence and Technology Substitution
Chapter 16 UK Clean Label Starch Market Key Strategic Imperatives
- 16.1 Growth and Market Entry Priorities
- 16.2 High-Return Products and Segments
- 16.3 Pricing, Profitability and Cost Optimization
- 16.4 Technology Investment and Product Differentiation
- 16.5 Supply Chain Localization and Resilience
- 16.6 Distribution and Customer Acquisition
- 16.7 Partnership, Acquisition and Capacity Strategy
- 16.8 Regional Expansion Priorities
- 16.9 Short-, Medium- and Long-Term Actions
Chapter 17 Competition Outlook
- 17.1 Industry Competition Characteristics
- 17.2 Market Structure and Concentration
- 17.3 Market Share and Competitive Positioning, 2025
- 17.4 Company-Wise Revenue and Product Benchmarking
- 17.5 Production and Service Capacity Benchmarking
- 17.6 Technology, Pricing and Differentiation
- 17.7 Regional Footprint and Distribution Strength
- 17.8 Mergers, Acquisitions and Strategic Alliances
- 17.9 New Entrants and Competitive Threats
- 17.10 Porter's Five Forces and Industry Attractiveness
- 17.11 Competitive Outlook, 2025-2035
Chapter 18 Company Profiles
- 18.1 Company Coverage and Selection Criteria
- 18.2 Ingredion
- 18.2.1 Business Description
- 18.2.2 Company Ownership and Geographic Presence
- 18.2.3 Product and Service Portfolio
- 18.2.4 Manufacturing and Operating Footprint
- 18.2.5 Production Capacity and Expansion Plans
- 18.2.6 Financial Performance and Investment
- 18.2.7 Market Share and Competitive Position
- 18.2.8 Technology and Innovation Capabilities
- 18.2.9 Strategic Alliances or Partnerships
- 18.2.10 Recent Developments
- 18.2.11 Growth Strategy and Outlook
- 18.3 Cargill
- 18.4 Tate & Lyle
- 18.5 Roquette
- 18.6 Avebe
- 18.7 KMC
- 18.8 Emsland Group
- 18.9 Beneo
- 18.10 Tereos
- 18.11 ADM
- 18.12 Other Relevant Market Participants
Note: Every listed company is profiled on the structure shown under the first company. The company list is preliminary and may change based on research findings, market developments, data availability and client requirements.
Chapter 19 Disclaimer
- 19.1 Research and Forecast Disclaimer
- 19.2 Data Source and Estimation Limitations
Note: The depth of individual sections depends on data availability for this market. Volume, capacity, trade and other unit-based metrics are included where applicable.

