
Industrial bakery and reformulation lift emulsifier sales
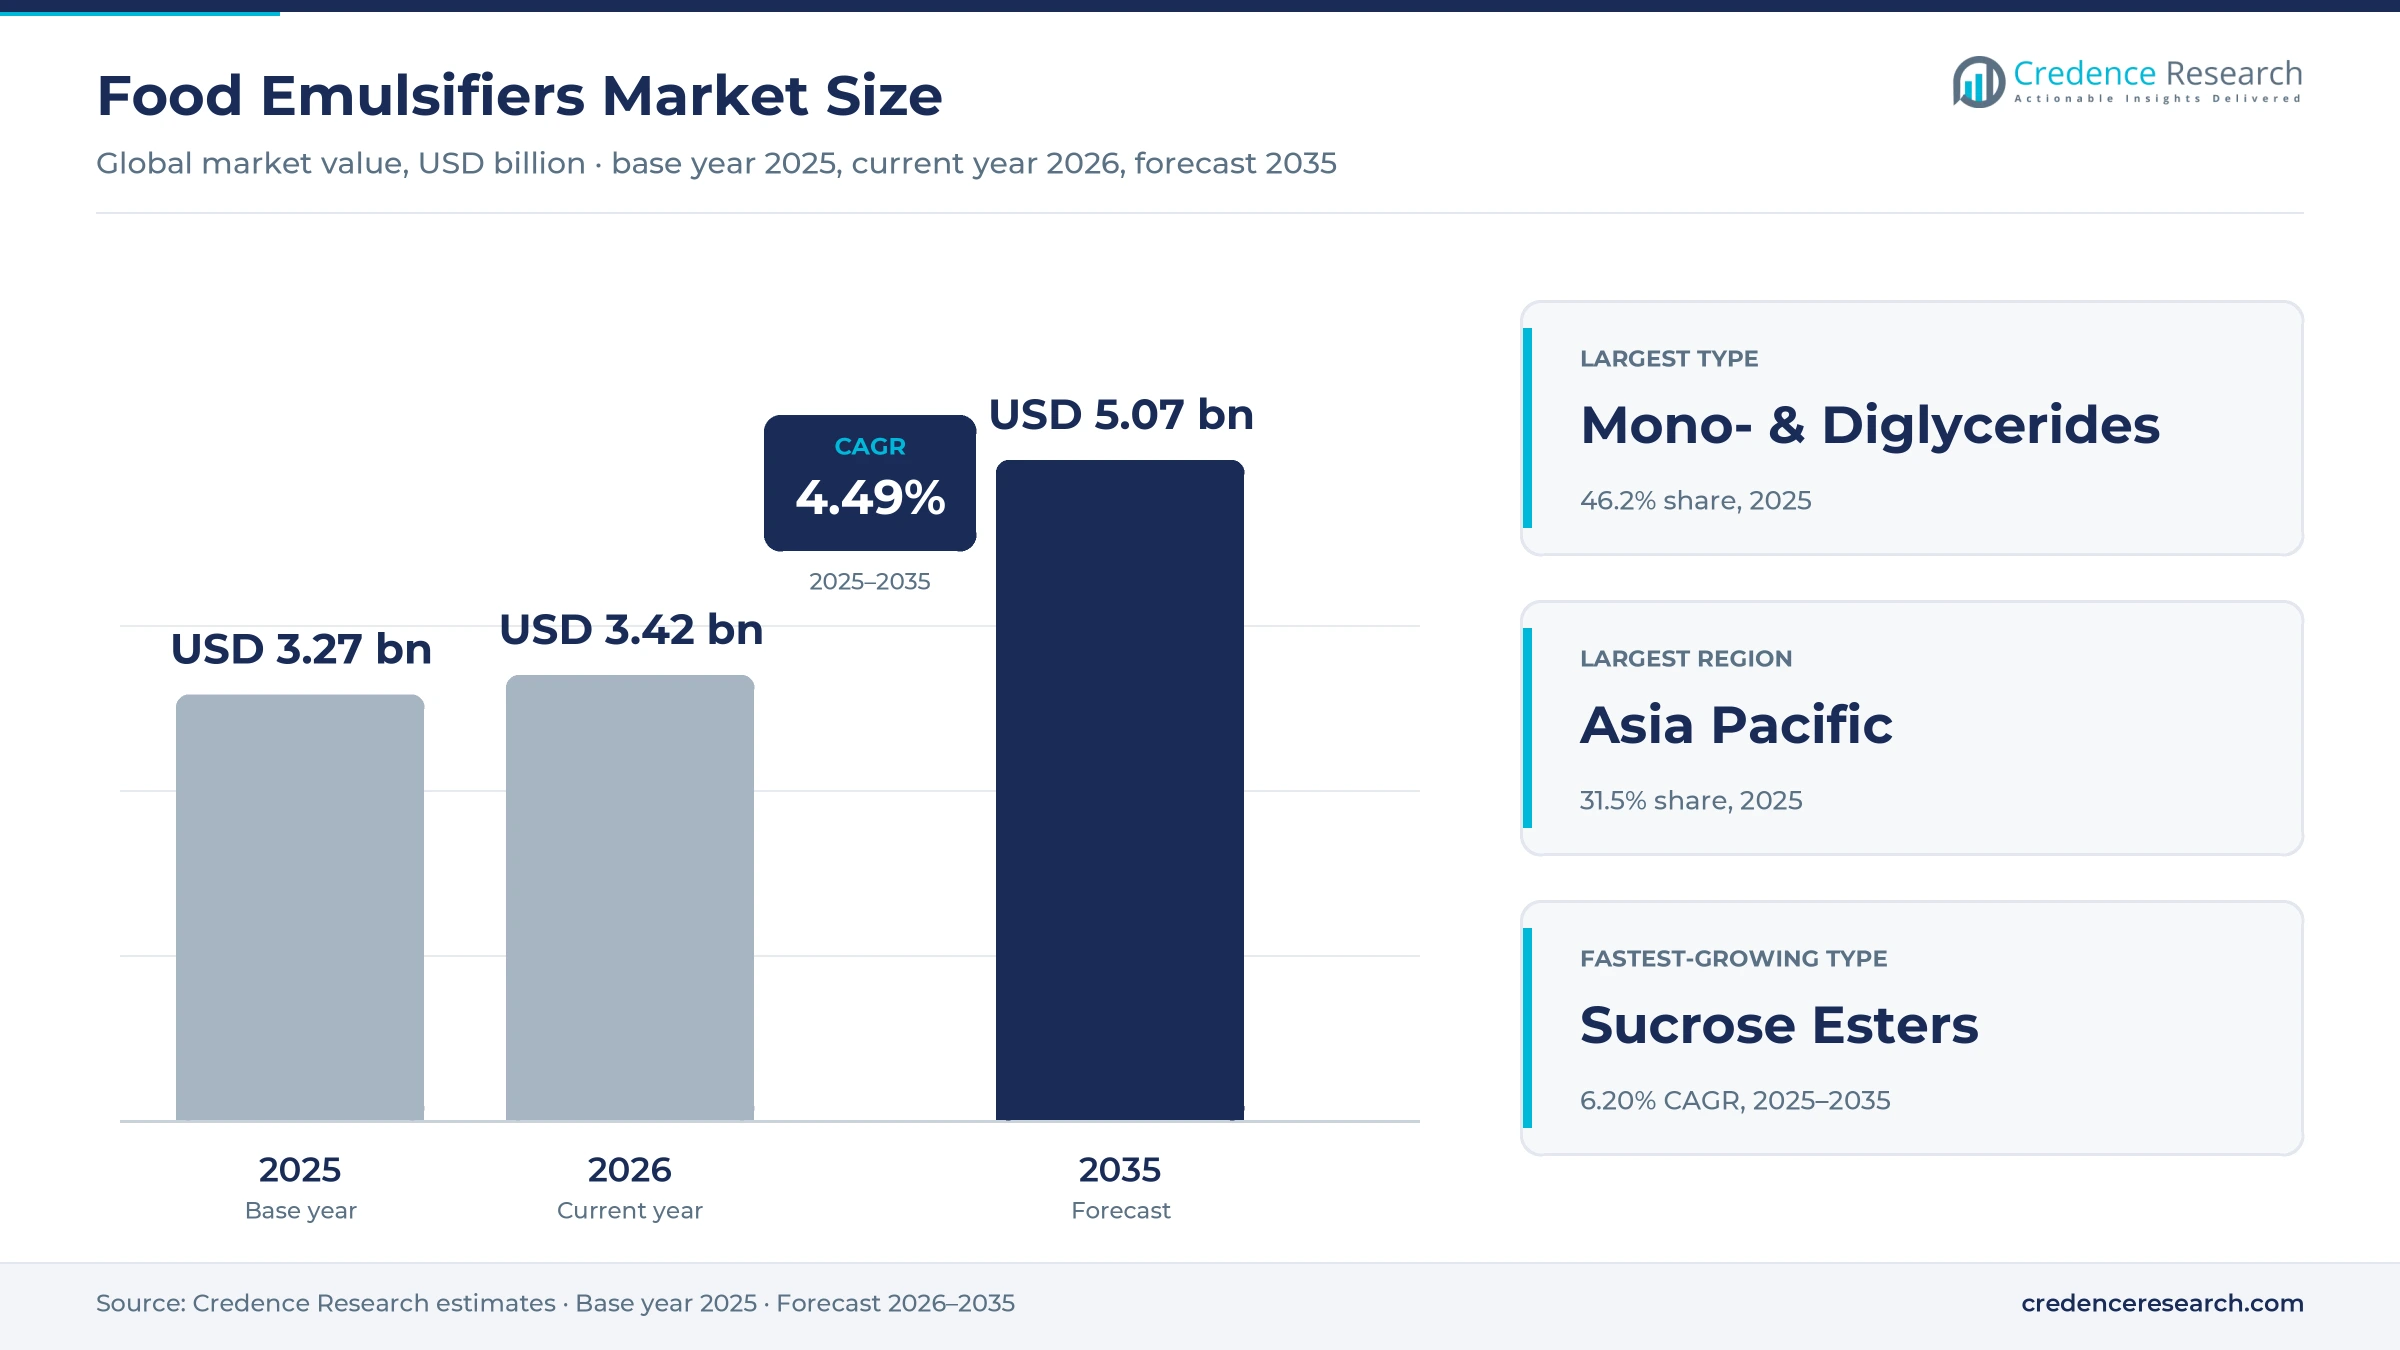
The food emulsifiers market was valued at USD 3.27 billion in 2025 and is projected to increase from USD 3.42 billion in 2026 to USD 5.07 billion by 2035, registering a CAGR of 4.49% during 2025–2035. Consumption reached about 1.09 million metric tons in 2025 at a weighted average near USD 3.0 per kilogram. Demand rests on the spread of industrial bakery lines in emerging economies, reformulation that strips fat, sugar and egg from recipes, and growth in plant-based dairy and meat alternatives. Asia Pacific held the largest regional share, 31.5% in 2025, on the strength of its packaged-food base in China, Japan, India and Southeast Asia. The main regulatory change is tighter EU purity limits for E 471, which, together with deforestation traceability rules due in December 2026, is splitting European supply into commodity and premium low-contaminant grades.
What counts as a food emulsifier and how buyers use it
The report counts surface-active additives that hold oil and water together or change how fat, starch and air behave in food. These are lecithins (E 322), mono- and diglycerides and their esters (E 471, E 472a–f), sucrose esters (E 473, E 474), polyglycerol esters and PGPR (E 475, E 476), propylene glycol esters (E 477), stearoyl lactylates (E 481, E 482), sorbitan esters (E 491–495) and polysorbates (E 432–436). It excludes thickeners such as carrageenan, guar and xanthan gum, and lecithin sold into feed, pharmaceuticals and cosmetics.
Emulsifiers are usually dosed at well under 1% of a recipe, yet they decide shelf life, crumb softness, ice cream overrun and chocolate line speed. Lecithin comes mostly from oilseed degumming, while glycerides are made from palm, soybean, sunflower and rapeseed oils. Once a bread or filled biscuit formulation is validated, requalifying it needs new line trials and shelf-life tests, so food manufacturers rarely switch suppliers on price alone.
Food Emulsifiers Market Insights
- The food emulsifiers market is projected to rise from an estimated USD 3.42 billion in 2026 to USD 5.07 billion by 2035, a 4.49% CAGR, tracking packaged-food volume more than commodity prices.
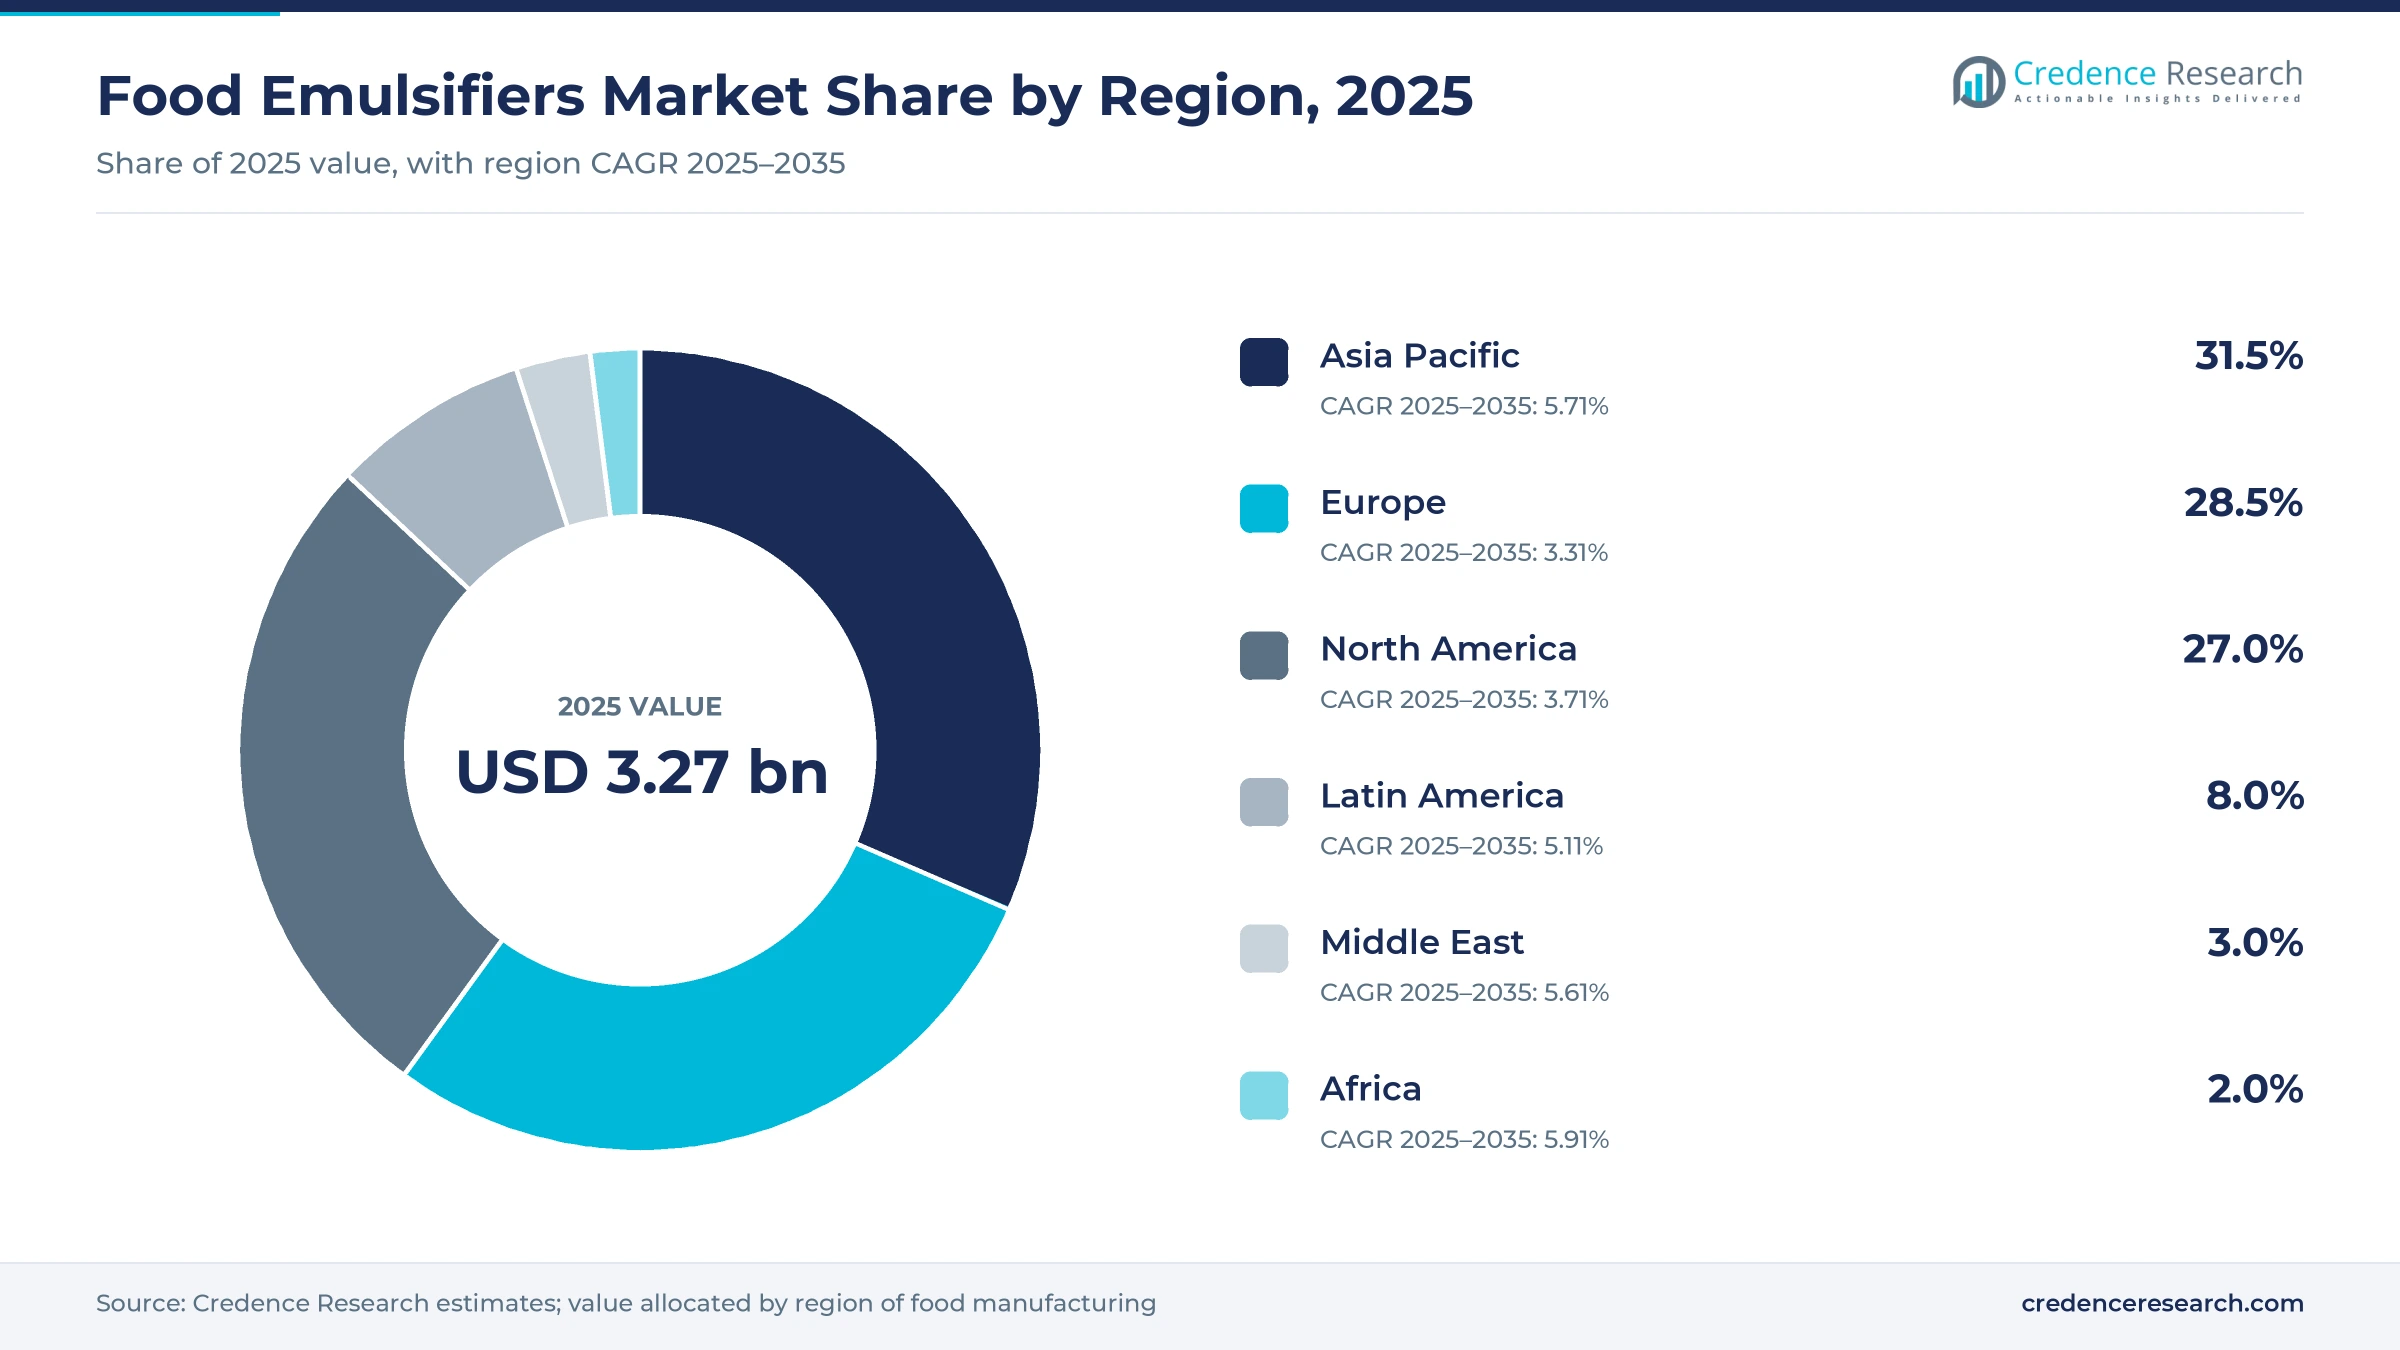
- Asia Pacific held 31.5% of 2025 value, the largest regional share, and grows at 5.71% a year as industrial bread, noodles and ice cream expand.
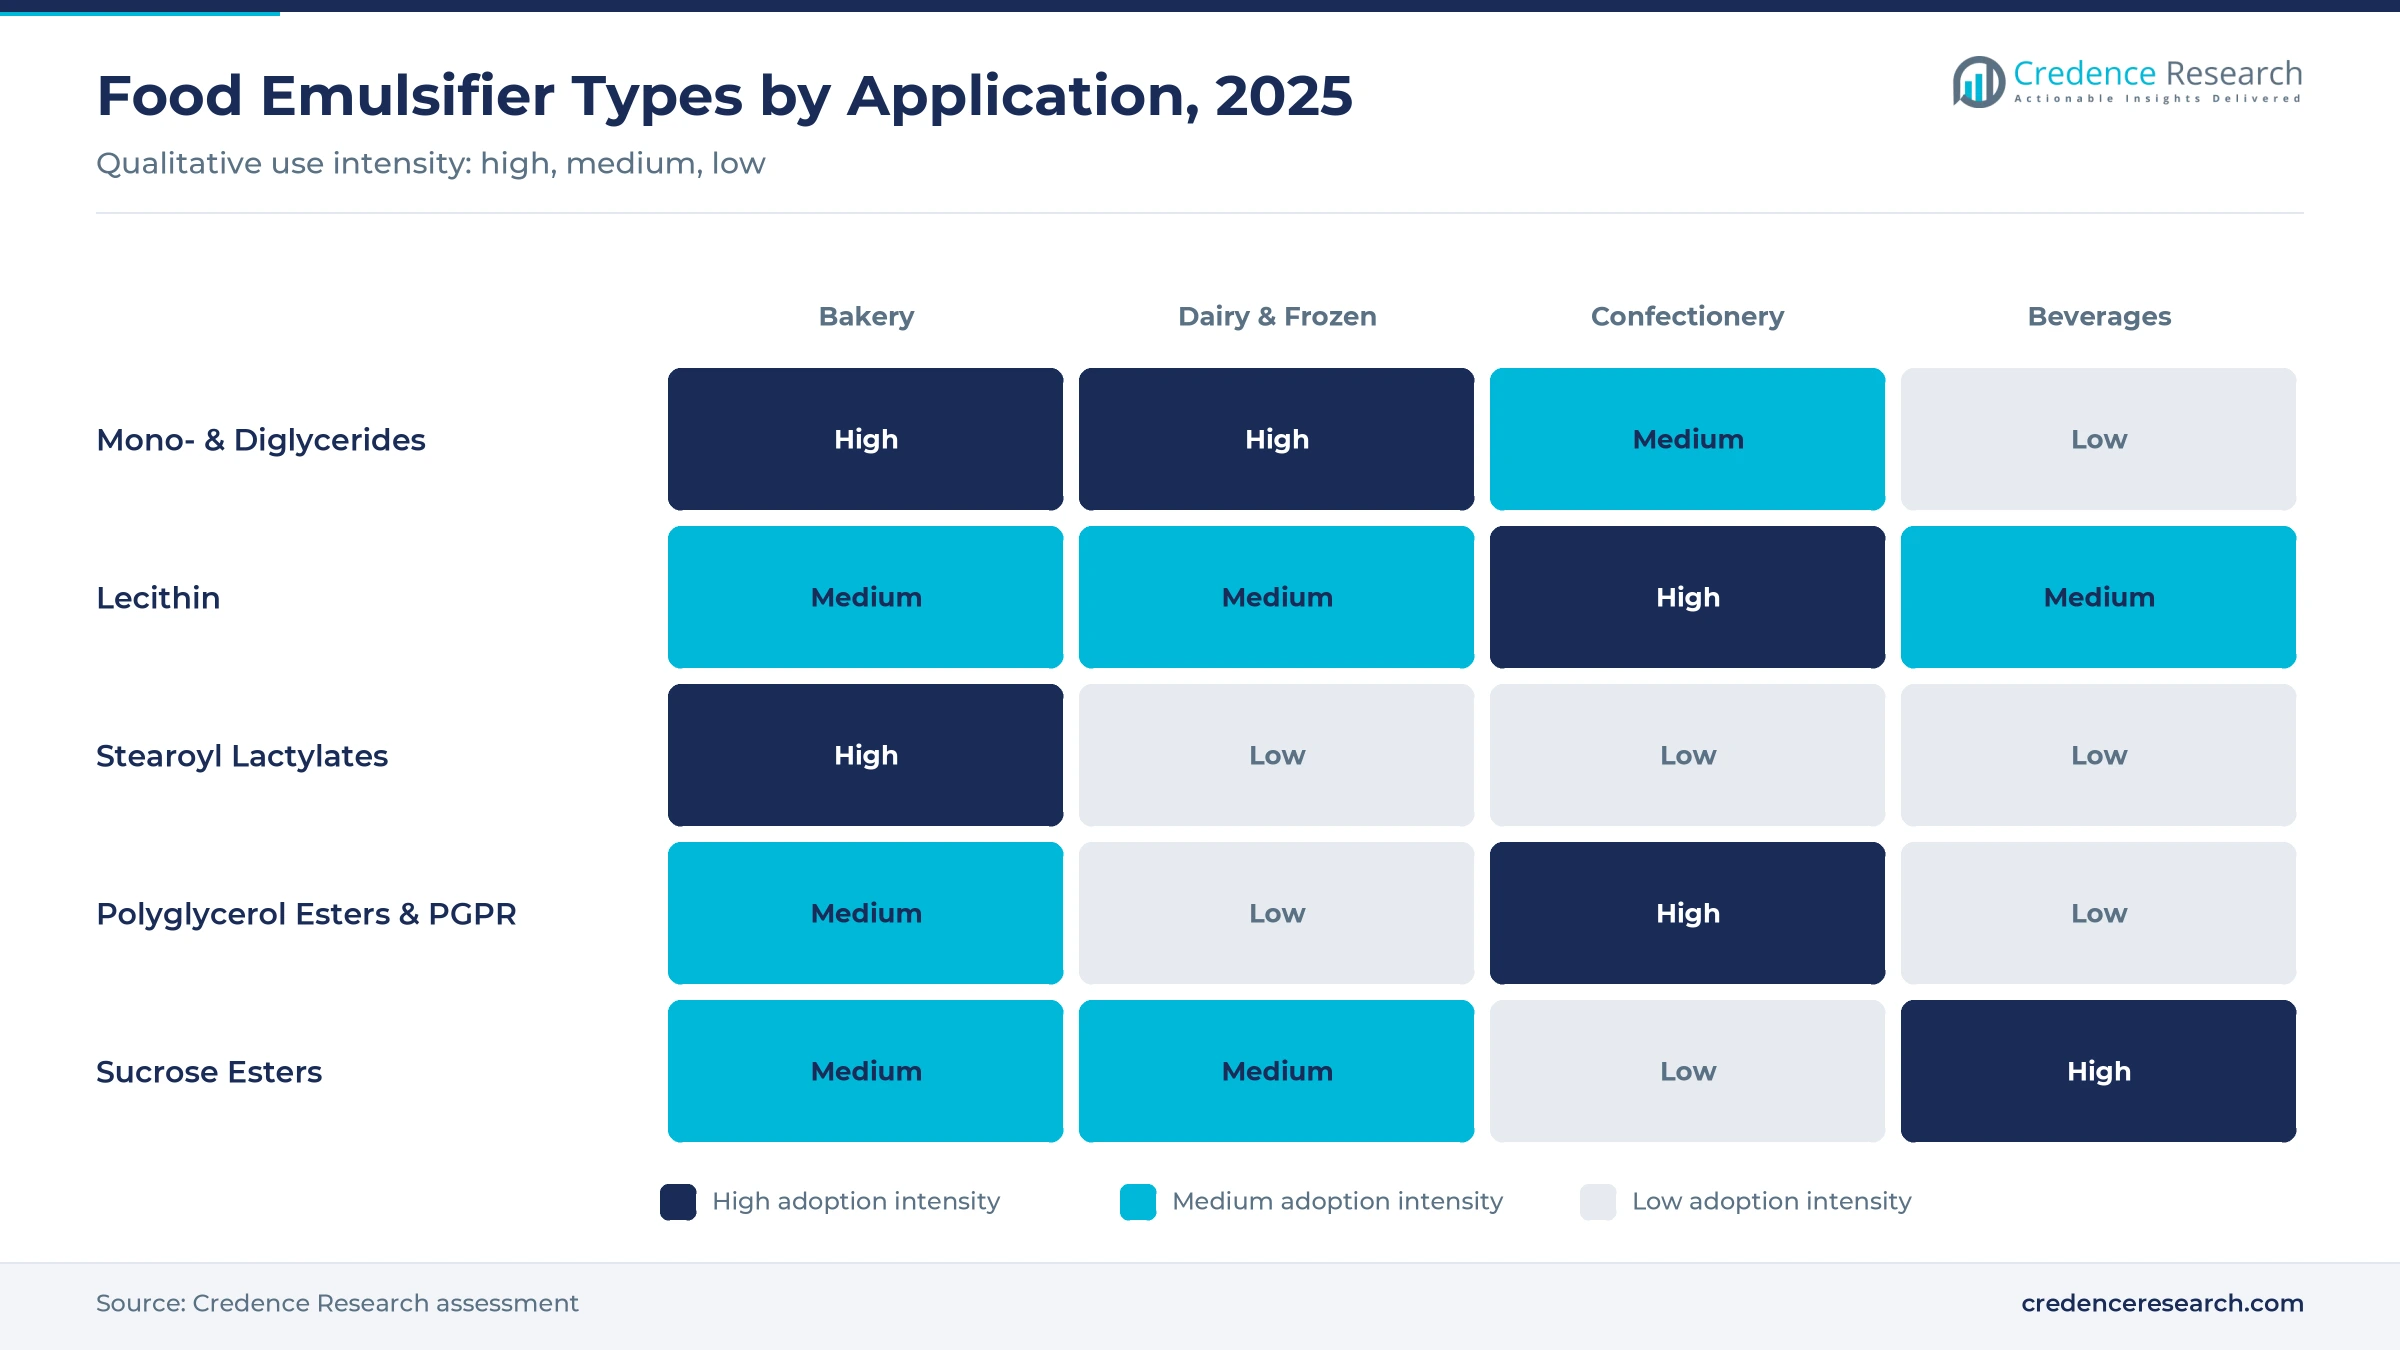
- Mono- and diglycerides and derivatives accounted for 46.2% of 2025 value, the largest type, because monoglycerides keep industrial bread soft and DATEM strengthens dough.
- Tighter EU limits on glycidyl esters, 3-MCPD and erucic acid in E 471, applied from July 2023, are creating a premium tier of traceable, low-contaminant grades.
- Emulsifier assets are changing hands. Louis Dreyfus Company acquired BASF's food performance ingredients business in 2025, and Bunge's purchase of IFF's lecithin business closed in 2026.
Glycerides lead value while sucrose esters gain fastest
Mono- and diglycerides lead by type while sucrose esters grow fastest
Based on type, the market is categorized into mono- and diglycerides and derivatives, lecithin, stearoyl lactylates, polyglycerol esters and PGPR, sorbitan esters and polysorbates, sucrose esters and others. Mono- and diglycerides led with 46.2% of 2025 value on roughly 520,000 metric tons, because distilled monoglycerides slow bread staling and DATEM (E 472e) strengthens dough on high-speed lines. Sucrose esters grow fastest at 6.20% a year, as tasteless, pH-tolerant grades win clear beverages, coffee creamers and Asian bakery and sell at about four times the average price per kilogram.
| Segment Group | Leading Sub-segment | Share, 2025 | Fastest-growing Sub-segment | CAGR, 2025–2035 |
|---|---|---|---|---|
| By Type | Mono- and Diglycerides & Derivatives | 46.2% | Sucrose Esters | 6.20% |
Request a Free Sample
Fill in your details and we'll send you a free sample report.
- Sample data tables & charts
- Research methodology
Factory bread, leaner recipes and cheap lecithin lift demand
Industrial bread and cake lines spread across emerging economies
Every loaf that moves from a neighborhood bakery to an industrial line needs dough strengtheners and anti-staling agents to survive mechanical handling and one week or more on the shelf, which lifts demand for dough conditioners. That shift is largely complete in North America and Western Europe but still under way in China, India, Indonesia, Brazil and Nigeria. Suppliers are following it, and Palsgaard opened an application center in Navi Mumbai in 2025. The effect runs through 2035 and is strongest in Asia Pacific, growing at 5.71% a year.
Fat, sugar and egg reduction raises emulsifier use per kilogram of food
Cutting fat, sugar or egg from a recipe removes the ingredients that gave it structure, and emulsifiers are one of the cheapest ways to restore it. Reduced-fat spreads need more emulsifier per kilogram to stay stable, egg-free cakes rely on aerating esters such as E 475 and E 477, and lower-sugar ice creams use mono- and diglycerides to control ice crystals. Credence Research's model attributes about 0.5 percentage points of annual global volume growth to reformulation, a medium-term effect concentrated in Europe and North America.
Plant-based drinks and meat alternatives need complete emulsifier systems
Plant-based dairy and meat alternatives are a smaller outlet, but an intensive one. A plant-based drink needs an emulsifier system to keep oil droplets and protein in suspension through heat treatment, and plant-based burgers use emulsifiers to bind fat and water. Brands in Europe, North America and East Asia buy these systems from suppliers with application labs. Demand builds over the next 5 to 10 years as product ranges widen beyond milk into creamers, desserts and ready meals.
Abundant soybean oil makes lecithin the low-cost route to clean labels
World soybean oil output reached 70.07 million metric tons in 2024/25, according to the U.S. Department of Agriculture, and recoverable lecithin is about 2.5% of crude oil, a theoretical ceiling near 1.75 million metric tons. Global lecithin trade, recorded under HS 2923.20, reached about 610,000 metric tons worth about USD 1.18 billion in 2024, and the unit value fell from about USD 2.71 to USD 1.90 per kilogram. Cheaper soy lecithin helps bakery and chocolate makers shorten labels in the near term.
Cleaner labels and new owners reshape emulsifier supply
Sunflower and non-GMO lecithin replace esters where function allows
Brands seeking a shorter, more familiar label are swapping esters for sunflower lecithin, which appears on packs as a plain ingredient name rather than an E-number. The shift is gradual, because lecithin cannot replace DATEM in high-speed bread, or PGPR in thin chocolate coatings, without a cost or quality penalty. Lecithin specialists such as Sternchemie and Lasenor gain, along with oilseed processors that segregate non-GMO soy, while makers of commodity esters face slower volume growth in Europe and North America over the next five years.
Emulsifier businesses shift to feedstock owners and focused specialists
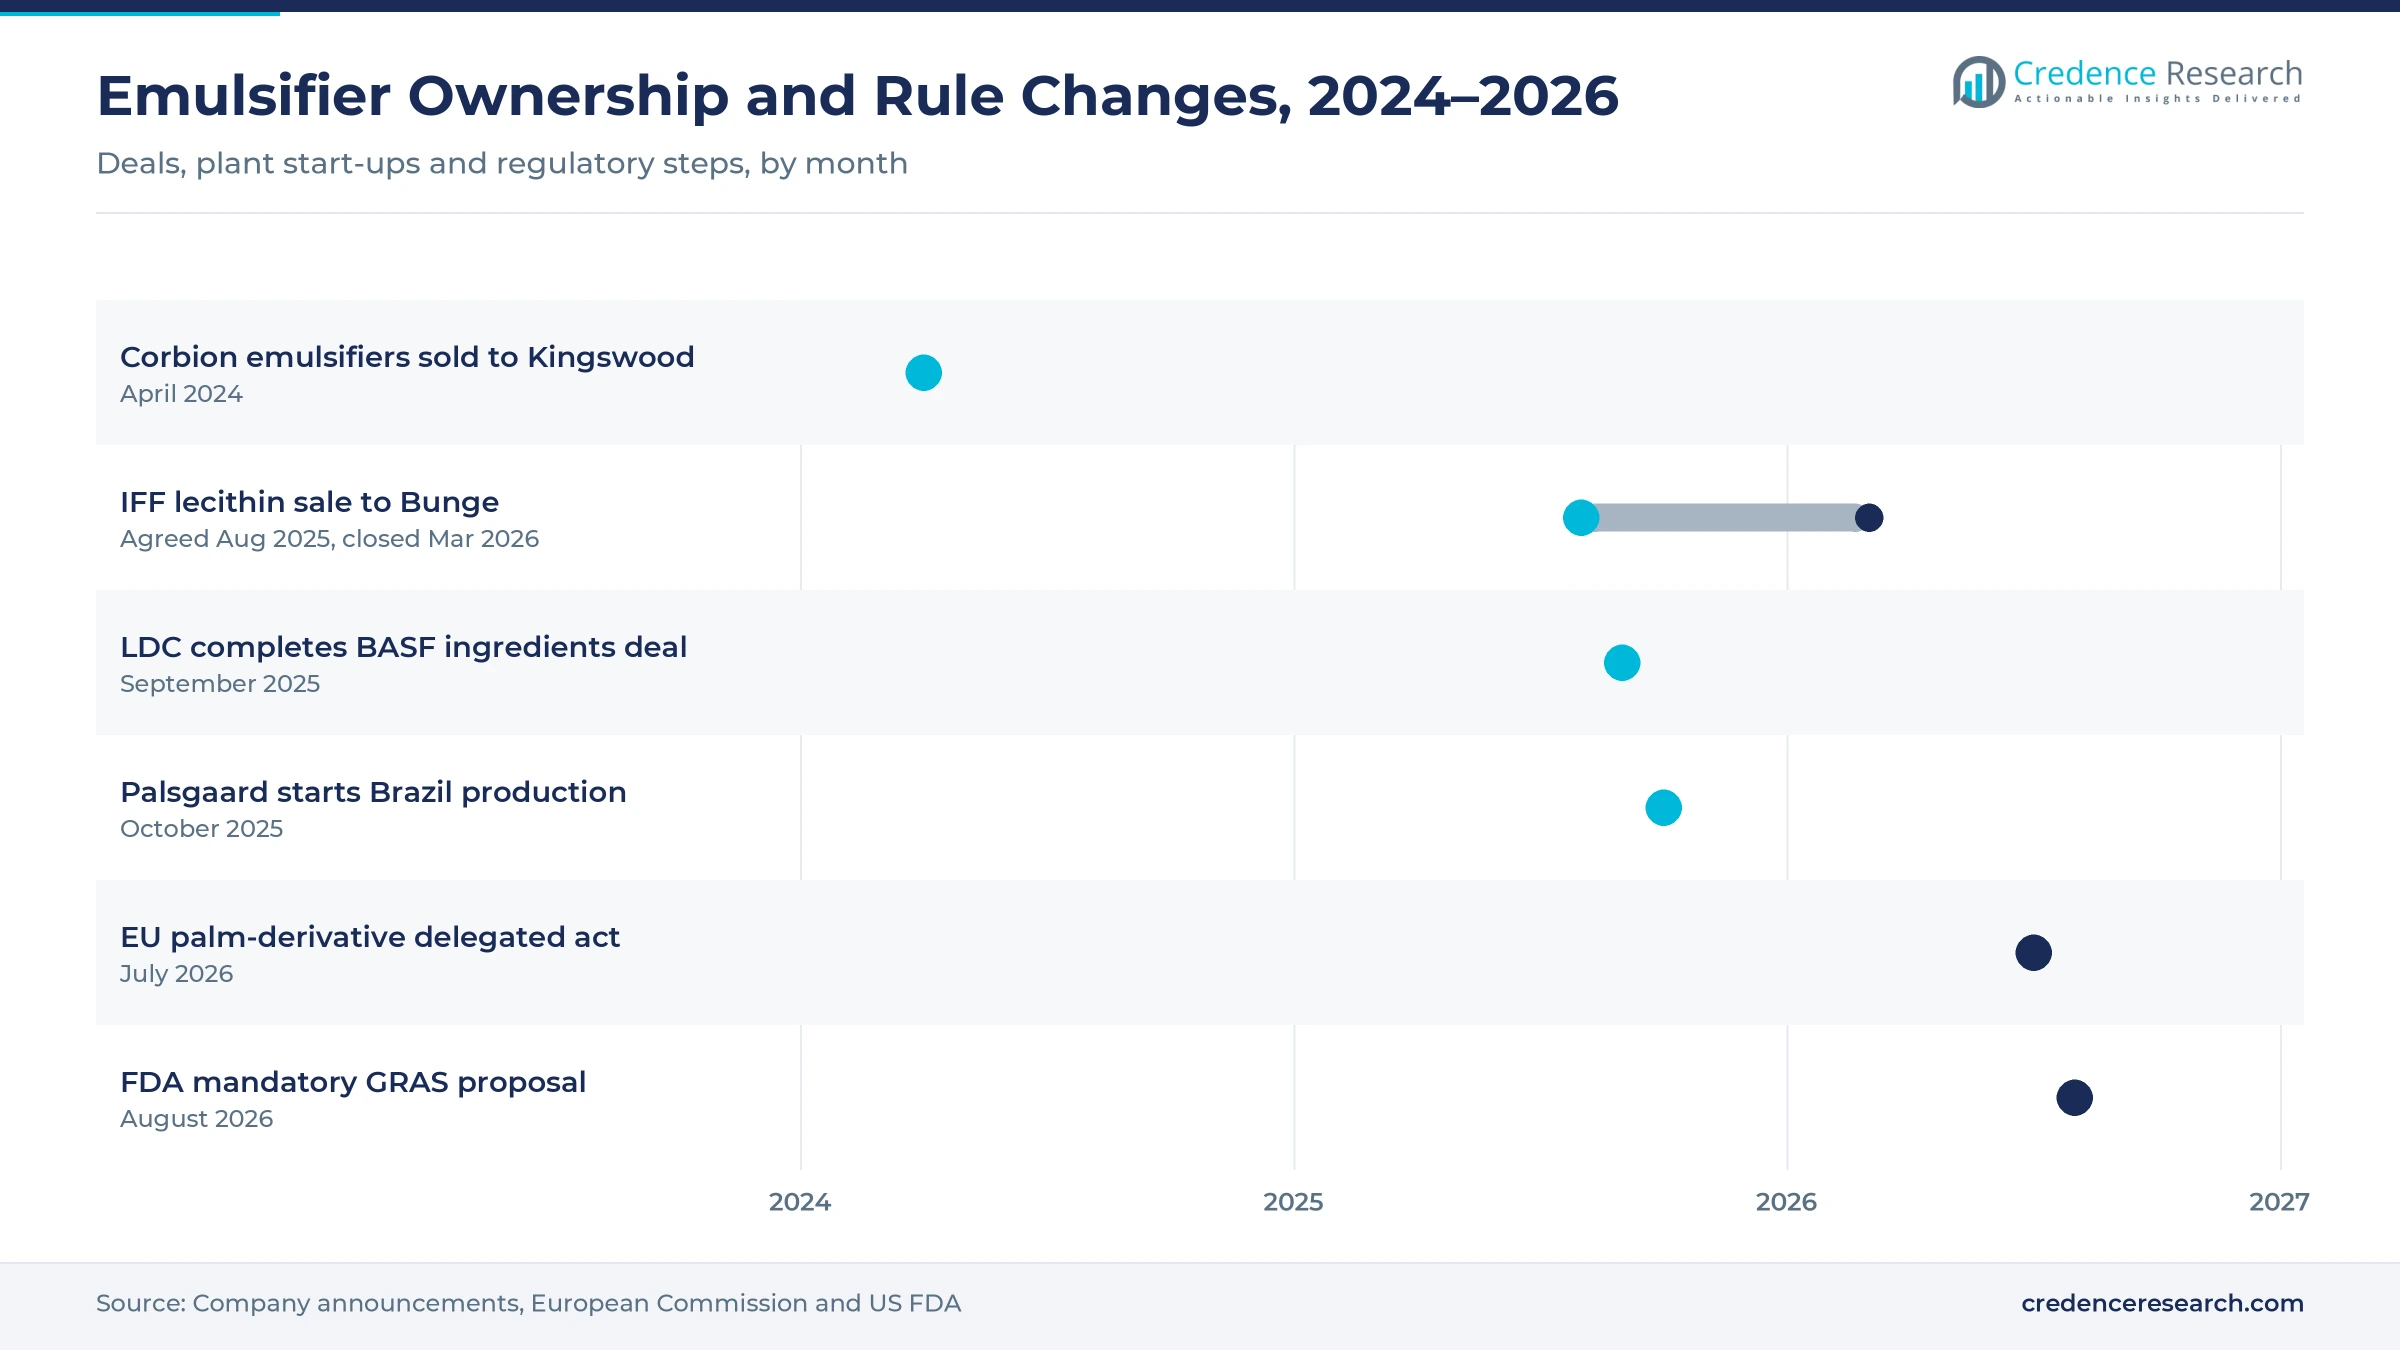
Three diversified groups have moved emulsifier assets to owners that want to grow them. Corbion completed the sale of its emulsifier business to Kingswood Capital Management for USD 362 million in April 2024. Louis Dreyfus Company completed its acquisition of BASF's Food and Health Performance Ingredients business, made at Illertissen, Germany, in September 2025. IFF signed an agreement in August 2025 to sell its lecithin business to Bunge. As these deals show, feedstock control and application service now drive ownership decisions.
Multifunctional blends that remove several E-numbers at once open an opportunity
The best clean-label opening lies in blends that let a bakery or dairy customer remove 2 or 3 E-numbers at once. Combinations of lecithin with enzymes or fiber ingredients can replace part of the DATEM and mono- and diglycerides in bread while shortening the label. Suppliers that prove equal shelf life in the customer's own plant capture the value, so application labs near large bakery clusters in Asia Pacific and Latin America become a commercial asset rather than a cost center.
Traceable, low-contaminant E 471 offers an opportunity in infant nutrition and premium bakery
EU contaminant limits from 2023 and deforestation traceability rules from Dec. 30, 2026, create a two-tier E 471 market in Europe. Grades with documented palm origin and low glycidyl ester levels already sell above commodity material to infant nutrition and premium bakery buyers. Producers with refining control, lot-level testing and certified supply chains can lift price and mix in a mature region growing at 3.31% a year, while traders of undifferentiated material lose access to the most demanding tenders.
Health studies, EU rules and oil prices squeeze suppliers
Observational studies linking additives to disease raise reputational risk
A study published by The BMJ in September 2023 followed 95,442 French adults and linked higher intake of some emulsifiers, including E 471 and E 472, with cardiovascular disease. A 2024 analysis in The Lancet Diabetes & Endocrinology followed 104,139 adults and recorded 1,056 type 2 diabetes cases. Both studies show association, not cause, but they still give retailers and brands a reason to trim additive counts, which pressures ester volumes. Suppliers respond with lecithin and enzyme-based alternatives and published safety data.
EU purity specifications raise refining and testing costs
Commission Regulation (EU) 2023/1428 tightened E 471 specifications from July 30, 2023. It capped erucic acid, lowered limits for arsenic, lead, mercury and cadmium, and set limits for 3-MCPD and glycidyl fatty acid esters, with stricter values for infant foods; Regulation (EU) 2023/1329 did the same for E 475 and E 476. Compliance requires refined feedstock and lot testing, which hits smaller palm-based producers hardest. Mitigation for those producers comes from refining partnerships and shared testing contracts.
Deforestation rules add traceability work for palm and soy inputs
The EU Deforestation Regulation, amended by Regulation (EU) 2025/2650, applies from Dec. 30, 2026, for large and medium operators and from June 30, 2027, for micro and small ones. On July 13, 2026, the European Commission adopted a delegated act adding more palm-oil derivatives from 2027, subject to scrutiny by Parliament and Council. Because most E 471 is made from palm, European buyers face extra due diligence. Producers with mapped supply chains limit the risk of shipment delays.
Vegetable oil price spikes compress margins before contracts reset
World Bank data show soybean oil rose from USD 1,140 per metric ton in 2025 to USD 1,722 in the second quarter of 2026 and stood at USD 1,615 in September 2026, while palm oil rose from USD 1,007 to USD 1,180, according to the World Bank Pink Sheet. Emulsifier contract prices usually reset quarterly or yearly, so producers absorb part of each spike before passing it on. Shorter reset periods and feedstock-indexed pricing reduce the margin squeeze for both suppliers and buyers.
Asia Pacific leads on scale while Africa grows fastest
| Region | Share, 2025 | CAGR, 2025–2035 |
|---|---|---|
| Asia Pacific | 31.5% | 5.71% |
| Europe | 28.5% | 3.31% |
| North America | 27.0% | 3.71% |
| Latin America | 8.0% | 5.11% |
| Middle East | 3.0% | 5.61% |
| Africa | 2.0% | 5.91% |
Asia Pacific is the largest market on noodles, packaged bread and ice cream
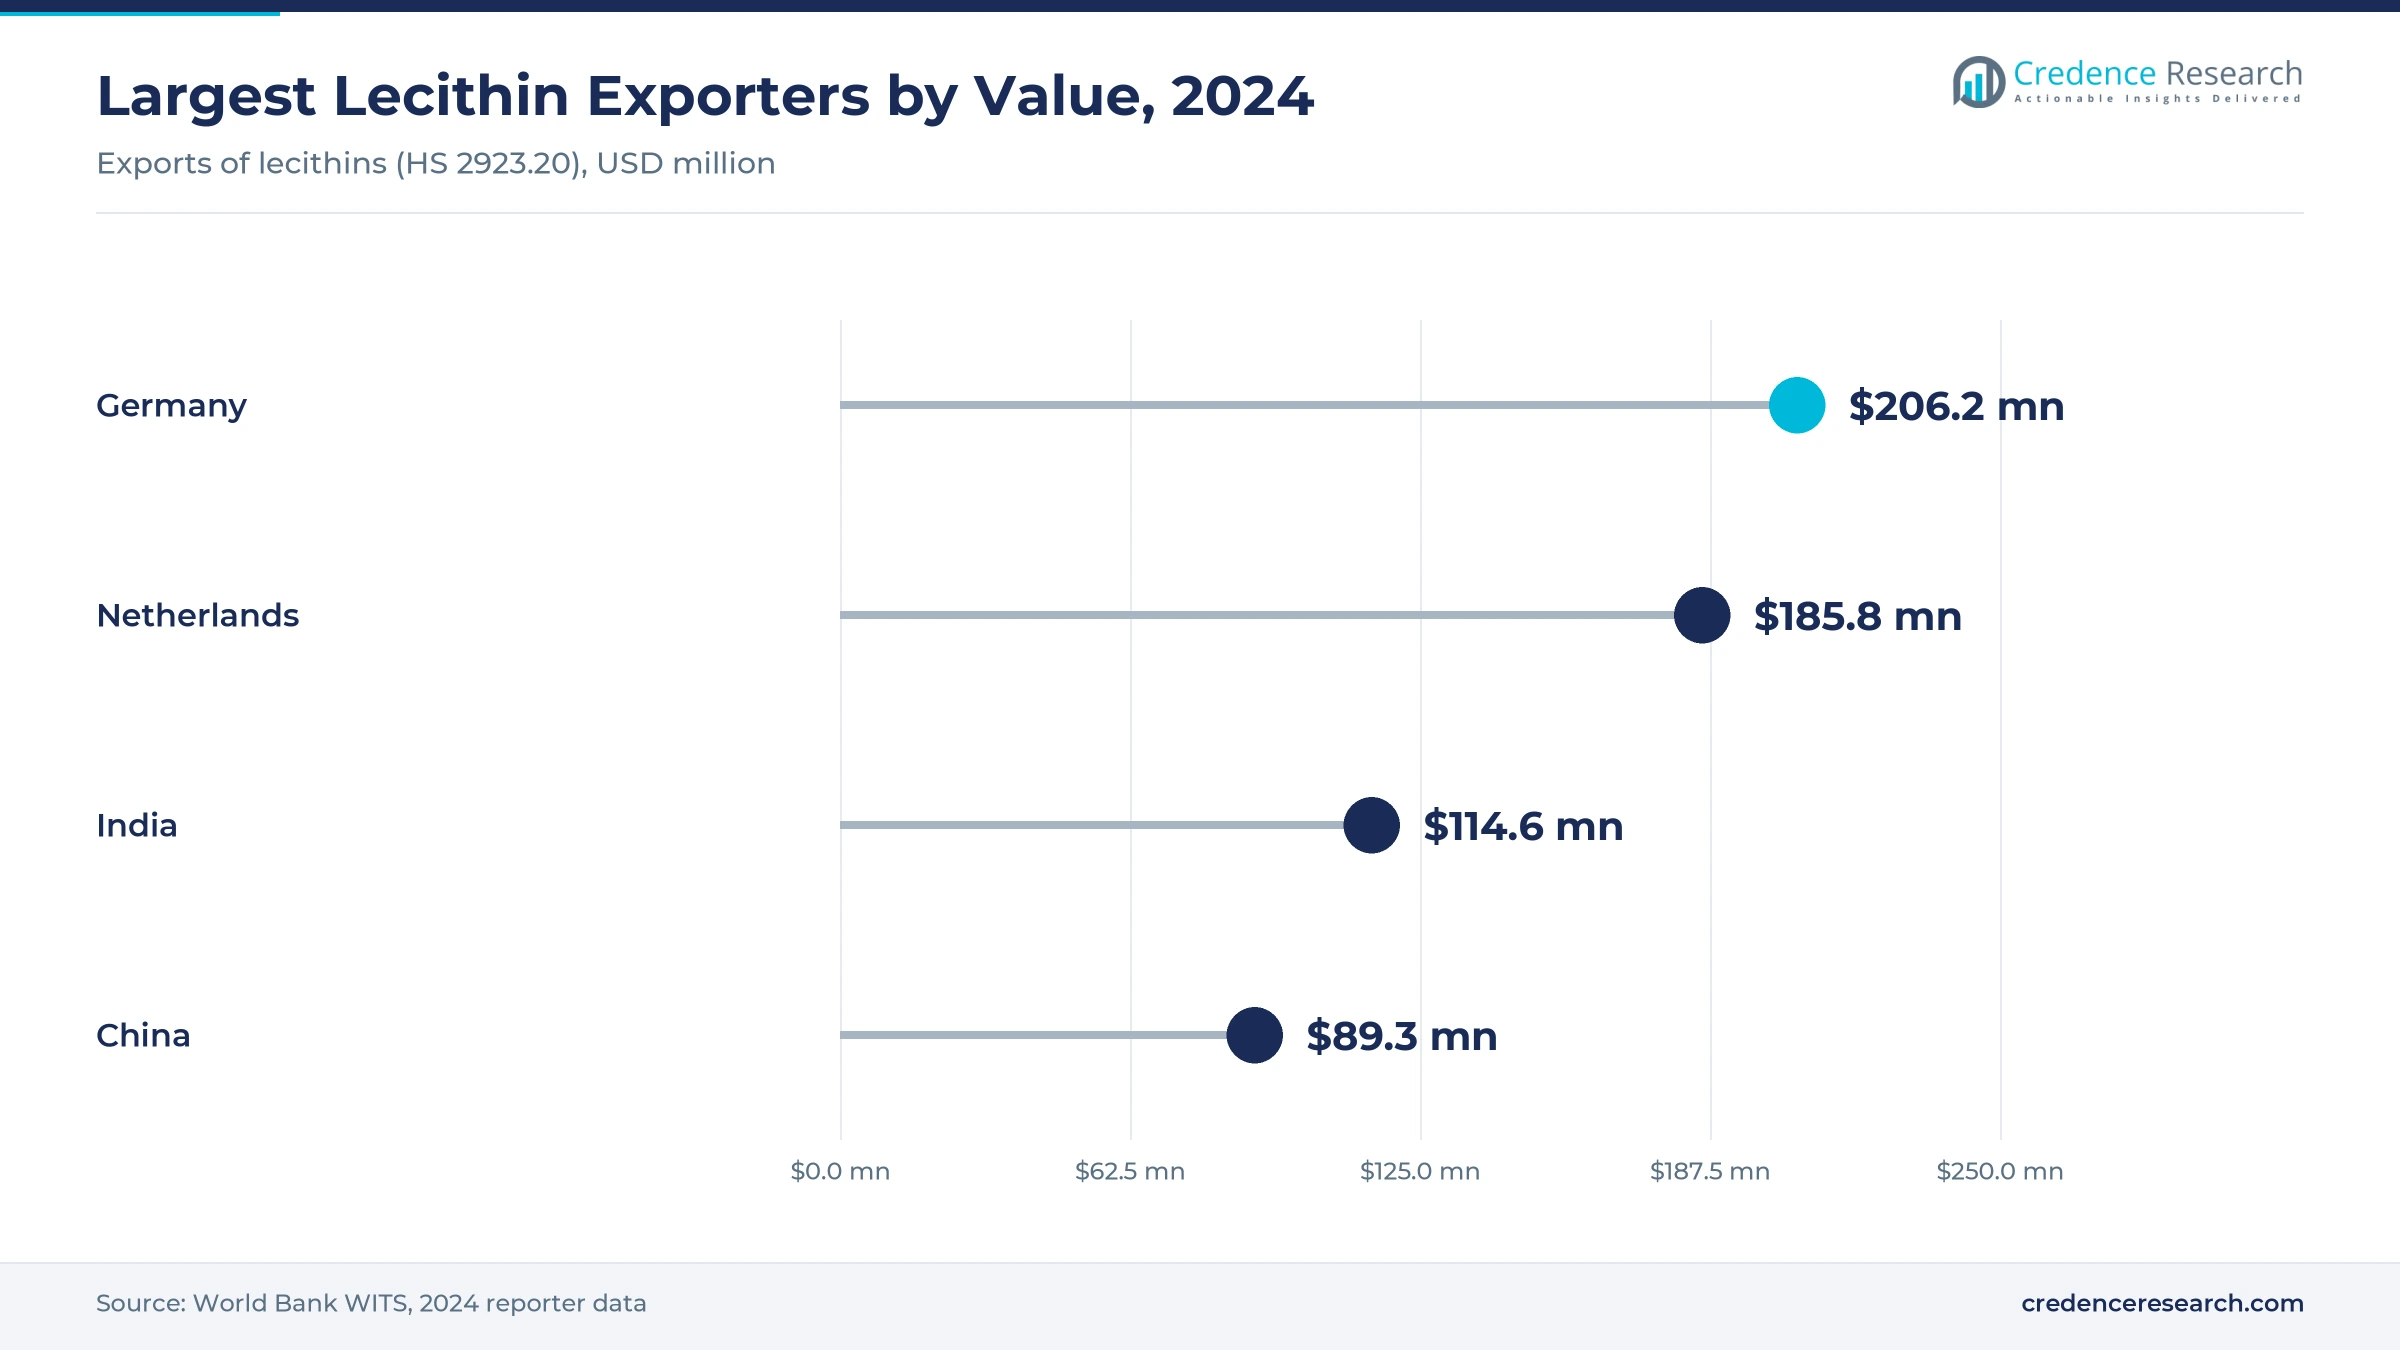
Asia Pacific held 31.5% of 2025 value, about USD 1.03 billion, and grows at 5.71% a year. China, Japan and India are the largest markets, and growth comes from industrial bread and cake, instant noodles, ice cream and ready-to-drink beverages. Supply is local and expanding, as India and China were the fourth- and fifth-largest lecithin exporters by value in 2024, at about USD 114.6 million and USD 89.3 million. Japanese specialists Riken Vitamin and Taiyo Kagaku supply sucrose and polyglycerol esters across the region.
Europe is a mature market that grows through price, mix and lecithin trade
Europe held 28.5% of 2025 value, about USD 0.93 billion, and grows at 3.31% a year. Germany, France, the United Kingdom and Italy are the core markets. Europe is also the trading hub for lecithin, as Germany, at about USD 206.2 million, and the Netherlands, at about USD 185.8 million, were the 2 largest exporters by value in 2024. Demand is mature, so growth comes from low-contaminant E 471, sunflower lecithin and PGPR used to cut cocoa butter in chocolate.
North America sees steady demand from industrial bakery and settled GRAS status
North America held 27.0% of 2025 value, about USD 0.88 billion, and grows at 3.71% a year, with the United States accounting for most of it. The region has a highly industrialized bakery sector and a large frozen-dessert category. Mono- and diglycerides (21 CFR 184.1505) and lecithin (21 CFR 184.1400) are affirmed as GRAS by FDA regulation, which limits exposure to the FDA's August 2026 proposal to make GRAS notification mandatory.
Latin America combines lecithin exports with new local cake emulsifier output
Latin America held 8.0% of 2025 value and grows at 5.11% a year, led by Brazil and Mexico. Argentina shipped about 157,900 metric tons of lecithin in 2024, the largest volume of any exporter, and Brazil is also a major supplier. Local cake-mix and packaged-bread growth is attracting production, as Palsgaard's 2025 Brazilian line shows.
Middle East and Africa grows from small bases on halal demand and import substitution
The Middle East held 3.0% of 2025 value and grows at 5.61% a year, with halal certification favoring plant-derived grades in the Gulf states and Türkiye. Africa held 2.0% of 2025 value and is the fastest-growing region at 5.91% a year. Urban demand for bread, margarine and confectionery in Nigeria, South Africa, Egypt and Kenya is still met largely by imports, which leaves room for local blending close to bakery clusters.
Ingredient deals and a Brazilian line mark 2025–2026
| Development | Status and market relevance |
|---|---|
| In August 2026, the U.S. Food and Drug Administration proposed making GRAS notification mandatory, with comments due by Dec. 9, 2026. | Proposed. Self-affirmed ingredients face review; emulsifiers affirmed by regulation are less exposed. |
| In July 2026, the European Commission adopted a delegated act adding more palm-oil derivatives to the EU Deforestation Regulation from Dec. 30, 2027. | Subject to scrutiny. Extends due diligence toward palm-based glyceride feedstock. |
| In March 2026, completion of Bunge's purchase of IFF's soy crush, concentrates and lecithin business was announced. | Completed. Moves a lecithin business to an oilseed processor that owns the feedstock. |
| In October 2025, Palsgaard began producing Emulpals cake emulsifiers in Marechal Cândido Rondon, Brazil. | Producing. Local supply for Latin American cake-mix makers. |
| In September 2025, Louis Dreyfus Company completed its acquisition of BASF's Food and Health Performance Ingredients business, including emulsifiers made at Illertissen, Germany. | Completed. Another emulsifier asset moves to an agri-commodity group. |
Enzyme blends and contaminant control shape the technology
- Enzyme and lecithin blends combine enzymes, lecithin and fiber to replace part of DATEM and mono- and diglycerides in bread, cutting E-numbers while holding softness and volume.
- Contaminant control through refining steps that lower glycidyl esters and 3-MCPD in palm-based feedstock, plus lot-level testing, is now required to sell E 471 into European infant foods.
- Segregated feedstock for sunflower and identity-preserved non-GMO soy lecithin needs separate crushing and storage, which favors processors with dedicated lines.
- Traceability through geolocation and due-diligence systems for palm and soy inputs becomes a condition of sale in Europe from Dec. 30, 2026.
Need a Custom Version of This Report?
Tailor the scope, geography, or segments to your exact requirements.
- Custom geography or segment scope
- Direct access to our analyst team
Oilseed crushers and ester specialists compete for orders
The food emulsifiers market is fragmented, and three types of supplier compete in it. Oilseed processors, including Cargill, ADM, Bunge and Louis Dreyfus Company, control lecithin and much of the glyceride feedstock and compete on cost and supply security. Specialist emulsifier producers such as Palsgaard, Riken Vitamin, Taiyo Kagaku, Fine Organic Industries and Oleon compete on application know-how and technical service. Ingredient-solution companies such as Kerry Group, IFF and Puratos sell emulsifiers inside bakery, dairy and beverage systems. Lecithin specialists Sternchemie and Lasenor focus on sunflower and non-GMO grades. Competition is hardest in industrial bakery tenders and chocolate, where cutting a customer's cost per kilogram of finished product matters more than list price. No producer publishes food emulsifier sales on a comparable basis, so no share ranking is given.
Emulsifier suppliers profiled and their roles
| Company | Type | Role in the market |
|---|---|---|
| Cargill | Oilseed processor | Lecithin and glyceride feedstock from integrated crushing and refining |
| ADM | Oilseed processor | Soy and sunflower lecithin from oilseed processing |
| Bunge | Oilseed processor | Lecithin; completion of its purchase of IFF's soy crush, concentrates and lecithin business announced March 2026 |
| Louis Dreyfus Company | Oilseed processor | Emulsifiers made at Illertissen, Germany, after acquiring BASF's food performance ingredients business in 2025 |
| Kerry Group | Ingredient-solution company | Emulsifiers sold inside bakery, dairy and beverage systems |
| IFF | Ingredient-solution company | Emulsifier systems for food; lecithin business sold to Bunge |
| Palsgaard | Specialist producer | Emulpals cake emulsifiers, with production in Brazil from October 2025 |
| Riken Vitamin | Specialist producer | Emulsifier base materials and formulations, mainly in Asia |
| Taiyo Kagaku | Specialist producer | Interface solution ingredients, including emulsifiers |
| Fine Organic Industries | Specialist producer | Plant-based specialty additives, including food emulsifiers |
| Oleon | Specialist producer | Oleochemical-based esters; food emulsifier role not confirmed in detail |
| Stern-Wywiol Gruppe (Sternchemie) | Lecithin specialist | Sunflower and non-GMO lecithin grades |
| Lasenor | Lecithin specialist | Sunflower and non-GMO lecithin grades |
| Puratos | Ingredient-solution company | Emulsifiers inside bakery improvers and mixes |
Value follows feedstock control and application labs
Credence Research's view is that value in food emulsifiers is moving toward two positions, control of oilseed feedstock and strength in application labs. Oilseed processors win on lecithin cost and supply security, while specialists win where they prove shelf life in a customer's plant. The largest new revenue lies in emerging-market bakery, sucrose and polyglycerol esters, and traceable low-contaminant E 471. The main risk is a feedstock spike that margins cannot absorb. Buyers and investors should watch vegetable oil prices, EU deforestation enforcement and the FDA's GRAS rulemaking.
Tonnage, price and trade checks behind the estimate
The report uses 2025 as the base year and forecasts to 2035, with CAGR calculated over 2025–2035. Market values come from Credence Research's market model, built from food-grade tonnage and average selling price for each emulsifier family, and checked against oilseed supply data, lecithin trade statistics and the disclosed business sizes of listed producers. The 2026 value is estimated from the 2025 base and the CAGR, while segment and regional splits are Credence Research estimates. Supporting evidence comes from USDA and World Bank data, EU and U.S. regulatory texts and company announcements.
Emerging bakery and premium E 471 grades set the pace
Through 2035, food emulsifier demand will follow packaged bakery, dairy desserts and convenience foods into Asia Pacific, Latin America and Africa, while Europe and North America grow mainly through price and mix. Lecithin and multifunctional blends will gain where labels matter, but glycerides will remain the largest type because no cheaper anti-staling tool exists. In Europe, traceable, low-contaminant grades will command a premium over commodity material. The pace will depend on vegetable oil prices, deforestation enforcement and how brands respond to additive health studies.
Frequently Asked Questions
What was the size of the food emulsifiers market in 2025?
What is the forecast value and CAGR of the food emulsifiers market?
Which type of food emulsifier holds the largest share?
Which region leads the food emulsifiers market?
Does the food emulsifiers market include carrageenan or xanthan gum?
Who are the major companies in the food emulsifiers market?
How do EU rules affect food emulsifier suppliers?
What challenges could slow the food emulsifiers market?
Table of Content
Chapter 1 Market Segmentation
- 1.1 Segmentation Framework
- 1.1.1 Product and Service Classification
- 1.1.2 Application and End-Use Classification
- 1.1.3 Technology and Solution Classification
- 1.1.4 Customer and Distribution Channel Classification
- 1.1.5 Geographic Segmentation
- 1.1.6 Market Segment Definitions and Boundaries
- 1.2 By Type
- 1.2.1 Mono- and Diglycerides & Derivatives
- 1.2.2 Lecithin
- 1.2.3 Stearoyl Lactylates
- 1.2.4 Polyglycerol Esters & PGPR
- 1.2.5 Sorbitan Esters & Polysorbates
- 1.2.6 Sucrose Esters
- 1.2.7 Others
Chapter 2 Introduction
- 2.1 Report Objectives and Scope
- 2.2 Product Definition and Industry Terminology
- 2.3 Market Inclusions and Exclusions
- 2.4 Research Process
- 2.4.1 Primary Research and Expert Interviews
- 2.4.2 Secondary Research and Source Review
- 2.4.3 Top-Down and Bottom-Up Estimation
- 2.4.4 Data Triangulation and Verification
- 2.5 Market Size Measurement Basis
- 2.5.1 2025: USD 3.27 billion → 2035: USD 5.07 billion
- 2.6 Historical and Forecast Reference Periods
- 2.6.1 Historical Period: 2018-2025
- 2.6.2 Base Year: 2025
- 2.6.3 Forecast Period: 2025-2035
- 2.7 Research Assumptions and Limitations
Chapter 3 Executive Summary
- 3.1 Market Snapshot and Key Findings
- 3.2 Base-Year Market Size, 2025
- 3.3 Forecast Market Size, 2035
- 3.4 Revenue and Volume Growth Outlook
- 3.5 Key Demand and Supply Indicators
- 3.6 Leading Market Segments
- 3.7 Fastest-Growing Market Opportunities
- 3.8 Regional Performance Highlights
- 3.9 Technology and Industry Transformation
- 3.10 Competitive Landscape Summary
- 3.11 Analyst View and Strategic Implications
Chapter 4 Global Food Emulsifiers Market Trends and Developments
- 4.1 Historical Industry Development, 2018-2025
- 4.2 Recent Market Trends and Developments
- 4.3 Demand and Customer Behavior Trends
- 4.4 Technology and Product Innovation
- 4.5 Artificial Intelligence, Automation and Digitalization
- 4.6 Local Manufacturing and Supply Chain Realignment
- 4.7 Industry Partnerships, Mergers and Acquisitions
- 4.8 Sustainability and Circular Economy Developments
- 4.9 Government and Private Sector Investment Trends
- 4.10 Emerging Business Models and Commercialization
- 4.11 Industry Developments and Announcements
Chapter 5 Global Food Emulsifiers Market Production, Supply and Demand Analysis
- 5.1 Demand Trend and Consumption Analysis, 2018-2025
- 5.2 Demand Forecast, 2025-2035
- 5.3 Production and Output Trend, 2018-2025
- 5.4 Production and Output Forecast, 2025-2035
- 5.5 Installed Capacity and Capacity Utilization
- 5.6 Company-Wise Production Plants and Statistics
- 5.6.1 Installed Production Capacity
- 5.6.2 Actual Production
- 5.6.3 Planned Capacity and Expansion Targets
- 5.7 Supply Chain Structure and Procurement Trends
- 5.8 Supply-Demand Gap and Bottlenecks
- 5.9 Import Dependence and Sourcing Structure
- 5.10 Contract Manufacturing and Outsourcing
- 5.11 Regional Supply and Demand Concentration
Chapter 6 Global Food Emulsifiers Market Pricing Analysis
- 6.1 Pricing Structure and Measurement
- 6.2 Historical Pricing Trends, 2018-2025
- 6.3 Pricing Outlook, 2025-2035
- 6.4 Average Selling Price and Unit Economics
- 6.5 Pricing by Product and Market Segment
- 6.6 Geographic Pricing Differences
- 6.7 Key Input, Energy, Labor and Logistics Costs
- 6.8 Contract Pricing and Purchasing Models
- 6.9 Pricing Sensitivity and Competitive Positioning
- 6.10 Price, Margin and Profitability Implications
Chapter 7 Global Food Emulsifiers Market Dynamics
- 7.1 Market Growth Drivers
- 7.1.1 Demand-Side Drivers
- 7.1.2 Technology and Innovation Drivers
- 7.1.3 Infrastructure and Investment Drivers
- 7.1.4 Regulatory and Policy Drivers
- 7.2 Market Restraints
- 7.2.1 Cost and Affordability Constraints
- 7.2.2 Technology and Adoption Barriers
- 7.2.3 Supply Chain and Operational Constraints
- 7.3 Market Challenges
- 7.3.1 Competitive Pressure and Margin Erosion
- 7.3.2 Skills, Infrastructure and Implementation Gaps
- 7.4 Emerging Market Opportunities
- 7.5 Market Dynamics Impact and Time-Horizon Assessment
Chapter 8 Global Food Emulsifiers Value Chain Analysis
- 8.1 Industry Value Chain Overview
- 8.2 Upstream Suppliers and Critical Inputs
- 8.3 Technology and Component Providers
- 8.4 Manufacturing or Service Delivery
- 8.5 Distribution, Channel Partners and Integrators
- 8.6 Downstream Applications and End Users
- 8.7 Value Addition and Profit Pools
- 8.8 Vertical Integration and Outsourcing
- 8.9 Supplier Concentration and Risk
- 8.10 Supply Chain Localization and Resilience
Chapter 9 Global Food Emulsifiers Market Regulations and Policies
- 9.1 Relevant Laws, Standards and Compliance Frameworks
- 9.2 Product, Service, Safety and Quality Requirements
- 9.3 Government Policies, Incentives and Subsidies
- 9.4 Imports, Exports and Trade Barriers
- 9.5 Public Procurement and Local Content Requirements
- 9.6 Environmental and Sustainability Compliance
- 9.7 Upcoming Policy Changes and Market Implications
Chapter 10 Global Food Emulsifiers Market Hotspots and Opportunities
- 10.1 Market Opportunity Mapping and Growth Hotspots
- 10.2 High-Growth Applications and Customer Groups
- 10.3 Underserved Markets and White-Space Opportunities
- 10.4 Emerging Technology and Product Opportunities
- 10.5 New Capacity and Investment Hotspots
- 10.6 Market Entry and Expansion Opportunities
- 10.7 Distribution and Partnership Opportunities
- 10.8 Near-Term and Long-Term Commercial Potential
- 10.9 Opportunity Attractiveness and Execution Risks
Chapter 11 Global Food Emulsifiers Market Outlook, 2025-2035
- 11.1 Market Size and Analysis
- 11.1.1 Revenue (Market Measurement: 2025: USD 3.27 billion → 2035: USD 5.07 billion)
- 11.1.2 Market Volume and Quantity Sold
- 11.1.3 Historical Market Size, 2018-2025
- 11.1.4 Base-Year Market Size, 2025
- 11.2 Market Forecast, 2025-2035
- 11.2.1 Revenue Forecast to 2035
- 11.2.2 Volume Forecast to 2035
- 11.2.3 CAGR and Year-on-Year Growth
- 11.2.4 Incremental Revenue Opportunity
- 11.3 Forecast Assumptions and Scenario Analysis
- 11.3.1 Base-Case Forecast
- 11.3.2 Optimistic and Conservative Scenarios
- 11.3.3 Technology, Pricing and Policy Sensitivities
- 11.4 Market Attractiveness and Growth Outlook
Chapter 12 Global Food Emulsifiers Market Segmentation and Outlook
- 12.1 Segmentation Summary and Market Shares, 2025
- 12.2 Largest and Fastest-Growing Segments
- 12.3 By Type - Market Size and Forecast, 2025-2035
- 12.3.1 Segment Definition and Scope
- 12.3.2 Historical Market Size, 2018-2025
- 12.3.3 Revenue Forecast, 2025-2035
- 12.3.4 Volume Forecast, 2025-2035
- 12.3.5 Base-Year Market Share, 2025
- 12.3.6 Segment CAGR and Growth Drivers
- 12.3.7 Subsegment Market Size and Forecast
- 12.3.7.1 Mono- and Diglycerides & Derivatives
- 12.3.7.2 Lecithin
- 12.3.7.3 Stearoyl Lactylates
- 12.3.7.4 Polyglycerol Esters & PGPR
- 12.3.7.5 Sorbitan Esters & Polysorbates
- 12.3.7.6 Sucrose Esters
- 12.3.7.7 Others
- 12.3.8 Subsegment Pricing and Adoption Trends
- 12.3.9 Leading Suppliers and Competition
- 12.3.10 Regional Demand and Opportunities
- 12.4 Segment Growth Comparison
- 12.5 Segment Attractiveness and Priority Matrix
Chapter 13 Global Food Emulsifiers Geographic Market Outlook, 2025-2035
- 13.1 Regional Market Size and Share, 2025
- 13.2 Regional Market Forecast, 2025-2035
- 13.3 Regional Pricing, Production and Demand Differences
- 13.4 North America
- 13.4.1 United States
- 13.4.2 Canada
- 13.4.3 Mexico
- 13.5 Europe
- 13.5.1 Germany
- 13.5.2 France
- 13.5.3 Italy
- 13.5.4 United Kingdom
- 13.5.5 Spain
- 13.5.6 Poland
- 13.5.7 Russia
- 13.5.8 Netherlands
- 13.5.9 Belgium
- 13.5.10 Sweden
- 13.5.11 Denmark
- 13.5.12 Norway
- 13.5.13 Rest of Europe
- 13.6 Asia Pacific
- 13.6.1 China
- 13.6.2 India
- 13.6.3 Japan
- 13.6.4 South Korea
- 13.6.5 Thailand
- 13.6.6 Indonesia
- 13.6.7 Vietnam
- 13.6.8 Malaysia
- 13.6.9 Australia
- 13.6.10 Rest of Asia Pacific
- 13.7 Latin America
- 13.7.1 Brazil
- 13.7.2 Argentina
- 13.7.3 Colombia
- 13.7.4 Chile
- 13.7.5 Rest of Latin America
- 13.8 Middle East
- 13.8.1 Saudi Arabia
- 13.8.2 United Arab Emirates
- 13.8.3 Turkey
- 13.8.4 Israel
- 13.8.5 Iran
- 13.8.6 Rest of the Middle East
- 13.9 Africa
- 13.9.1 South Africa
- 13.9.2 Egypt
- 13.9.3 Nigeria
- 13.9.4 Morocco
- 13.9.5 Rest of Africa
- 13.10 Regional Investment, Policy and Supply Chain Differences
- 13.11 Regional Competitive Landscape
- 13.12 Geographic Growth Hotspots
Chapter 14 Global Food Emulsifiers Technology, Innovation and Sustainability Outlook
- 14.1 Technology Landscape and Maturity
- 14.2 Product, Process and Service Innovation
- 14.3 AI, Automation and Digital Tools in the Industry
- 14.4 Technology Adoption and Performance Benchmarking
- 14.5 Innovation Pipeline and R&D Investment
- 14.6 Patent and Intellectual Property Trends
- 14.7 Energy Efficiency and Resource Management
- 14.8 Sustainability, Recycling and Circularity
- 14.9 Technology Roadmap, 2025-2035
- 14.10 Risks of Obsolescence and Technology Substitution
Chapter 15 Global Food Emulsifiers Market Key Strategic Imperatives
- 15.1 Growth and Market Entry Priorities
- 15.2 High-Return Products and Segments
- 15.3 Pricing, Profitability and Cost Optimization
- 15.4 Technology Investment and Product Differentiation
- 15.5 Supply Chain Localization and Resilience
- 15.6 Distribution and Customer Acquisition
- 15.7 Partnership, Acquisition and Capacity Strategy
- 15.8 Regional Expansion Priorities
- 15.9 Short-, Medium- and Long-Term Actions
Chapter 16 Competition Outlook
- 16.1 Industry Competition Characteristics
- 16.2 Market Structure and Concentration
- 16.3 Market Share and Competitive Positioning, 2025
- 16.4 Company-Wise Revenue and Product Benchmarking
- 16.5 Production and Service Capacity Benchmarking
- 16.6 Technology, Pricing and Differentiation
- 16.7 Regional Footprint and Distribution Strength
- 16.8 Mergers, Acquisitions and Strategic Alliances
- 16.9 New Entrants and Competitive Threats
- 16.10 Porter's Five Forces and Industry Attractiveness
- 16.11 Competitive Outlook, 2025-2035
Chapter 17 Company Profiles
- 17.1 Company Coverage and Selection Criteria
- 17.2 Cargill
- 17.2.1 Business Description
- 17.2.2 Company Ownership and Geographic Presence
- 17.2.3 Product and Service Portfolio
- 17.2.4 Manufacturing and Operating Footprint
- 17.2.5 Production Capacity and Expansion Plans
- 17.2.6 Financial Performance and Investment
- 17.2.7 Market Share and Competitive Position
- 17.2.8 Technology and Innovation Capabilities
- 17.2.9 Strategic Alliances or Partnerships
- 17.2.10 Recent Developments
- 17.2.11 Growth Strategy and Outlook
- 17.3 ADM
- 17.4 Bunge
- 17.5 Louis Dreyfus Company
- 17.6 Kerry Group
- 17.7 IFF
- 17.8 Palsgaard
- 17.9 Riken Vitamin
- 17.10 Taiyo Kagaku
- 17.11 Fine Organic Industries
- 17.12 Oleon
- 17.13 Stern-Wywiol Gruppe (Sternchemie)
- 17.14 Lasenor
- 17.15 Puratos
- 17.16 Other Relevant Market Participants
Note: Every listed company is profiled on the structure shown under the first company. The company list is preliminary and may change based on research findings, market developments, data availability and client requirements.
Chapter 18 Disclaimer
- 18.1 Research and Forecast Disclaimer
- 18.2 Data Source and Estimation Limitations
Note: The depth of individual sections depends on data availability for this market. Volume, capacity, trade and other unit-based metrics are included where applicable.

