Market Overview:
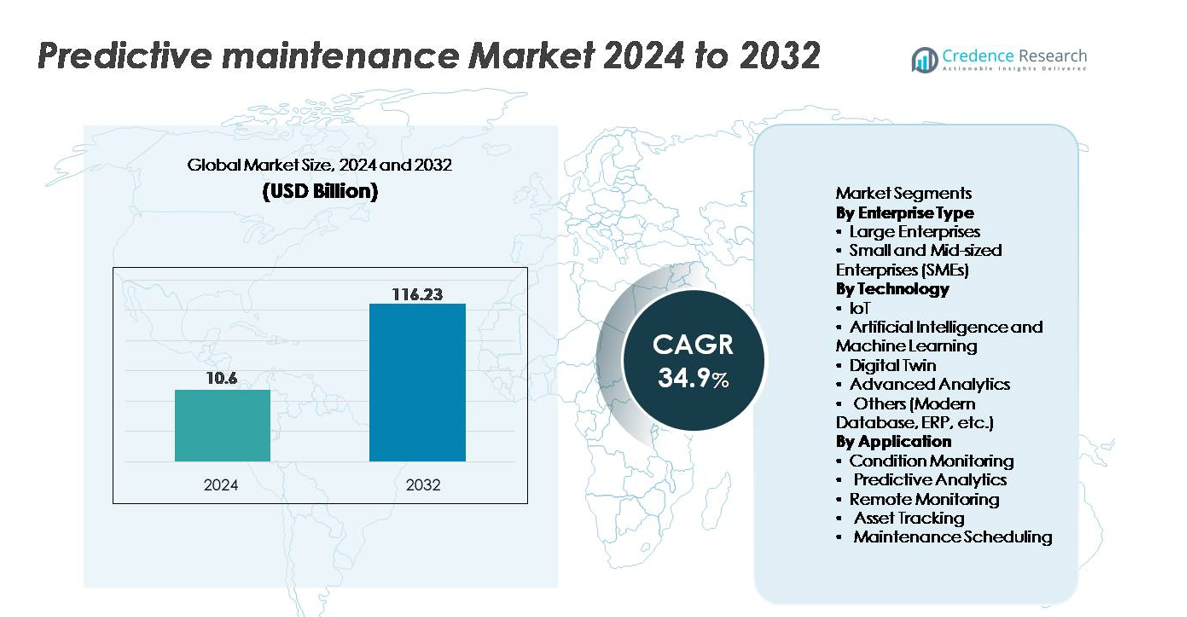
The global predictive maintenance market was valued at USD 10.6 billion in 2024 and is projected to reach USD 116.23 billion by 2032, expanding at a CAGR of 34.9% over the forecast period (2024–2032).
| REPORT ATTRIBUTE |
DETAILS |
| Historical Period |
2020-2023 |
| Base Year |
2024 |
| Forecast Period |
2025-2032 |
| Predictive Maintenance Market Size 2024 |
USD 10.6 billion |
| Predictive Maintenance Market, CAGR |
34.9% |
| Predictive Maintenance Market Size 2032 |
USD 116.23 billion |
The predictive maintenance market is shaped by a concentrated group of technology leaders and industrial innovators that drive large-scale adoption across global industries. Key players such as IBM Corporation, Siemens, General Electric, Rockwell Automation, C3.ai, PTC, Hitachi Ltd., Augury, UpKeep, and The Soothsayer (P-Dictor) offer advanced AI-driven diagnostic tools, IoT platforms, digital twins, and cloud-based monitoring systems that strengthen asset reliability and operational efficiency. These companies compete through analytics accuracy, ecosystem integration, and industry-specific customization. North America remains the leading region, accounting for approximately 39% of global market share, supported by strong digitalization, early Industry 4.0 adoption, and high investment in AI- and IoT-enabled maintenance solutions.
Market Insights:
- The global predictive maintenance market reached USD 10.6 billion in 2024 and is projected to hit USD 116.23 billion by 2032, expanding at a CAGR of 34.9% during the forecast period.
- Strong market growth is driven by rapid industrial digitalization, increasing IoT sensor deployment, and rising adoption of AI- and cloud-based monitoring platforms that help enterprises cut downtime and extend asset life.
- Key trends include accelerated use of digital twins, edge analytics, and autonomous maintenance workflows, with large enterprises leading adoption at over 60% share, supported by their advanced infrastructure and higher investment capacity.
- Competition intensifies among major players such as IBM, Siemens, GE, C3.ai, Rockwell Automation, PTC, Hitachi, Augury, UpKeep, and The Soothsayer as they innovate with integrated IoT ecosystems, scalable cloud suites, and industry-specific analytics.
- Regionally, North America holds the largest share at 39%, followed by Asia Pacific at ~25%, while Europe maintains a strong position due to mature industrial automation and regulatory-driven operational optimization.
Access crucial information at unmatched prices!
Request your sample report today & start making informed decisions powered by Credence Research Inc.!
Download Sample
Market Segmentation Analysis:
By Enterprise Type
Large enterprises dominate the predictive maintenance market, owing to their extensive asset portfolios, higher digital maturity, and strong investment capacity for AI-, IoT-, and cloud-enabled maintenance systems. These organizations deploy predictive solutions across manufacturing lines, fleets, utilities, and industrial plants to minimize downtime and optimize operational efficiency. SMEs are expanding adoption as subscription-based and cloud-native predictive platforms reduce upfront costs and simplify integration. However, large enterprises retain the largest market share due to broader sensor deployment, deeper analytics utilization, and centralized asset-management strategies that demand continuous performance monitoring.
- For instance, Siemens’ Senseye Predictive Maintenance analyzes data from more than 1,000 connected industrial assets at Sachsenmilch’s dairy facility, enabling early detection of pump failures and preventing losses estimated in the low six-figure euro range during a single intervention.
By Technology
IoT remains the leading technology sub-segment, capturing the highest share as organizations embed high-frequency sensors, gateways, and edge devices across machinery, production systems, and remote assets. IoT infrastructure generates real-time operational data essential for early fault detection and health forecasting. AI and machine learning follow as the fastest-advancing technologies, driven by algorithms that enhance pattern recognition and failure prediction accuracy. Digital twins gain momentum for simulating asset behavior, while advanced analytics and modern databases strengthen data orchestration and model scalability. IoT leadership persists due to its foundational role in enabling end-to-end predictive workflows.
- For instance, Schneider Electric’s EcoStruxure platform collects over 20 billion data points per day from connected equipment, using vibration sensors sampling at up to 51.2 kHz to detect early-stage mechanical anomalies in rotating assets.
By Application
Condition monitoring holds the dominant application share, supported by widespread use of vibration, temperature, pressure, and acoustic sensors that continuously evaluate asset health. Industries such as manufacturing, energy, and transportation prioritize condition monitoring to reduce unplanned downtime and extend equipment lifecycle. Predictive analytics and remote monitoring expand rapidly as AI models strengthen anomaly detection and cloud platforms enable centralized oversight of distributed operations. Asset tracking and maintenance scheduling complement these functions by improving asset visibility and optimizing service intervals. Condition monitoring leads due to its direct impact on reliability, failure prevention, and O&M cost reduction.
Key Growth Drivers:
Rapid Industrial Digitalization and Expansion of IoT-Enabled Asset Ecosystems
Industrial sectors worldwide are accelerating digital transformation, creating strong momentum for predictive maintenance adoption. Companies are equipping production lines, rotating equipment, utility networks, and fleet systems with high-density IoT sensors that capture real-time operational data, enabling continuous health assessment and early failure detection. Integration with 5G, edge computing, and advanced telemetry systems strengthens data accuracy and increases the frequency of condition observations. This digital shift allows enterprises to replace reactive and preventive maintenance approaches with predictive frameworks that reduce downtime, minimize repair costs, and optimize asset utilization. As industrial automation deepens across manufacturing, energy, transportation, mining, and logistics, organizations require scalable monitoring solutions to support multi-site operations, driving sustained adoption of predictive maintenance technologies.
- For instance, Augury’s Machine Health platform analyzes more than 150 million machine-operating hours annually and processes vibration and ultrasonic data sampled at up to 100 kHz across thousands of industrial assets, enabling early identification of bearing, motor, and gearbox degradation.
Growing Adoption of AI, Machine Learning, and Advanced Analytics
The increasing use of AI and machine learning algorithms in industrial operations is significantly strengthening predictive maintenance capabilities. Organizations are leveraging supervised and unsupervised models to detect anomalies, analyze historical performance patterns, and predict failure probabilities with higher accuracy. The evolution of deep learning, neural networks, and reinforcement learning is enabling automated root-cause analysis and asset-behavior forecasting at scale. AI-driven predictive insights also support dynamic maintenance scheduling, optimized spare-parts inventory, and improved workforce productivity. As enterprises accumulate large volumes of sensor and operational data, advanced analytics platforms convert these data streams into actionable insights, reducing unplanned stoppages and extending equipment lifespan. The ability of AI-driven maintenance to deliver measurable operational and financial gains continues to accelerate market expansion.
- For instance, C3.ai’s predictive maintenance platform has been deployed across more than 1.5 million connected industrial assets, processing over 4 trillion rows of time-series data to train AI models for equipment anomaly detection and root-cause analysis.
Rising Pressure to Reduce Downtime, Maintenance Costs, and Safety Risks
Industries facing high downtime costs, stringent safety regulations, and increasing asset complexity are investing heavily in predictive maintenance to protect productivity and operational continuity. Traditional reactive maintenance exposes organizations to sudden equipment failures, high repair expenditures, and safety hazards. Predictive maintenance systems mitigate these risks by delivering early alerts, enabling planned interventions, and preventing catastrophic breakdowns. In asset-intensive sectors such as oil & gas, aviation, manufacturing, mining, and energy distribution, even a few minutes of unplanned downtime can result in substantial revenue loss. Predictive tools help companies optimize maintenance schedules, extend component life, and reduce unnecessary service operations, significantly lowering total cost of ownership. Growing regulatory compliance requirements further reinforce adoption by promoting safer, more reliable maintenance practices.
Key Trends & Opportunities:
Growing Adoption of Digital Twins for High-Fidelity Asset Simulation
Digital twin technology is emerging as a transformative trend, offering powerful opportunities for advanced predictive maintenance deployments. By creating real-time virtual replicas of machines, manufacturing lines, and industrial systems, digital twins simulate asset behavior under varying operational conditions, enabling highly accurate failure forecasting and performance optimization. Organizations are integrating sensor data, CAD models, operational logs, and AI-driven analytics to create multi-layered simulations that reveal hidden degradation patterns and stress points. This trend opens new avenues for scenario testing, remote diagnostics, and lifecycle optimization, particularly in aerospace, automotive, energy, and heavy manufacturing. As digital twins become more accessible through cloud platforms and scalable computing power, enterprises can deploy predictive maintenance at system level rather than at individual asset level, creating deeper operational insights.
- For instance, GE Digital has reported deploying over one million digital twins across various industries, including aviation, power, and manufacturing. The company’s technology monitors thousands of critical assets globally, enabling predictive maintenance that helps customers achieve significant cost savings.
Expansion of Cloud-Native and Subscription-Based Predictive Platforms
Cloud-based predictive maintenance platforms are creating major opportunities for scalable, cost-efficient implementation across global enterprise operations. These platforms offer low upfront investment, fast deployment, and seamless integration with existing industrial systems, making them particularly attractive for SMEs and distributed asset networks. Cloud infrastructure supports centralized monitoring of geographically dispersed equipment, enabling unified dashboards, AI-driven analytics, and cross-site benchmarking. Subscription-based models further democratize adoption by eliminating major capital expenditures and providing continuous software updates, automated analytics, and remote diagnostics. As enterprises shift toward hybrid and multi-cloud architectures, vendors are increasingly offering interoperable predictive solutions that integrate ERP, MES, EAM, and asset-control systems, expanding market potential across industry verticals.
- For instance, Siemens’ Industrial IoT solution, now known as Insights Hub (formerly MindSphere), connects assets as part of the broader Siemens Xcelerator portfolio. The platform enables real-time anomaly detection and fleet-level diagnostics across global facilities by leveraging data from connected products, plants, and systems. Specific, up-to-date public figures for the total number of connected assets and exact data points per minute ingested across all customers are not readily available, but the platform handles massive volumes of da, with Siemens’ industrial control systems alone generating around 100 terabytes of data every hour globally.
Increasing Integration With Autonomous Operations and Smart Factories
The rise of Industry 4.0 and smart manufacturing ecosystems is creating new opportunities for predictive maintenance to become a core component of autonomous operations. Intelligent factories require interconnected systems where machines communicate, self-adjust, and independently optimize performance. Predictive maintenance supports this vision by enabling real-time condition monitoring, adaptive control, and automated maintenance triggering. Integration with robotics, AGVs, digital quality systems, and smart supply-chain platforms enhances production continuity and operational resilience. As enterprises advance toward lights-out and hyper-automated facilities, predictive maintenance evolves from a maintenance function to a strategic enabler of autonomous and self-healing industrial environments.
Key Challenges:
High Implementation Complexity and Integration With Legacy Systems
Despite strong demand, integrating predictive maintenance into existing industrial environments presents significant technical and operational challenges. Many organizations operate legacy machinery that lacks embedded sensors or digital interfaces, requiring retrofitting or infrastructure upgrades to enable data collection. Interoperability issues arise when combining data from heterogeneous equipment, proprietary platforms, and siloed IT/OT systems. Implementing AI and advanced analytics models also requires skilled personnel and robust data governance frameworks. The complexity of harmonizing sensor networks, cloud platforms, asset-management software, and cybersecurity controls often leads to extended deployment timelines and increased operational risk, slowing adoption in traditional industries.
Data Quality, Security, and Workforce Skill Gaps
Predictive maintenance relies heavily on high-quality, continuous, and accurately labeled data. Many organizations struggle with incomplete datasets, inconsistent sensor readings, and poor data standardization, which weaken model reliability and prediction accuracy. Cybersecurity risks escalate as more industrial assets connect to cloud and IoT networks, increasing exposure to unauthorized access and operational disruptions. Additionally, there is a growing shortage of skilled professionals capable of managing AI-driven analytics, maintaining sensor architectures, and interpreting predictive insights. These data and talent constraints impede full-scale deployment and limit the operational value derived from predictive maintenance initiatives.
Regional Analysis:
North America
North America leads the predictive maintenance market with an estimated 39% share, supported by early Industry 4.0 adoption, strong industrial automation maturity, and heavy investment in IoT- and AI-enabled maintenance systems. The region’s manufacturing, aerospace, energy, and automotive sectors rely heavily on real-time condition monitoring and AI-driven asset-health analytics to enhance reliability and reduce downtime. High penetration of cloud-based platforms, strong technological infrastructure, and a large installed base of connected equipment reinforce its leadership. Ongoing modernization of legacy industrial assets and increasing regulatory focus on operational safety further sustain long-term regional dominance.
Europe
Europe represents a significant portion of the predictive maintenance market, holding roughly 26% share, driven by advanced automation across manufacturing, automotive, chemicals, and process industries. Strong regulatory emphasis on workplace safety, emissions reduction, and energy efficiency encourages adoption of predictive monitoring platforms and AI-driven diagnostics. European companies increasingly deploy digital twins, high-frequency sensor networks, and remote monitoring to optimize asset performance and minimize production interruptions. Germany, France, the U.K., and Italy lead adoption, supported by robust innovation ecosystems and ongoing investment in industrial digitalization. Europe’s focus on sustainability and lifecycle optimization continues to strengthen its market position.
Asia Pacific
Asia Pacific holds approximately 28% of the predictive maintenance market and is the fastest-growing region due to rapid industrial expansion, modernization of production facilities, and rising adoption of IoT-enabled maintenance systems. China, India, Japan, and South Korea are investing heavily in smart manufacturing, large-scale asset monitoring, and advanced analytics to reduce downtime and improve operational resilience. Growing adoption of cloud maintenance platforms, coupled with increasing deployment of edge sensors across factories, energy grids, and transportation systems, drives strong momentum. Government initiatives supporting digital transformation and industrial competitiveness further accelerate uptake across the region.
Latin America
Latin America accounts for an estimated 8% share of the predictive maintenance market, with growth supported by increasing digitalization in oil & gas, mining, food processing, and utilities. Countries such as Brazil, Mexico, and Chile are adopting AI- and IoT-led maintenance systems to reduce equipment failures, improve safety compliance, and optimize plant performance. Despite budget constraints and slower modernization compared to advanced economies, cloud-based predictive platforms and remote diagnostic capabilities are driving adoption. As regional industries focus on energy efficiency and reducing costly unplanned outages, predictive maintenance is gaining traction as a strategic operational tool.
Middle East & Africa (MEA)
The Middle East & Africa region holds roughly 6% of the predictive maintenance market, with demand rising steadily across oil & gas, power generation, petrochemicals, and mining. Gulf countries, led by Saudi Arabia and the UAE, are integrating AI-driven maintenance solutions into large industrial assets to reduce operational risks and extend equipment life. African markets such as South Africa and Egypt show increasing adoption of remote monitoring to support distributed infrastructure and minimize machine failures. While adoption remains at an early stage, investments in smart industrial projects and digital transformation programs are expected to expand regional market penetration.
Market Segmentations:
By Enterprise Type
- Large Enterprises
- Small and Mid-sized Enterprises (SMEs)
By Technology
- IoT
- Artificial Intelligence and Machine Learning
- Digital Twin
- Advanced Analytics
- Others (Modern Database, ERP, etc.)
By Application
- Condition Monitoring
- Predictive Analytics
- Remote Monitoring
- Asset Tracking
- Maintenance Scheduling
By Geography
- North America
- Europe
- Germany
- France
- U.K.
- Italy
- Spain
- Rest of Europe
- Asia Pacific
- China
- Japan
- India
- South Korea
- South-east Asia
- Rest of Asia Pacific
- Latin America
- Brazil
- Argentina
- Rest of Latin America
- Middle East & Africa
- GCC Countries
- South Africa
- Rest of the Middle East and Africa
Competitive Landscape:
The competitive landscape of the predictive maintenance market is characterized by strong participation from global technology vendors, industrial automation companies, cloud service providers, and AI-driven analytics firms. Major players such as IBM, SAP, Siemens, Schneider Electric, GE Digital, Microsoft, and Hitachi leverage their integrated IoT platforms, AI engines, and asset-management ecosystems to strengthen market presence. These companies focus on expanding cloud-native predictive suites, enhancing machine-learning models, and integrating digital twin capabilities to improve accuracy and operational value. Partnerships with equipment manufacturers, sensor providers, and industry-specific solution developers remain central to expanding customer reach and delivering end-to-end predictive workflows. Vendors increasingly differentiate through real-time analytics performance, interoperability, cybersecurity features, and industry-specific customization. As competition intensifies, the market is witnessing heightened investment in automated diagnostics, edge analytics, and subscription-based service models to meet enterprise demand for scalable, cost-efficient, and reliable maintenance intelligence solutions.
Shape Your Report to Specific Countries or Regions & Enjoy 30% Off!
Key Player Analysis:
- Augury Ltd. (U.S.)
- Siemens (Germany)
- UpKeep (U.S.)
- Hitachi Ltd. (Japan)
- ai, Inc. (U.S.)
- IBM Corporation (U.S.)
- The Soothsayer (P-Dictor) (Thailand)
- Rockwell Automation (U.S.)
- General Electric (U.S.)
- PTC (U.S.)
Recent Developments:
- In October 2025, Augury was recognized by an independent research firm in the Verdantix Green Quadrant: Industrial AI Analytics Software report as a leader in industrial AI analytics underscoring its strength in real-time diagnostics, multi-modal sensor analytics, and guaranteed diagnostic performance.
- In June 2024, Hitachi Ltd. via its division Hitachi Industrial Equipment Systems (Japan) introduced a “Predictive Diagnosis Service” for air compressors. The service uses machine learning combined with maintenance-staff know-how to analyze remote-monitoring data and detect early signs of abnormal equipment behavior, helping prevent stoppages and optimize energy efficiency.
- In March 2025, Augury Ltd. (U.S.) launched “Machine Health Ultra Low”, the industry’s first AI-powered predictive maintenance solution designed specifically for ultra-low RPM machinery (1–150 RPM). This expands their coverage to slow-rotating industrial assets previously difficult to monitor.
Report Coverage:
The research report offers an in-depth analysis based on Enterprise type, Technology, Application and Geography. It details leading market players, providing an overview of their business, product offerings, investments, revenue streams, and key applications. Additionally, the report includes insights into the competitive environment, SWOT analysis, current market trends, as well as the primary drivers and constraints. Furthermore, it discusses various factors that have driven market expansion in recent years. The report also explores market dynamics, regulatory scenarios, and technological advancements that are shaping the industry. It assesses the impact of external factors and global economic changes on market growth. Lastly, it provides strategic recommendations for new entrants and established companies to navigate the complexities of the market.
Future Outlook:
- Predictive maintenance adoption will accelerate as enterprises advance toward fully connected, sensor-rich industrial ecosystems.
- AI and machine learning models will become more autonomous, enabling self-optimizing maintenance decisions with minimal human intervention.
- Digital twin integration will expand, allowing high-fidelity simulations that enhance equipment lifecycle planning and precision forecasting.
- Edge analytics will grow rapidly, supporting faster fault detection and reducing reliance on centralized cloud processing.
- Cross-industry standardization of data formats and interoperability frameworks will streamline multi-vendor system integration.
- Cybersecure predictive maintenance platforms will gain priority as connected assets increase exposure to operational risks.
- SMEs will adopt predictive solutions more widely as subscription-based, cloud-native platforms lower entry barriers.
- Predictive maintenance will merge with smart factory ecosystems to support autonomous production, robotics coordination, and intelligent scheduling.
- Remote and distributed asset ecosystems will rely heavily on real-time monitoring and advanced anomaly detection.
- Sustainability goals will drive demand for predictive maintenance to reduce energy waste, emissions, and equipment downtime.


