
New corridors are turning metro upkeep into contract work
The India metro rail O&M services market was valued at USD 600.0 million in 2025 and is projected to increase from USD 660.0 million in 2026 to USD 1.43 billion by 2035, registering a CAGR of 9.00% during 2026–2035. Demand comes from metro corporations that must keep trains, track, signaling and stations running across a network that Union Minister of State Tokhan Sahu put at more than 1,185 km in October 2026. South India held the largest regional share, 39.0% in 2025, because Bengaluru, Hyderabad, Chennai and Kochi together ran about 248 km by December 2025. Central India is the fastest-growing region at 10.27% a year as Indore and Bhopal move from construction into service. The buying model has also changed, since corporations now award 10-year and 15-year packages rather than keeping all work in-house. Delhi Metro Rail Corporation won the Chennai Phase II package in April 2025, and Keolis took Pune Line 3 in September 2025.
What does metro operation and maintenance spending in India cover?
The market counts spending on running and maintaining urban metro lines in India, including train and depot maintenance, track and signaling upkeep, station management, ticketing staff and control-center work. It includes both the cost of in-house teams at metro corporations and the value of contracts awarded to operators, equipment makers and facility firms.
The estimate excludes line construction, new train purchases, debt service, traction energy and property income. Suburban trains run by Indian Railways are excluded, and regional rapid transit is counted only where a metro operator or contract is involved. Value flows from corporations and concessionaires to operators and makers, then to component suppliers and labor contractors.
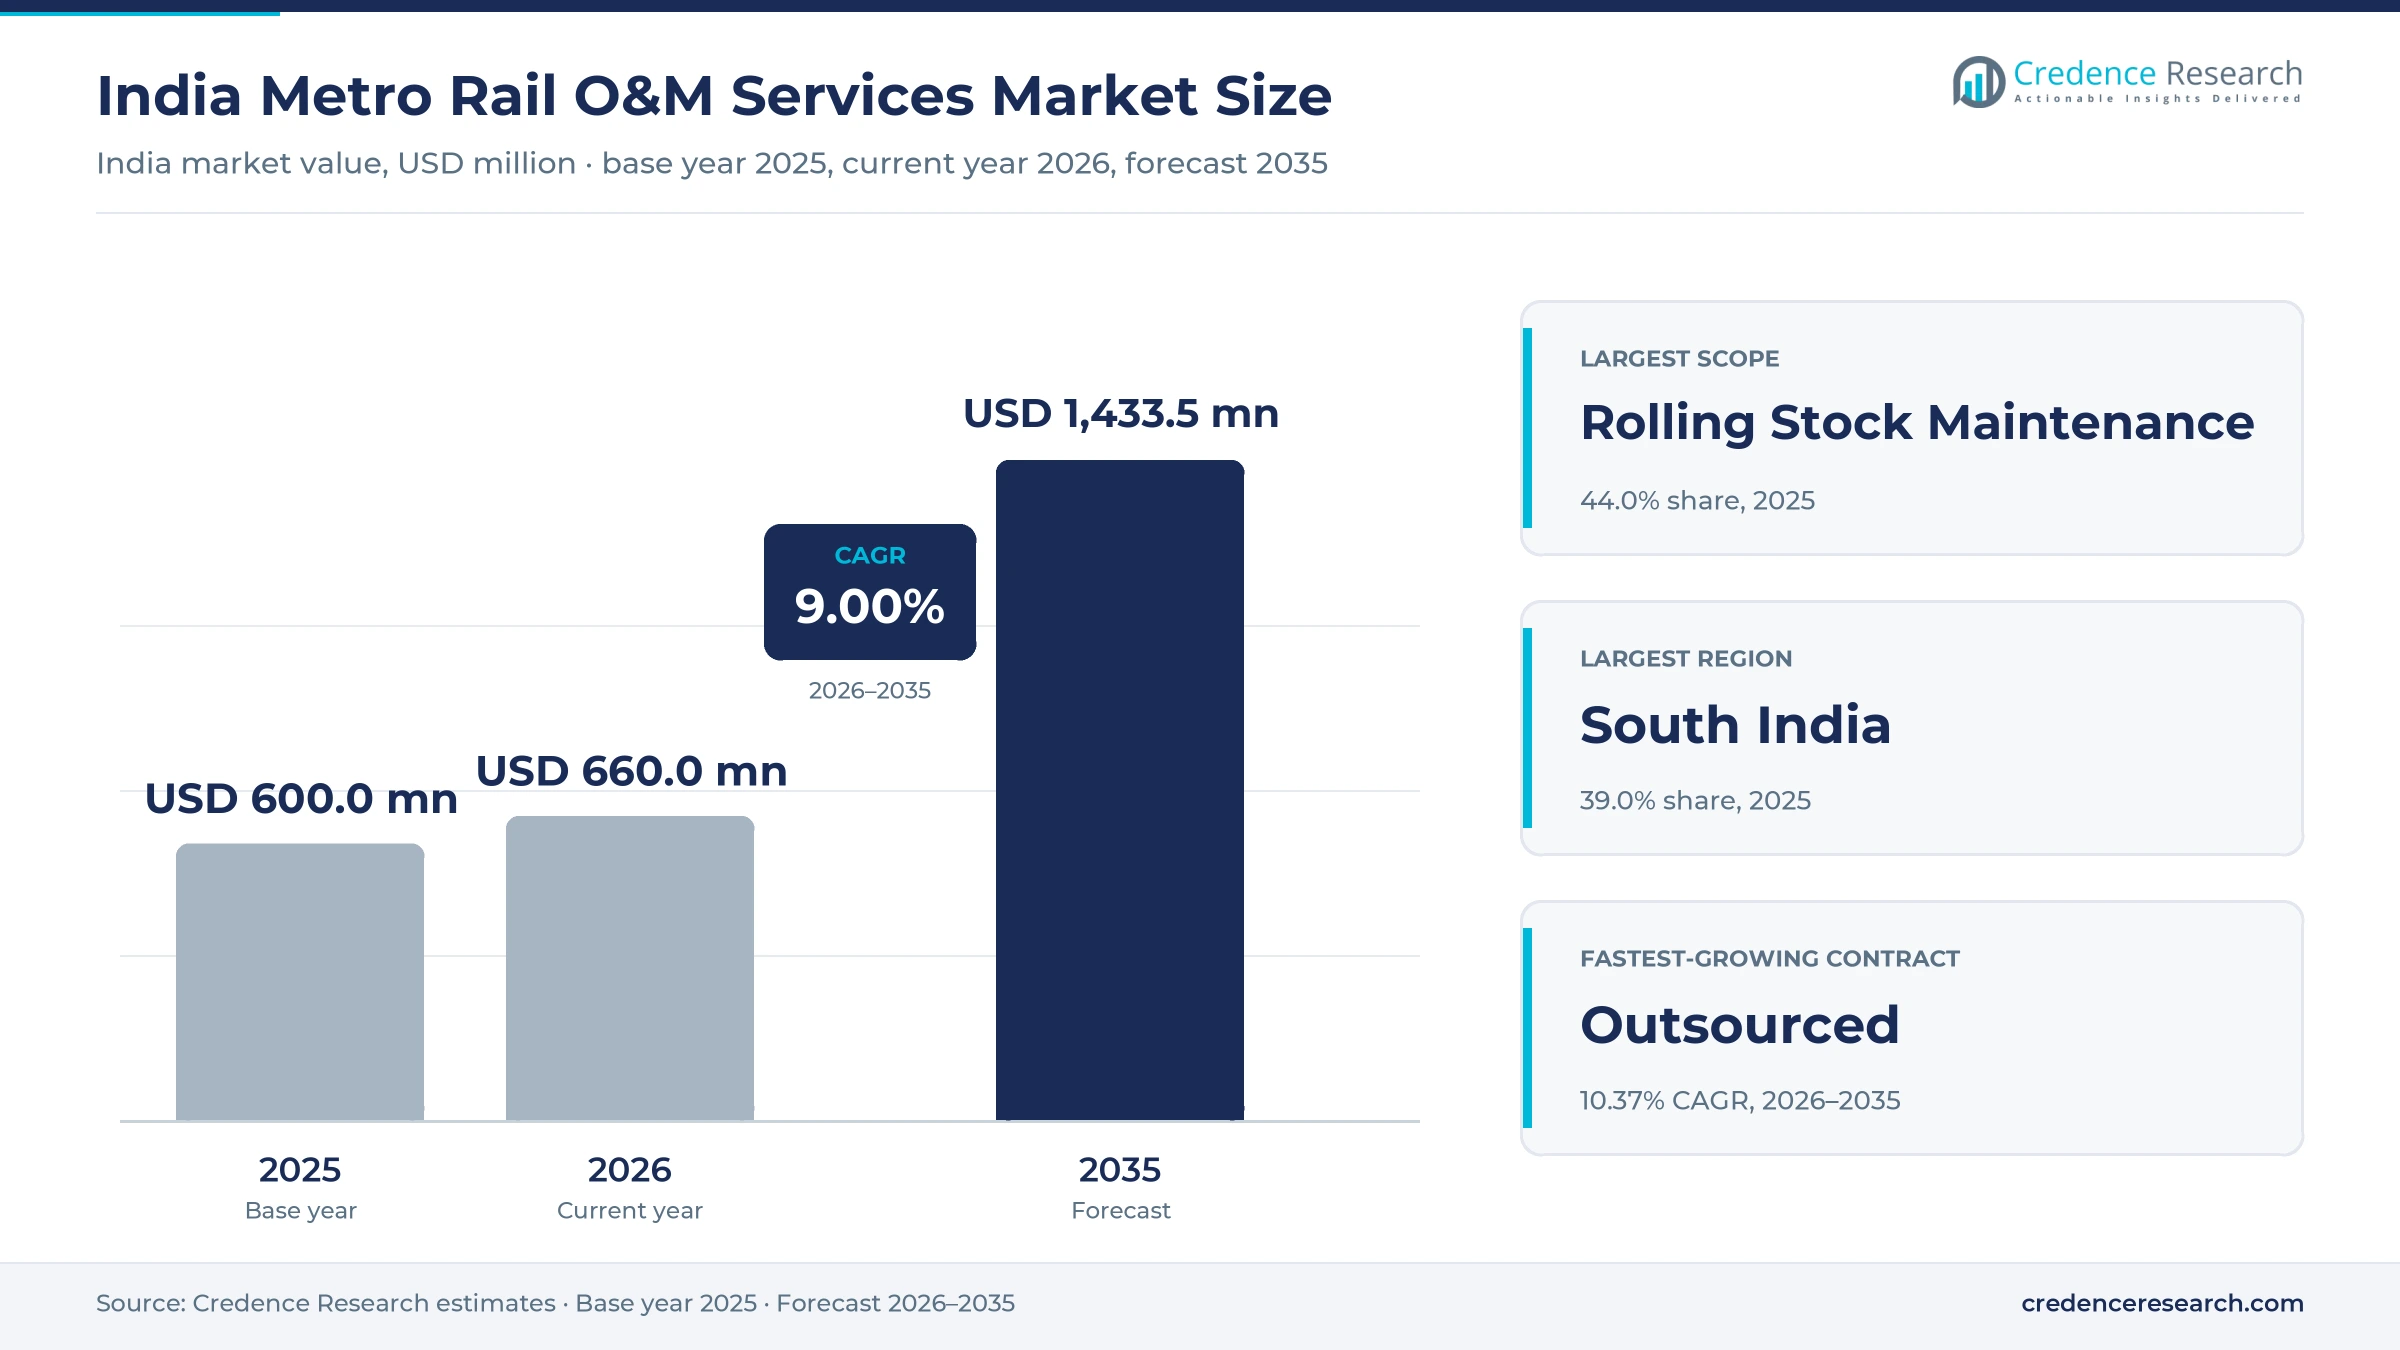
India Metro Rail O&M Services Market Insights
- The market grows from USD 600.0 million in 2025 to USD 1.43 billion by 2035 at a 9.00% CAGR, tied closely to a pipeline of 998 km under construction in October 2026.
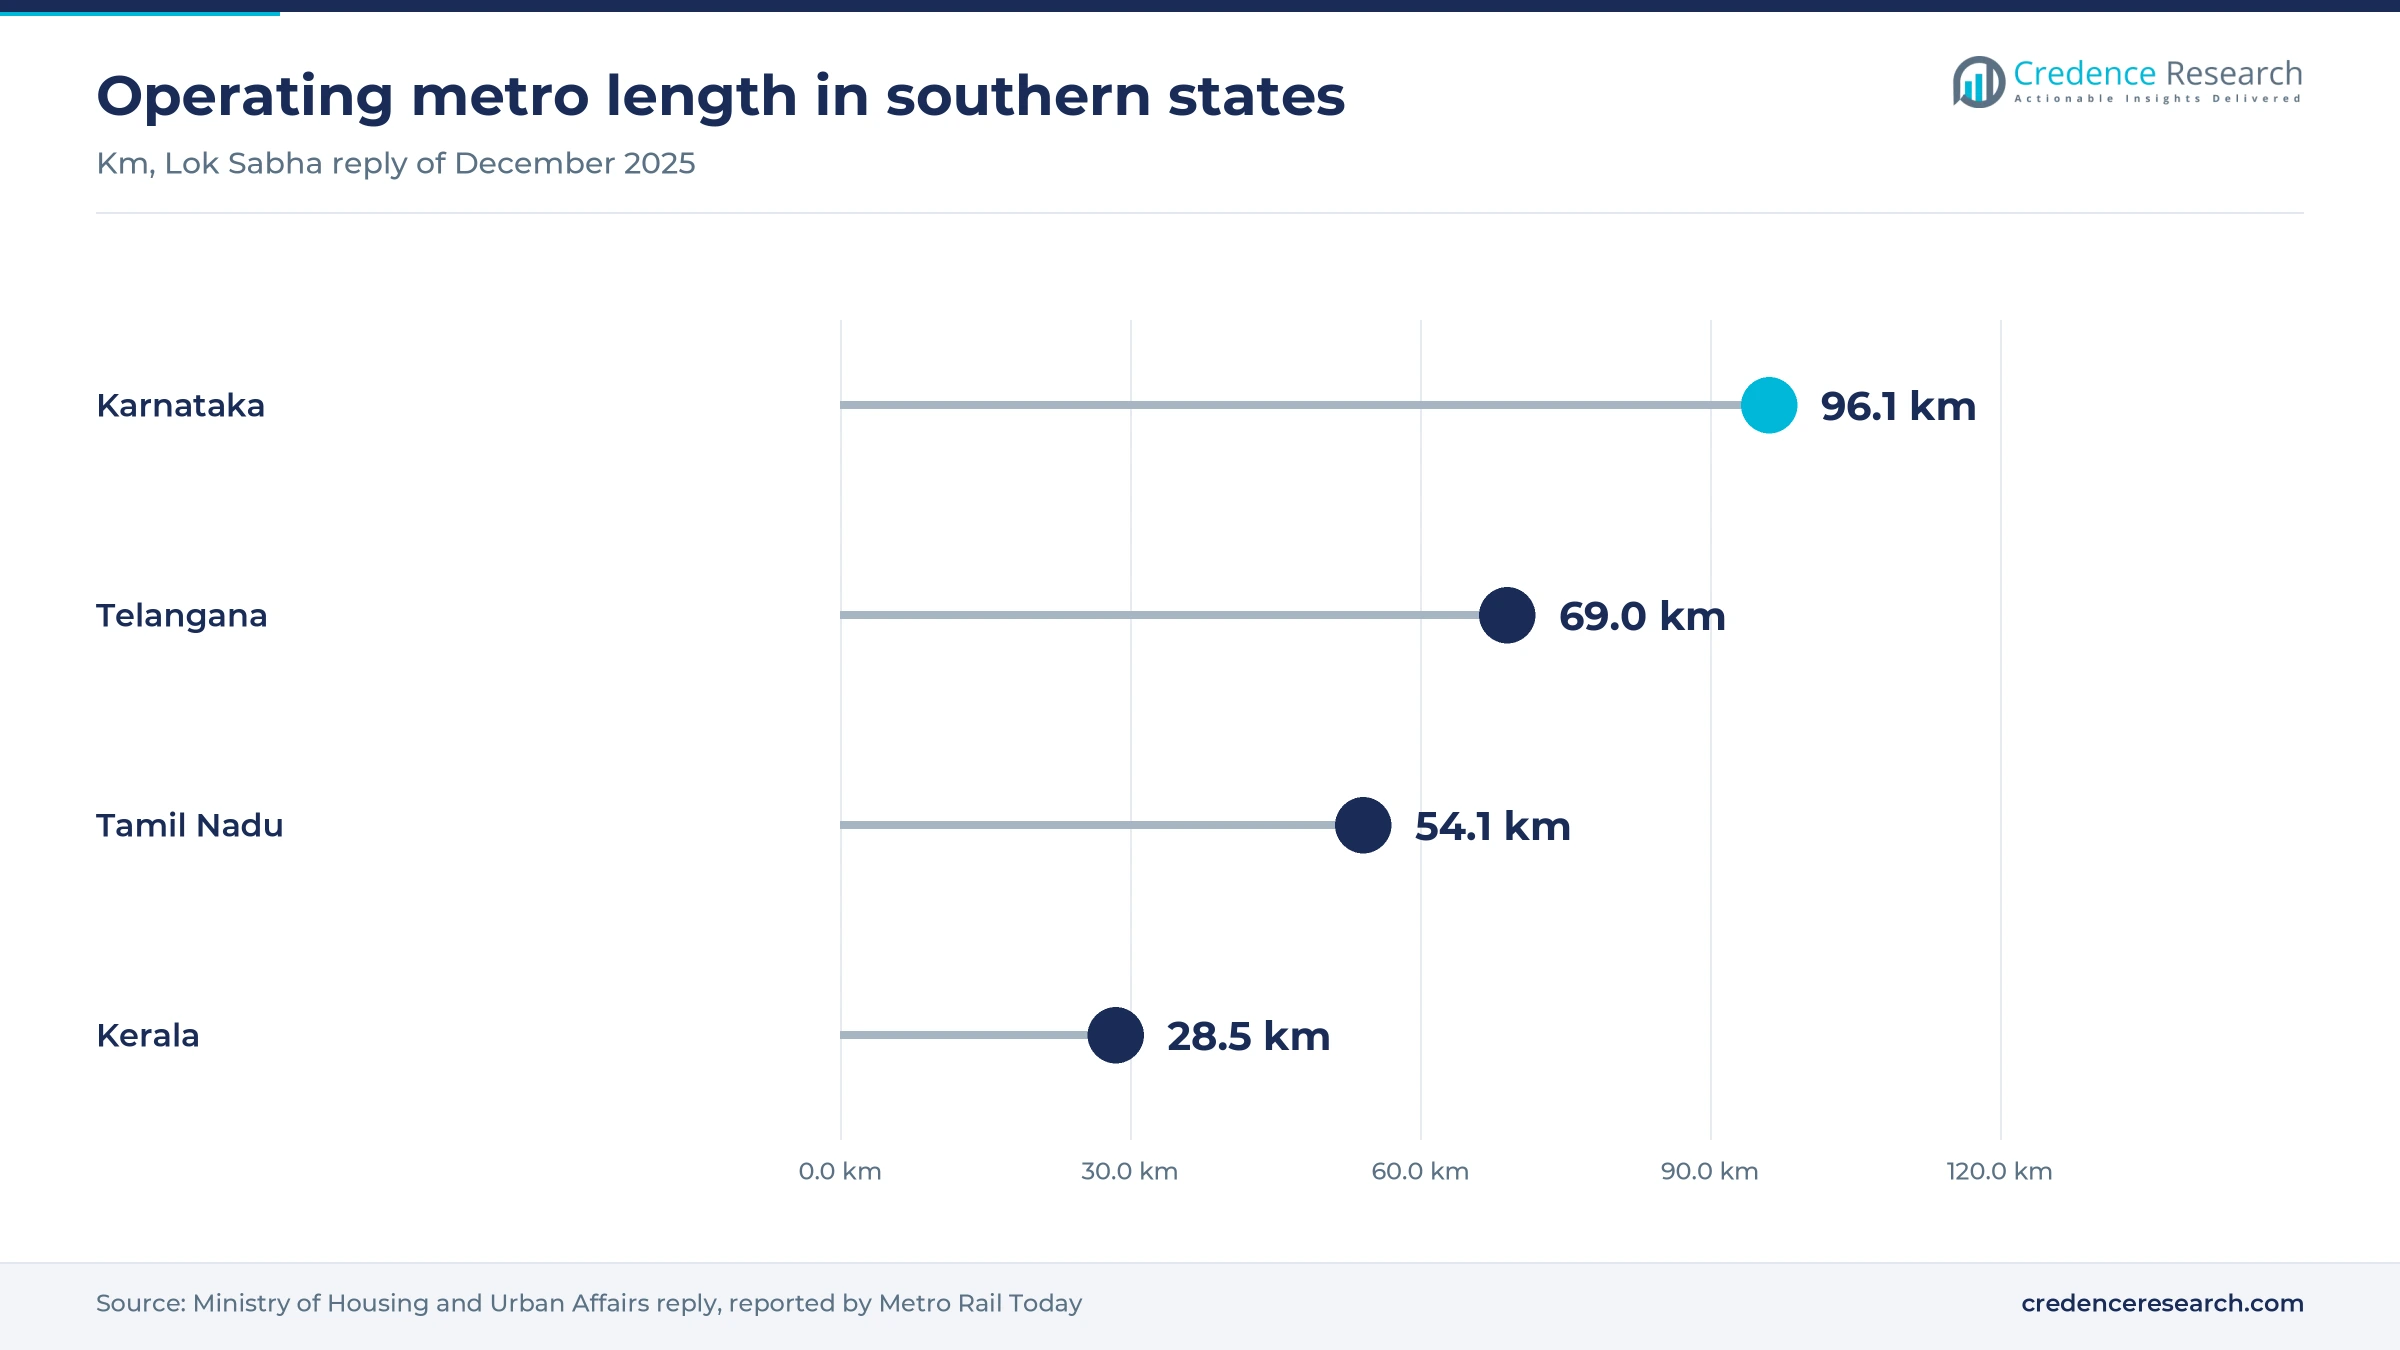
- South India held 39.0% of value in 2025, supported by 96.1 km in Karnataka and 69 km in Telangana reported to the Lok Sabha in December 2025.
- Rolling Stock Maintenance held 44.0% of 2025 value, reflecting long fleet agreements such as the 10-year Alstom contract signed with Delhi Metro in September 2025.
- Outsourcing is widening, with Delhi Metro awarded about 15 years of work in Chennai and Power Mech Projects a five-year Mumbai Monorail contract in April 2026.
- Predictive tools are moving into depots, including the AI wheel measurement system that Mumbai operator MMMOCL installed at Charkop, as reported by PTI in December 2025.
Rolling stock upkeep leads as outsourcing gains ground
Why does fleet upkeep take the largest share of spending?
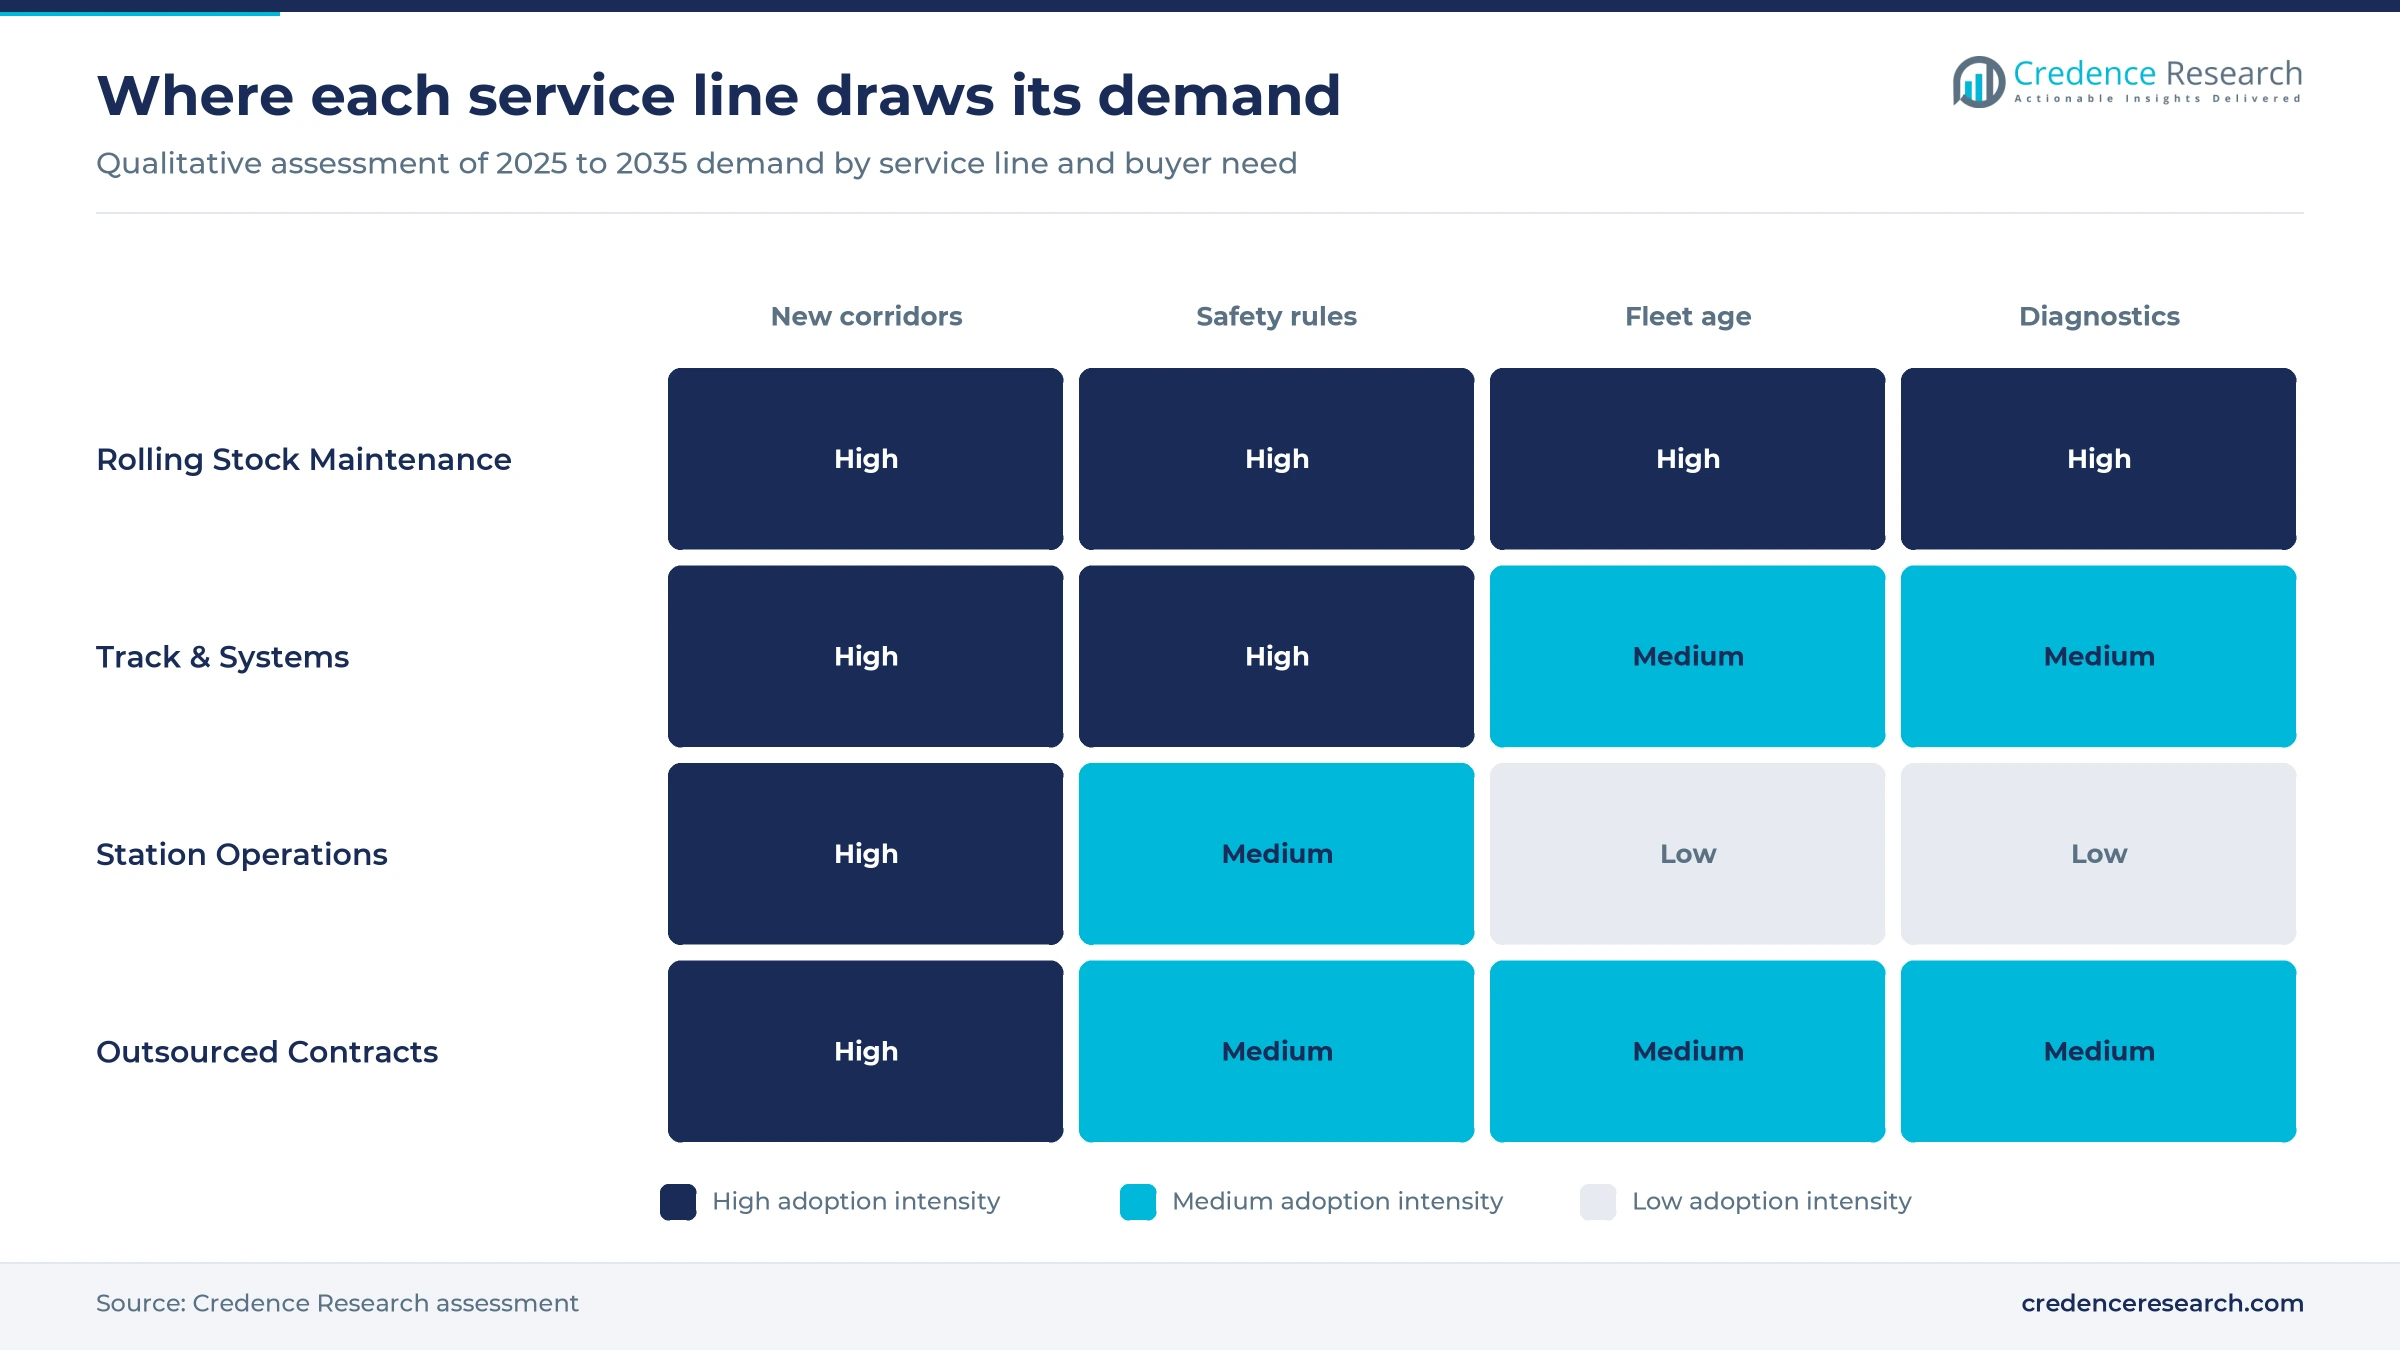
Based on scope, the market is categorized into rolling stock maintenance, track and systems and station operations. Rolling Stock Maintenance led with 44.0% of 2025 value because each fleet of rolling stock needs scheduled overhauls, and Maha-Metro tendered a five-year package for Navi Mumbai trains and depot equipment on March 6, 2026. Rolling Stock Maintenance is the fastest group at 9.18% a year as new orders bundle fleet care from the start. Alstom, for example, agreed in August 2025 to maintain all 234 cars for Mumbai Line 4 over five years.
How quickly is work moving from in-house teams to contractors?
Based on contract, the market is categorized into in-house and outsourced work. In-House led with 64.0% of 2025 value because large corporations still run their own lines, and DT Next cited about 13,900 staff at Delhi Metro in April 2025. Outsourced work grows fastest at 10.37% a year as newer lines hand whole systems to contractors. Power Mech Projects won a five-year, Rs 296 crore contract for the 19.54 km Mumbai Monorail in April 2026, while Chennai Metro Phase I already used about 2,000 contract workers beside 300 permanent staff.
Which cities carry the most metro upkeep spending?
Based on city, the market is categorized into Delhi, Mumbai, Bengaluru, Hyderabad and others. Others led with 41.0% of 2025 value because the group spans Chennai, Pune, Kochi, Kolkata, Ahmedabad and Lucknow, while Delhi remains the largest single city, with DT Next citing about 13,900 Delhi Metro staff in April 2025. Bengaluru grows fastest at 10.63% a year as its network expands quickly. Karnataka Deputy Chief Minister D K Shivakumar said on Dec. 22, 2025, that Namma Metro would rise from 96.1 km to 137.11 km during 2026 and to 175.55 km by 2027.
| Segment Group | Leading Sub-segment | Share, 2025 | Fastest-growing Sub-segment | CAGR, 2026–2035 |
|---|---|---|---|---|
| By Scope | Rolling Stock Maintenance | 44.0% | Rolling Stock Maintenance | 9.18% |
| By Contract | In-House | 64.0% | Outsourced | 10.37% |
| By City | Others | 41.0% | Bengaluru | 10.63% |
Request a Free Sample
Fill in your details and we'll send you a free sample report.
- Sample data tables & charts
- Research methodology
Corridor openings and safety duties anchor spending
New corridors create long-term O&M contracts
Every commissioned kilometer adds a multi-decade upkeep obligation, which makes the construction pipeline the strongest demand signal. Tokhan Sahu said on Oct. 23, 2026, that 998 km was under construction beside more than 1,185 km in service, compared with 248 km in 2014. Contract awards now follow that pipeline closely in several large cities. Chennai Metro awarded about 118.9 km of Phase II work in April 2025, and Metro Rail Today reported a 10-year Keolis contract for the 23 km Pune Line 3 in September 2025. The Union Budget for 2026-27 also set aside Rs 309.4 billion for metro and mass rapid transit, according to India Infrastructure. In the Credence Research model this driver adds about 3.8 percentage points to annual growth to 2035.
Reliability and safety mandates favor specialists
Safety duties raise the skill level needed to run a line, which favors specialist operators over general labor contractors. The Metro Railways General Rules 2020 bar staff from assigned duties until they pass a prescribed examination and hold a certificate of competency, and they require immediate reporting of track, signal or train defects. Commercial terms push the same way, since Railway Gazette reported in June 2023 that Mumbai Line 3 uses key performance indicators for its contractor. The Mumbai Monorail shows the cost of failure, because Construction World reported that service stopped on Sept. 20, 2025, and safety certification for new trains and signaling followed in February 2026. In the Credence Research model these mandates add about 2.3 percentage points to annual growth to 2035.
Predictive maintenance expands the service scope
Diagnostic tools add data and analysis work to traditional maintenance, and they widen what a contract can include. Alstom said on Sept. 12, 2025, that its 10-year, EUR 42.1 million Delhi Metro contract uses predictive analytics and covers onboard signaling support for 103 trains on Lines 1 and 2. PTI reported on Dec. 5, 2025, that Mumbai operator MMMOCL had installed an AI wheel profile system at Charkop depot, which recommends repair before a failure occurs. Railway Gazette also reported that onboard diagnostics on Delhi Pink Line trains support condition-based maintenance. In the Credence Research model this driver adds about 1.5 percentage points to annual growth to 2035.
Urban population and ridership raise service hours
Heavier use shortens maintenance intervals and leaves less time for overnight work, so passenger growth lifts spending even without new track. India Infrastructure reported in September 2026 that urban metro networks carry more than 11.5 million riders a day. Kolkata alone carried 236 million passengers in 2025-26, according to Construction World. Longer term, the World Bank expects the urban population to reach 951 million by 2050, almost double the current level, and it said in July 2025 that over half of the urban infrastructure needed by then remains unbuilt. These figures support the Credence Research view that dense urban zones will need more frequent fleet and station work.
DMRC contracts and maker-led bundles reshape the field
How DMRC became a contractor beyond Delhi
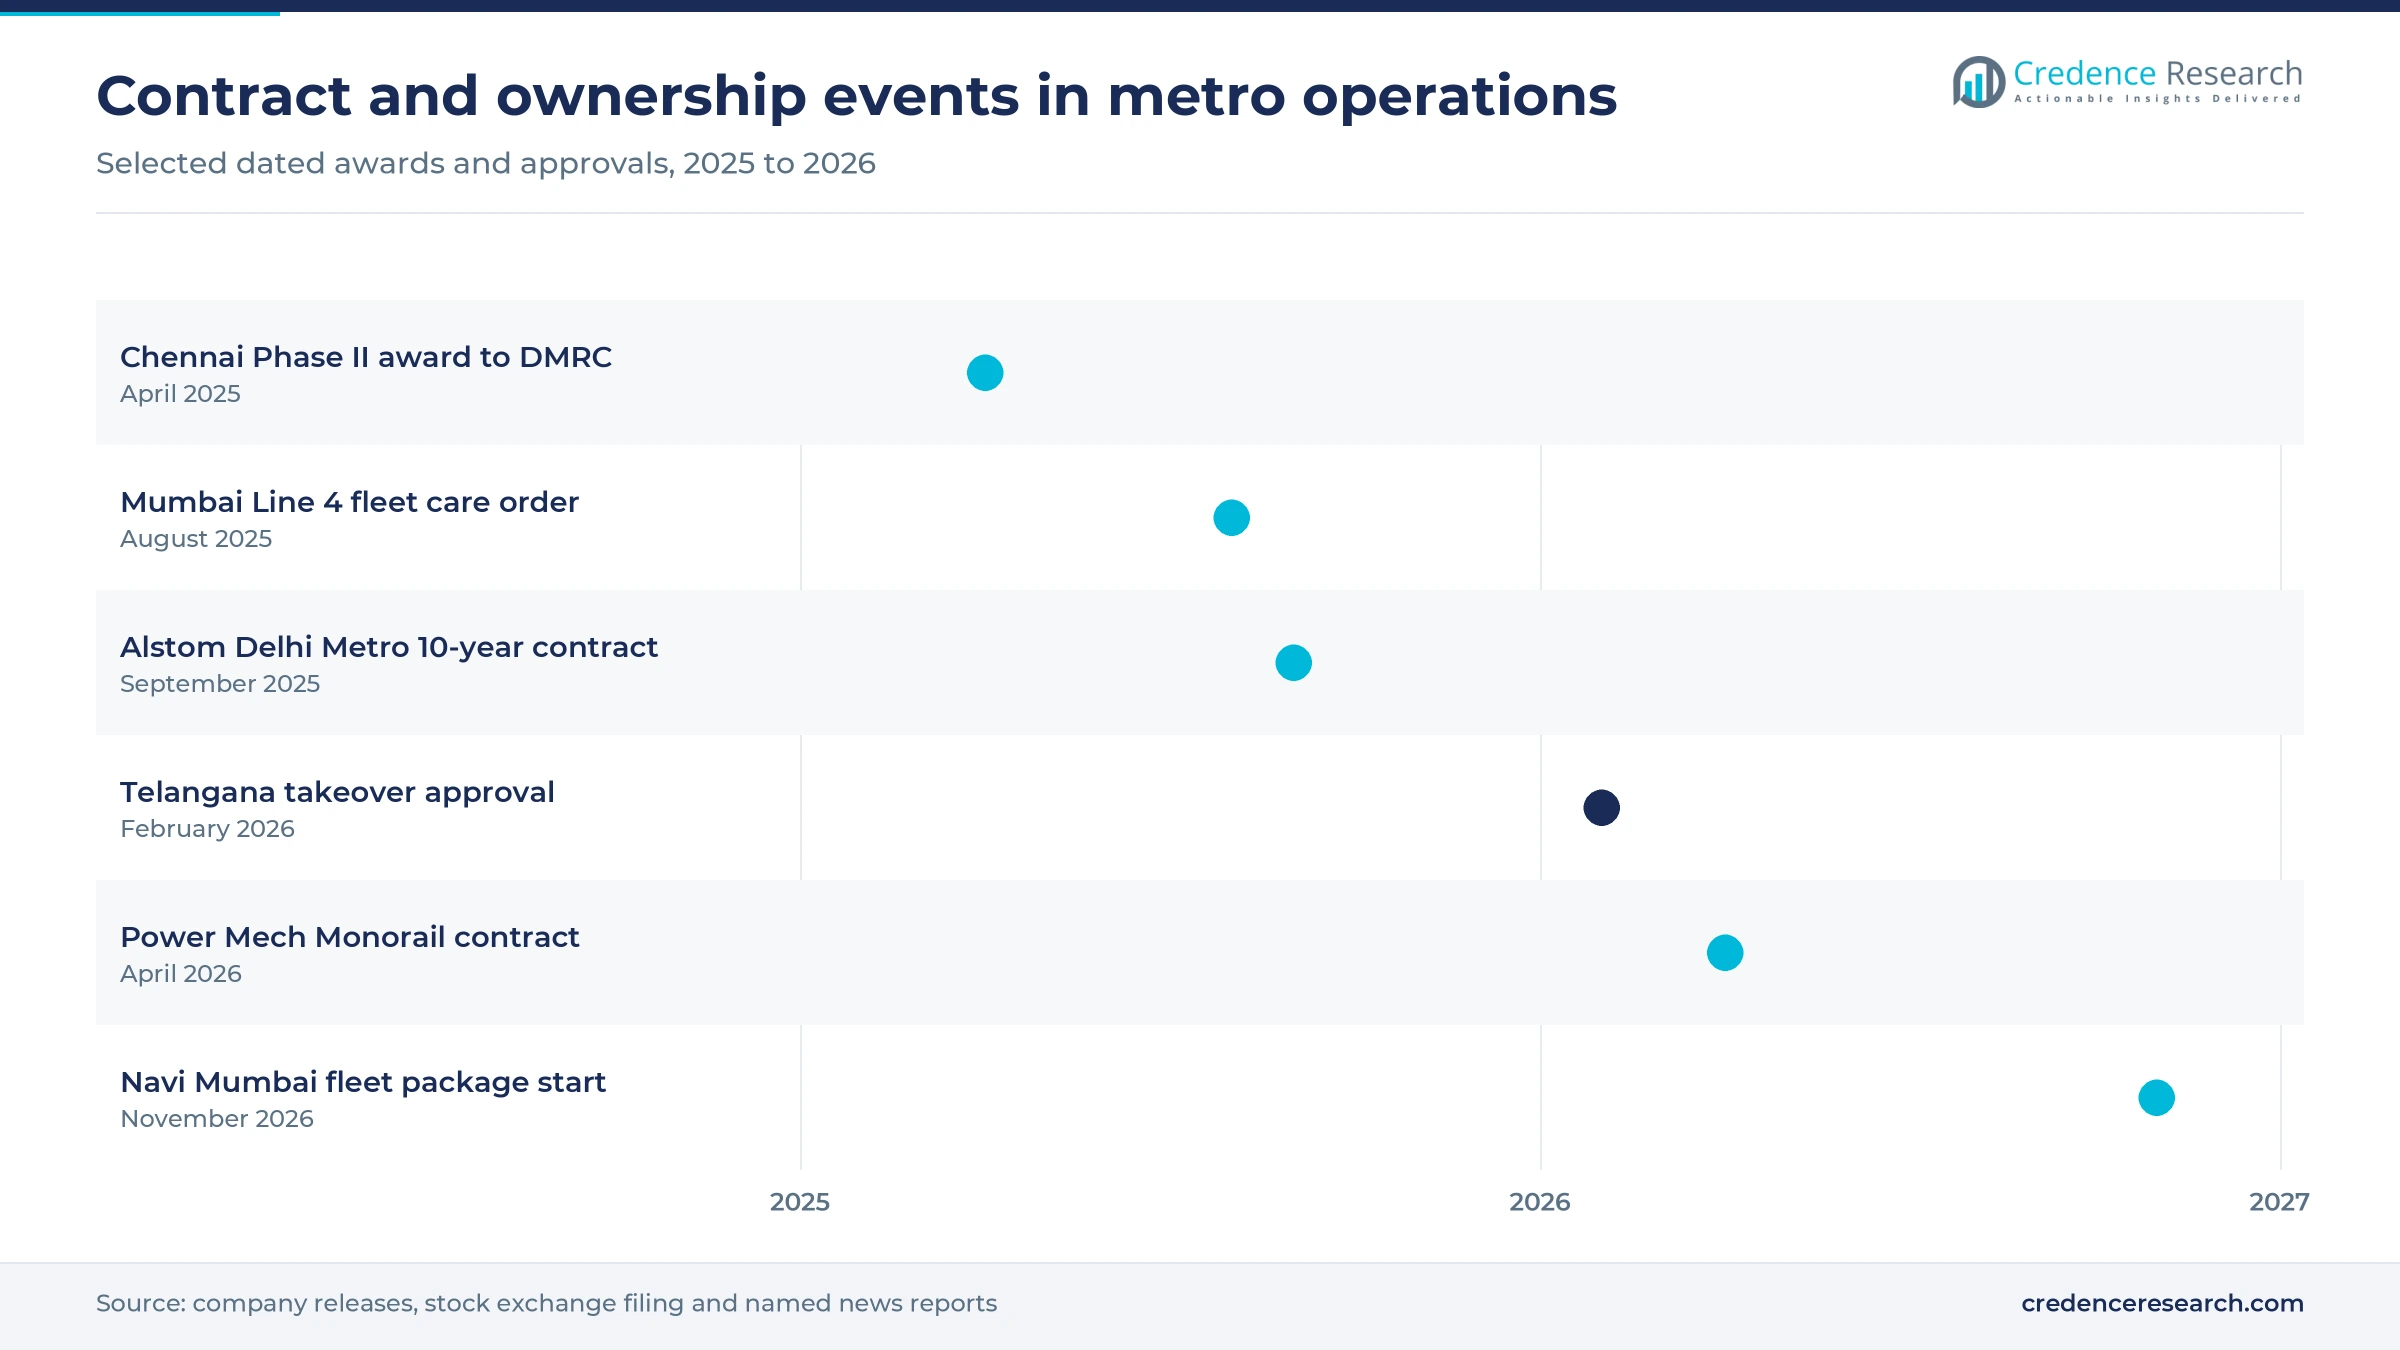
A public operator has become one of the main competitors for outsourced work, which is an unusual shift for the market. Railway Gazette reported that Delhi Metro Rail Corporation won a 10-year contract for Mumbai Line 3 in May 2023 as lowest bidder in an international tender. Construction World reported that it also took about 15 years of work in Chennai, covering 112 stations and three depots after the April 2025 award. India Infrastructure put the value of that award at Rs 58.7 billion. DT Next reported in April 2025 that Delhi Metro invited its own officials to staff the Chennai team. As a result, global operators now compete with a domestic rival that has deep local staff and depot experience.
Shift toward maker-led lifecycle bundles
Train and signaling makers increasingly sell maintenance with the original order, which shrinks the work left for later tenders. Alstom agreed to supply 52 trainsets to Madhya Pradesh with 15 years of train maintenance and seven years of signaling and telecom maintenance, and it marked the next Indore phase on Sept. 7, 2026. Its August 2025 Mumbai Line 4 order adds five years of fleet care and communications-based train control upkeep. Keolis, meanwhile, operates a Pune line whose 22 trains come from Alstom. In response, independent operators are likely to focus on station, depot and integration work, while makers keep the highest-value technical packages.
Opening in mid-life fleet refurbishment
The oldest Delhi trains now need major work, which opens a higher-value line of business beyond routine upkeep. Construction World reported on April 17, 2026, that Delhi Metro is upgrading 70 Red and Blue Line trains inducted between 2002 and 2007. It said 31 trains were complete, and the 22-train third phase runs to November 2027. The scope covers electrical panels, jumper cables, passenger information, CCTV and fire sensors in each coach. Mumbai Line 1 entered service in 2014, about a decade later, so similar programs should follow as newer fleets age. Contractors with overhaul shops and component approvals can therefore sell refurbishment as a separate package, which supports the growth of Rolling Stock Maintenance at 9.18% a year.
Opening in unbundled station packages
Station work is being split into smaller packages, which lets mid-size firms enter a market once closed to them. Rail Analysis reported in May 2025 that Greatwall Corporate Services won a three-year, Rs 55.14 crore Pune Line 2 package that covers cleaning, ticketing staff and security at 15 stations. Krystal Integrated secured a Rs 6.58 crore Mumbai Monorail housekeeping contract in September 2026, according to Sahi. These awards resemble wider facility management contracts, yet they demand safety training specific to metros. India Infrastructure argued in March 2023 that shorter networks in Tier II cities could gain from private operators, which leaves room for firms that can scale across several smaller systems.
Fare limits, theft and thin ridership test budgets
Fare limits squeeze maintenance budgets
Fare revisions are infrequent and contested, which leaves corporations short of funds for upkeep. Delhi Metro raised fares by Rs 1 to Rs 4 on Aug. 25, 2025, its first revision in nearly eight years, and PTI said train refurbishment and salaries were among its reasons. OneIndia, citing Deccan Herald, reported in February 2025 that Bengaluru maintenance and administration costs had risen 366% since 2017. Contractors therefore face tight pricing, so indexation clauses matter in long bids.
Cable theft disrupts signaling and service
Theft creates unplanned repair work that routine maintenance budgets rarely anticipate. The Tribune reported in March 2025 that Delhi Metro had recorded 89 cable theft cases since June 2024, including 35 traction cables and 32 signaling cables. One Red Line incident limited trains to 25 km per hour and caused delays across the corridor until afternoon. Delhi Metro has responded with concrete casing, anti-theft clamps, drones and CCTV, which adds security cost to its maintenance plans.
Thin ridership weakens contract affordability
Weak passenger numbers reduce the fare income that normally pays for operations, especially on newer lines. IndraStra reported in April 2026 that ridership reached 15.2% of projections in Hyderabad, 14.5% in Kochi and 8.6% in Lucknow. Smaller corporations therefore carry fixed staff and maintenance costs against limited income, and Kochi spent Rs 145.29 crore on metro operations in 2023-24. Contractors may need payment guarantees, while corporations are likely to seek lower staffing per station.
Ownership and contract changes add transition risk
Changes of owner or operator can interrupt planning, staffing and spare parts supply on a working line. Telangana approved taking over Hyderabad Phase 1 on Feb. 23, 2026, then signed a share purchase at Rs 1,461.47 crore, according to Deccan Herald. Keolis said in June 2025 that its contract there runs only until November 2026. Handover terms therefore matter greatly, and buyers need clear asset records, staff transfer rules and a defined mobilization period before a new contractor starts.
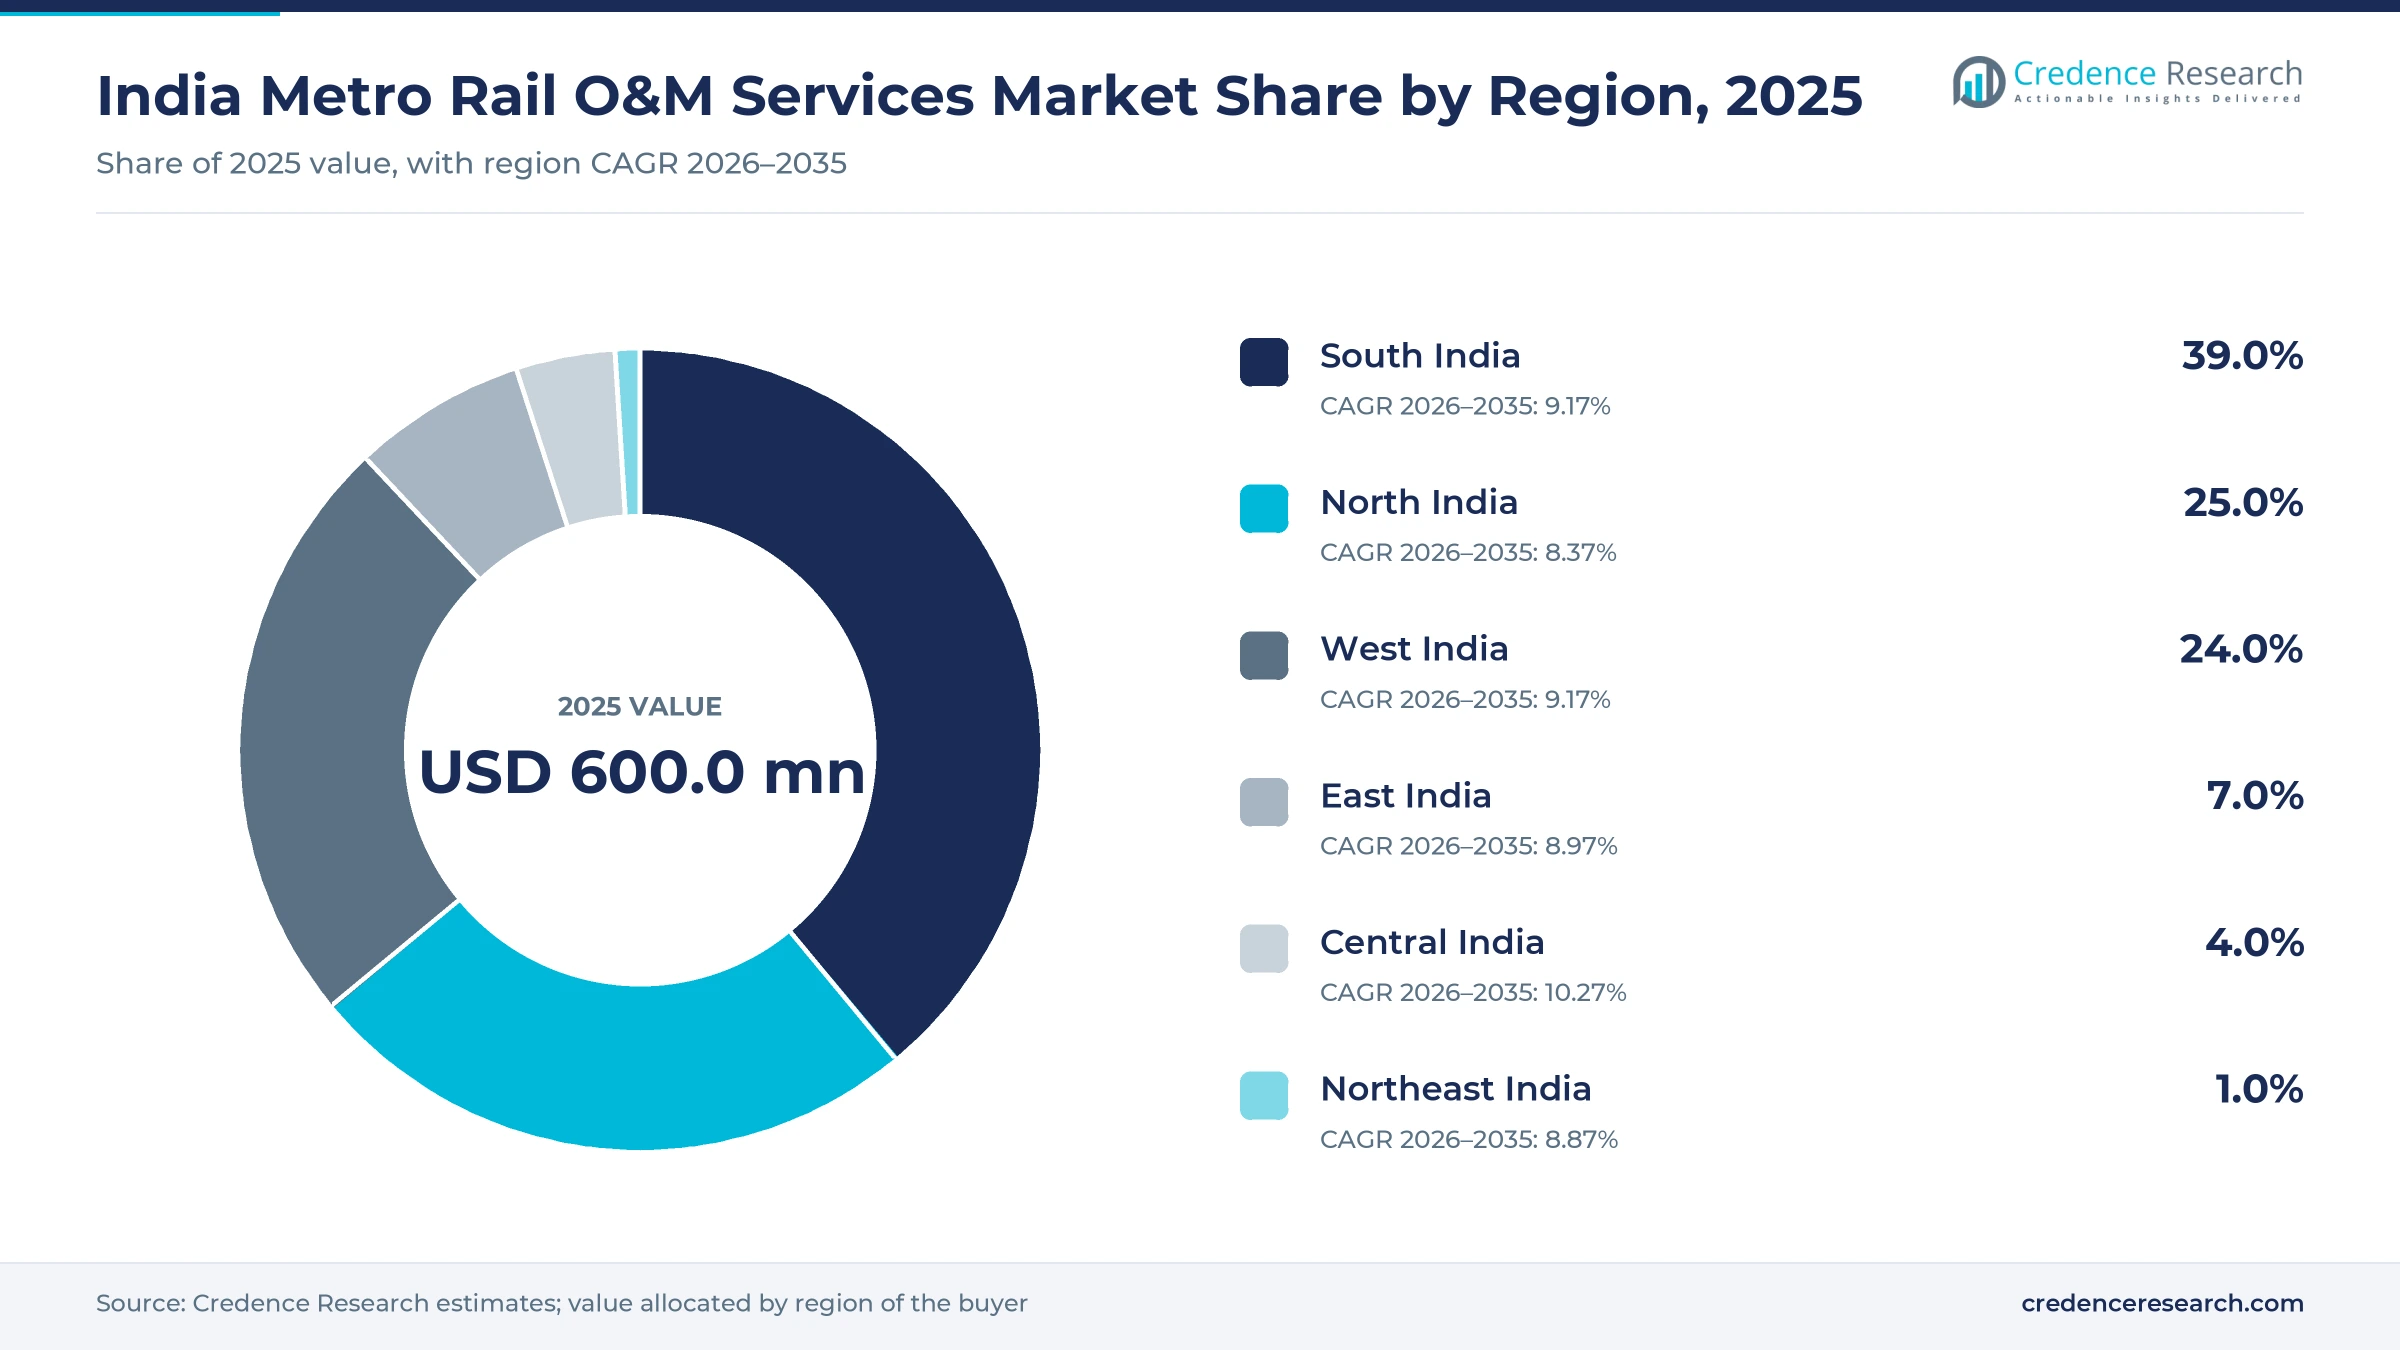
South India leads as Central India builds from a small base
| Region | Value, 2025 (USD million) | Share, 2025 | CAGR, 2026–2035 |
|---|---|---|---|
| South India | 234.0 | 39.0% | 9.17% |
| North India | 150.0 | 25.0% | 8.37% |
| West India | 144.0 | 24.0% | 9.17% |
| East India | 42.0 | 7.0% | 8.97% |
| Central India | 24.0 | 4.0% | 10.27% |
| Northeast India | 6.0 | 1.0% | 8.87% |
South India leads on four established networks
South India held 39.0% of 2025 value and grows at 9.17% a year. Metro Rail Today reported a December 2025 Lok Sabha reply listing 96.1 km in Karnataka, 69 km in Telangana, 54.1 km in Tamil Nadu and 28.48 km in Kerala. Chennai adds the strongest contract pipeline, because about 118.9 km of Phase II work is staged through December 2028. Bengaluru also plans 175.55 km by 2027, which keeps demand for train crews and depot staff high across the zone.
North India rests on the Delhi network
North India held 25.0% of 2025 value and grows at 8.37% a year, slower than the country because its network is already mature. India Infrastructure reported in November 2025 that Delhi NCR had about 450 km in service. Its largest near-term work is fleet renewal, including the 70-train Delhi Metro program. New openings continue as well, since Delhi Phase IV stretches opened in March 2026 and the 23.6 km Partapur-Modipuram stretch of Meerut Metro opened in February 2026.
West India gains from Mumbai and Pune awards
West India held 24.0% of 2025 value and grows at 9.17% a year. India Infrastructure reported in November 2025 that Maharashtra had over 170 km in service, and Mumbai Line 3 alone spans 33.5 km and 27 stations. Contract activity is unusually dense here, covering Line 3, Pune Line 3, the Monorail and Navi Mumbai fleet upkeep. Gujarat adds later demand, because the Public Investment Board cleared 60 km of Ahmedabad Phase III in August 2026.
East India grows around the Kolkata network
East India held 7.0% of 2025 value and grows at 8.97% a year. Metro Railway Kolkata runs most of the zone's service with its own organization, and Swarajya reported a network of about 72 km in October 2025, with 19 km more planned by the end of 2026. Patna adds a new buyer after its inauguration on Oct. 6, 2025, and an Egis-led joint venture was named preferred general consultant for its 30.91 km first phase in April 2025.
Central India builds from a small base
Central India held 4.0% of 2025 value and is the fastest-growing zone at 10.27% a year, because its systems are only now entering service. Alstom marked the next Indore Yellow Line phase on Sept. 7, 2026, with 16.72 km of operating mainline and 16 stations. Long maintenance terms give the zone unusual visibility, since Madhya Pradesh Metro has 15 years of fleet care agreed for 52 trainsets serving Bhopal and Indore.
Northeast India remains at the study stage
Northeast India held 1.0% of 2025 value and grows at 8.87% a year in the Credence Research model, and no operating metro line in the zone could be identified. The share is therefore a modeled allowance for future services rather than current running costs, which makes it the least certain regional estimate. Assam's Budget in July 2026 proposed a feasibility study for a metro along the planned 121 km Guwahati Ring Road, according to Swarajya, so operating demand remains distant.
Long contracts and ownership changes mark 2025 and 2026
| Development | Status and market relevance |
|---|---|
| In September 2026, Alstom marked the start of revenue operations on the next Indore Yellow Line phase, with 16.72 km of mainline and 16 stations in operation. | Operating, with 15 years of train maintenance agreed |
| In April 2026, Power Mech Projects announced a five-year, Rs 296 crore contract from MMMOCL to operate and maintain the 19.54 km Mumbai Monorail and 17 stations. | Awarded, covers new trains and upgraded signaling |
| In February 2026, the Telangana Cabinet approved taking over Hyderabad Metro Phase 1 from Larsen & Toubro, which moved a 69 km network toward state control. | Share purchase agreement later signed |
| In September 2025, Alstom secured a 10-year, EUR 42.1 million contract from Delhi Metro covering maintenance on Lines 1 and 2 and onboard signaling support for 103 trains. | Running, uses predictive analytics |
| In April 2025, Chennai Metro awarded Delhi Metro Rail Corporation the Phase II operating package, covering about 118.9 km and 112 stations across three corridors. | Staged through December 2028 |
Diagnostics and automated signaling change maintenance work
- Wheel profile measurement uses trackside lasers and cameras at Mumbai Charkop depot, and PTI cited accuracy of about 0.5 mm for wheel profile.
- Train-borne diagnostics support predictive maintenance planning, and Alstom says its Delhi contract applies analytics to prevent failures before they reduce availability.
- Automated train control reduces O&M costs and reliance on makers, according to a July 2022 India Infrastructure review of signaling on Indian metro lines.
- Driverless operation has run on the 37 km Magenta Line since 2020, according to Railway Gazette, which moves staff from the cab to supervision and rapid fault response.
Need a Custom Version of This Report?
Tailor the scope, geography, or segments to your exact requirements.
- Custom geography or segment scope
- Direct access to our analyst team
Public operators, global firms and makers share the field
Competition for O&M services divides into four groups that often meet on the same line. Public operators are led by Delhi Metro Rail Corporation, which runs its own network and now holds contracts in Mumbai and Chennai. International operators include Keolis, active in Hyderabad and Pune, and RATP Dev, whose joint venture with Transdev held 5% of Mumbai Line 1 operator Metro One Operation, according to NBM&CW. Equipment makers compete through lifecycle agreements, and Alstom is the clearest example with contracts in Delhi, Mumbai, Bhopal and Indore. Hitachi supplied train control and telecom systems for the 29.7 km Noida line, along with staff training and maintenance manuals. Siemens takes part through the Tata-Siemens concession on Pune Line 3. Domestic contractors such as Power Mech Projects, Greatwall Corporate Services and Krystal Integrated compete mainly on price and labor management. Buyers usually select on international tenders, so reference lines and local depot experience strongly influence who qualifies.
Companies profiled and their roles in this market
| Company | Type | Role in the market |
|---|---|---|
| Delhi Metro Rail Corporation (DMRC) | Public operator | Runs Delhi lines and holds Mumbai Line 3 and Chennai Phase II contracts |
| Keolis | International operator | Operates Hyderabad to November 2026 and holds a 10-year Pune Line 3 contract |
| RATP Dev | International operator | Joint venture with Transdev reported as a 5% holder in the Line 1 operator |
| Alstom | Maker and maintainer | Delhi 10-year contract, Mumbai Line 4 and Bhopal and Indore fleet care |
| Siemens | Concession partner | Member of the Tata-Siemens consortium holding the Pune Line 3 concession |
| Hitachi | Signaling supplier | Train control, telecom, training and manuals for the Noida line |
Contract discipline will matter more than network length
Credence Research's view is that contract discipline in O&M services will matter more than network length over the next decade. Long packages expose bidders to wage inflation, ridership shortfalls and aging fleets, and the Chennai package alone runs about 15 years. Delhi Metro's move into other cities shows that local depot experience is a real advantage, while Alstom's agreements show that makers can lock in technical work early. Buyers should separate fleet, systems and station risks clearly in their tenders. Bidders should price indexation carefully and build diagnostic data rights into contracts, because that data will decide who can defend margins at renewal.
How Credence Research built this market estimate
The report uses 2025 as the base year and 2035 as the forecast year, with market values from the Credence Research model. Scope, contract, city and regional splits are Credence Research estimates informed by network length, contract awards and published operator costs. Sources include stock exchange filings, company releases, operator annual reports, parliamentary replies reported by trade media, World Bank publications and named news reports. No interviews or surveys were conducted for this edition, and contract values describe individual awards rather than annual market revenue.
Delivery of the 998 km pipeline sets the pace to 2035
Spending on O&M services should reach USD 1.43 billion by 2035 if the 998 km under construction opens broadly on schedule, which would nearly double the network now running. Outsourced work is likely to gain share at 10.37% a year as newer corporations avoid building large in-house teams, while Delhi and other mature networks shift toward refurbishment. Bengaluru, Chennai and Mumbai should provide the largest additions in the near term. The main risk is slower ridership on new lines, because weak income could delay awards or shorten contract terms. Fare policy and the handling of Hyderabad's transition are the next signals that buyers and bidders should watch.
Frequently Asked Questions
How big is the India metro rail O&M services market?
How fast is the market growing?
Which scope segment is the largest?
Is metro maintenance in India mostly outsourced?
Which region leads the market?
Which region grows fastest?
Which companies are active in this market?
What is the main challenge for contractors?
Table of Content
Chapter 1 Market Segmentation
- 1.1 Segmentation Framework
- 1.1.1 Product and Service Classification
- 1.1.2 Application and End-Use Classification
- 1.1.3 Technology and Solution Classification
- 1.1.4 Customer and Distribution Channel Classification
- 1.1.5 Geographic Segmentation
- 1.1.6 Market Segment Definitions and Boundaries
- 1.2 By Scope
- 1.2.1 Rolling Stock Maintenance
- 1.2.2 Track & Systems
- 1.2.3 Station Operations
- 1.3 By Contract
- 1.3.1 In-House
- 1.3.2 Outsourced
- 1.4 By City
- 1.4.1 Delhi
- 1.4.2 Mumbai
- 1.4.3 Bengaluru
- 1.4.4 Hyderabad
- 1.4.5 Others
Chapter 2 Introduction
- 2.1 Report Objectives and Scope
- 2.2 Product Definition and Industry Terminology
- 2.3 Market Inclusions and Exclusions
- 2.4 Research Process
- 2.4.1 Primary Research and Expert Interviews
- 2.4.2 Secondary Research and Source Review
- 2.4.3 Top-Down and Bottom-Up Estimation
- 2.4.4 Data Triangulation and Verification
- 2.5 Market Size Measurement Basis
- 2.5.1 2025: USD 600.0 million → 2035: USD 1.43 billion
- 2.6 Historical and Forecast Reference Periods
- 2.6.1 Historical Period: 2018-2025
- 2.6.2 Base Year: 2025
- 2.6.3 Forecast Period: 2025-2035
- 2.7 Research Assumptions and Limitations
Chapter 3 Executive Summary
- 3.1 Market Snapshot and Key Findings
- 3.2 Base-Year Market Size, 2025
- 3.3 Forecast Market Size, 2035
- 3.4 Revenue and Volume Growth Outlook
- 3.5 Key Demand and Supply Indicators
- 3.6 Leading Market Segments
- 3.7 Fastest-Growing Market Opportunities
- 3.8 Regional Performance Highlights
- 3.9 Technology and Industry Transformation
- 3.10 Competitive Landscape Summary
- 3.11 Analyst View and Strategic Implications
Chapter 4 India Metro Rail O&M Services Market Trends and Developments
- 4.1 Historical Industry Development, 2018-2025
- 4.2 Recent Market Trends and Developments
- 4.3 Demand and Customer Behavior Trends
- 4.4 Technology and Product Innovation
- 4.5 Artificial Intelligence, Automation and Digitalization
- 4.6 Local Manufacturing and Supply Chain Realignment
- 4.7 Industry Partnerships, Mergers and Acquisitions
- 4.8 Sustainability and Circular Economy Developments
- 4.9 Government and Private Sector Investment Trends
- 4.10 Emerging Business Models and Commercialization
- 4.11 Industry Developments and Announcements
Chapter 5 India Metro Rail O&M Services Market Supply and Demand Analysis
- 5.1 Demand Trend and Consumption Analysis, 2018-2025
- 5.2 Demand Forecast, 2025-2035
- 5.3 Supply Chain Structure and Procurement Trends
- 5.4 Supply-Demand Gap and Bottlenecks
- 5.5 Import Dependence and Sourcing Structure
- 5.6 Regional Supply and Demand Concentration
Chapter 6 India Metro Rail O&M Services Market Pricing Analysis
- 6.1 Pricing Structure and Measurement
- 6.2 Historical Pricing Trends, 2018-2025
- 6.3 Pricing Outlook, 2025-2035
- 6.4 Pricing by Product and Market Segment
- 6.5 Geographic Pricing Differences
- 6.6 Key Input, Energy, Labor and Logistics Costs
- 6.7 Contract Pricing and Purchasing Models
- 6.8 Pricing Sensitivity and Competitive Positioning
- 6.9 Price, Margin and Profitability Implications
Chapter 7 India Metro Rail O&M Services Market Dynamics
- 7.1 Market Growth Drivers
- 7.1.1 Demand-Side Drivers
- 7.1.2 Technology and Innovation Drivers
- 7.1.3 Infrastructure and Investment Drivers
- 7.1.4 Regulatory and Policy Drivers
- 7.2 Market Restraints
- 7.2.1 Cost and Affordability Constraints
- 7.2.2 Technology and Adoption Barriers
- 7.2.3 Supply Chain and Operational Constraints
- 7.3 Market Challenges
- 7.3.1 Competitive Pressure and Margin Erosion
- 7.3.2 Skills, Infrastructure and Implementation Gaps
- 7.4 Emerging Market Opportunities
- 7.5 Market Dynamics Impact and Time-Horizon Assessment
Chapter 8 India Metro Rail O&M Services Value Chain Analysis
- 8.1 Industry Value Chain Overview
- 8.2 Upstream Suppliers and Critical Inputs
- 8.3 Technology and Component Providers
- 8.4 Manufacturing or Service Delivery
- 8.5 Distribution, Channel Partners and Integrators
- 8.6 Downstream Applications and End Users
- 8.7 Value Addition and Profit Pools
- 8.8 Vertical Integration and Outsourcing
- 8.9 Supplier Concentration and Risk
- 8.10 Supply Chain Localization and Resilience
Chapter 9 India Metro Rail O&M Services Market Regulations and Policies
- 9.1 Relevant Laws, Standards and Compliance Frameworks
- 9.2 Product, Service, Safety and Quality Requirements
- 9.3 Government Policies, Incentives and Subsidies
- 9.4 Imports, Exports and Trade Barriers
- 9.5 Public Procurement and Local Content Requirements
- 9.6 Data Protection, AI and Cybersecurity Compliance
- 9.7 Upcoming Policy Changes and Market Implications
Chapter 10 India Metro Rail O&M Services Market Hotspots and Opportunities
- 10.1 Market Opportunity Mapping and Growth Hotspots
- 10.2 High-Growth Applications and Customer Groups
- 10.3 Underserved Markets and White-Space Opportunities
- 10.4 Emerging Technology and Product Opportunities
- 10.5 New Capacity and Investment Hotspots
- 10.6 Market Entry and Expansion Opportunities
- 10.7 Distribution and Partnership Opportunities
- 10.8 Near-Term and Long-Term Commercial Potential
- 10.9 Opportunity Attractiveness and Execution Risks
Chapter 11 India Metro Rail O&M Services Market Outlook, 2025-2035
- 11.1 Market Size and Analysis
- 11.1.1 Revenue (Market Measurement: 2025: USD 600.0 million → 2035: USD 1.43 billion)
- 11.1.2 Historical Market Size, 2018-2025
- 11.1.3 Base-Year Market Size, 2025
- 11.2 Market Forecast, 2025-2035
- 11.2.1 Revenue Forecast to 2035
- 11.2.2 CAGR and Year-on-Year Growth
- 11.2.3 Incremental Revenue Opportunity
- 11.3 Forecast Assumptions and Scenario Analysis
- 11.3.1 Base-Case Forecast
- 11.3.2 Optimistic and Conservative Scenarios
- 11.3.3 Technology, Pricing and Policy Sensitivities
- 11.4 Market Attractiveness and Growth Outlook
Chapter 12 India Metro Rail O&M Services Market Segmentation and Outlook
- 12.1 Segmentation Summary and Market Shares, 2025
- 12.2 Largest and Fastest-Growing Segments
- 12.3 By Scope - Market Size and Forecast, 2025-2035
- 12.3.1 Segment Definition and Scope
- 12.3.2 Historical Market Size, 2018-2025
- 12.3.3 Revenue Forecast, 2025-2035
- 12.3.4 Base-Year Market Share, 2025
- 12.3.5 Segment CAGR and Growth Drivers
- 12.3.6 Subsegment Market Size and Forecast
- 12.3.6.1 Rolling Stock Maintenance
- 12.3.6.2 Track & Systems
- 12.3.6.3 Station Operations
- 12.3.7 Subsegment Pricing and Adoption Trends
- 12.3.8 Leading Suppliers and Competition
- 12.3.9 Regional Demand and Opportunities
- 12.4 By Contract - Market Size and Forecast, 2025-2035
- 12.4.1 Segment Definition and Scope
- 12.4.2 Historical Market Size, 2018-2025
- 12.4.3 Revenue Forecast, 2025-2035
- 12.4.4 Base-Year Market Share, 2025
- 12.4.5 Segment CAGR and Growth Drivers
- 12.4.6 Subsegment Market Size and Forecast
- 12.4.6.1 In-House
- 12.4.6.2 Outsourced
- 12.4.7 Subsegment Pricing and Adoption Trends
- 12.4.8 Leading Suppliers and Competition
- 12.4.9 Regional Demand and Opportunities
- 12.5 By City - Market Size and Forecast, 2025-2035
- 12.5.1 Segment Definition and Scope
- 12.5.2 Historical Market Size, 2018-2025
- 12.5.3 Revenue Forecast, 2025-2035
- 12.5.4 Base-Year Market Share, 2025
- 12.5.5 Segment CAGR and Growth Drivers
- 12.5.6 Subsegment Market Size and Forecast
- 12.5.6.1 Delhi
- 12.5.6.2 Mumbai
- 12.5.6.3 Bengaluru
- 12.5.6.4 Hyderabad
- 12.5.6.5 Others
- 12.5.7 Subsegment Pricing and Adoption Trends
- 12.5.8 Leading Suppliers and Competition
- 12.5.9 Regional Demand and Opportunities
- 12.6 Segment Growth Comparison
- 12.7 Segment Attractiveness and Priority Matrix
Chapter 13 India Metro Rail O&M Services Geographic Market Outlook, 2025-2035
- 13.1 Domestic Market Distribution and Demand Clusters
- 13.2 State- or Province-Wise Market Size and Forecast, 2025-2035
- 13.3 City and Metropolitan Market Outlook
- 13.4 Industrial, Manufacturing and Commercial Clusters
- 13.5 Geographic Concentration of Key End Users
- 13.6 Local Pricing and Purchasing Differences
- 13.7 Domestic Production Facilities and Capacity Map
- 13.8 Local Infrastructure and Project Pipeline
- 13.9 State-Level Policy and Incentive Differences
- 13.10 Subnational Investment Hotspots and Opportunities
- 13.11 Distribution and Logistics Networks
- 13.12 Domestic Competitive Footprint
Chapter 14 India Metro Rail O&M Services Technology, Innovation and Sustainability Outlook
- 14.1 Technology Landscape and Maturity
- 14.2 Product, Process and Service Innovation
- 14.3 AI, Automation and Digital Tools in the Industry
- 14.4 Technology Adoption and Performance Benchmarking
- 14.5 Innovation Pipeline and R&D Investment
- 14.6 Energy Efficiency and Resource Management
- 14.7 Sustainability, Recycling and Circularity
- 14.8 Technology Roadmap, 2025-2035
- 14.9 Risks of Obsolescence and Technology Substitution
Chapter 15 India Metro Rail O&M Services Market Key Strategic Imperatives
- 15.1 Growth and Market Entry Priorities
- 15.2 High-Return Products and Segments
- 15.3 Pricing, Profitability and Cost Optimization
- 15.4 Technology Investment and Product Differentiation
- 15.5 Supply Chain Localization and Resilience
- 15.6 Distribution and Customer Acquisition
- 15.7 Partnership, Acquisition and Capacity Strategy
- 15.8 Regional Expansion Priorities
- 15.9 Short-, Medium- and Long-Term Actions
Chapter 16 Competition Outlook
- 16.1 Industry Competition Characteristics
- 16.2 Market Structure and Concentration
- 16.3 Market Share and Competitive Positioning, 2025
- 16.4 Company-Wise Revenue and Product Benchmarking
- 16.5 Production and Service Capacity Benchmarking
- 16.6 Technology, Pricing and Differentiation
- 16.7 Regional Footprint and Distribution Strength
- 16.8 Mergers, Acquisitions and Strategic Alliances
- 16.9 New Entrants and Competitive Threats
- 16.10 Porter's Five Forces and Industry Attractiveness
- 16.11 Competitive Outlook, 2025-2035
Chapter 17 Company Profiles
- 17.1 Company Coverage and Selection Criteria
- 17.2 DMRC
- 17.2.1 Business Description
- 17.2.2 Company Ownership and Geographic Presence
- 17.2.3 Product and Service Portfolio
- 17.2.4 Manufacturing and Operating Footprint
- 17.2.5 Financial Performance and Investment
- 17.2.6 Market Share and Competitive Position
- 17.2.7 Technology and Innovation Capabilities
- 17.2.8 Strategic Alliances or Partnerships
- 17.2.9 Recent Developments
- 17.2.10 Growth Strategy and Outlook
- 17.3 Keolis Hyderabad
- 17.4 RATP Dev
- 17.5 Alstom
- 17.6 Siemens Mobility
- 17.7 Hitachi Rail
- 17.8 Other Relevant Market Participants
Note: Every listed company is profiled on the structure shown under the first company. The company list is preliminary and may change based on research findings, market developments, data availability and client requirements.
Chapter 18 Disclaimer
- 18.1 Research and Forecast Disclaimer
- 18.2 Data Source and Estimation Limitations
Note: The depth of individual sections depends on data availability for this market. Volume, capacity, trade and other unit-based metrics are included where applicable.

