
Guar Gum Powder Market Overview:
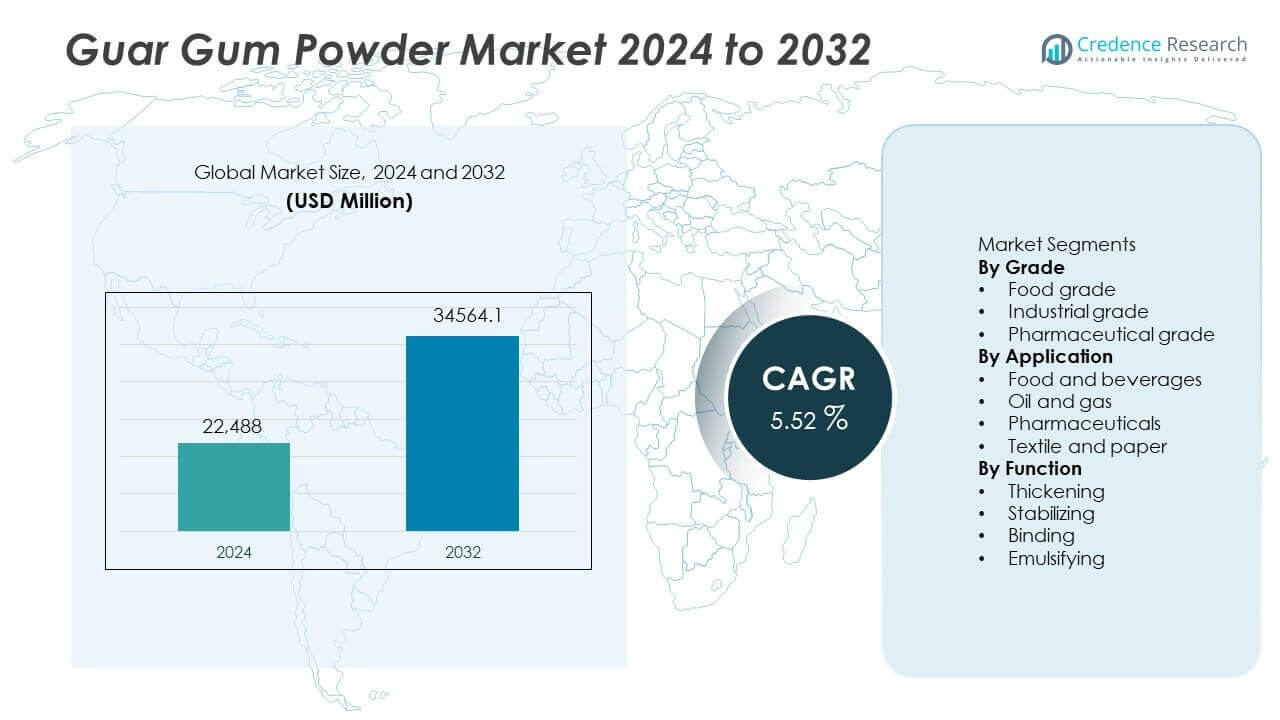
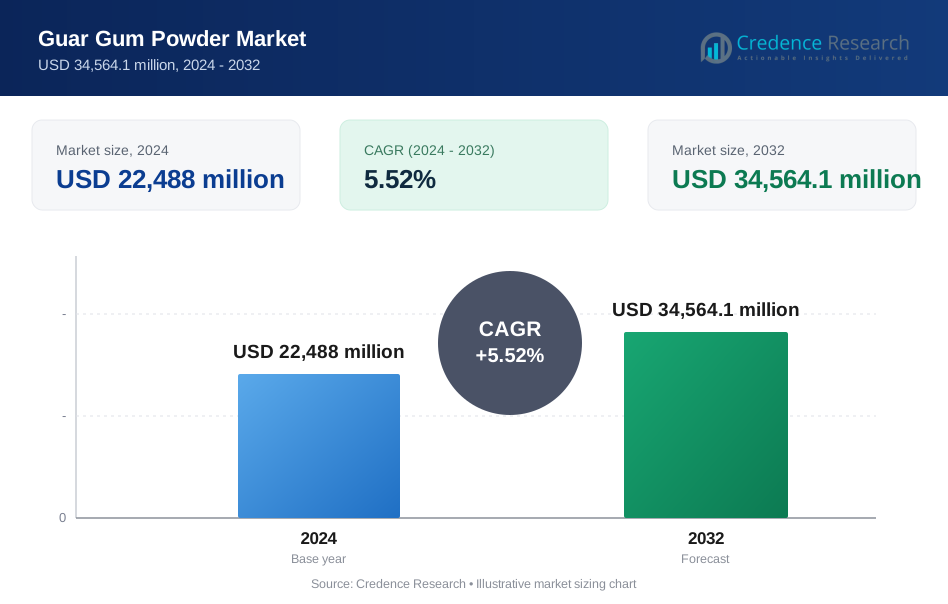
The guar gum powder market was valued at USD 22,488 million in 2024 and is anticipated to reach USD 34,564.1 million by 2032, registering a CAGR of 5.52% during the forecast period. (Credence Research)
| REPORT ATTRIBUTE | DETAILS |
|---|---|
| Historical Period | 2020-2023 |
| Base Year | 2024 |
| Forecast Period | 2025-2032 |
| Guar Gum Powder Market Size 2024 | USD 22,488 million |
| Guar Gum Powder Market, CAGR | 5.52% |
| Guar Gum Powder Market Size 2032 | USD 34,564.1 million |
The guar gum powder market is led by major players including Vikas WSP Limited, Jai Bharat Gum & Chemicals Ltd., Hindustan Gum & Chemicals Ltd., Ingredion Incorporated, Cargill, Incorporated, TIC Gums, Inc., Ashland Global Holdings Inc., DuPont Nutrition & Biosciences, Ruchi Soya Industries Ltd., and Lucid Group. These companies strengthen their positions through raw material sourcing control, food-grade processing capabilities, and strong export networks. Asia Pacific leads the market with a 34% share, supported by large-scale guar seed production and processing capacity in India. North America follows with a 29% share, driven by food processing demand and oil and gas applications. Europe holds a 24% share, supported by clean-label food trends and regulated ingredient usage.
Market Insights
- The guar gum powder market was valued at USD 22,488 million in 2024 and is projected to reach USD 34,564.1 million by 2032, registering a CAGR of 5.52% during the forecast period.
- Strong demand from food and beverages drives growth, with food grade guar gum leading grades at a 49% share due to use in bakery, dairy, and processed foods.
- Market trends show sustained use in oil and gas, while thickening remains the dominant function with a 52% share because of high viscosity performance at low dosage.
- Competition remains moderate, with key players focusing on sourcing stability, processing efficiency, and application-specific formulations to manage raw material volatility.
- Asia Pacific leads with a 34% share, followed by North America at 29% and Europe at 24%, supported by guar seed availability, food processing demand, and clean-label adoption.
Guar Gum Powder Market Segmentation Analysis:
By Grade
Food grade guar gum dominates the grade segment with a 49% market share. This dominance is driven by widespread use in processed foods, dairy products, and bakery formulations. Food manufacturers rely on guar gum for texture improvement and shelf-life stability. Rising demand for clean-label and plant-based ingredients supports food grade adoption. Regulatory approvals across major markets further strengthen usage. Industrial grade holds a 34% share, supported by large-scale consumption in oil and gas applications. Pharmaceutical grade accounts for the remaining share, driven by controlled formulations and excipient demand in drug manufacturing.
- For instance, Vikas WSP has historically supplied guar derivatives manufactured to meet industry standards for drilling fluids used in oil and gas wells.
By Application
Food and beverages lead the application segment with a 45% market share. Guar gum is widely used in sauces, ice creams, and gluten-free products. Growing consumption of convenience foods supports steady demand. Oil and gas holds a 32% share, driven by hydraulic fracturing and drilling fluid requirements. Guar gum improves viscosity and water retention in drilling operations. Pharmaceuticals account for a 13% share, supported by tablet binding and suspension formulations. Textile and paper applications represent niche demand for sizing and finishing processes.
- For instance, Halliburton-qualified guar systems were deployed in 2,000 fracturing stages during field operations.
By Function
Thickening represents the dominant functional segment with a 52% market share. Guar gum is preferred for its high viscosity at low concentrations. Food processors use it to enhance mouthfeel and consistency. Industrial users rely on thickening performance in drilling fluids. Stabilizing holds a 24% share, supporting emulsion stability in food and cosmetic products. Binding accounts for a 14% share, driven by pharmaceutical and processed food use. Emulsifying functions contribute the remaining demand, supported by multipurpose formulation requirements across industries.
Key Growth Drivers
Rising Demand from Food and Beverage Industry
The food and beverage industry remains a primary growth driver for the guar gum powder market. Guar gum is widely used as a thickener and stabilizer in processed foods. Demand increases from bakery, dairy, and convenience food segments. Clean-label and plant-based trends support ingredient adoption. Food manufacturers prefer guar gum for texture improvement and moisture retention. Growth in gluten-free and low-fat products further boosts usage. Expanding packaged food consumption in urban markets sustains demand. Regulatory approval across regions supports widespread food-grade application.
- For instance, Cargill validated guar gum performance across dairy and bakery formulations, achieving stable viscosity during processing cycles.
Strong Consumption in Oil and Gas Applications
Oil and gas applications significantly drive guar gum powder demand. Guar gum improves viscosity in hydraulic fracturing fluids. Shale gas exploration supports steady industrial consumption. Energy producers rely on guar-based polymers for efficient drilling performance. Rising energy demand supports upstream activity. Guar gum offers cost-effective rheology control. Industrial-grade guar benefits from large-volume contracts. Technological improvements enhance guar efficiency in drilling fluids. This application provides demand stability despite market cyclicality.
- For instance, Baker Hughes qualified guar-based polymer systems used across 1,250 fracturing stages, enabling consistent proppant suspension in wells exceeding 2,800-meter lateral lengths.
Growing Use in Pharmaceutical and Healthcare Products
Pharmaceutical applications contribute to market growth. Guar gum acts as a binder and disintegrant in tablets. Controlled drug release formulations benefit from guar properties. Demand rises for plant-based excipients. Healthcare manufacturers prefer natural polymers for safety. Increasing pharmaceutical production supports ingredient consumption. Regulatory acceptance strengthens guar gum adoption. Growth in generic drug manufacturing adds volume demand. Pharmaceutical-grade guar supports long-term market expansion.
Key Trends & Opportunities
Product Innovation and Value-Added Guar Derivatives
Manufacturers invest in modified guar products. Value-added derivatives improve functionality and performance. Enhanced solubility supports diverse applications. Food and industrial users demand customized solutions. Innovation improves temperature and pH stability. Modified guar expands use beyond traditional markets. Premium formulations create pricing opportunities. Product differentiation strengthens supplier competitiveness. Innovation-driven offerings open new growth avenues.
- For instance, Jai Bharat Gum & Chemicals continues to maintain advanced manufacturing infrastructure to support its distribution of guar splits and powder across global markets, including diverse international regions.
Expansion in Emerging Economies
Emerging markets present strong growth opportunities. Rising food processing activities increase guar usage. Energy exploration expands in developing regions. Pharmaceutical manufacturing grows with healthcare investments. Local sourcing improves supply efficiency. Increasing disposable income boosts processed food demand. Government support for industrial growth aids consumption. Emerging economies offer long-term volume expansion potential.
- For instance, Hindustan Gum & Chemicals expanded guar processing capacity by 18,000 metric tons annually to serve food and oilfield customers in Asia and the Middle East.
Key Challenges
Volatility in Guar Seed Prices
Guar seed price volatility challenges market stability. Agricultural dependency affects raw material availability. Weather conditions impact crop yields. Price fluctuations affect production costs. Manufacturers face margin pressure during supply shortages. Long-term contracts become difficult to manage. Small producers face higher risk exposure. Price instability influences end-product pricing strategies.
Dependence on Oil and Gas Industry Cycles
Market reliance on oil and gas creates demand uncertainty. Energy price fluctuations impact drilling activity. Reduced exploration lowers industrial guar consumption. Cyclical downturns affect volume stability. Manufacturers diversify applications to manage risk. Overdependence limits demand predictability. Industry cycles influence capacity utilization. Balancing sector exposure remains a key challenge.
Regional Analysis
North America
North America holds a 29% market share in the guar gum powder market, supported by strong demand from food processing and oil and gas industries. The United States leads regional consumption due to extensive use in hydraulic fracturing fluids. Food manufacturers also rely on guar gum for processed and gluten-free products. Pharmaceutical usage remains steady for excipient applications. Advanced supply chains ensure consistent availability. Regulatory approvals support food-grade applications. Industrial demand remains sensitive to energy activity levels. Continued focus on clean-label food ingredients sustains long-term regional demand growth.
Europe
Europe accounts for a 24% market share, driven by robust food and beverage manufacturing and rising clean-label adoption. Countries such as Germany, France, and the United Kingdom lead consumption. Guar gum is widely used in bakery, dairy, and convenience foods. Pharmaceutical applications support steady demand for binding and stabilizing functions. Limited oil and gas activity reduces industrial dependence. Strong food safety regulations ensure quality compliance. Rising demand for plant-based ingredients supports guar gum usage. Stable consumer preferences sustain consistent regional market growth.
Asia Pacific
Asia Pacific dominates the guar gum powder market with a 34% share, supported by large-scale production and consumption. India leads as the primary guar seed producer and exporter. China and Southeast Asia drive demand through expanding food processing industries. Rising population and urbanization boost packaged food consumption. Oil and gas applications support industrial-grade demand in select markets. Cost-effective manufacturing strengthens regional competitiveness. Expanding pharmaceutical production further supports consumption. Asia Pacific remains the key volume and supply hub for global markets.
Rest of the World
Rest of the World holds a 13% market share, supported by growing food processing and energy activities. Latin America shows rising demand for processed foods and beverages. The Middle East supports industrial usage through oil and gas operations. Africa records gradual growth driven by food applications. Import dependency remains high due to limited local production. Expanding distribution networks improve product availability. Government support for food security aids demand. Market growth remains steady with gradual industrial and food sector expansion.
Guar Gum Powder Market Segmentations:
By Grade
- Food grade
- Industrial grade
- Pharmaceutical grade
By Application
- Food and beverages
- Oil and gas
- Pharmaceuticals
- Textile and paper
By Function
- Thickening
- Stabilizing
- Binding
- Emulsifying
By Geography
- North America
- U.S.
- Canada
- Mexico
- Europe
- Germany
- France
- U.K.
- Italy
- Spain
- Rest of Europe
- Asia Pacific
- China
- Japan
- India
- South Korea
- South-east Asia
- Rest of Asia Pacific
- Latin America
- Brazil
- Argentina
- Rest of Latin America
- Middle East & Africa
- GCC Countries
- South Africa
- Rest of the Middle East and Africa
Competitive Landscape
Competitive landscape or analysis includes Vikas WSP Limited, Jai Bharat Gum & Chemicals Ltd., Hindustan Gum & Chemicals Ltd., Ingredion Incorporated, Cargill, Incorporated, TIC Gums, Inc., Ashland Global Holdings Inc., DuPont Nutrition & Biosciences, Ruchi Soya Industries Ltd., and Lucid Group. These players compete on product quality, supply reliability, and application-specific formulations. Market leaders focus on food-grade guar to serve clean-label and plant-based trends. Industrial-grade volumes depend on oil and gas activity cycles. Companies invest in processing efficiency to manage raw material volatility. Long-term contracts help stabilize pricing and supply. Product differentiation centers on viscosity control and hydration speed. Geographic reach and export strength remain critical advantages. Strategic partnerships with food processors and energy firms strengthen demand visibility. Overall competition reflects scale benefits, sourcing control, and consistent performance standards.
Key Player Analysis
- Vikas WSP Limited
- Jai Bharat Gum & Chemicals Ltd.
- Hindustan Gum & Chemicals Ltd.
- Ruchi Soya Industries Ltd.
- Ingredion Incorporated
- TIC Gums, Inc.
- Ashland Global Holdings Inc.
- Cargill, Incorporated
- DuPont Nutrition & Biosciences
- Lucid Group
Recent Developments
- In October 2025, Ashland Inc. entered into a strategic partnership with Tilley Distribution, appointing them as the exclusive U.S. distributor for its food and beverage ingredients.
- In 2023, Hindustan Gum & Chemicals Limited (HGCL) announced capacity expansion plans that shifted focus toward synthetic organic chemicals rather than increasing its core guar gum production capacity.
Report Coverage
The research report offers an in-depth analysis based on Grade, Application, Function and Geography. It details leading market players, providing an overview of their business, product offerings, investments, revenue streams, and key applications. Additionally, the report includes insights into the competitive environment, SWOT analysis, current market trends, as well as the primary drivers and constraints. Furthermore, it discusses various factors that have driven market expansion in recent years. The report also explores market dynamics, regulatory scenarios, and technological advancements that are shaping the industry. It assesses the impact of external factors and global economic changes on market growth. Lastly, it provides strategic recommendations for new entrants and established companies to navigate the complexities of the market.
Future Outlook
- Food and beverage applications will remain the primary demand driver.
- Clean-label and plant-based product trends will support steady consumption growth.
- Oil and gas usage will continue to influence industrial-grade demand cycles.
- Manufacturers will focus on improving processing efficiency and quality consistency.
- Modified guar products will gain wider adoption across food and industrial uses.
- Asia Pacific will retain its role as the key supply and production hub.
- Pharmaceutical applications will expand with rising generic drug production.
- Supply chain stability will remain a strategic priority for producers.
- Product diversification will reduce dependence on energy sector demand.
- Long-term demand will benefit from expanding global food processing activities.
Request a Free Sample
Fill in your details and we'll send you a free sample report.
- Sample data tables & charts
- Research methodology
Need a Custom Version of This Report?
Tailor the scope, geography, or segments to your exact requirements.
- Custom geography or segment scope
- Direct access to our analyst team
Frequently Asked Questions
What is the current market size for the Guar Gum Powder market, and what is its projected size in 2032?
At what Compound Annual Growth Rate is the Guar Gum Powder market projected to grow between 2024 and 2032?
Which Guar Gum Powder market segment held the largest share in 2024?
What are the primary factors fueling the growth of the Guar Gum Powder market?
Who are the leading companies in the Guar Gum Powder market?
Which region commanded the largest share of the Guar Gum Powder market in 2024?
Table of Content
Chapter 1. Report Introduction
- 1.1 Report Description & Purpose
- 1.1.1 Report Title & Market Definition
- 1.1.2 Unique Selling Propositions (USP) & Key Differentiators
- 1.1.3 Value Proposition for Stakeholders
- 1.2 Research Objectives
- 1.2.1 Market Sizing Objectives (Volume & Revenue) (Volume Where Applicable)
- 1.2.2 Segmentation Objectives
- 1.2.3 Competitive Intelligence Objectives
- 1.2.4 Forecast & Scenario Objectives
- 1.3 Report Scope
- 1.3.1 Guar Gum Powder Scope – Segments & Subsegments Covered
- 1.3.2 Geographic Scope – Regions & Countries Covered
- 1.3.3 Historical Period, Base Year & Forecast Period (2024; forecast to 2032)
- 1.3.4 Inclusions & Exclusions
- 1.4 Industry Classification & Applicable Codes
- 1.5 Currency, Measurement Units & Valuation Basis
- 1.6 Target Stakeholders
- 1.7 Limitations & Assumptions
Chapter 2. Executive Summary
- 2.1 Global Guar Gum Powder Market Snapshot
- 2.1.1 Market Size – Historical (2024) & Forecast (2024-2032) (2024: USD 22,488 million → 2032: USD 34,564.1 million)
- 2.1.2 Volume & Revenue – Global Totals (Volume Where Applicable)
- 2.1.3 Key Market Highlights – Top Five Facts
- 2.2 Guar Gum Powder Market Segmentation Snapshot
- 2.2.1 Market Split by Region – 2024 vs. 2032
- 2.3 Competitive Snapshot
- 2.3.1 Top 10 Players by Revenue Share – 2024
- 2.3.2 Top 10 Players by Volume Share – 2024 (Volume Where Applicable)
- 2.3.3 Recent Strategic Developments (18-Month Summary)
- 2.4 Key Investment Highlights & Strategic Conclusions
Chapter 3. Guar Gum Powder Market Dynamics & Industry Analysis
- 3.1 Market Overview & Context
- 3.1.1 Guar Gum Powder Market Position in the Broader Industry Value Chain
- 3.1.2 Demand Structure & Purchasing Dynamics
- 3.1.3 Market Maturity & Development Stage by Region
- 3.2 Guar Gum Powder Market Drivers
- 3.3 Guar Gum Powder Market Restraints & Challenges
- 3.4 Guar Gum Powder Market Opportunities
- 3.5 Porter's Five Forces Analysis
- 3.5.1 Threat of New Entrants
- 3.5.2 Bargaining Power of Suppliers
- 3.5.3 Bargaining Power of Buyers
- 3.5.4 Threat of Substitutes
- 3.5.5 Competitive Rivalry – Intensity Assessment
- 3.6 Guar Gum Powder Value Chain Analysis
- 3.6.1 Upstream – Key Inputs, Resources & Suppliers
- 3.6.1.1 Key Input/Resource 1
- 3.6.1.2 Key Input/Resource 2
- 3.6.1.3 Key Input/Resource 3
- 3.6.2 Midstream – Core Operations & Value Creation
- 3.6.2.1 Operating Model & Process Overview
- 3.6.2.2 Key Operating Locations & Capabilities by Company
- 3.6.3 Downstream – Market Channels & End Users
- 3.6.3.1 Direct Sales & Customer Engagement Channels
- 3.6.3.2 Indirect Sales, Intermediaries & Partner Channels
- 3.6.4 Value Chain Profitability Analysis
- 3.6.1 Upstream – Key Inputs, Resources & Suppliers
- 3.7 PESTEL Analysis
- 3.7.1 Political Factors
- 3.7.2 Economic Factors
- 3.7.3 Social Factors
- 3.7.4 Technological Factors
- 3.7.5 Environmental Factors
- 3.7.6 Legal Factors
- 3.8 Guar Gum Powder Supply Chain Analysis
- 3.8.1 Critical Input & Resource Availability Risk Assessment
- 3.8.2 Supplier & Operational Concentration Risk (Geographic Exposure)
- 3.8.3 Supply & Service Disruption Impact Analysis
- 3.9 Regulatory & Policy Landscape
Note: The regulatory and policy landscape section covers regulations based on their applicability to the market, Guar Gum Powder category, geography, and scope of the study. Only regulatory frameworks with a material impact on operations, compliance, trade, sustainability, or market access are analyzed in detail.
Chapter 4. Key Investment Pockets & Opportunity Analysis
- 4.1 Guar Gum Powder Market Attractiveness Analysis
- 4.1.1 By Region – Investment Attractiveness Matrix (Market Size × CAGR)
- 4.2 Absolute Revenue Growth Opportunity
- 4.2.1 By Region – Absolute Revenue Growth Through 2032
- 4.3 Incremental Demand Opportunity
- 4.3.1 By Region – Incremental Demand Through 2032
- 4.3.2 Segment – Incremental Demand
- 4.4 Emerging Submarket Opportunity Deep Dive (Subject to Applicability)
- 4.5 Priority Market Opportunity Scorecards
- 4.5.1 United States
- 4.5.2 Europe
- 4.5.3 Asia
- 4.5.4 Middle East & Africa
Note: Priority market opportunity scorecards reflect the geographic scope and strategic relevance of the study. Listed markets are indicative and may be adapted to the industry.
Chapter 5. Guar Gum Powder Cross-Border Trade & Market Access Analysis
- 5.1 International Trade & Cross-Border Activity Overview
- 5.1.1 Global Export Value by Country (2024)
- 5.1.2 Global Export Volume by Country (2024) (Volume Where Applicable)
- 5.1.3 Global Import Value by Country (2024)
- 5.1.4 Global Import Volume by Country (2024) (Volume Where Applicable)
- 5.1.5 Net Trade Balance by Country (2024)
- 5.2 Export Analysis – Segment
- 5.2.1 Category 1 (Applicable Classification Code)
- 5.2.2 Category 2 (Applicable Classification Code)
- 5.2.3 Category 3 (Applicable Classification Code)
- 5.2.4 Category 4 (Applicable Classification Code)
- 5.2.5 Category 5 (Applicable Classification Code)
- 5.3 Import Analysis – Segment
- 5.3.1 Category 1 (Applicable Classification Code)
- 5.3.2 Category 2 (Applicable Classification Code)
- 5.3.3 Category 3 (Applicable Classification Code)
- 5.3.4 Category 4 (Applicable Classification Code)
- 5.3.5 Category 5 (Applicable Classification Code)
- 5.4 Cross-Border Pricing & Transaction Benchmarks
- 5.4.1 Export Pricing – Segment & Country
- 5.4.2 Import Pricing – Segment & Source Country
- 5.4.3 Price Trends (2024)
- 5.5 Key Cross-Border Trade & Delivery Routes
- 5.5.1 Cross-Border Trade/Delivery Route 1
- 5.5.2 Cross-Border Trade/Delivery Route 2
- 5.5.3 Cross-Border Trade/Delivery Route 3
- 5.5.4 Cross-Border Trade/Delivery Route 4
- 5.5.5 Cross-Border Trade/Delivery Route 5
- 5.6 Trade Policy & Market Access Impact Assessment
- 5.6.1 Tariff & Non-Tariff Barriers
- 5.6.2 Regional Trade & Economic Integration Frameworks
- 5.6.3 Bilateral & Multilateral Trade Agreements
- 5.6.4 Cross-Border Operating, Licensing & Localization Requirements
Note: This chapter applies where cross-border trade or delivery is relevant to Guar Gum Powder. Goods, services, and digital offerings are assessed using applicable classifications and transaction measures. Import-export volumes, trade balances, and route analyses are included only where meaningful to the market.
Chapter 6. Competitive Landscape & Company Benchmarking
- 6.1 Guar Gum Powder Market Concentration & Structure
- 6.1.1 Herfindahl-Hirschman Index (HHI) – vs. 2024
- 6.1.2 Leading, Mid-Sized & Emerging Player Structure
- 6.1.3 Global, Regional & Local Player Dynamics
- 6.2 Guar Gum Powder Market Share Analysis – 2024
- 6.2.1 Global Revenue Share by Company
- 6.2.2 Global Volume Share by Company (Volume Where Applicable)
- 6.2.3 Regional Revenue Share
- 6.2.4 Market Share Evolution ( vs. 2024)
- 6.2.5 Company Market Share by Key Segment
- 6.2.6 Company Market Share by Customer Group
- 6.3 Operating Scale, Capacity & Infrastructure Analysis
- 6.3.1 Global Operating Scale & Supply Capacity
- 6.3.2 Resource Utilization & Operating Efficiency
- 6.3.3 Output, Service Delivery & Activity Metrics
- 6.3.4 Operating Footprint & Infrastructure Map
- 6.3.5 Planned Operational & Capacity Expansion
- 6.4 Guar Gum Powder Competitive Benchmarking Matrix
- 6.4.1 Revenue, Growth, Profitability & Operating Metric Comparison
- 6.4.2 Channel Revenue Mix
- 6.4.3 Geographic Revenue Exposure
- 6.4.4 R&D Intensity
- 6.4.5 Sustainability Maturity
- 6.5 Strategic Developments in Guar Gum Powder (Last 24 Months)
- 6.5.1 Mergers, Acquisitions & Divestments
- 6.5.2 New Products, Services & Solutions in Guar Gum Powder
- 6.5.3 Operational & Infrastructure Expansions
- 6.5.4 Strategic Alliances, Joint Ventures & Partnerships
- 6.5.5 Distribution Expansion & Market Entry
- 6.5.6 Sustainability & ESG Initiatives
- 6.6 Competitive Strategy Mapping
- 6.6.1 Leader, Challenger, Follower & Niche Classification
- 6.6.2 Pricing Strategy Comparison
- 6.6.3 Channel Strategy Matrix
Note: Strategic developments are included based on their materiality and the availability of reliable information.
Chapter 7. Global Guar Gum Powder Market – By Sales & Delivery Channel
- 7.1 Segment Overview
- 7.1.1 Volume & Revenue Split by Channel (2024 & 2032) (Volume Where Applicable)
- 7.1.2 Channel Mix Evolution (2024-2032)
Chapter 8. Regional Market Analysis – Global Overview
- 8.1 Global Regional Overview
- 8.1.1 Regional Volume Share (Volume Where Applicable)
- 8.1.2 Regional Revenue Share
- 8.1.3 Regional Volume by Region (Volume Where Applicable)
- 8.1.4 Regional Revenue by Region
- 8.1.5 Regional Forecast Through 2032
- 8.2 Cross-Regional Segment Analysis
- 8.2.1 By Sales & Delivery Channel
- 8.2.2 By Competitive Positioning & Price Tier
Chapter 9. North America Guar Gum Powder Market
- 9.1 United States
- 9.2 Canada
- 9.3 Mexico
Chapter 10. Europe Guar Gum Powder Market
- 10.1 Germany
- 10.2 France
- 10.3 Italy
- 10.4 United Kingdom
- 10.5 Spain
- 10.6 Poland
- 10.7 Russia
- 10.8 Netherlands
- 10.9 Belgium
- 10.10 Sweden
- 10.11 Denmark
- 10.12 Norway
- 10.13 Rest of Europe
Chapter 11. Asia Pacific Guar Gum Powder Market
- 11.1 China
- 11.2 India
- 11.3 Japan
- 11.4 South Korea
- 11.5 Thailand
- 11.6 Indonesia
- 11.7 Vietnam
- 11.8 Malaysia
- 11.9 Australia
- 11.10 Rest of Asia Pacific
Chapter 12. Latin America Guar Gum Powder Market
- 12.1 Brazil
- 12.2 Argentina
- 12.3 Colombia
- 12.4 Chile
- 12.5 Rest of Latin America
Chapter 13. Middle East Guar Gum Powder Market
- 13.1 Saudi Arabia
- 13.2 United Arab Emirates
- 13.3 Turkey
- 13.4 Israel
- 13.5 Iran
- 13.6 Rest of the Middle East
Chapter 14. Africa Guar Gum Powder Market
- 14.1 South Africa
- 14.2 Egypt
- 14.3 Nigeria
- 14.4 Morocco
- 14.5 Rest of Africa
Chapter 15. Guar Gum Powder Company Profiles
- 15.1 [Company 01]
- 15.1.1 Company Overview
- 15.1.2 Key Management Personnel
- 15.1.3 Products & Services Portfolio
- 15.1.4 Financial Performance
- 15.1.5 Key Market Focus & Geographic Presence
- 15.1.6 Recent Developments & Strategic Initiatives
Note: The company profile list is preliminary and may change based on research findings, market developments, data availability, and client requirements.
Chapter 16. Appendices
- Appendix A – List of Abbreviations & Acronyms
- Appendix B – Industry Classification Code Reference – Full Series
- Appendix C – Supply, Output & Operating Capacity Data Tables
- Appendix D – End-Use & Demand Base Tables
- Appendix E – Demand, Adoption & Usage Assumptions
- Appendix F – Pricing & Revenue Metric Reference Tables
- Appendix G – Company Operations & Infrastructure Database
- Appendix H – Cross-Border Trade & Activity Data Tables (Where Applicable)
- Appendix I – Regulatory Summary Tables
- Appendix J – Primary Research Participant List (Anonymized)
- Appendix K – Primary Research Questionnaire Framework
- Appendix L – Data Sources & Bibliography
- Appendix M – Market Size Divergence & Source Comparison
Chapter 17. Research Methodology
- 17.1 Research Framework & Philosophy
- 17.2 Secondary Research – Sources, Hierarchy & Data Extraction
- 17.3 Data Modeling – Bottom-Up & Top-Down Market Sizing
- 17.4 Primary Research – Stakeholder Framework, LOI & Sample Sizes
- 17.5 Forecast Methodology – Regression, Scenario & Sensitivity Analysis
- 17.6 Quality Control – Four-Layer Validation Framework
- 17.7 Limitations & Standard Assumptions
- 17.8 Disclaimer
