
Market Overview
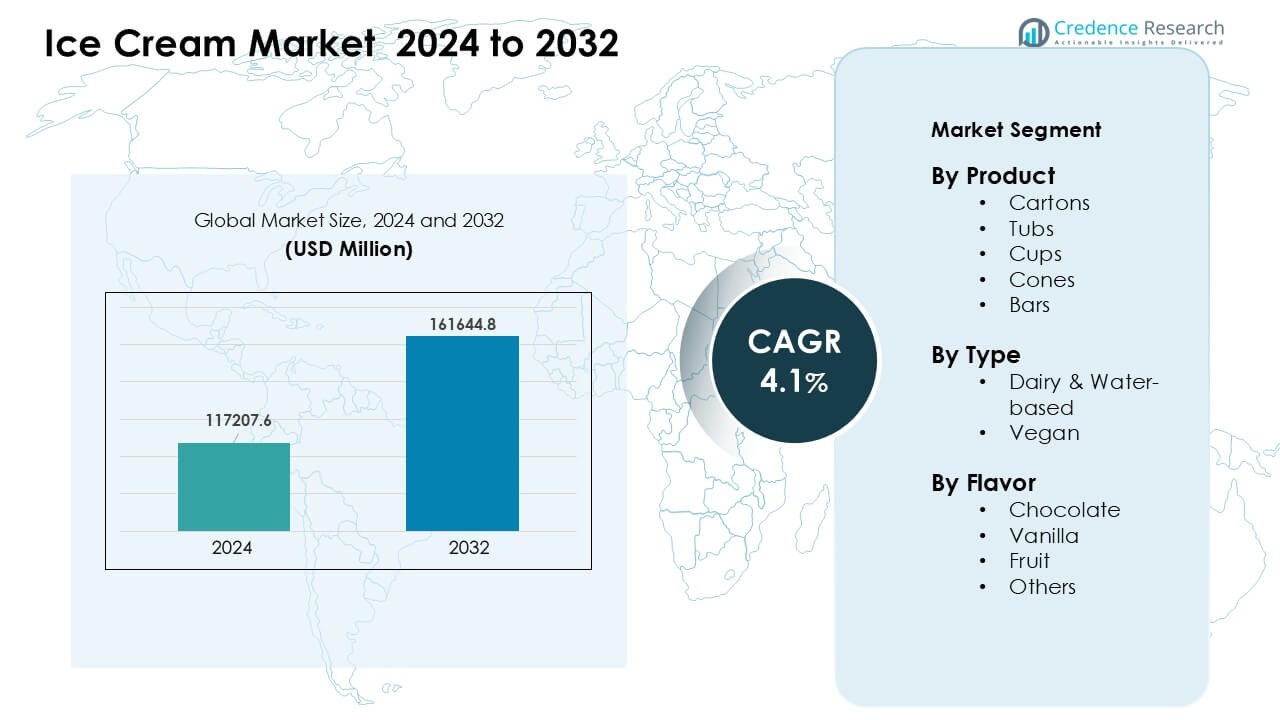
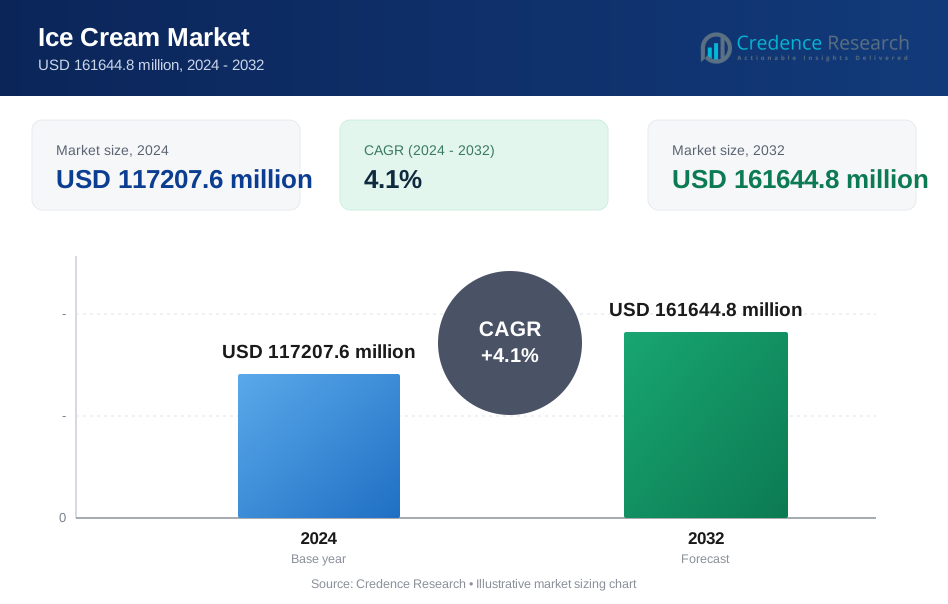
Ice Cream Market was valued at USD 117207.6 million in 2024 and is anticipated to reach USD 161644.8 million by 2032, growing at a CAGR of 4.1% during the forecast period.
| REPORT ATTRIBUTE | DETAILS |
|---|---|
| Historical Period | 2020-2023 |
| Base Year | 2024 |
| Forecast Period | 2025-2032 |
| Ice Cream Market Size 2024 | USD 117207.6 Million |
| Ice Cream Market, CAGR | 4.1% |
| Ice Cream Market Size 2032 | USD 161644.8 Million |
Top players in the ice cream market include Cold Stone Creamery, NadaMoo, Blue Bell Creameries, Danone S.A., Unilever PLC, Wells Enterprises, Nestlé SA, American Dairy Queen Corporation, Inspire Brands, Inc. (Baskin Robbins), and General Mills, Inc. These companies strengthened category growth through broad flavor portfolios, expanding franchise networks, and steady innovation in premium, plant-based, and low-sugar formats. Strong marketing and wide retail penetration further boosted brand visibility across global markets. North America emerged as the leading region in 2024 with a 34% share, supported by high consumption levels, strong freezer infrastructure, and consistent demand for both indulgent and better-for-you ice cream options.
Market Insights
- The ice cream market was valued at USD 6 million in 2024 and is projected to reach USD 161644.8 million by 2032, growing at a CAGR of 4.1%.
- Demand rose due to stronger interest in indulgent treats and convenient single-serve packs, with cartons leading the product segment at about 31% share.
- Trends shifted toward premium textures, vegan bases, and reduced-sugar recipes, supported by wider café adoption and seasonal flavor launches.
- Competition intensified as leaders expanded franchises, digital delivery channels, and clean-label innovations while facing cost pressures from dairy price fluctuations.
- North America held the largest regional share in 2024 at 34%, driven by high per-capita consumption, while Asia-Pacific grew fastest due to rising urban demand and wider cold-chain expansion.
Market Segmentation Analysis:
By Product
Cartons led the product segment in 2024 with about 31% share. Buyers picked cartons due to easy storage, strong brand display, and wider pack-size options for households. Many brands used lightweight and recyclable paperboard, which increased appeal among eco-aware consumers. Tubs and cups also grew fast as single-serve demand rose in urban areas, while cones and bars gained steady traction in quick-snack formats. Rising freezer penetration and broader flavor launches helped cartons stay ahead across retail chains and family-use settings.
- For instance, Unilever confirmed that its Carte D’Or brand shifted UK ice-cream cartons to recyclable paperboard, cutting plastic use by 93% per pack, while maintaining carton-based family formats.
By Type
Dairy & water-based ice creams dominated the type segment in 2024 with nearly 78% share. These formats held strong due to broad taste acceptance, lower price points, and extensive placement across supermarkets and food-service outlets. Many producers focused on creamier textures, reduced-sugar recipes, and better ingredient sourcing, which supported higher repeat sales. Vegan ice cream expanded steadily as lactose-free and plant-based diets increased, but dairy & water-based options stayed ahead because of wider reach, stronger nostalgia value, and larger flavor portfolios.
- For instance, Nestlé states that its dairy-based ice creams remain core to its frozen portfolio, with brands like Mövenpick using high milk-fat formulations to deliver premium texture and consistent consumer preference.
By Flavor
Chocolate held the largest flavor share in 2024 with around 34%. Consumers favored chocolate due to rich taste, wide mix-in options, and strong appeal across all age groups. Brands introduced variants like dark, brownie-filled, and nut-based mixes, which strengthened category leadership. Vanilla kept steady demand as a classic base for shakes and desserts, while fruit flavors rose due to lighter taste and seasonal demand. Broader innovation and strong promotional cycles helped chocolate maintain its lead in both take-home packs and impulse formats.
Key Growth Drivers
Rising Demand for Convenient and Indulgent Desserts
Demand for ready-to-eat frozen desserts increased as busy lifestyles pushed buyers toward fast and satisfying treat options. Ice cream makers used this shift to launch single-serve cups, on-the-go bars, and small tubs that suit quick cravings. Modern freezers in retail outlets made impulse buying easier, while wider delivery networks helped buyers access more flavors online. Many brands added richer textures and creative inclusions to attract young consumers. This focus on convenience and indulgence encouraged repeat purchases and supported steady growth across retail and food-service channels.
- For instance, General Mills states that its Häagen-Dazs mini cups are offered in 100 ml portions, targeting portion control while preserving premium texture for impulse and at-home consumption.
Strong Innovation Across Flavors and Formats
Producers introduced bold flavor mixes, seasonal picks, and premium textures to attract wider audiences. Chocolate-based and nut-filled recipes gained strong traction, while fruit-forward blends appealed to health-aware shoppers. Many brands used limited-edition launches to boost shelf visibility and create urgency. Better emulsifiers and stabilizers improved mouthfeel and reduced melting time, enhancing the overall experience. This continuous push for novelty boosted brand loyalty, expanded consumer trial rates, and strengthened category momentum across both impulse and take-home product lines.
- For instance, Mars, Incorporated reports that its Snickers Ice Cream Bars combine caramel, peanuts, and chocolate layers, with single bars typically weighing about 50 grams, supporting indulgent snacking formats with strong brand recognition.
Expanding Adoption of Health-Aligned Ice Cream Options
More buyers looked for lactose-free, low-fat, high-protein, and reduced-sugar choices, pushing producers to redesign classic recipes. Brands used plant-based ingredients, natural sweeteners, and clean-label formulas to meet rising wellness needs. Manufacturers also highlighted allergen-free options to reach sensitive consumer groups. Growing awareness of balanced snacking encouraged households to include lighter ice cream formats in weekly treats. These shifts allowed producers to target new customer segments while preserving indulgence, supporting broader market expansion across regions with strong health-focused spending.
Key Trend & Opportunity
Growth of Plant-Based and Vegan Ice Cream Lines
Vegan ice cream advanced as more consumers explored dairy alternatives and flexible diets. Producers added oat, almond, and coconut bases to match creamy textures without lactose. These formats gained appeal among buyers seeking ethical, clean-label, and animal-free products. Wider café and quick-service adoption of vegan shakes and desserts increased visibility. This trend created opportunities for brands to differentiate through unique flavor blends, limited-edition plant-based launches, and premium pricing supported by natural ingredients. It also opened pathways for partnerships with health-oriented retail chains.
- For instance, Häagen-Dazs launched coconut-based vegan ice cream in the U.S.: True. Häagen-Dazs launched a line of four non-dairy flavors in the U.S. in 2017, including Coconut Caramel. These products primarily use ingredients like coconut cream or peanut butter to achieve a creamy texture.
Rising Influence of Premiumization and Artisanal Crafting
Many shoppers traded up to premium ice cream due to stronger flavor depth and richer textures. Small-batch makers used natural ingredients, slow-churn processes, and creative inclusions to elevate sensory appeal. Premium brands expanded their reach through boutique stores and curated freezer placements in modern retail. This shift encouraged global producers to launch luxury lines with exotic flavors and layered mix-ins. It also created opportunities for subscription-based ice cream boxes and seasonal craft releases, drawing high-value buyers across urban markets.
Digital Ordering, Delivery, and Personalization Growth
Online delivery platforms made late-evening and impulse ice cream buying popular. Many brands introduced insulated packaging to support long-distance delivery without quality loss. Digital menus helped buyers customize flavor mixes, choose toppings, and explore limited editions tailored to local tastes. Data from online orders allowed producers to plan targeted launches and quick market tests. This digital push created fresh opportunities for direct-to-consumer brands, subscription models, and AI-based flavor recommendation engines that enhanced customer engagement.
- For instance, Cold Stone Creamery reports that its digital ordering system allows customers to customize ice cream with more than 30 mix-ins per order, supporting personalized desserts across delivery and pickup channels.
Key Challenge
Increasing Pressure from Health and Sugar-Reduction Concerns
Many buyers monitored sugar levels closely, which pushed producers to balance taste with healthier nutrition profiles. Reformulating products while keeping creamy texture and flavor strength proved difficult. Lighter blends risked lower mouthfeel quality, affecting repeat purchases. Strict labeling rules also raised scrutiny around artificial sweeteners and stabilizers. This pressure forced brands to invest heavily in R&D to create better low-sugar and clean-label recipes. Meeting wellness needs without reducing indulgence remains a major challenge for mainstream producers.
Volatility in Dairy Prices and Supply Chain Disruptions
Producers faced rising costs for milk, cream, and other key dairy inputs due to supply fluctuations and global trade shifts. Higher energy and cold-chain expenses also increased production budgets. Small brands struggled with cost absorption, which affected pricing stability across retail shelves. Transport delays created spoilage risks, especially for long-distance shipments. These pressures required companies to enhance forecasting, diversify suppliers, and expand plant-based options to reduce exposure. Managing cost swings while protecting margins remains a critical challenge for the industry.
Regional Analysis
North America
North America led the ice cream market in 2024 with around 34% share. Strong demand came from high per-capita consumption, wide freezer coverage, and steady launches of premium and indulgent flavors. Brands focused on low-sugar, high-protein, and lactose-free formats to align with growing health awareness. Retail chains expanded freezer aisles, while food-service outlets boosted sales through shakes, sundaes, and novelty treats. The presence of large manufacturers and strong promotional cycles supported category growth across both the U.S. and Canada.
Europe
Europe held about 29% share in 2024, supported by strong preference for artisanal and premium ice cream. Many countries showed high summer-season consumption, which lifted sales of fruit-forward and specialty flavors. Producers emphasized natural ingredients and clean-label recipes, aligning with strict regional food standards. Retailers expanded private-label offerings, while cafés strengthened demand through handcrafted gelato and limited-edition launches. Wider tourism activity and strong café culture helped Europe maintain its stable position in the global market.
Asia-Pacific
Asia-Pacific accounted for nearly 28% share in 2024 and grew rapidly due to rising disposable income and expanding cold-chain networks. Young consumers drove strong trial rates for new flavors, mix-ins, and Korean- and Japanese-inspired textures. Convenience stores boosted impulse buying, while e-commerce channels increased access to premium and imported brands. Demand for fruit-based and lighter ice creams rose with growing health interest. Expanding urbanization and wider freezer penetration helped the region become one of the fastest-growing markets.
Latin America
Latin America captured about 5% share in 2024, supported by warmer climates and strong street-vending culture. Affordability shaped buying patterns, which lifted sales of cups, cones, and impulse bars. Producers introduced tropical flavors like mango, coconut, and guava to match local tastes. Modern retail growth helped expand freezer placements, while digital delivery platforms increased access to premium lines in major cities. Despite economic fluctuations, rising youth consumption and café expansion supported steady market performance.
Middle East & Africa
The Middle East & Africa region held nearly 4% share in 2024, driven by hot weather and growing demand for indulgent frozen treats. Urban centers showed rising interest in premium, gourmet, and mixed-in ice creams. International brands expanded café formats, while local producers added regional flavors such as pistachio, saffron, and date. Retail modernization improved freezer availability, and tourism boosted consumption in key hubs. Although price sensitivity remained a challenge, increasing population and improving cold-chain logistics supported gradual market growth.
Market Segmentations:
By Product
- Cartons
- Tubs
- Cups
- Cones
- Bars
By Type
- Dairy & Water-based
- Vegan
By Flavor
- Chocolate
- Vanilla
- Fruit
- Others
By Geography
- North America
- U.S.
- Canada
- Mexico
- Europe
- Germany
- France
- U.K.
- Italy
- Spain
- Rest of Europe
- Asia Pacific
- China
- Japan
- India
- South Korea
- South-east Asia
- Rest of Asia Pacific
- Latin America
- Brazil
- Argentina
- Rest of Latin America
- Middle East & Africa
- GCC Countries
- South Africa
- Rest of the Middle East and Africa
Competitive Landscape
The ice cream market features strong competition led by major brands such as Cold Stone Creamery, NadaMoo, Blue Bell Creameries, Danone S.A., Unilever PLC, Wells Enterprises, Nestlé SA, American Dairy Queen Corporation, Inspire Brands, Inc. (Baskin Robbins), and General Mills, Inc. These companies expanded their reach through broad retail networks, franchise models, and strong digital engagement. Producers focused on premium textures, cleaner labels, and diverse flavor mixes to stand out in crowded freezers. Many brands invested in plant-based lines, portion-controlled packs, and reduced-sugar formulas to match shifting consumer habits. Strategic partnerships with cafés, e-commerce platforms, and food-service chains strengthened visibility, while continuous R&D improved mouthfeel, melting resistance, and ingredient quality. Rising demand for both indulgent and health-aligned formats encouraged brands to diversify portfolios and enhance product innovation, supporting long-term competitive strength across global markets.
Key Player Analysis
- Cold Stone Creamery
- NadaMoo
- Blue Bell Creameries
- Danone S.A.
- Unilever PLC
- Wells Enterprises
- Nestlé SA
- American Dairy Queen Corporation
- Inspire Brands, Inc. (Baskin Robbins)
- General Mills, Inc.
Recent Developments
- In November 2025, American Dairy Queen Corporation: Rolled out the 2025 Holiday Treat Collection, featuring new Peppermint Bark Blizzard Treat and Holiday Nog Shake, plus the returning Frosted Sugar Cookie Blizzard, as limited-time festive ice cream offerings across DQ locations.
- In September 2025, Nestlé SA: Launched KitKat Matcha Ice Cream in Asia, debuting first in Thailand. The product uses authentic Shizuoka matcha and celebrates 90 years of KitKat while targeting growing matcha demand across the region.
- In January 2025, General Mills, Inc.: Expanded the Häagen-Dazs portfolio with a new Belgian Waffle Cones range, pairing crispy waffle cones with premium ice cream and caramel, fudge, or raspberry sauce in the cone tip to tap rising demand for snackable cone formats.
Report Coverage
The research report offers an in-depth analysis based on Product, Type, Flavor and Geography. It details leading market players, providing an overview of their business, product offerings, investments, revenue streams, and key applications. Additionally, the report includes insights into the competitive environment, SWOT analysis, current market trends, as well as the primary drivers and constraints. Furthermore, it discusses various factors that have driven market expansion in recent years. The report also explores market dynamics, regulatory scenarios, and technological advancements that are shaping the industry. It assesses the impact of external factors and global economic changes on market growth. Lastly, it provides strategic recommendations for new entrants and established companies to navigate the complexities of the market.
Future Outlook
- Premium and artisanal ice cream lines will expand as buyers seek richer textures.
- Vegan and lactose-free options will grow as plant-based diets gain wider acceptance.
- Reduced-sugar and high-protein recipes will advance to meet health-focused demand.
- Single-serve and on-the-go formats will increase as convenience stays a priority.
- Digital ordering and delivery platforms will boost impulse and late-evening purchases.
- Seasonal and limited-edition flavors will rise to drive trial and brand engagement.
- Cold-chain upgrades in emerging markets will support broader product distribution.
- Sustainability efforts will grow through recyclable packaging and cleaner ingredient sourcing.
- Franchised dessert chains will expand their global footprint with new formats.
- Data-driven personalization will shape flavor development and targeted product launches.
Request a Free Sample
Fill in your details and we'll send you a free sample report.
- Sample data tables & charts
- Research methodology
Need a Custom Version of This Report?
Tailor the scope, geography, or segments to your exact requirements.
- Custom geography or segment scope
- Direct access to our analyst team
Frequently Asked Questions
What is the current market size for Ice Cream Market, and what is its projected size in 2032?
At what Compound Annual Growth Rate is Ice Cream Market projected to grow between 2024 and 2032?
Which Ice Cream Market segment held the largest share in 2024?
What are the primary factors fueling the growth of Ice Cream Market?
Who are the leading companies in Ice Cream Market?
Which region commanded the largest share of Ice Cream Market?
Table of Content
Chapter 1. Report Introduction
- 1.1 Report Description & Purpose
- 1.1.1 Report Title & Market Definition
- 1.1.2 Unique Selling Propositions (USP) & Key Differentiators
- 1.1.3 Value Proposition for Stakeholders
- 1.2 Research Objectives
- 1.2.1 Market Sizing Objectives (Volume & Revenue)
- 1.2.2 Segmentation Objectives
- 1.2.3 Competitive Intelligence Objectives
- 1.2.4 Forecast & Scenario Objectives
- 1.3 Report Scope
- 1.3.1 Ice Cream Scope – Types & Subtypes Covered
- 1.3.2 Geographic Scope – Regions & Countries Covered
- 1.3.3 Historical Period, Base Year & Forecast Period (2024; forecast to 2032)
- 1.3.4 Inclusions & Exclusions
- 1.4 HS Code & Classification Framework
- 1.5 Currency, Units & Pricing Basis
- 1.6 Target Stakeholders
- 1.7 Limitations & Assumptions
Chapter 2. Executive Summary
- 2.1 Global Ice Cream Market Snapshot
- 2.1.1 Market Size – Historical (2024) & Forecast (2024-2032) (2024: USD 117207.6 million → 2032: USD 161644.8 million)
- 2.1.2 Volume & Revenue – Global Totals
- 2.1.3 Key Market Highlights – Top Five Facts
- 2.2 Ice Cream Market Segmentation Snapshot
- 2.2.1 Market Split by Region – 2024 vs. 2032
- 2.3 Competitive Snapshot
- 2.3.1 Top 10 Players by Revenue Share – 2024
- 2.3.2 Top 10 Players by Volume Share – 2024
- 2.3.3 Recent Strategic Developments (18-Month Summary)
- 2.4 Key Investment Highlights & Strategic Conclusions
Chapter 3. Ice Cream Market Dynamics & Industry Analysis
- 3.1 Market Overview & Context
- 3.1.1 Ice Cream Market Position in the Broader Automotive Value Chain
- 3.1.2 OEM vs. Replacement Market Dynamics
- 3.1.3 Market Maturity & Development Stage by Region
- 3.2 Ice Cream Market Drivers
- 3.3 Ice Cream Market Restraints & Challenges
- 3.4 Ice Cream Market Opportunities
- 3.5 Porter's Five Forces Analysis
- 3.5.1 Threat of New Entrants
- 3.5.2 Bargaining Power of Suppliers
- 3.5.3 Bargaining Power of Buyers
- 3.5.4 Threat of Substitutes
- 3.5.5 Competitive Rivalry – Intensity Assessment
- 3.6 Ice Cream Value Chain Analysis
- 3.6.1 Upstream – Raw Material/Input Suppliers
- 3.6.1.1 Raw Material/Input 1
- 3.6.1.2 Raw Material/Input 2
- 3.6.1.3 Raw Material/Input 3
- 3.6.2 Midstream – Production/Manufacturing/Service Delivery
- 3.6.2.1 Production/Process Overview
- 3.6.2.2 Key Facility Locations & Capacity by Manufacturer
- 3.6.3 Downstream – Distribution & End Consumer
- 3.6.3.1 Primary Channel – B2B/OEM
- 3.6.3.2 Secondary Channels – Dealer, Retail, Online, Direct
- 3.6.4 Value Chain Profitability Analysis
- 3.6.1 Upstream – Raw Material/Input Suppliers
- 3.7 PESTEL Analysis
- 3.7.1 Political Factors
- 3.7.2 Economic Factors
- 3.7.3 Social Factors
- 3.7.4 Technological Factors
- 3.7.5 Environmental Factors
- 3.7.6 Legal Factors
- 3.8 Ice Cream Supply Chain Analysis
- 3.8.1 Raw Material/Input Supply Risk Assessment
- 3.8.2 Manufacturing Concentration Risk (Geographic Exposure)
- 3.8.3 Trade Disruption Impact Analysis
- 3.9 Regulatory & Policy Landscape
Note: The regulatory and policy landscape section covers regulations based on their applicability to the market, Ice Cream category, geography, and scope of the study. Only regulatory frameworks with a material impact on operations, compliance, trade, sustainability, or market access are analyzed in detail.
Chapter 4. Key Investment Pockets & Opportunity Analysis
- 4.1 Ice Cream Market Attractiveness Analysis
- 4.1.1 By Region – Investment Attractiveness Matrix (Volume × CAGR)
- 4.2 Absolute Revenue Growth Opportunity
- 4.2.1 By Region – Absolute USD Growth Through 2032
- 4.3 Incremental Volume Opportunity
- 4.3.1 By Region – Incremental Volume Through 2032
- 4.3.2 Segment – Incremental Volume
- 4.4 Emerging Submarket Opportunity Deep Dive (Subject to Applicability)
- 4.5 Emerging Market Opportunity Scorecards
- 4.5.1 United States
- 4.5.2 Europe
- 4.5.3 Asia
- 4.5.4 Middle East & Africa
Note: Emerging Market Opportunity Scorecards will be included based on relevance and strategic importance. Regions listed are indicative and may vary depending on data availability and market dynamics.
Chapter 5. Ice Cream Import-Export Analysis & Trade Flows
- 5.1 Global Trade Overview
- 5.1.1 Global Export Value by Country (2024)
- 5.1.2 Global Export Volume by Country (2024)
- 5.1.3 Global Import Value by Country (2024)
- 5.1.4 Global Import Volume by Country (2024)
- 5.1.5 Net Trade Balance by Country (2024)
- 5.2 Export Analysis – Segment
- 5.2.1 Type 1 (HS Code)
- 5.2.2 Type 2 (HS Code)
- 5.2.3 Type 3 (HS Code)
- 5.2.4 Type 4 (HS Code)
- 5.2.5 Type 5 (HS Code)
- 5.3 Import Analysis – Segment
- 5.3.1 Type 1 (HS Code)
- 5.3.2 Type 2 (HS Code)
- 5.3.3 Type 3 (HS Code)
- 5.3.4 Type 4 (HS Code)
- 5.3.5 Type 5 (HS Code)
- 5.4 Average Unit Trade Prices
- 5.4.1 Average Export Price – Segment & Country
- 5.4.2 Average Import Price – Segment & Source Country
- 5.4.3 Price Trends (2024)
- 5.5 Key Trade Route Analysis
- 5.5.1 Trade Route 1
- 5.5.2 Trade Route 2
- 5.5.3 Trade Route 3
- 5.5.4 Trade Route 4
- 5.5.5 Trade Route 5
- 5.6 Trade Policy Impact Assessment
- 5.6.1 US Anti-Dumping & Section 301 Tariffs
- 5.6.2 EU Customs Union Impact
- 5.6.3 Major Free Trade Agreements
- 5.6.4 USMCA Rules of Origin
Note: Trade policy analysis will be included only where relevant to the Ice Cream market.
Chapter 6. Competitive Landscape & Company Benchmarking
- 6.1 Ice Cream Market Concentration & Structure
- 6.1.1 Herfindahl-Hirschman Index (HHI) – vs. 2024
- 6.1.2 Tier 1, Tier 2 & Tier 3 Market Structure
- 6.1.3 Global, Regional & Local Player Dynamics
- 6.2 Ice Cream Market Share Analysis – 2024
- 6.2.1 Global Revenue Share by Company
- 6.2.2 Global Volume Share by Company
- 6.2.3 Regional Revenue Share
- 6.2.4 Market Share Evolution ( vs. 2024)
- 6.2.5 OEM Segment Share by Company
- 6.2.6 Replacement Segment Share by Company
- 6.3 Production/Delivery Capacity & Facility Analysis
- 6.3.1 Global Installed Capacity
- 6.3.2 Capacity Utilization Rates
- 6.3.3 Production/Output Volume
- 6.3.4 Facility Locations & Capacity Map
- 6.3.5 Planned Capacity Additions
- 6.4 Ice Cream Competitive Benchmarking Matrix
- 6.4.1 Revenue, Volume, CAGR & Profitability Comparison
- 6.4.2 Channel Revenue Mix
- 6.4.3 Geographic Revenue Exposure
- 6.4.4 R&D Intensity
- 6.4.5 Sustainability Maturity
- 6.5 Strategic Developments in Ice Cream (Last 24 Months)
- 6.5.1 Mergers, Acquisitions & Divestments
- 6.5.2 New Ice Cream Launches
- 6.5.3 Facility Expansions
- 6.5.4 Strategic Alliances, Joint Ventures & Partnerships
- 6.5.5 Distribution Expansion & Market Entry
- 6.5.6 Sustainability & ESG Initiatives
- 6.6 Competitive Strategy Mapping
- 6.6.1 Leader, Challenger, Follower & Niche Classification
- 6.6.2 Pricing Strategy Comparison
- 6.6.3 Channel Strategy Matrix
Note: Strategic developments are included based on their materiality and the availability of reliable information.
Chapter 7. Global Ice Cream Market – By Distribution Channel
- 7.1 Segment Overview
- 7.1.1 Volume & Revenue Split by Channel (2024 & 2032)
- 7.1.2 Channel Mix Evolution (2024-2032)
Chapter 8. Regional Market Analysis – Global Overview
- 8.1 Global Regional Overview
- 8.1.1 Regional Volume Share
- 8.1.2 Regional Revenue Share
- 8.1.3 Regional Volume by Region
- 8.1.4 Regional Revenue by Region
- 8.1.5 Regional Forecast Through 2032
- 8.2 Cross-Regional Segment Analysis
- 8.2.1 By Distribution Channel
- 8.2.2 By Brand/Price Tier
Chapter 9. North America Ice Cream Market
- 9.1 United States
- 9.2 Canada
- 9.3 Mexico
Chapter 10. Europe Ice Cream Market
- 10.1 Germany
- 10.2 France
- 10.3 Italy
- 10.4 United Kingdom
- 10.5 Spain
- 10.6 Poland
- 10.7 Russia
- 10.8 Netherlands
- 10.9 Belgium
- 10.10 Sweden
- 10.11 Denmark
- 10.12 Norway
- 10.13 Rest of Europe
Chapter 11. Asia Pacific Ice Cream Market
- 11.1 China
- 11.2 India
- 11.3 Japan
- 11.4 South Korea
- 11.5 Thailand
- 11.6 Indonesia
- 11.7 Vietnam
- 11.8 Malaysia
- 11.9 Australia
- 11.10 Rest of Asia Pacific
Chapter 12. Latin America Ice Cream Market
- 12.1 Brazil
- 12.2 Argentina
- 12.3 Colombia
- 12.4 Chile
- 12.5 Rest of Latin America
Chapter 13. Middle East Ice Cream Market
- 13.1 Saudi Arabia
- 13.2 United Arab Emirates
- 13.3 Turkey
- 13.4 Israel
- 13.5 Iran
- 13.6 Rest of the Middle East
Chapter 14. Africa Ice Cream Market
- 14.1 South Africa
- 14.2 Egypt
- 14.3 Nigeria
- 14.4 Morocco
- 14.5 Rest of Africa
Chapter 15. Ice Cream Company Profiles
- 15.1 [Company 01]
- 15.1.1 Company Overview
- 15.1.2 Key Management Personnel
- 15.1.3 Products & Services Portfolio
- 15.1.4 Financial Performance
- 15.1.5 Key Market Focus & Geographic Presence
- 15.1.6 Recent Developments & Strategic Initiatives
Note: The company profile list is preliminary and may change based on research findings, market developments, data availability, and client requirements.
Chapter 16. Appendices
- Appendix A – List of Abbreviations & Acronyms
- Appendix B – Industry Classification Code Reference – Full Series
- Appendix C – Production & Capacity Data Tables
- Appendix D – End-Use & Demand Base Tables
- Appendix E – Consumption & Replacement Rate Assumptions
- Appendix F – ASP Reference Tables
- Appendix G – Manufacturing & Facility Database
- Appendix H – Import-Export Data Tables
- Appendix I – Regulatory Summary Tables
- Appendix J – Primary Research Participant List (Anonymized)
- Appendix K – Primary Research Questionnaire Framework
- Appendix L – Data Sources & Bibliography
- Appendix M – Market Size Divergence & Source Comparison
Chapter 17. Research Methodology
- 17.1 Research Framework & Philosophy
- 17.2 Secondary Research – Sources, Hierarchy & Data Extraction
- 17.3 Data Modeling – Bottom-Up & Top-Down Market Sizing
- 17.4 Primary Research – Stakeholder Framework, LOI & Sample Sizes
- 17.5 Forecast Methodology – Regression, Scenario & Sensitivity Analysis
- 17.6 Quality Control – Four-Layer Validation Framework
- 17.7 Limitations & Standard Assumptions
- 17.8 Disclaimer
