
Projection halls and interactive museums sell timed tickets
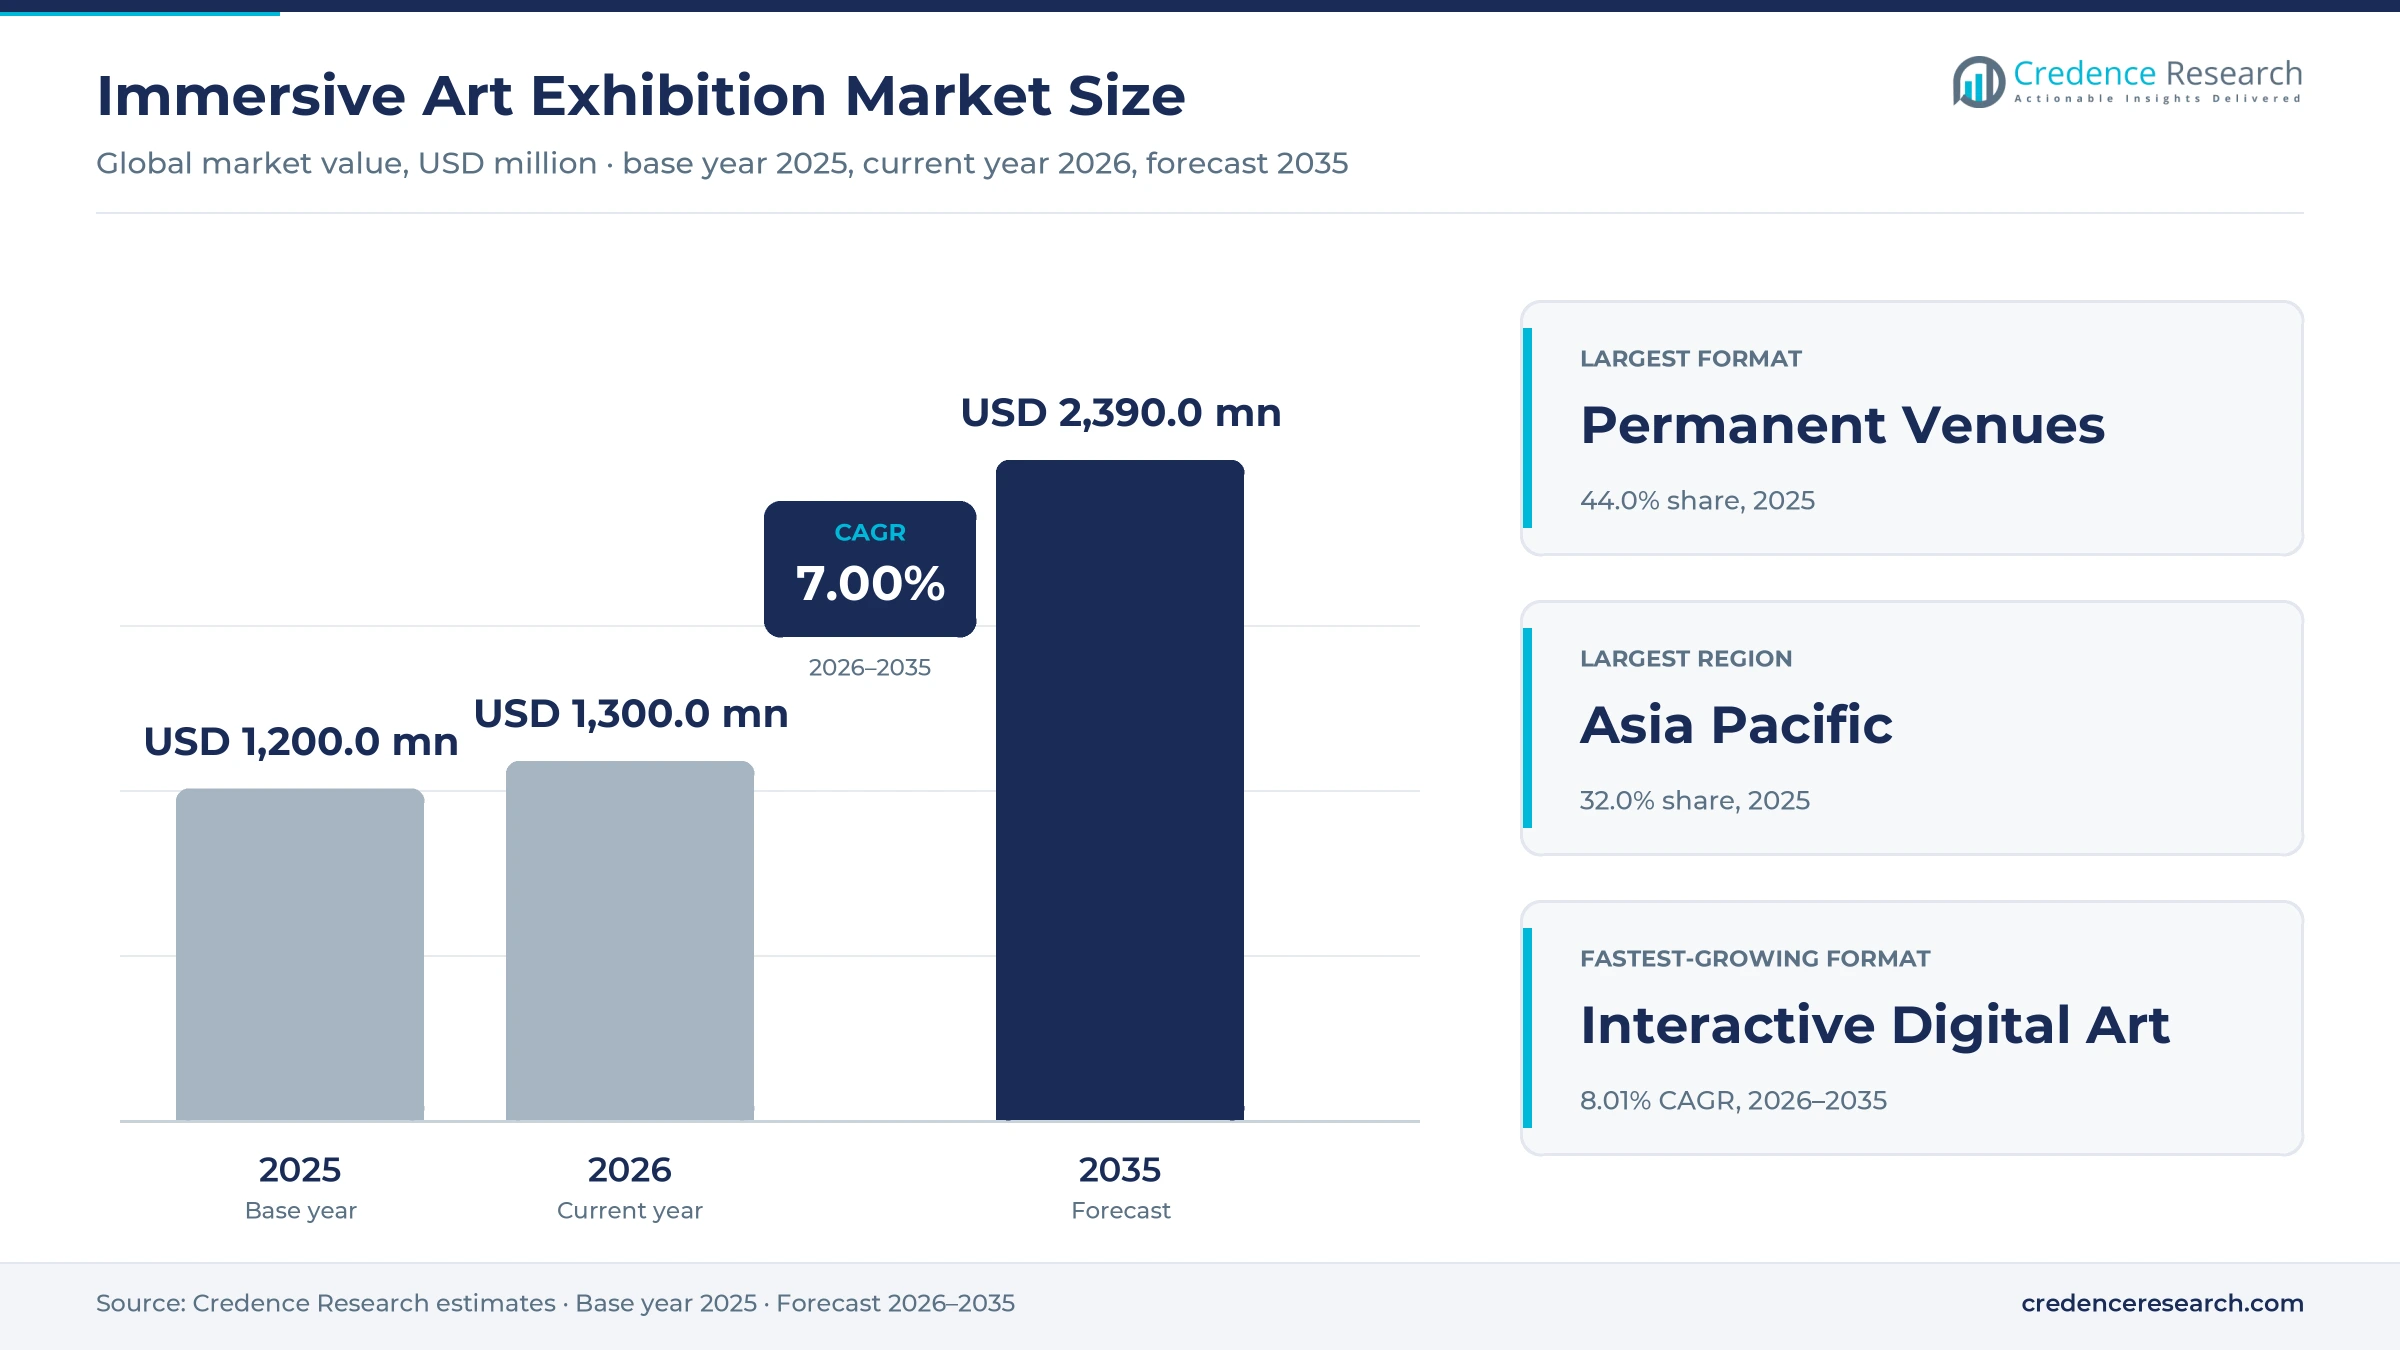
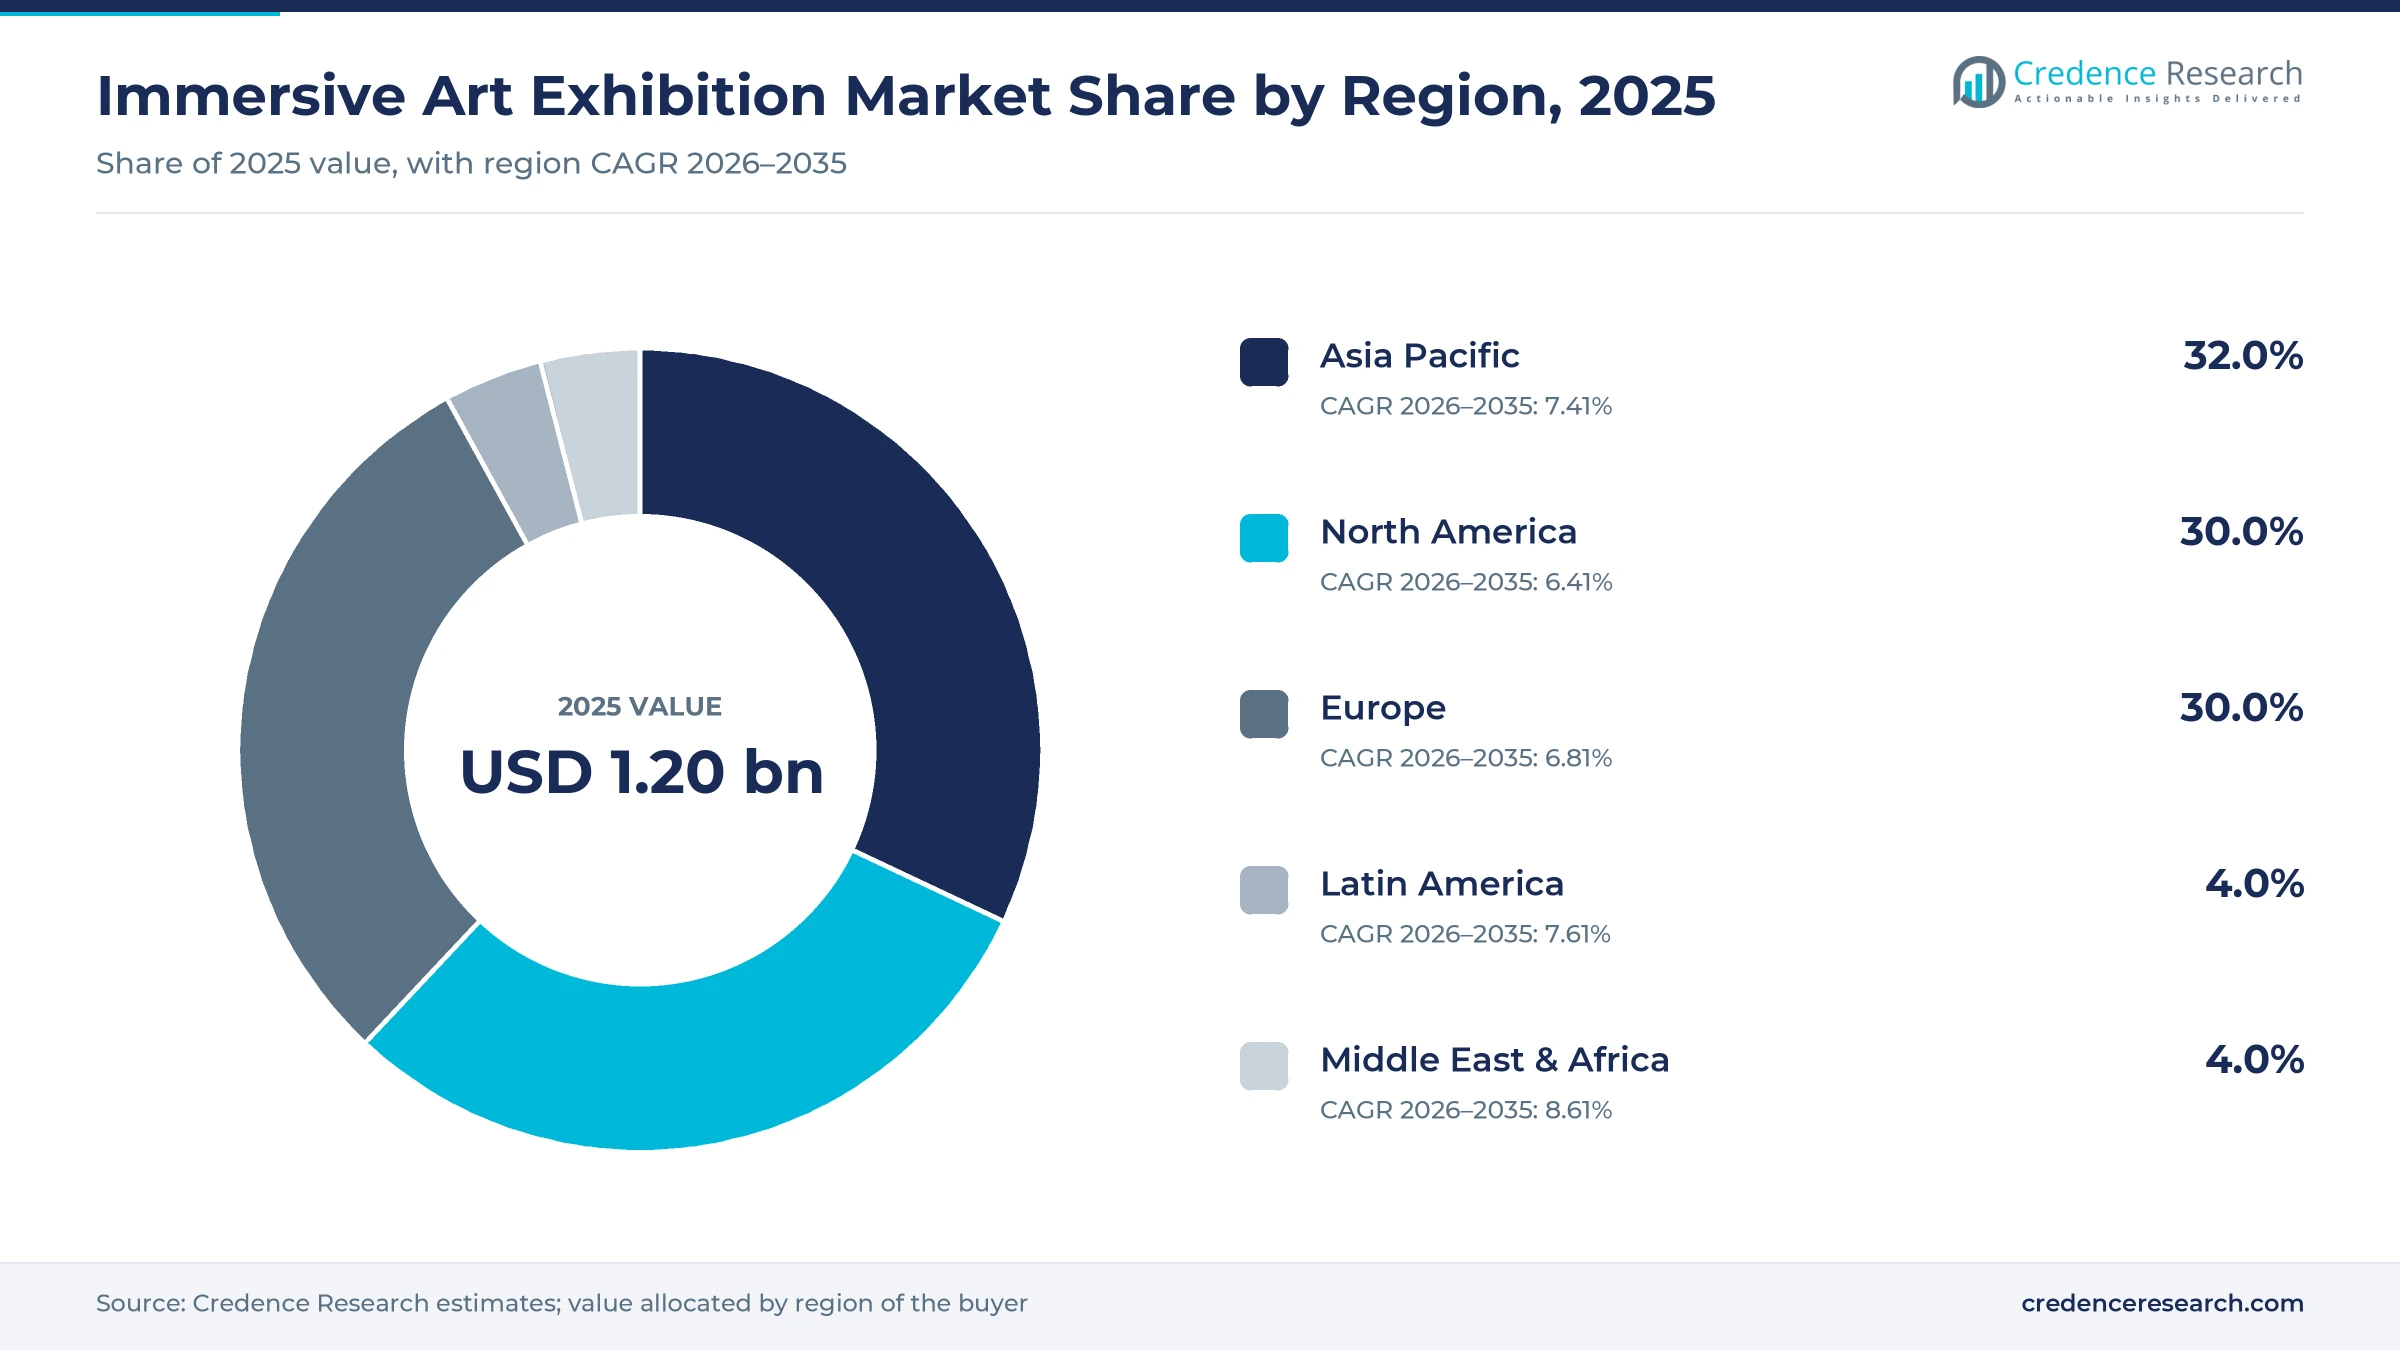
The global immersive art exhibition market was valued at USD 1.20 billion in 2025 and is projected to increase from USD 1.30 billion in 2026 to USD 2.39 billion by 2035, registering a CAGR of 7.00% during 2026–2035. Demand comes from tourists and local families who buy timed tickets to projection halls, interactive digital art museums and touring shows built around painters such as Van Gogh and Klimt. Asia Pacific held the largest regional share, 32.0% in 2025, because teamLab's two Tokyo museums alone drew more than 4.2 million visitors that year. North America and Europe follow closely on dense networks of permanent and touring venues. Middle East & Africa is the fastest-growing region at 8.61% a year, as Jeddah, Abu Dhabi and Dubai add large permanent venues tied to tourism plans. The main commercial change is consolidation, because weaker projection halls in Las Vegas and other U.S. cities closed between 2024 and 2026 while larger museums opened.
What do immersive art exhibitions sell to visitors?
The report counts spending on ticketed exhibitions where projected or interactive digital art surrounds the visitor, including permanent projection halls, interactive digital art museums and touring shows staged in convention centers, malls and warehouses. Visitors mostly buy timed-entry tickets online, often through ticketing platforms, and then spend on gift shops, cafes and photo products. Operators also earn licensing fees when a show or brand is staged by a partner.
Virtual reality headsets sold to consumers, museum audio guides, art sales and theme park rides are excluded from the market value. The value chain runs from content studios and projector suppliers, through venue owners and producers, to ticketing platforms, landlords and tourism boards that promote the venues.
Immersive Art Exhibition Market Insights
- The market is projected to rise from USD 1.20 billion in 2025 to USD 2.39 billion by 2035 at a 7.00% CAGR, as new permanent venues open in the Gulf, Tokyo and Hamburg.
- Asia Pacific held the largest regional share in 2025, as teamLab Planets and teamLab Borderless in Tokyo drew more than 4.2 million visitors together.
- Permanent venues are the largest format, because fixed halls such as the Culturespaces Lumieres network run year-round programs on site-specific projection rigs.
- The format is consolidating, as five Las Vegas projection venues closed between October 2024 and March 2026 while large Gulf museums opened.
- Platform money is entering the sector, as Fever raised $250 million in September 2026 in a round led by EQT to expand its live events business.
Permanent venues and ticket sales lead spending
Permanent venues lead as interactive museums grow fastest
Based on format, the market is categorized into touring projection shows, permanent venues and interactive digital art. Permanent Venues led with 44.0% of 2025 value because fixed halls run year-round programs on large rigs, and Bassins des Lumieres in Bordeaux uses more than 100 Barco laser projectors across almost 14,000 square meters. That site drew about 400,000 visitors in its first four months. Interactive Digital Art grows fastest at 8.01% a year, as teamLab Borderless Jeddah opened on June 10, 2024, with more than 80 interactive works, and a 6,500-square-meter teamLab museum is due in Hamburg in 2026, according to designboom.
Tickets lead revenue as licensing grows fastest
Based on revenue source, the market is categorized into tickets, merchandise and licensing. Tickets led with 78.0% of 2025 value because admission is the core purchase, and teamLab Planets in Tokyo charged adults 4,200 yen from July 22, 2024, according to Tokyo Cheapo, while drawing about 2.51 million visitors in 2025. Licensing grows fastest at 8.30% a year, as producers place their shows with local partners. Culturespaces chose broadcaster TV Asahi for its Reve des Lumieres venue in Tokyo, its seventh international location, according to EAP Magazin in October 2025.
Domestic visitors lead as international tourists grow faster
Based on visitor type, the market is categorized into domestic visitors and international tourists. Domestic Visitors led with 58.0% of 2025 value because touring shows sell mainly to local families and schools in many cities. Beyond Van Gogh drew more than 380,000 visitors in four months in Sao Paulo, according to Latamarte. International Tourists grow faster at 7.68% a year, as about 70% of the 4 million visitors to teamLab Borderless in Azabudai Hills came from more than 185 countries and regions, according to Holiday Travel in August 2026. International tourist arrivals also reached 1.52 billion worldwide in 2025, according to UN Tourism.
| Segment Group | Leading Sub-segment | Share, 2025 | Fastest-growing Sub-segment | CAGR, 2026–2035 |
|---|---|---|---|---|
| By Format | Permanent Venues | 44.0% | Interactive Digital Art | 8.01% |
| By Revenue Source | Tickets | 78.0% | Licensing | 8.30% |
| By Visitor Type | Domestic Visitors | 58.0% | International Tourists | 7.68% |
Request a Free Sample
Fill in your details and we'll send you a free sample report.
- Sample data tables & charts
- Research methodology
Tourism, laser projection and touring shows lift visits
Destination tourism lifts visits to digital art venues
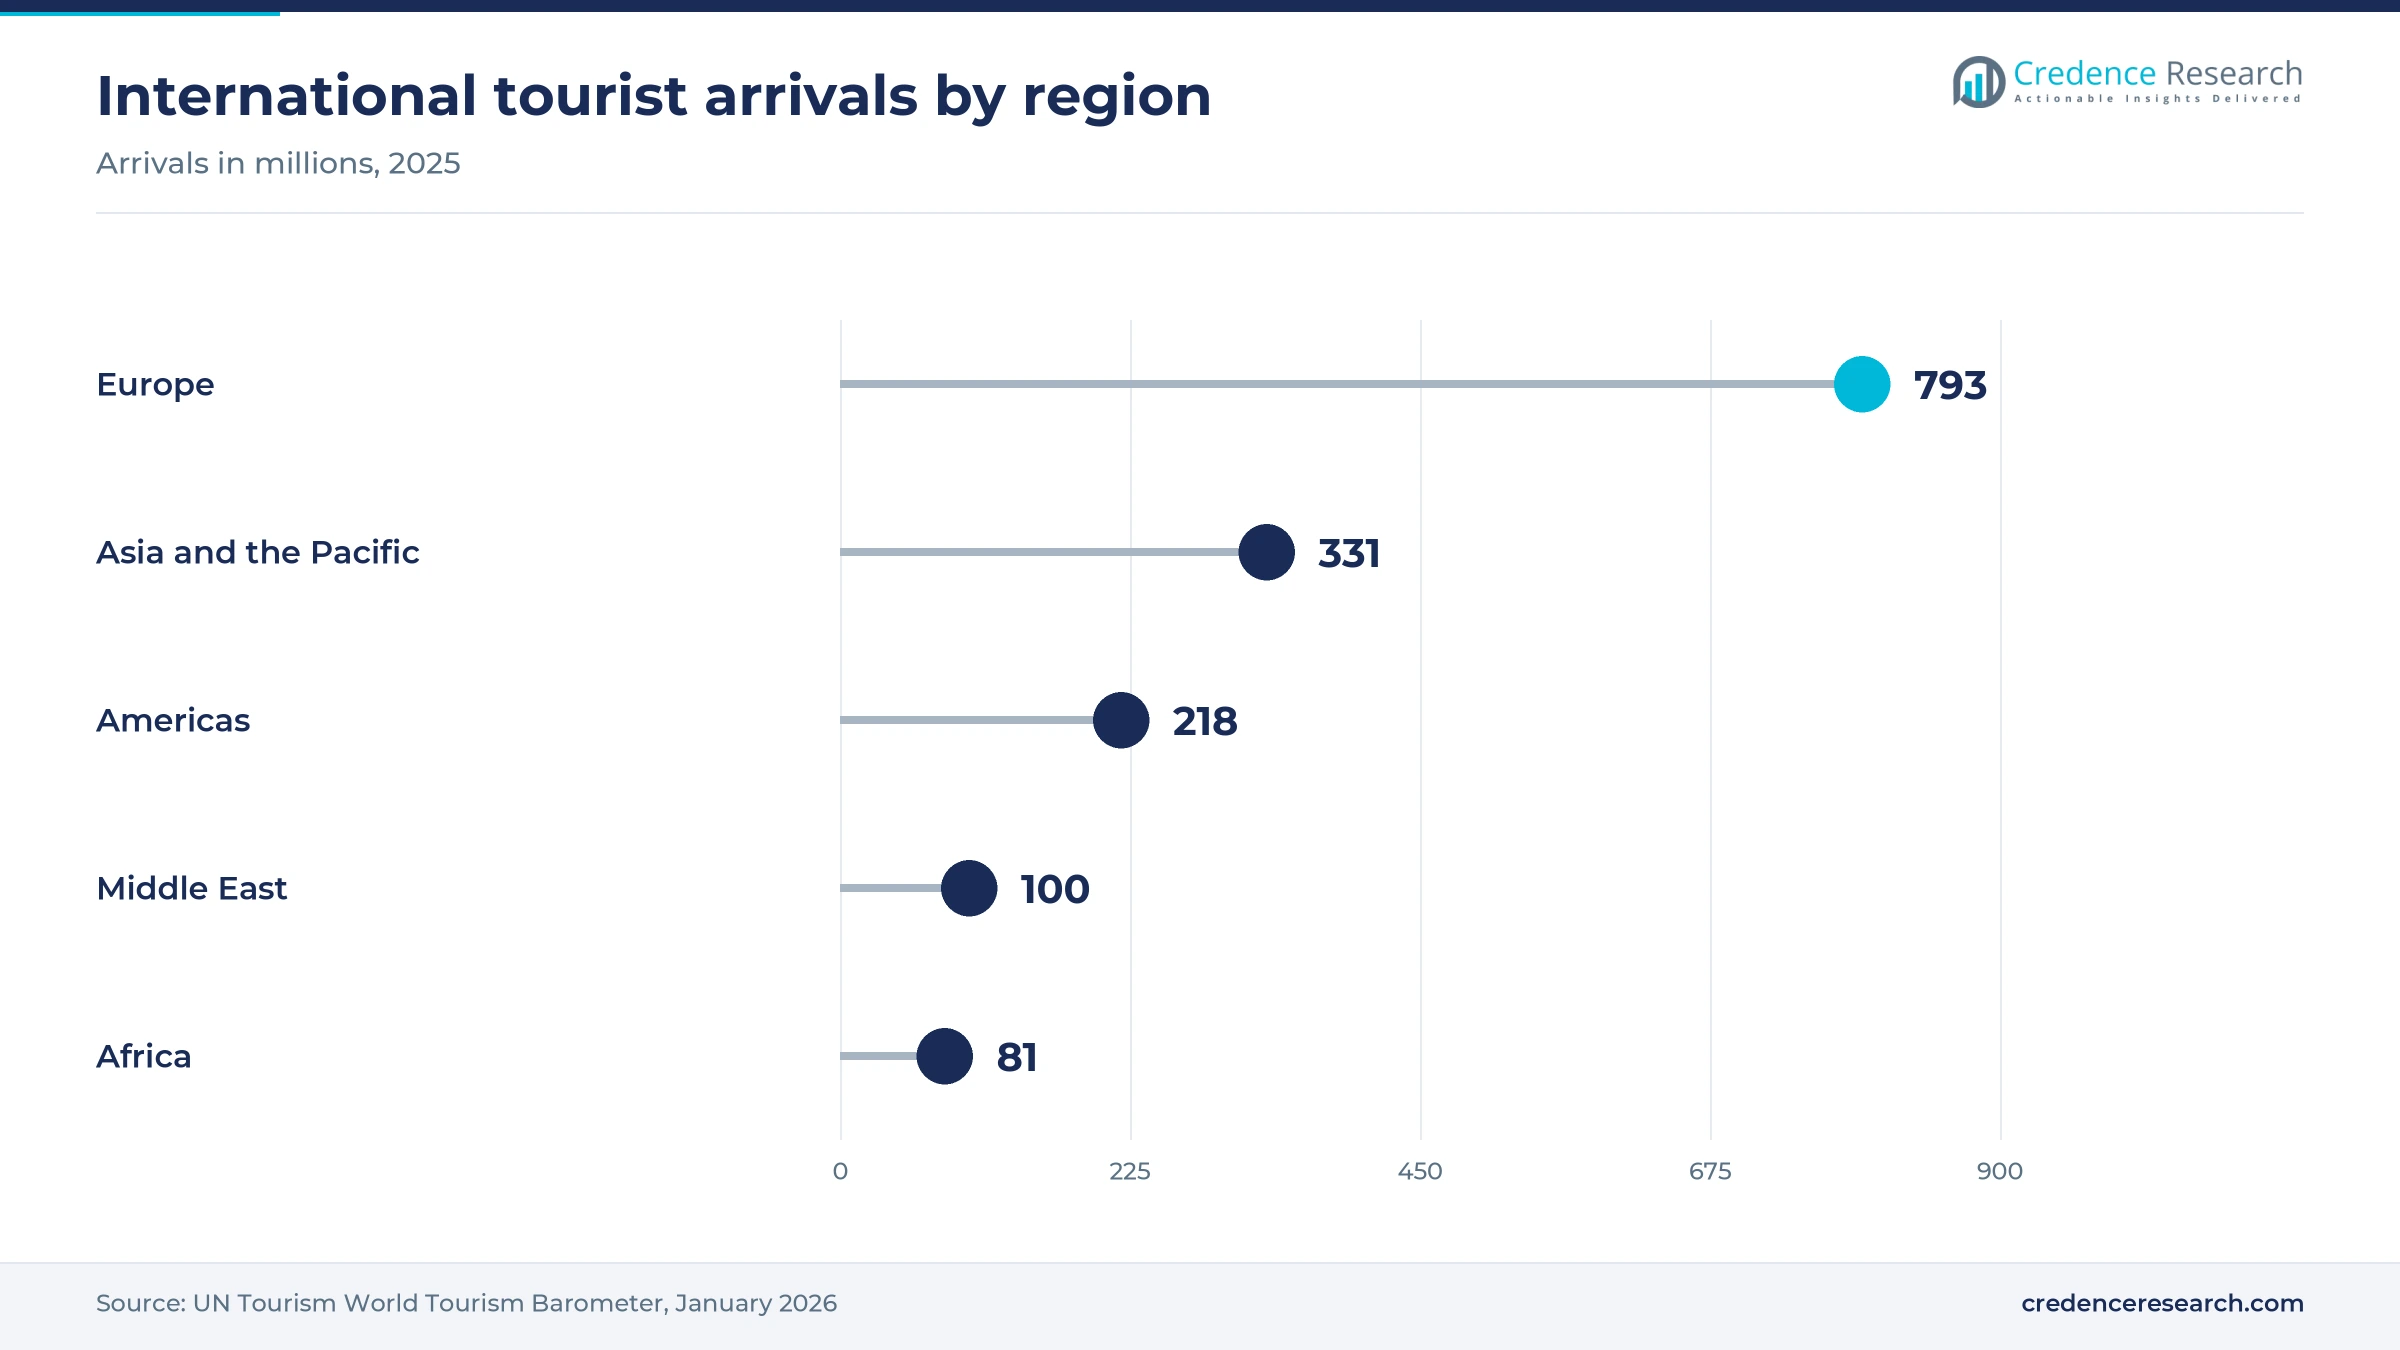
Immersive venues now sit on tourist itineraries, so growth in travel lifts paid visits to the largest sites. UN News reported that international tourist arrivals reached 1.52 billion in 2025, a record, and UN Tourism data showed Asia and the Pacific up 6% to 331 million arrivals. In Tokyo, teamLab Planets and teamLab Borderless together drew more than 4.2 million visitors in 2025. The Art Newspaper ranked teamLab Borderless 42nd among the most visited art museums worldwide in 2025, up from 52nd in 2024, according to JCN Newswire. In the Credence Research model this driver adds about 2.59 percentage points to annual growth to 2035, with the largest effect on international tourists.
Laser projection and sensors make formats repeatable
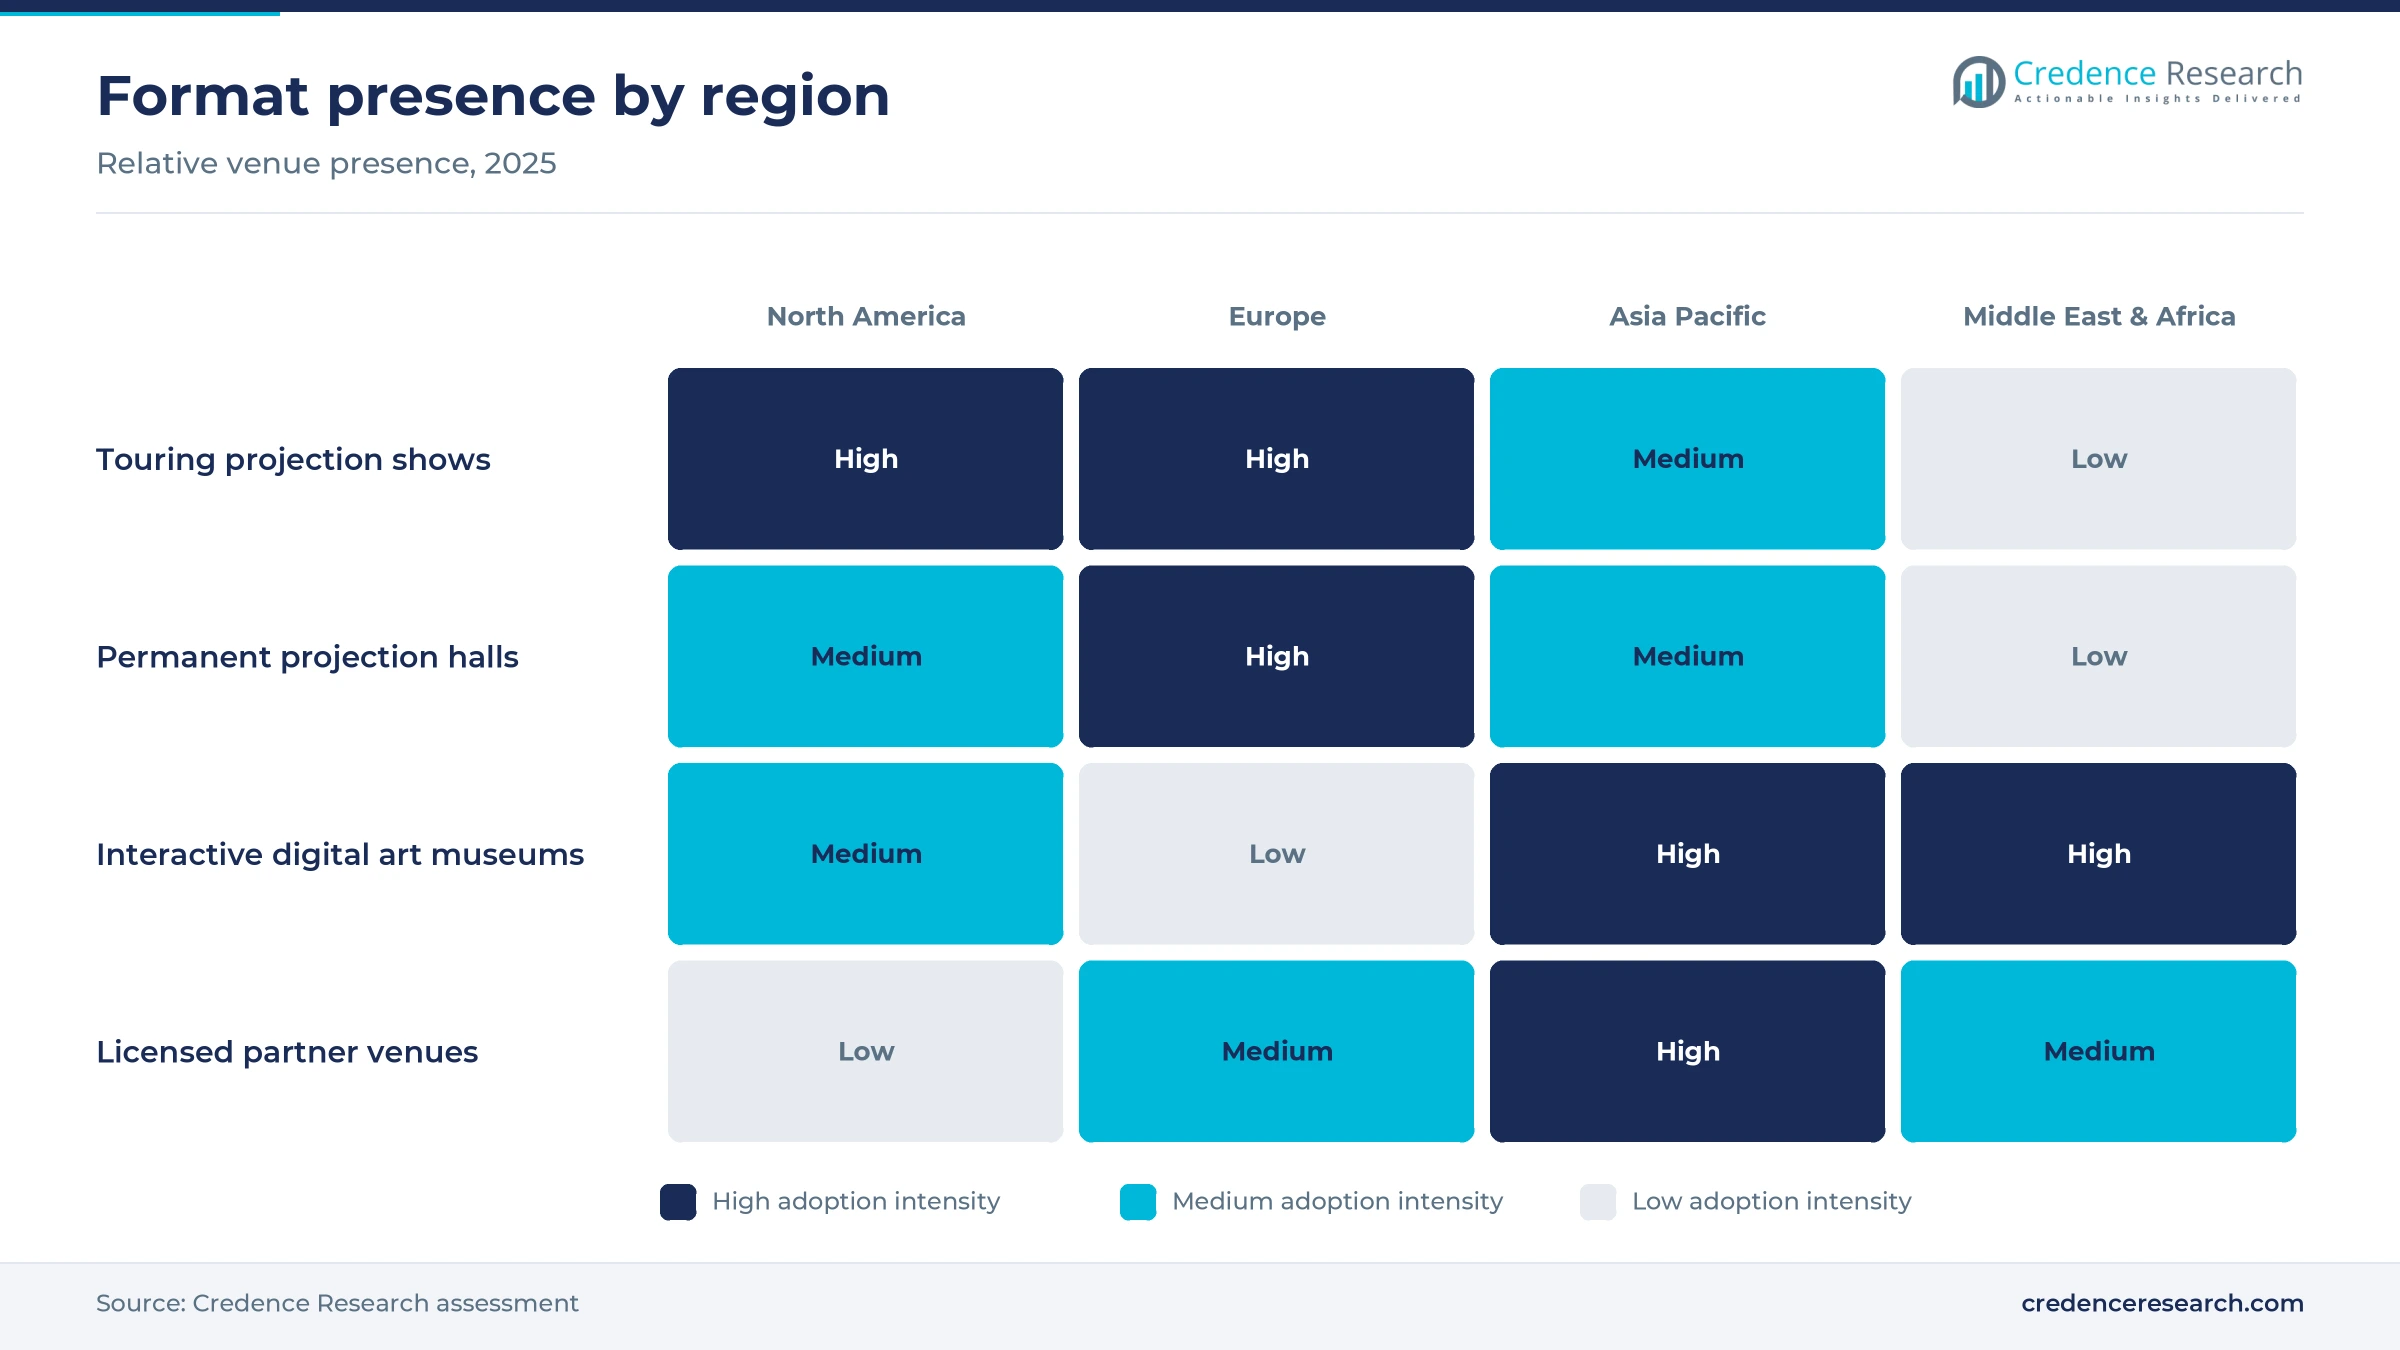
Laser projectors, media servers and motion sensors let operators run the same show in many halls and refresh content without rebuilding the room. Barco supplied 76 projectors for Arte Museum Dubai, which opened in Dubai Mall on March 11, 2024, according to a Barco press release, and the company said Arte Museum sites had drawn more than 6.2 million visitors across six locations. Culturespaces lists more than 100 projectors and 60 speakers over a 3,120-square-meter surface for Port des Lumieres in Hamburg on its own website. The Azabudai Hills museum also carries Epson as its naming partner. In the Credence Research model technology adds about 1.89 percentage points to annual growth to 2035, mainly in interactive digital art.
Ticket bundles and touring shows widen audiences
Touring productions and platform-led ticket sales take digital art shows to cities that cannot support a permanent hall. Exhibition Hub, which stages Van Gogh The Immersive Experience with ticketing platform Fever, reported more than 35 million visitors across its experiences in November 2024. Lighthouse Immersive sold more than 7 million tickets across 21 North American cities before its 2023 restructuring, according to Blooloop. Venues also use bundled offers, and teamLab SuperNature Macao ran buy-one-get-one-free tickets in July 2025, according to Sands Resorts Macao. In the Credence Research model these bundles and tours add about 1.40 percentage points to annual growth to 2035.
Gulf culture programs fund large permanent venues
Governments in Saudi Arabia and the UAE now fund large digital art venues as part of tourism and culture plans. teamLab Borderless Jeddah opened on June 10, 2024 with about 10,000 square meters of floor area, under the Quality of Life Programme of Saudi Vision 2030 with the Ministry of Culture. teamLab Phenomena Abu Dhabi opened on April 18, 2025, in the Saadiyat Cultural District, as announced by Miral and the Department of Culture and Tourism. Arte Museum Dubai added about 30,000 square feet in Dubai Mall in 2024. For this reason, Middle East & Africa is the fastest-growing region in the immersive art exhibition market in the Credence Research model.
Large interactive museums replace pop-up projection halls
Shift from pop-up halls to large interactive museums
Operators are shifting capital from short-run projection halls to large permanent museums with interactive works. The UBS Digital Art Museum in Hamburg will host a 6,500-square-meter teamLab show in 2026, which designboom called the largest teamLab presentation in Europe to date. teamLab Borderless Jeddah opened with more than 80 interactive artworks in 2024. At the same time, the Hall des Lumieres in New York paused art shows in February 2024 and hosted private events instead, according to ARTnews. As a result, interactive digital art grows at 8.01% a year in the Credence Research model, faster than projection-only formats such as touring Van Gogh shows.
Rise of licensed venue networks across countries
Studios are rising as licensors that place their brands with local partners instead of building every venue alone. Culturespaces counted Amsterdam, New York, Seoul, Jeju, Dortmund and Hamburg before choosing Tokyo as its seventh international location, according to EAP Magazin in October 2025. Its Tokyo venue covers 1,200 square meters in Tokyo Dream Park with broadcaster TV Asahi as partner. The Van Gogh show in Paris drew 1.7 million visitors, which gives partners a tested title. Because local partners carry the rent, fit-out and marketing costs, licensing grows at 8.30% a year in the Credence Research model, faster than tickets or merchandise.
Gulf and Asian tourism hubs open room for new sites
Tourism hubs in the Gulf and Asia offer an opening for new permanent venues sized for international visitors. teamLab Borderless in Tokyo welcomed 4 million visitors, about 70% of them from abroad, by August 2026, according to Holiday Travel. teamLab Phenomena Abu Dhabi opened in April 2025 in the Saadiyat Cultural District, and teamLab Borderless Jeddah sits in a UNESCO World Heritage district. UN Tourism data also put Middle East arrivals at nearly 100 million in 2025, up 3%. For these reasons, Asia Pacific keeps the largest regional share of the immersive art exhibition market, while Middle East & Africa grows fastest to 2035.
Platform ticketing creates room in Latin America
Ticketing platforms and touring producers have an opening to take shows into Latin American cities with few permanent halls. Fever raised $250 million in September 2026 in a round led by EQT and operates in 55 countries, according to Music Business Worldwide. Fever has sold Van Gogh The Immersive Experience in Mexico City, and the Baja California government reported record attendance in Mexicali in February 2025, including more than 10,000 children and teenagers. Brazil also received more than 9.3 million foreign visitors in 2025, according to UN News. As a result, Latin America grows at 7.61% a year in the Credence Research model, ahead of North America.
Novelty fatigue and high fixed costs close weaker venues
Novelty fatigue closes high-overhead projection halls
Repeat visits are rare because most shows last 30 to 45 minutes, according to Casino.org, and crowded cities have seen closures. Five Las Vegas venues closed in about two and a half years, including Lighthouse ArtSpace on Jan. 31, 2026, and Illuminarium at AREA15 on March 6, 2026, according to Casino.org. Landlords and staff lose income when these halls close earlier than their lease terms planned. Operators now refresh content every season and add bars, events and live performance to lift repeat visits.
Insolvency risk hits landlords and ticket buyers
Rapid expansion during 2021 and 2022 left some producers with heavy lease commitments they could not meet. Lighthouse Immersive filed for U.S. bankruptcy protection on July 28, 2023, alongside Canadian restructuring, according to Blooloop. In Detroit, the company owed its landlord more than $300,000, and the landlord recovered only $50,000, according to Metro Times. Its Detroit, Houston and Atlanta venues later closed, according to ARTnews. Landlords now ask for stronger guarantees, and producers favor shorter touring runs.
High fixed costs raise the break-even attendance
Permanent venues carry large upfront costs for projectors, servers, sound and fit-out before the first ticket is sold. Bassins des Lumieres needed more than 100 laser projectors to cover almost 14,000 square meters, and Port des Lumieres in Hamburg uses more than 100 projectors and 60 speakers. Hall des Lumieres in New York paused its art exhibitions, a move that an NYU professor told ARTnews could avoid heavy new technology spending. Operators respond by sharing rigs across licensed shows and renting halls for private events.
Dependence on tourist flows exposes venue revenue
Venues that depend on first-time visitors are exposed when tourist numbers soften in a given city. Las Vegas visitation fell 7.5% in 2025, which hurt attractions that rely on first-time visitors, according to Casino.org. UN Tourism data also showed arrivals to the Americas up only 1% in 2025, against 6% growth in Asia and the Pacific. North American operators therefore grow more slowly, and many now sell more school, local and corporate packages to fill weekdays.
Asia Pacific leads while the Gulf grows fastest
| Region | Value, 2025 (USD billion) | Share, 2025 | CAGR, 2026–2035 |
|---|---|---|---|
| Asia Pacific | 0.38 | 32.0% | 7.41% |
| North America | 0.36 | 30.0% | 6.41% |
| Europe | 0.36 | 30.0% | 6.81% |
| Latin America | 0.05 | 4.0% | 7.61% |
| Middle East & Africa | 0.05 | 4.0% | 8.61% |
Asia Pacific leads on Tokyo, Macao and Korean venues
Asia Pacific held 32.0% of 2025 value and grows at 7.41% a year. teamLab Planets drew about 2.51 million visitors in 2025, and teamLab Borderless added about 1.69 million in Tokyo. teamLab SuperNature Macao runs a 5,000-square-meter permanent show at The Venetian Macao, which marked its fifth anniversary in July 2025. Culturespaces already runs venues in Seoul and Jeju, and its Tokyo site with TV Asahi adds another large Asian city to the network. Japan alone supplies the largest single-country demand in the region, with teamLab's Tokyo museums drawing about 4.2 million paid visits in 2025.
North America consolidates after a wave of closures
North America held 30.0% of 2025 value and grows at 6.41% a year, the slowest of any region. Lighthouse Immersive had 24 permanent ArtSpace venues in 2023, according to Blooloop, but its website later listed only Toronto, Chicago and Las Vegas, according to Metro Times. Meow Wolf announced in May 2024 a sixth permanent venue in a former cinema at Howard Hughes Los Angeles, according to Blooloop. Arte Museum Las Vegas and Fever touring shows also serve visitors drawn by casino tourism on the Strip.
Europe grows on the Lumieres network and Hamburg
Europe held 30.0% of 2025 value and grows at 6.81% a year. Culturespaces runs Atelier des Lumieres in Paris, where its Van Gogh show drew 1.7 million visitors, and Bassins des Lumieres in Bordeaux. Hamburg is becoming a second hub, with Port des Lumieres in HafenCity and the 6,500-square-meter UBS Digital Art Museum due in 2026. In London, Frameless planned four galleries across 30,000 square feet at Marble Arch Place, according to Blooloop.
Latin America grows on touring Van Gogh shows
Latin America held 4.0% of 2025 value and grows at 7.61% a year. Touring producers lead the region, and Blast Entertainment staged Van Gogh Live 8K in Sao Paulo in a 2,800-square-meter space after more than 1 million people saw it since its Rio de Janeiro premiere, according to Latamarte. In Mexico, the Baja California government reported record attendance for Van Gogh The Immersive Experience in Mexicali in February 2025.
Middle East & Africa is the fastest-growing region
Middle East & Africa held 4.0% of 2025 value and grows at 8.61% a year, the fastest of any region. teamLab Borderless Jeddah, teamLab Phenomena Abu Dhabi and Arte Museum Dubai all opened between March 2024 and April 2025. These venues sit inside state-backed culture districts or major malls, and they compete with amusement parks for family leisure spending in the Gulf.
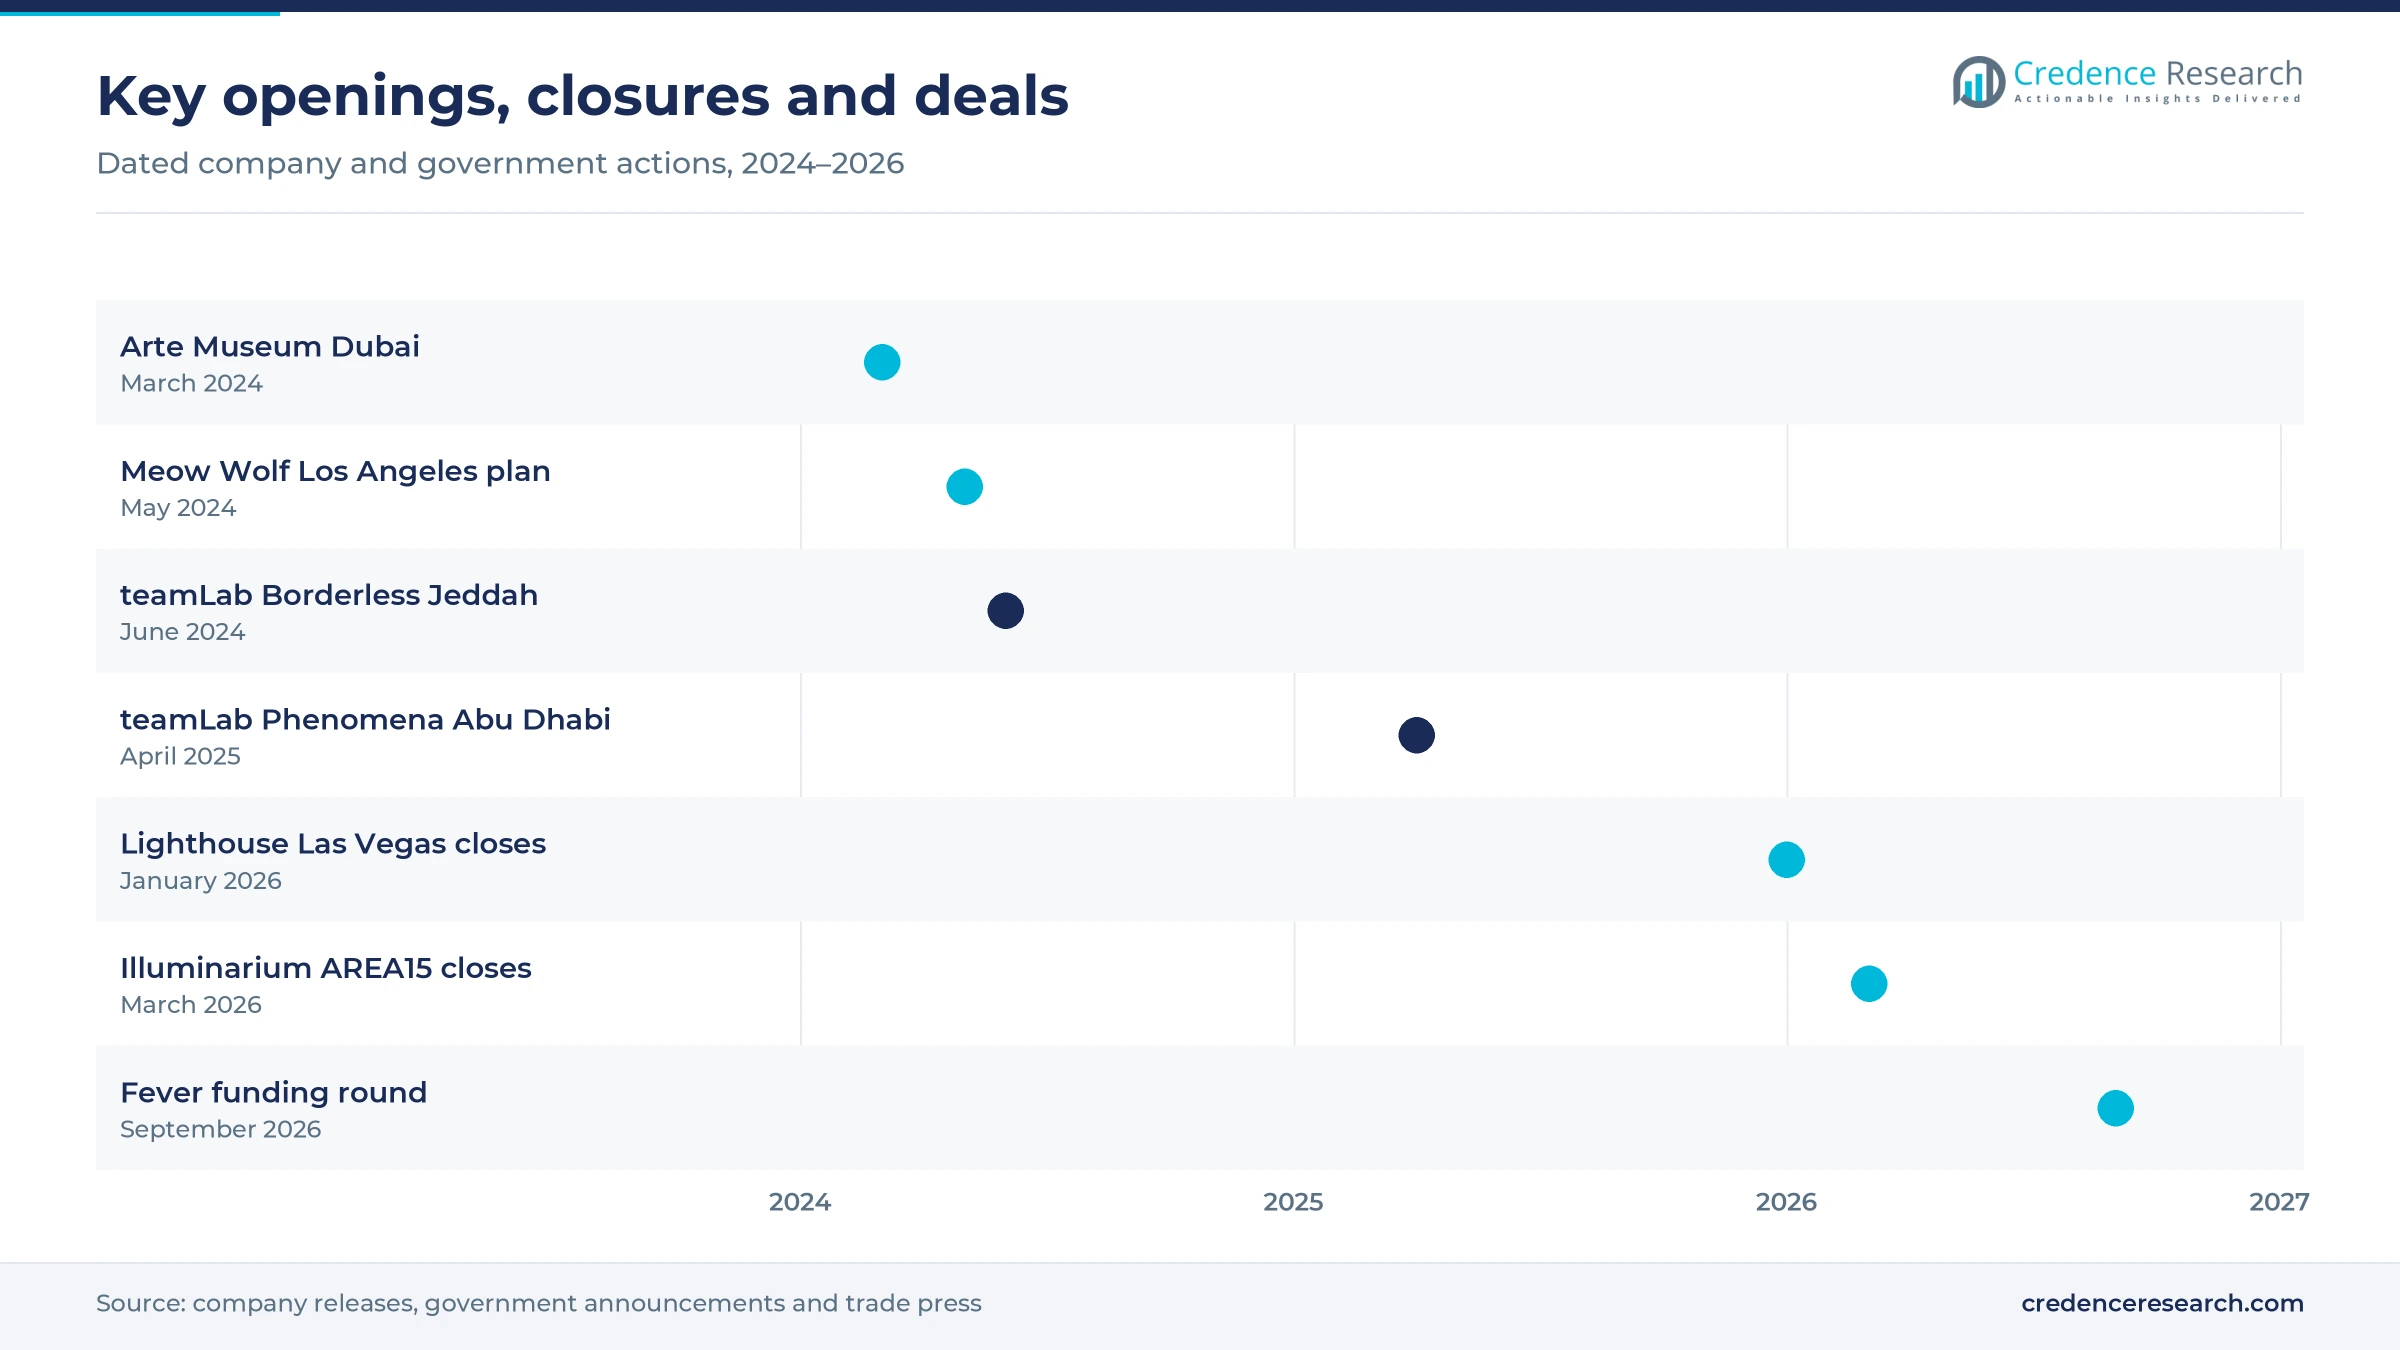
Gulf openings, closures and funding since 2024
| Development | Status and market relevance |
|---|---|
| In March 2024, d'strict opened Arte Museum Dubai in Dubai Mall, a 30,000-square-foot venue run on 76 Barco projectors. | Open; it brought the Arte Museum network to six locations worldwide. |
| In June 2024, teamLab and the Saudi Ministry of Culture opened teamLab Borderless Jeddah in the Jeddah Historic District. | Open; it is the first teamLab Borderless museum in the Middle East, with about 10,000 square meters of floor area. |
| In April 2025, teamLab Phenomena Abu Dhabi opened to the public in the Saadiyat Cultural District. | Open; it adds a permanent interactive venue to the Abu Dhabi culture program. |
| In March 2026, Illuminarium at AREA15 in Las Vegas closed to the public after nearly four years. | Closed; the space is being rebuilt as an AYA Universe attraction due by the end of 2026. |
| In September 2026, Fever raised $250 million in a funding round led by EQT, with Baillie Gifford also investing. | Completed; it funds expansion of the platform that sells many touring digital art shows. |
Laser projectors and sensors run the gallery floor
- Laser projectors replace lamp units in large halls, and Bassins des Lumieres runs Barco F80-Q12, G60-W10 and UDX-W32 models across almost 14,000 square meters.
- Motion sensors track visitors so that interactive works respond to touch and movement, which teamLab uses across more than 80 works in Jeddah.
- Media servers and spatial audio synchronize thousands of moving images with sound, and Port des Lumieres pairs more than 100 projectors with 60 speakers.
- Timed online booking spreads visitors across the day through online event ticketing platforms such as Fever, which operates in 55 countries.
Need a Custom Version of This Report?
Tailor the scope, geography, or segments to your exact requirements.
- Custom geography or segment scope
- Direct access to our analyst team
Studios, venue chains and ticket platforms compete
Competition is fragmented, with a few large content studios, regional venue chains and many touring producers. teamLab leads interactive digital art through company-run museums in Tokyo and partner venues in Jeddah, Abu Dhabi, Macao and Hamburg. Culturespaces runs the Lumieres network of projection halls in France and licenses its shows to partners in Asia and Germany. d'strict operates Arte Museum sites in Korea, Las Vegas and Dubai, while Meow Wolf builds story-led permanent venues in the United States. Fever and Exhibition Hub dominate touring Van Gogh shows, and Frameless competes in London with a permanent four-gallery site. Operators compete on original content, venue location, projection quality and ticket distribution. Visitor and collection tools sold as museum software also reach these venues. Lighthouse Immersive now focuses on touring productions after closing several halls. Arte Museum sites had drawn more than 6.2 million visitors across six locations by March 2024, which places d'strict among the largest interactive digital art operators by demand.
Companies profiled and their roles in this market
| Company | Type | Role in the market |
|---|---|---|
| teamLab | Content studio and museum operator | Runs Tokyo museums and partner venues in Jeddah, Abu Dhabi and Macao |
| Culturespaces | Projection venue operator | Runs the Lumieres network and licenses shows in Asia and Germany |
| Fever | Ticketing platform and producer | Sells and co-produces touring shows in 55 countries |
| Lighthouse Immersive | Touring producer | Sold 7 million tickets and now focuses on touring productions |
| Frameless | Permanent venue operator | Runs a four-gallery digital art venue at Marble Arch in London |
| d'strict | Content studio and venue operator | Runs six Arte Museum venues including Las Vegas and Dubai |
| Meow Wolf | Permanent venue operator | Plans its sixth permanent venue in Los Angeles |
Permanent sites near tourist flows will win to 2035
Credence Research's view is that large permanent sites near strong tourist flows will take most of the growth in the immersive art exhibition market to 2035. Tokyo, Jeddah, Abu Dhabi and Hamburg show that state partners, landlords and sponsors will fund big venues when visitor numbers are proven. The Las Vegas closures show that small projection halls with one show and no repeat reason are exposed. Licensing will grow faster than tickets because studios can place tested titles with partners. Operators with original content, strong platform distribution and flexible event use are better placed than single-title venues.
How Credence Research sized the market
The report uses 2025 as the base year and forecasts to 2035, with 2026 to 2035 as the growth period. Market values come from the Credence Research model, built from venue counts, published visitor numbers, ticket prices and secondary spend per visit by region. Regional and segment shares are Credence Research estimates built from venue counts by country. Sources used include company press releases, government and tourism board announcements, UN Tourism arrival statistics, projector supplier case studies and trade press coverage of openings, closures and funding. No interviews or surveys were conducted for this edition of the report.
Gulf, Tokyo and Hamburg sites carry growth to 2035
The immersive art exhibition market is expected to reach USD 2.39 billion by 2035 as large permanent venues open in the Gulf, Tokyo and Hamburg. The UBS Digital Art Museum and the Culturespaces Tokyo venue add new capacity in 2026, while Gulf culture districts keep adding attractions. However, growth in North America will stay slower after the Las Vegas closures. Licensing and touring partnerships will let studios reach new cities with less capital, so the format is likely to spread through partners rather than through company-owned halls alone.
Frequently Asked Questions
How big is the immersive art exhibition market?
Which region leads the market?
Which region grows fastest?
Which format holds the largest share?
Which revenue source grows fastest?
What are the main drivers of the market?
What are the main challenges?
Who are the key companies in the market?
Table of Content
Chapter 1 Market Segmentation
- 1.1 Segmentation Framework
- 1.1.1 Product and Service Classification
- 1.1.2 Application and End-Use Classification
- 1.1.3 Technology and Solution Classification
- 1.1.4 Customer and Distribution Channel Classification
- 1.1.5 Geographic Segmentation
- 1.1.6 Market Segment Definitions and Boundaries
- 1.2 By Format
- 1.2.1 Permanent Venues
- 1.2.2 Interactive Digital Art
- 1.2.3 Touring Projection Shows
- 1.3 By Revenue Source
- 1.3.1 Tickets
- 1.3.2 Merchandise
- 1.3.3 Licensing
- 1.4 By Visitor Type
- 1.4.1 Domestic Visitors
- 1.4.2 International Tourists
Chapter 2 Introduction
- 2.1 Report Objectives and Scope
- 2.2 Product Definition and Industry Terminology
- 2.3 Market Inclusions and Exclusions
- 2.4 Research Process
- 2.4.1 Primary Research and Expert Interviews
- 2.4.2 Secondary Research and Source Review
- 2.4.3 Top-Down and Bottom-Up Estimation
- 2.4.4 Data Triangulation and Verification
- 2.5 Market Size Measurement Basis
- 2.5.1 2025: USD 1.20 billion → 2035: USD 2.39 billion
- 2.6 Historical and Forecast Reference Periods
- 2.6.1 Historical Period: 2018-2025
- 2.6.2 Base Year: 2025
- 2.6.3 Forecast Period: 2025-2035
- 2.7 Research Assumptions and Limitations
Chapter 3 Executive Summary
- 3.1 Market Snapshot and Key Findings
- 3.2 Base-Year Market Size, 2025
- 3.3 Forecast Market Size, 2035
- 3.4 Revenue and Volume Growth Outlook
- 3.5 Key Demand and Supply Indicators
- 3.6 Leading Market Segments
- 3.7 Fastest-Growing Market Opportunities
- 3.8 Regional Performance Highlights
- 3.9 Technology and Industry Transformation
- 3.10 Competitive Landscape Summary
- 3.11 Analyst View and Strategic Implications
Chapter 4 Global Immersive Art Exhibition Market Trends and Developments
- 4.1 Historical Industry Development, 2018-2025
- 4.2 Recent Market Trends and Developments
- 4.3 Demand and Customer Behavior Trends
- 4.4 Technology and Product Innovation
- 4.5 Artificial Intelligence, Automation and Digitalization
- 4.6 Local Manufacturing and Supply Chain Realignment
- 4.7 Industry Partnerships, Mergers and Acquisitions
- 4.8 Sustainability and Circular Economy Developments
- 4.9 Government and Private Sector Investment Trends
- 4.10 Emerging Business Models and Commercialization
- 4.11 Industry Developments and Announcements
Chapter 5 Global Immersive Art Exhibition Market Supply and Demand Analysis
- 5.1 Demand Trend and Consumption Analysis, 2018-2025
- 5.2 Demand Forecast, 2025-2035
- 5.3 Supply Chain Structure and Procurement Trends
- 5.4 Supply-Demand Gap and Bottlenecks
- 5.5 Import Dependence and Sourcing Structure
- 5.6 Regional Supply and Demand Concentration
Chapter 6 Global Immersive Art Exhibition Market Pricing Analysis
- 6.1 Pricing Structure and Measurement
- 6.2 Historical Pricing Trends, 2018-2025
- 6.3 Pricing Outlook, 2025-2035
- 6.4 Pricing by Product and Market Segment
- 6.5 Geographic Pricing Differences
- 6.6 Key Input, Energy, Labor and Logistics Costs
- 6.7 Contract Pricing and Purchasing Models
- 6.8 Pricing Sensitivity and Competitive Positioning
- 6.9 Price, Margin and Profitability Implications
Chapter 7 Global Immersive Art Exhibition Market Dynamics
- 7.1 Market Growth Drivers
- 7.1.1 Demand-Side Drivers
- 7.1.2 Technology and Innovation Drivers
- 7.1.3 Infrastructure and Investment Drivers
- 7.1.4 Regulatory and Policy Drivers
- 7.2 Market Restraints
- 7.2.1 Cost and Affordability Constraints
- 7.2.2 Technology and Adoption Barriers
- 7.2.3 Supply Chain and Operational Constraints
- 7.3 Market Challenges
- 7.3.1 Competitive Pressure and Margin Erosion
- 7.3.2 Skills, Infrastructure and Implementation Gaps
- 7.4 Emerging Market Opportunities
- 7.5 Market Dynamics Impact and Time-Horizon Assessment
Chapter 8 Global Immersive Art Exhibition Value Chain Analysis
- 8.1 Industry Value Chain Overview
- 8.2 Upstream Suppliers and Critical Inputs
- 8.3 Technology and Component Providers
- 8.4 Manufacturing or Service Delivery
- 8.5 Distribution, Channel Partners and Integrators
- 8.6 Downstream Applications and End Users
- 8.7 Value Addition and Profit Pools
- 8.8 Vertical Integration and Outsourcing
- 8.9 Supplier Concentration and Risk
- 8.10 Supply Chain Localization and Resilience
Chapter 9 Global Immersive Art Exhibition Market Regulations and Policies
- 9.1 Relevant Laws, Standards and Compliance Frameworks
- 9.2 Product, Service, Safety and Quality Requirements
- 9.3 Government Policies, Incentives and Subsidies
- 9.4 Imports, Exports and Trade Barriers
- 9.5 Public Procurement and Local Content Requirements
- 9.6 Data Protection, AI and Cybersecurity Compliance
- 9.7 Upcoming Policy Changes and Market Implications
Chapter 10 Global Immersive Art Exhibition Market Hotspots and Opportunities
- 10.1 Market Opportunity Mapping and Growth Hotspots
- 10.2 High-Growth Applications and Customer Groups
- 10.3 Underserved Markets and White-Space Opportunities
- 10.4 Emerging Technology and Product Opportunities
- 10.5 New Capacity and Investment Hotspots
- 10.6 Market Entry and Expansion Opportunities
- 10.7 Distribution and Partnership Opportunities
- 10.8 Near-Term and Long-Term Commercial Potential
- 10.9 Opportunity Attractiveness and Execution Risks
Chapter 11 Global Immersive Art Exhibition Market Outlook, 2025-2035
- 11.1 Market Size and Analysis
- 11.1.1 Revenue (Market Measurement: 2025: USD 1.20 billion → 2035: USD 2.39 billion)
- 11.1.2 Historical Market Size, 2018-2025
- 11.1.3 Base-Year Market Size, 2025
- 11.2 Market Forecast, 2025-2035
- 11.2.1 Revenue Forecast to 2035
- 11.2.2 CAGR and Year-on-Year Growth
- 11.2.3 Incremental Revenue Opportunity
- 11.3 Forecast Assumptions and Scenario Analysis
- 11.3.1 Base-Case Forecast
- 11.3.2 Optimistic and Conservative Scenarios
- 11.3.3 Technology, Pricing and Policy Sensitivities
- 11.4 Market Attractiveness and Growth Outlook
Chapter 12 Global Immersive Art Exhibition Market Segmentation and Outlook
- 12.1 Segmentation Summary and Market Shares, 2025
- 12.2 Largest and Fastest-Growing Segments
- 12.3 By Format - Market Size and Forecast, 2025-2035
- 12.3.1 Segment Definition and Scope
- 12.3.2 Historical Market Size, 2018-2025
- 12.3.3 Revenue Forecast, 2025-2035
- 12.3.4 Base-Year Market Share, 2025
- 12.3.5 Segment CAGR and Growth Drivers
- 12.3.6 Subsegment Market Size and Forecast
- 12.3.6.1 Permanent Venues
- 12.3.6.2 Interactive Digital Art
- 12.3.6.3 Touring Projection Shows
- 12.3.7 Subsegment Pricing and Adoption Trends
- 12.3.8 Leading Suppliers and Competition
- 12.3.9 Regional Demand and Opportunities
- 12.4 By Revenue Source - Market Size and Forecast, 2025-2035
- 12.4.1 Segment Definition and Scope
- 12.4.2 Historical Market Size, 2018-2025
- 12.4.3 Revenue Forecast, 2025-2035
- 12.4.4 Base-Year Market Share, 2025
- 12.4.5 Segment CAGR and Growth Drivers
- 12.4.6 Subsegment Market Size and Forecast
- 12.4.6.1 Tickets
- 12.4.6.2 Merchandise
- 12.4.6.3 Licensing
- 12.4.7 Subsegment Pricing and Adoption Trends
- 12.4.8 Leading Suppliers and Competition
- 12.4.9 Regional Demand and Opportunities
- 12.5 By Visitor Type - Market Size and Forecast, 2025-2035
- 12.5.1 Segment Definition and Scope
- 12.5.2 Historical Market Size, 2018-2025
- 12.5.3 Revenue Forecast, 2025-2035
- 12.5.4 Base-Year Market Share, 2025
- 12.5.5 Segment CAGR and Growth Drivers
- 12.5.6 Subsegment Market Size and Forecast
- 12.5.6.1 Domestic Visitors
- 12.5.6.2 International Tourists
- 12.5.7 Subsegment Pricing and Adoption Trends
- 12.5.8 Leading Suppliers and Competition
- 12.5.9 Regional Demand and Opportunities
- 12.6 Segment Growth Comparison
- 12.7 Segment Attractiveness and Priority Matrix
Chapter 13 Global Immersive Art Exhibition Geographic Market Outlook, 2025-2035
- 13.1 Regional Market Size and Share, 2025
- 13.2 Regional Market Forecast, 2025-2035
- 13.3 Regional Pricing, Production and Demand Differences
- 13.4 North America
- 13.4.1 United States
- 13.4.2 Canada
- 13.4.3 Mexico
- 13.5 Europe
- 13.5.1 Germany
- 13.5.2 France
- 13.5.3 Italy
- 13.5.4 United Kingdom
- 13.5.5 Spain
- 13.5.6 Poland
- 13.5.7 Russia
- 13.5.8 Netherlands
- 13.5.9 Belgium
- 13.5.10 Sweden
- 13.5.11 Denmark
- 13.5.12 Norway
- 13.5.13 Rest of Europe
- 13.6 Asia Pacific
- 13.6.1 China
- 13.6.2 India
- 13.6.3 Japan
- 13.6.4 South Korea
- 13.6.5 Thailand
- 13.6.6 Indonesia
- 13.6.7 Vietnam
- 13.6.8 Malaysia
- 13.6.9 Australia
- 13.6.10 Rest of Asia Pacific
- 13.7 Latin America
- 13.7.1 Brazil
- 13.7.2 Argentina
- 13.7.3 Colombia
- 13.7.4 Chile
- 13.7.5 Rest of Latin America
- 13.8 Middle East
- 13.8.1 Saudi Arabia
- 13.8.2 United Arab Emirates
- 13.8.3 Turkey
- 13.8.4 Israel
- 13.8.5 Iran
- 13.8.6 Rest of the Middle East
- 13.9 Africa
- 13.9.1 South Africa
- 13.9.2 Egypt
- 13.9.3 Nigeria
- 13.9.4 Morocco
- 13.9.5 Rest of Africa
- 13.10 Regional Investment, Policy and Supply Chain Differences
- 13.11 Regional Competitive Landscape
- 13.12 Geographic Growth Hotspots
Chapter 14 Global Immersive Art Exhibition Technology, Innovation and Sustainability Outlook
- 14.1 Technology Landscape and Maturity
- 14.2 Product, Process and Service Innovation
- 14.3 AI, Automation and Digital Tools in the Industry
- 14.4 Technology Adoption and Performance Benchmarking
- 14.5 Innovation Pipeline and R&D Investment
- 14.6 Energy Efficiency and Resource Management
- 14.7 Sustainability, Recycling and Circularity
- 14.8 Technology Roadmap, 2025-2035
- 14.9 Risks of Obsolescence and Technology Substitution
Chapter 15 Global Immersive Art Exhibition Market Key Strategic Imperatives
- 15.1 Growth and Market Entry Priorities
- 15.2 High-Return Products and Segments
- 15.3 Pricing, Profitability and Cost Optimization
- 15.4 Technology Investment and Product Differentiation
- 15.5 Supply Chain Localization and Resilience
- 15.6 Distribution and Customer Acquisition
- 15.7 Partnership, Acquisition and Capacity Strategy
- 15.8 Regional Expansion Priorities
- 15.9 Short-, Medium- and Long-Term Actions
Chapter 16 Competition Outlook
- 16.1 Industry Competition Characteristics
- 16.2 Market Structure and Concentration
- 16.3 Market Share and Competitive Positioning, 2025
- 16.4 Company-Wise Revenue and Product Benchmarking
- 16.5 Production and Service Capacity Benchmarking
- 16.6 Technology, Pricing and Differentiation
- 16.7 Regional Footprint and Distribution Strength
- 16.8 Mergers, Acquisitions and Strategic Alliances
- 16.9 New Entrants and Competitive Threats
- 16.10 Porter's Five Forces and Industry Attractiveness
- 16.11 Competitive Outlook, 2025-2035
Chapter 17 Company Profiles
- 17.1 Company Coverage and Selection Criteria
- 17.2 teamLab
- 17.2.1 Business Description
- 17.2.2 Company Ownership and Geographic Presence
- 17.2.3 Product and Service Portfolio
- 17.2.4 Manufacturing and Operating Footprint
- 17.2.5 Financial Performance and Investment
- 17.2.6 Market Share and Competitive Position
- 17.2.7 Technology and Innovation Capabilities
- 17.2.8 Strategic Alliances or Partnerships
- 17.2.9 Recent Developments
- 17.2.10 Growth Strategy and Outlook
- 17.3 Lighthouse Immersive
- 17.4 Fever
- 17.5 Culturespaces
- 17.6 Frameless
- 17.7 d'strict
- 17.8 Meow Wolf
- 17.9 Other Relevant Market Participants
Note: Every listed company is profiled on the structure shown under the first company. The company list is preliminary and may change based on research findings, market developments, data availability and client requirements.
Chapter 18 Disclaimer
- 18.1 Research and Forecast Disclaimer
- 18.2 Data Source and Estimation Limitations
Note: The depth of individual sections depends on data availability for this market. Volume, capacity, trade and other unit-based metrics are included where applicable.

