
Golf bays, darts and shuffleboard turn bars into play
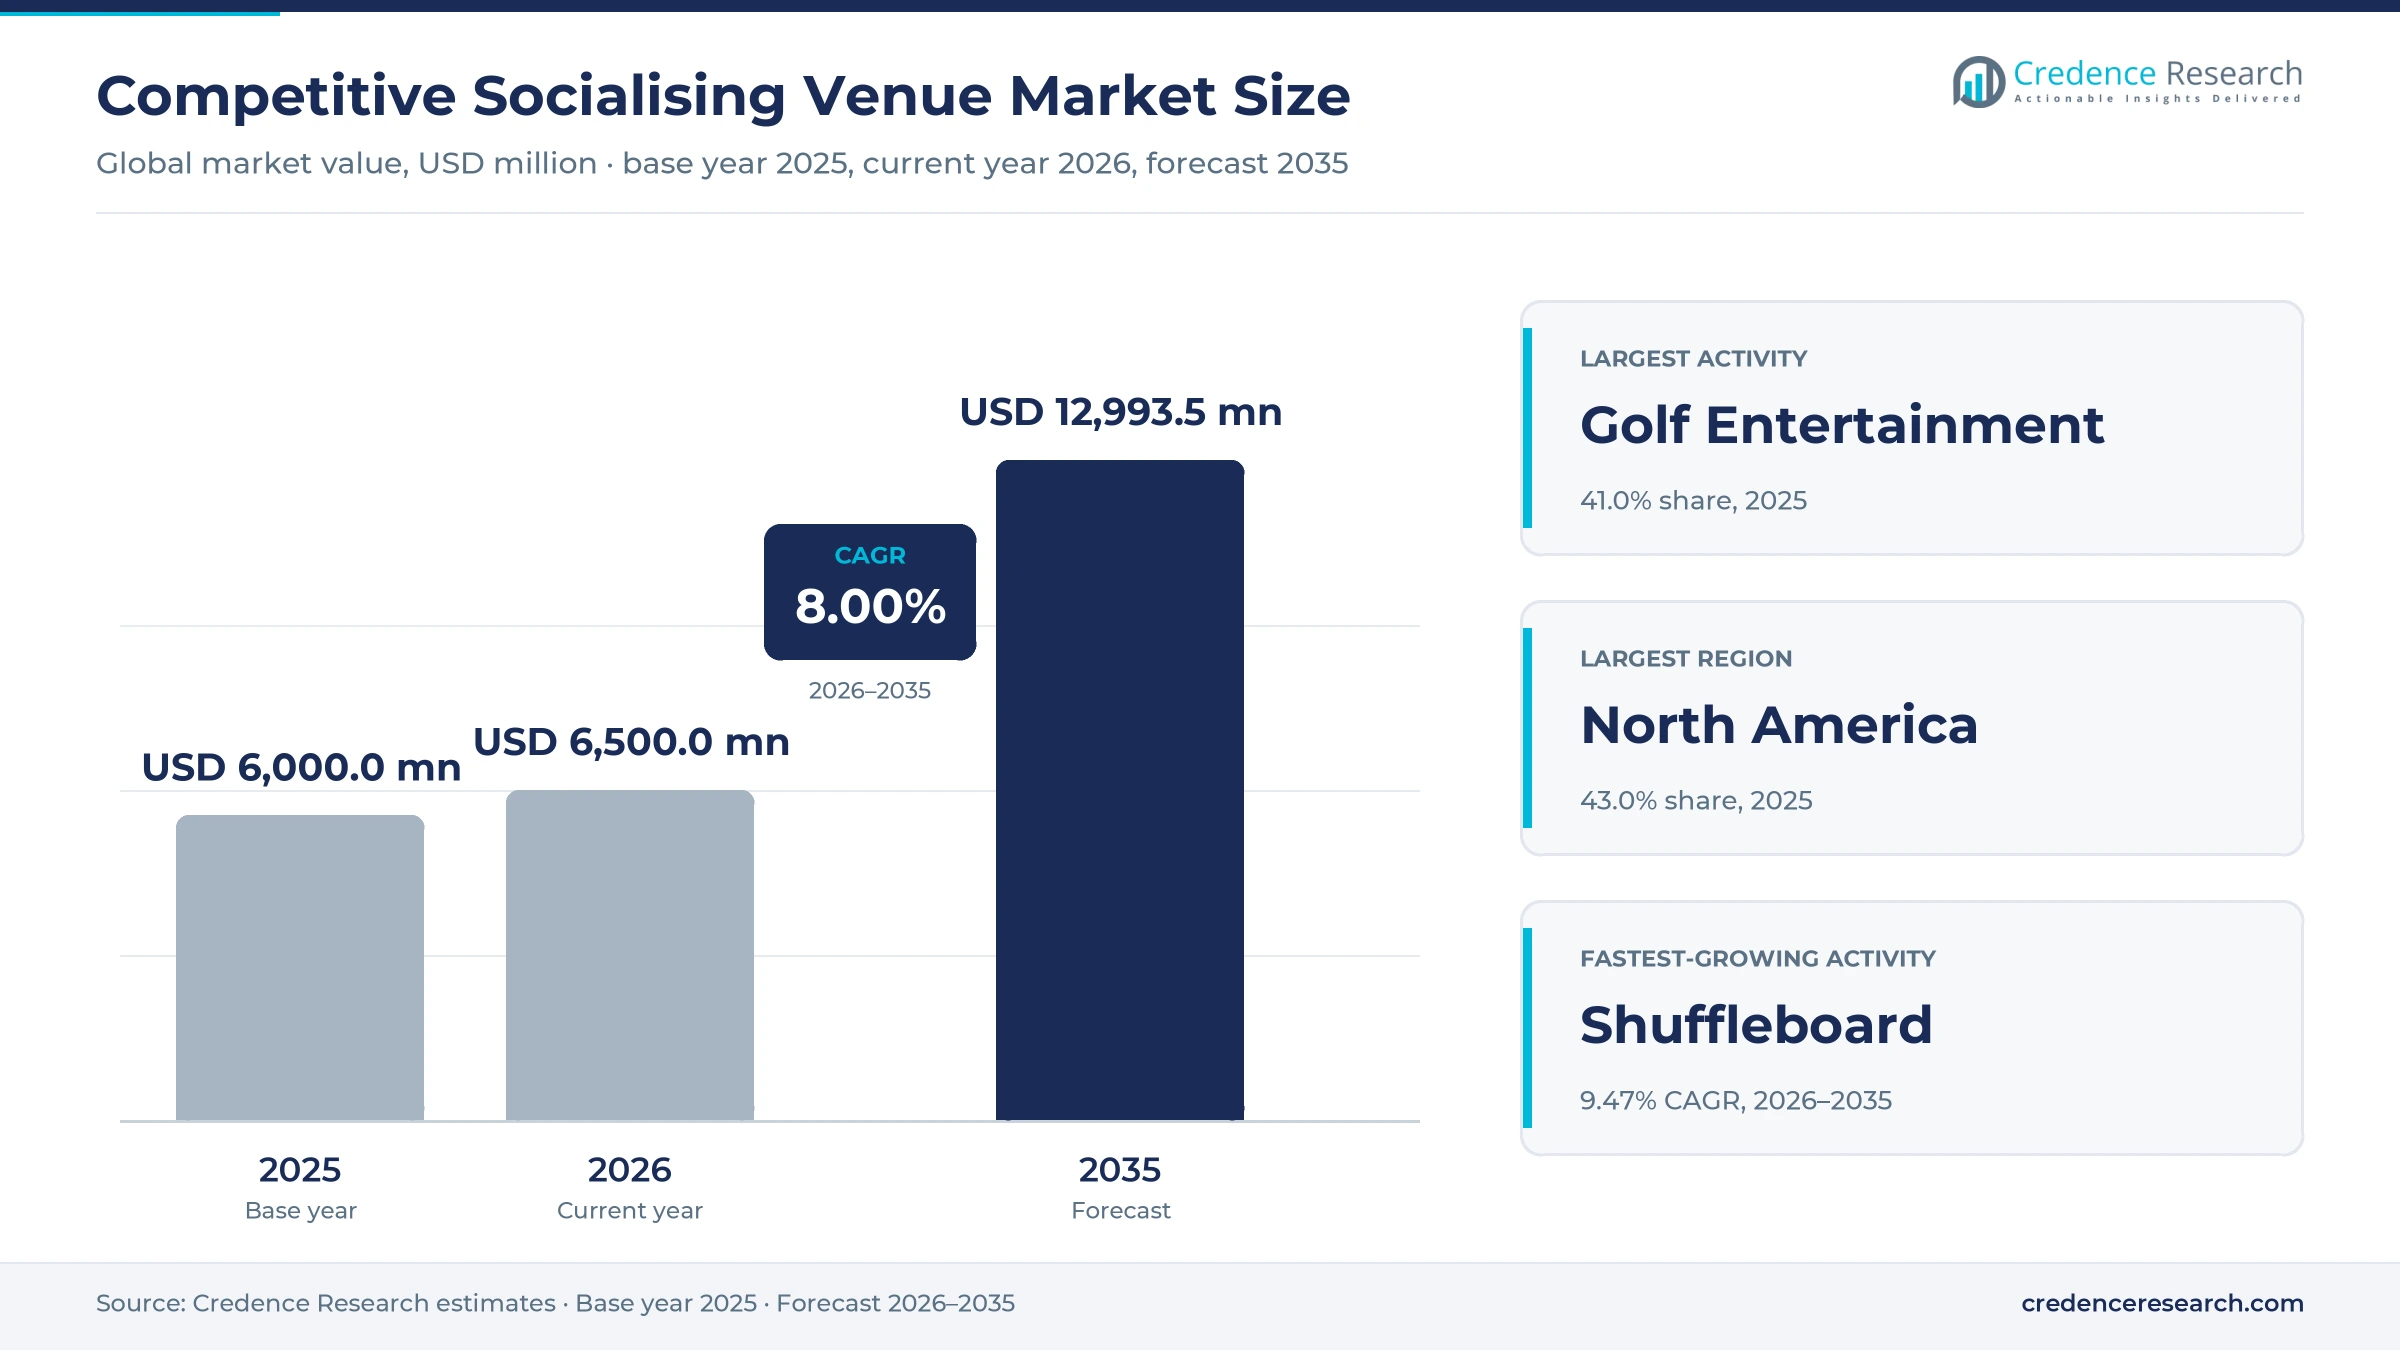
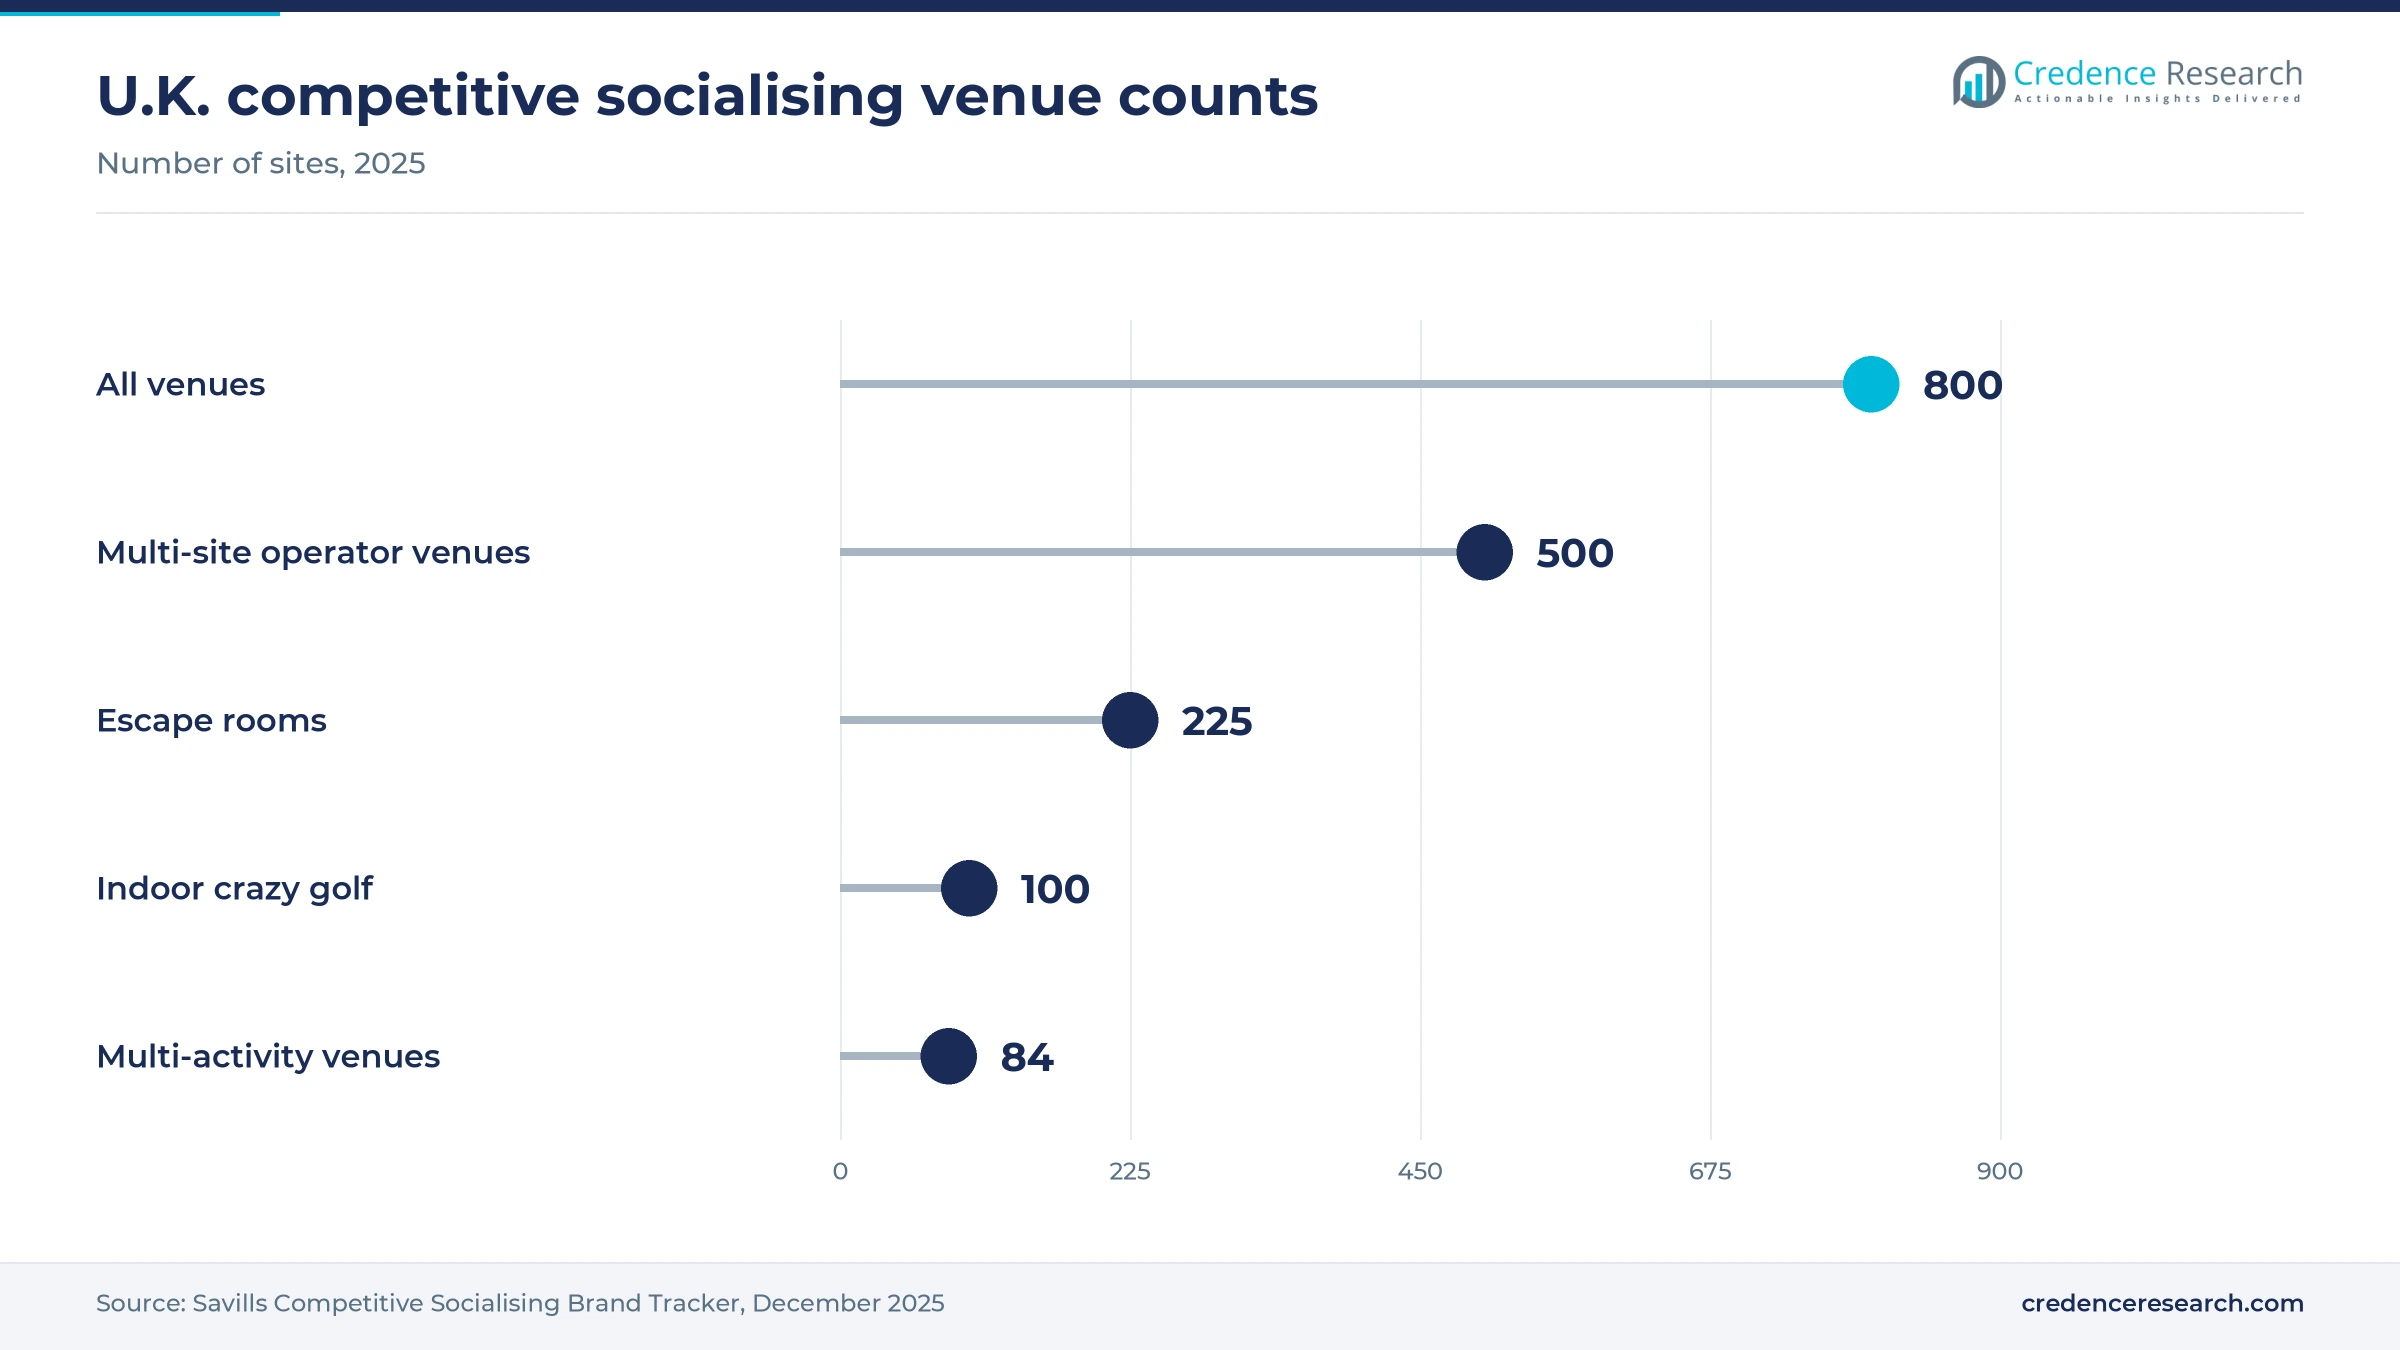
The global competitive socialising venue market was valued at USD 6.00 billion in 2025 and is projected to increase from USD 6.50 billion in 2026 to USD 12.99 billion by 2035, registering a CAGR of 8.00% during 2026–2035. Demand comes from adults who book golf bays, mini-golf courses, darts oches, shuffleboard tables and boutique bowling lanes as a night out with food, drinks and group events. North America held the largest regional share, 43.0% in 2025, because Topgolf, Puttshack, Five Iron Golf and upscale bowling chains run the biggest estates in the United States. Europe ranks second, led by a U.K. sector that counted about 800 venues in 2025. Middle East & Africa is the fastest-growing region at 9.42% a year, as franchise partners open large golf entertainment sites in Dubai and Abu Dhabi. The main commercial change is ownership, because Leonard Green took a 60% stake in Topgolf effective Jan. 1, 2026, while Pinstripes went through Chapter 11 in 2025.
What do competitive socialising venues sell to guests?
The report counts consumer and corporate spending at venues where a game is the main reason for the visit, including golf entertainment bays and simulator lounges, indoor mini-golf, social darts, electronic shuffleboard and boutique bowling. Guests pay for game time, food and drinks, and private or corporate event packages, usually booked online for groups. Puttshack, for example, runs automatic scoring on every hole and pairs its courses with full-service bars.
Traditional bowling alleys without a hospitality focus, children's play centers, arcades sold mainly on tokens, golf courses and home simulators are excluded from the market value. The value chain runs from game technology suppliers and landlords in city centers and malls, through operators and franchise partners, to booking platforms and event planners.
Competitive Socialising Venue Market Insights
- The market is projected to rise from USD 6.00 billion in 2025 to USD 12.99 billion by 2035 at an 8.00% CAGR, as venues open in the U.S., U.K. and Gulf.
- North America held the largest regional share in 2025, as Topgolf alone ran 96 company-owned U.S. venues at the end of 2024.
- Golf entertainment is the largest activity, because hitting bays and simulator lounges hold more guests per site than darts or shuffleboard venues.
- Ownership is changing quickly, as Leonard Green took 60% of Topgolf in January 2026 and Punch Bowl Social bought seven Pinstripes locations in 2025.
- Franchising spreads the format, with Five Iron Golf signing 12 Florida locations in January 2025 and Topgolf franchising sites in Asia and the Gulf.
Golf entertainment and food and drink lead spending
Golf entertainment leads as shuffleboard grows fastest
Based on activity, the market is categorized into golf entertainment, mini-golf, darts, shuffleboard and bowling. Golf Entertainment led with 41.0% of 2025 value because its venues are the largest in the category, and Topgolf alone ran 107 venues at the end of 2024, according to its annual report filed with the U.S. Securities and Exchange Commission. Golfzon also serves about 8,700 simulator venues in South Korea. Shuffleboard grows fastest at 9.47% a year, as Electric Shuffle reached nine venues in the U.K. and U.S. after its King's Cross opening on June 6, 2025, and owner Red Engine targets more than 80 Flight Club and Electric Shuffle venues by 2030.
Single-activity brands lead as combined sites multiply
Based on venue format, the market is categorized into single-activity venues and multi-activity venues. Single-Activity Venues led with 68.0% of 2025 value because the biggest brands are built around one game, from Topgolf hitting bays to Puttshack courses and Five Iron Golf simulators, and Savills counted 14 U.K. sites each for Flight Club and Sixes. Multi-Activity Venues grow fastest at 9.39% a year, as Savills found that U.K. multi-activity sites rose from 11 in 2018 to 84 in 2025. Boom Battle Bar, Roxy Ballroom and Lane7 together operate 66 of those combined sites.
Food and drink lead revenue as events grow fastest
Based on revenue stream, the market is categorized into games, food and beverage, and events. Food & Beverage led with 46.0% of 2025 value because operators earn more from the kitchen and bar than from play, and Puttshack leadership said in January 2024 that golf made up only 40% of its revenue, as reported by Restaurant Dive. Pinstripes also told investors that about one-third of its food and beverage revenue came from alcohol. Events grow fastest at 9.19% a year, as large sites sell group packages, and Electric Shuffle King's Cross links tables for parties of 32 to 400 guests.
| Segment Group | Leading Sub-segment | Share, 2025 | Fastest-growing Sub-segment | CAGR, 2026–2035 |
|---|---|---|---|---|
| By Activity | Golf Entertainment | 41.0% | Shuffleboard | 9.47% |
| By Venue Format | Single-Activity Venues | 68.0% | Multi-Activity Venues | 9.39% |
| By Revenue Stream | Food & Beverage | 46.0% | Events | 9.19% |
Request a Free Sample
Fill in your details and we'll send you a free sample report.
- Sample data tables & charts
- Research methodology
Group outings, city leases and bundles lift sales
Group outings move spending toward social games
Consumers now treat a game as the anchor of a group night out, and this habit lifts visits to bays, lanes and courses in both main regions. According to KAM Media, 29% of U.K. adults visited a competitive socialising venue in the previous 12 months, and repeat visits rose year on year. Topgolf Dubai has hosted more than 2.7 million guests since it opened five years ago, according to franchise partner Viya. Red Engine also reported in February 2025 that every company-owned Flight Club and Electric Shuffle venue posted its best-ever weekly sales in the fourth quarter of 2024. In the Credence Research model this driver adds about 2.96 percentage points to annual growth to 2035, with the largest effect on golf entertainment.
Urban experiential hospitality concepts expand
Landlords in city centers and malls now lease large units to experiential hospitality brands that draw evening and weekend footfall. Savills counted about 800 U.K. competitive socialising venues in 2025, up 58% since 2018, and forecast about 1,100 sites by 2030. In the United States, Puttshack opened its 20th domestic location in Columbus on May 27, 2026, a 12,529-square-foot site with two nine-hole courses. Flight Club operator State of Play Hospitality also signed a 10,700-square-foot lease in a landmark Union Square building in New York City, its ninth North American lease, according to Chain Store Age. In the Credence Research model urban expansion adds about 2.16 percentage points to annual growth to 2035.
Food and beverage bundles raise spend per visit
Operators package play with set menus, cocktails and private hire, which raises spend per guest above a standard bar visit. Pinstripes reported in its fiscal 2024 annual filing that its 17 locations averaged 30,000 square feet and that private events formed a significant part of its business. Puttshack's Columbus venue offers more than 50 food and beverage items beside its two mini-golf courses and three private Challenge Holes. Topgolf's new Madison venue, opening Aug. 14, 2026, adds 12 game day suites and arcade games around 72 hitting bays, according to FSR Magazine. In the Credence Research model these bundles add about 1.60 percentage points to annual growth to 2035, mainly through the food and beverage line.
Simulator technology fits golf into smaller sites
Indoor golf simulators and ball-tracking technology let operators fit golf into city storefronts that are far smaller than an outdoor range. Golfzon logged about 94 million simulator rounds in South Korea in 2024, nearly twice the number of outdoor rounds played nationwide, according to Seoulz. Five Iron Golf ran 34 locations across 15 states and five countries in January 2025, when it signed a 12-location Florida franchise deal, according to First Call Golf. Its UAE franchisees plan a 24,000-square-foot Yas Bay site with 12 Trackman simulators, set for the first quarter of 2026. Because simulator venues need less land and capital than open ranges, this driver lifts growth in Asia Pacific, which expands at 8.92% a year.
Multi-activity sites and new owners reshape the sector
Multi-activity formats rise in U.K. leisure schemes
Operators are shifting from one-game sites to combined venues that mix darts, karaoke, mini-golf and bowling under one roof. Savills reported in November 2023 that combo venues rose 455% from 2018 to 2023, against 162% for solo concepts, 96% for mini-golf and 10% for bowling. Birmingham added 14 net new units over the same period, the fastest growth of any U.K. city, according to Savills. Savills also expected food and beverage brands such as BoxPark and Butlins to add games to their sites. As a result, multi-activity venues grow at 9.39% a year in the Credence Research model, well above single-game formats.
Private equity and franchising reshape ownership
Ownership is shifting from founders and listed companies to private equity funds and franchise partners. Topgolf Callaway Brands completed the sale of 60% of Topgolf and Toptracer to Leonard Green & Partners effective Jan. 1, 2026, according to Pulse 2.0. Punch Bowl Social, with Silverview Credit Partners, bought seven Pinstripes locations in a sale approved Oct. 31, 2025, according to the Cleveland Jewish News. Five Iron Golf completed its fifth acquisition on Aug. 26, 2025, taking over Golf the Green in Chicago's Bucktown, according to First Call Golf. These deals concentrate the U.S. estate in fewer, better-funded hands, which supports steady openings in North America.
Gulf franchise openings create room for large golf sites
The Gulf offers an opening for large golf entertainment sites built with tourism developers and franchise partners. Miral is developing a Topgolf on Yas Island with franchise partner Viya, with 82 hitting bays, eight of them VIP, across three levels of about 6,500 square meters. Topgolf Dubai has recorded more than 85 million swings since it opened, according to Viya. Topgolf's annual filing also listed franchised venues in the UAE, Thailand, Indonesia, China, Mexico, Australia and Germany at the end of 2024. Because these sites pair golf with tourism, Middle East & Africa grows faster than any other region in the Credence Research model.
Corporate and private events open midweek demand
Corporate parties, team events and private hire offer an opening to fill venues on weekday afternoons and evenings. Topgolf broke ground on June 5, 2025, on a three-level Parsippany, New Jersey, venue with 102 climate-controlled hitting bays and more than 140 HDTVs, due in summer 2026, according to the Mann Report. Electric Shuffle King's Cross holds 400 guests across two bars and a terrace, according to the Morning Advertiser. Puttshack's Columbus site adds three private Challenge Holes for groups that book in advance. For this reason, events are the fastest-growing revenue stream at 9.19% a year in the Credence Research model.
Debt, payroll and crowded U.K. towns test operators
Debt and closures expose weaker operators
Large venues need heavy upfront spending, and weaker balance sheets can fail quickly. Pinstripes filed for Chapter 11 on Sept. 8, 2025, with about $143 million of debt, and closed 10 locations, according to the Cleveland Jewish News. The case left only seven sites for buyer Punch Bowl Social, which hurt landlords and staff in several U.S. cities. Lenders now ask for stronger unit economics, so new brands are likely to open fewer, smaller sites before scaling.
Rising U.K. payroll costs squeeze venue margins
Competitive socialising venues are staff-heavy, so labor costs weigh on margins. In April 2025, employer National Insurance rose from 13.8% to 15% and the threshold fell from £9,100 to £5,000, which UKHospitality said would add £3.4 billion to sector costs. Location payroll and benefits also equaled 24% of revenue at Lucky Strike Entertainment in fiscal 2025, according to its annual filing. Operators are responding with digital ordering and automatic scoring that cut front-of-house hours.
Softer same-venue sales slow large golf openings
Large golf entertainment venues need big sites and long build times, so softer sales at existing sites slow new building. Topgolf reported a drop in year-over-year venue sales in 2024 and planned to cut its 2025 pipeline to four to six new venues, according to CoStar in September 2024. Fewer openings delay new capacity in several growing U.S. metro areas. The company is now testing a new prototype in Madison, Wisconsin, with personalized bay settings to lift repeat visits.
Crowded U.K. town centers test like-for-like sales
Rapid openings in U.K. town centers raise the risk that new sites take guests from existing ones. NIQ RSM's Hospitality Tracker showed that total sales stayed positive while like-for-like sales were uneven, which the source linked to added supply, according to The Social Gaming Group in February 2026. Large multi-activity venues also need about 30,000 square feet, according to Savills, which raises rent exposure. Operators therefore favor strong brands and refits over new single-game launches.
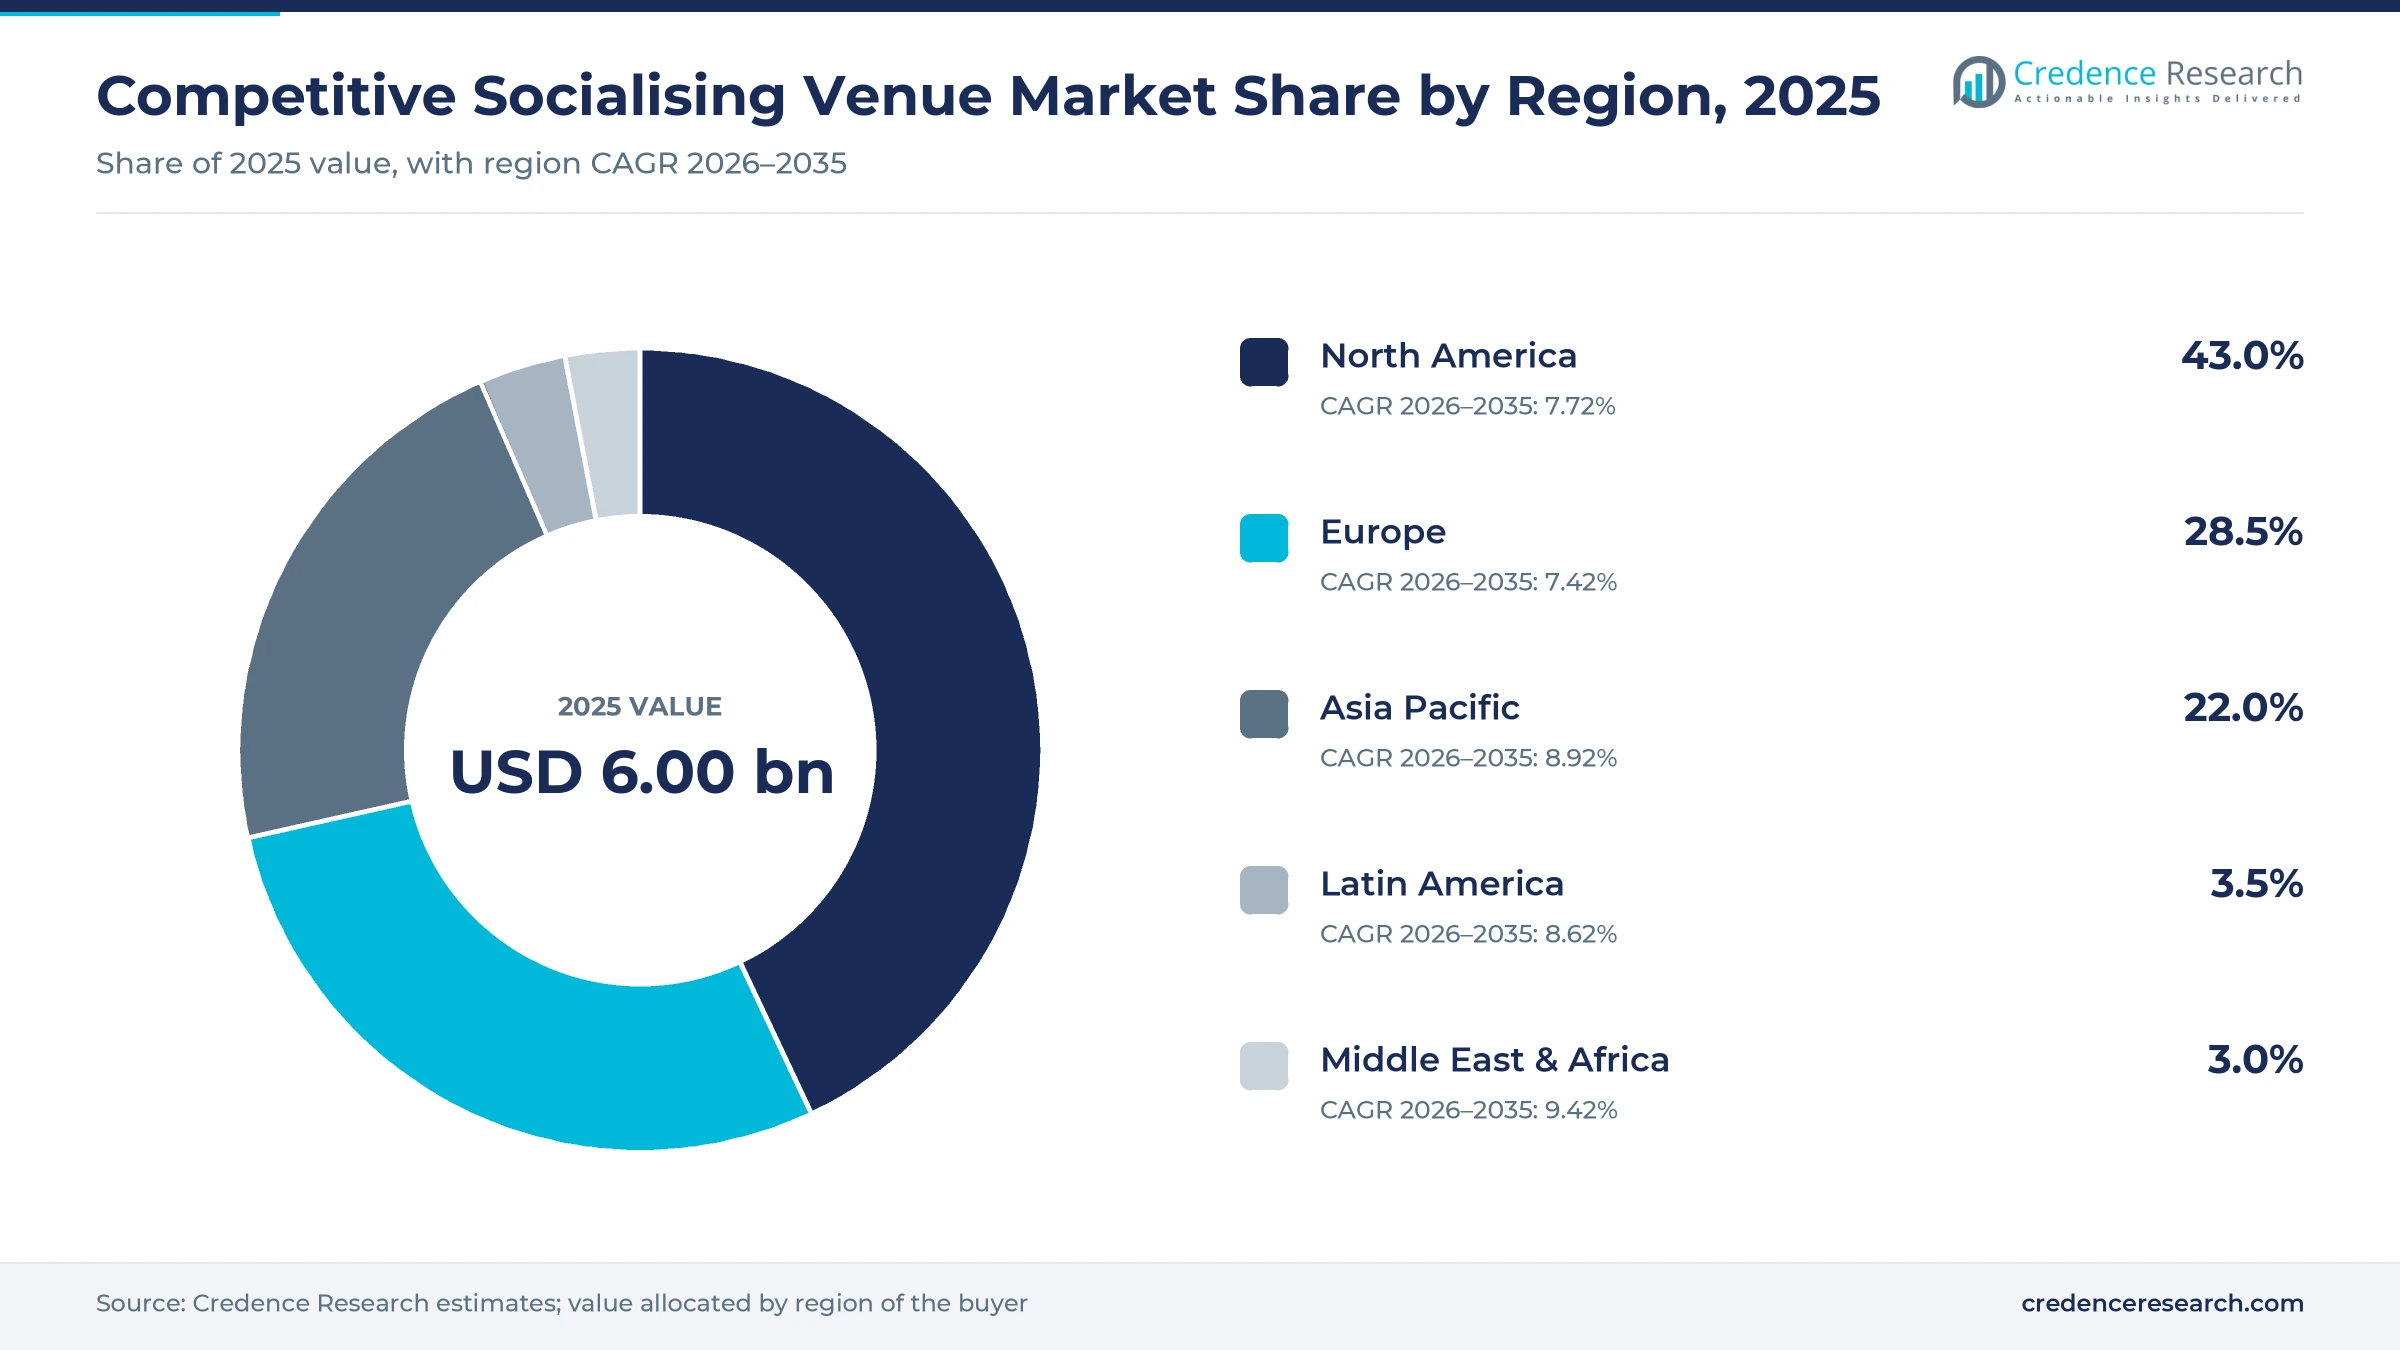
North America leads while the Gulf grows fastest
| Region | Value, 2025 (USD billion) | Share, 2025 | CAGR, 2026–2035 |
|---|---|---|---|
| North America | 2.58 | 43.0% | 7.72% |
| Europe | 1.71 | 28.5% | 7.42% |
| Asia Pacific | 1.32 | 22.0% | 8.92% |
| Latin America | 0.21 | 3.5% | 8.62% |
| Middle East & Africa | 0.18 | 3.0% | 9.42% |
North America leads on Topgolf and bowling estates
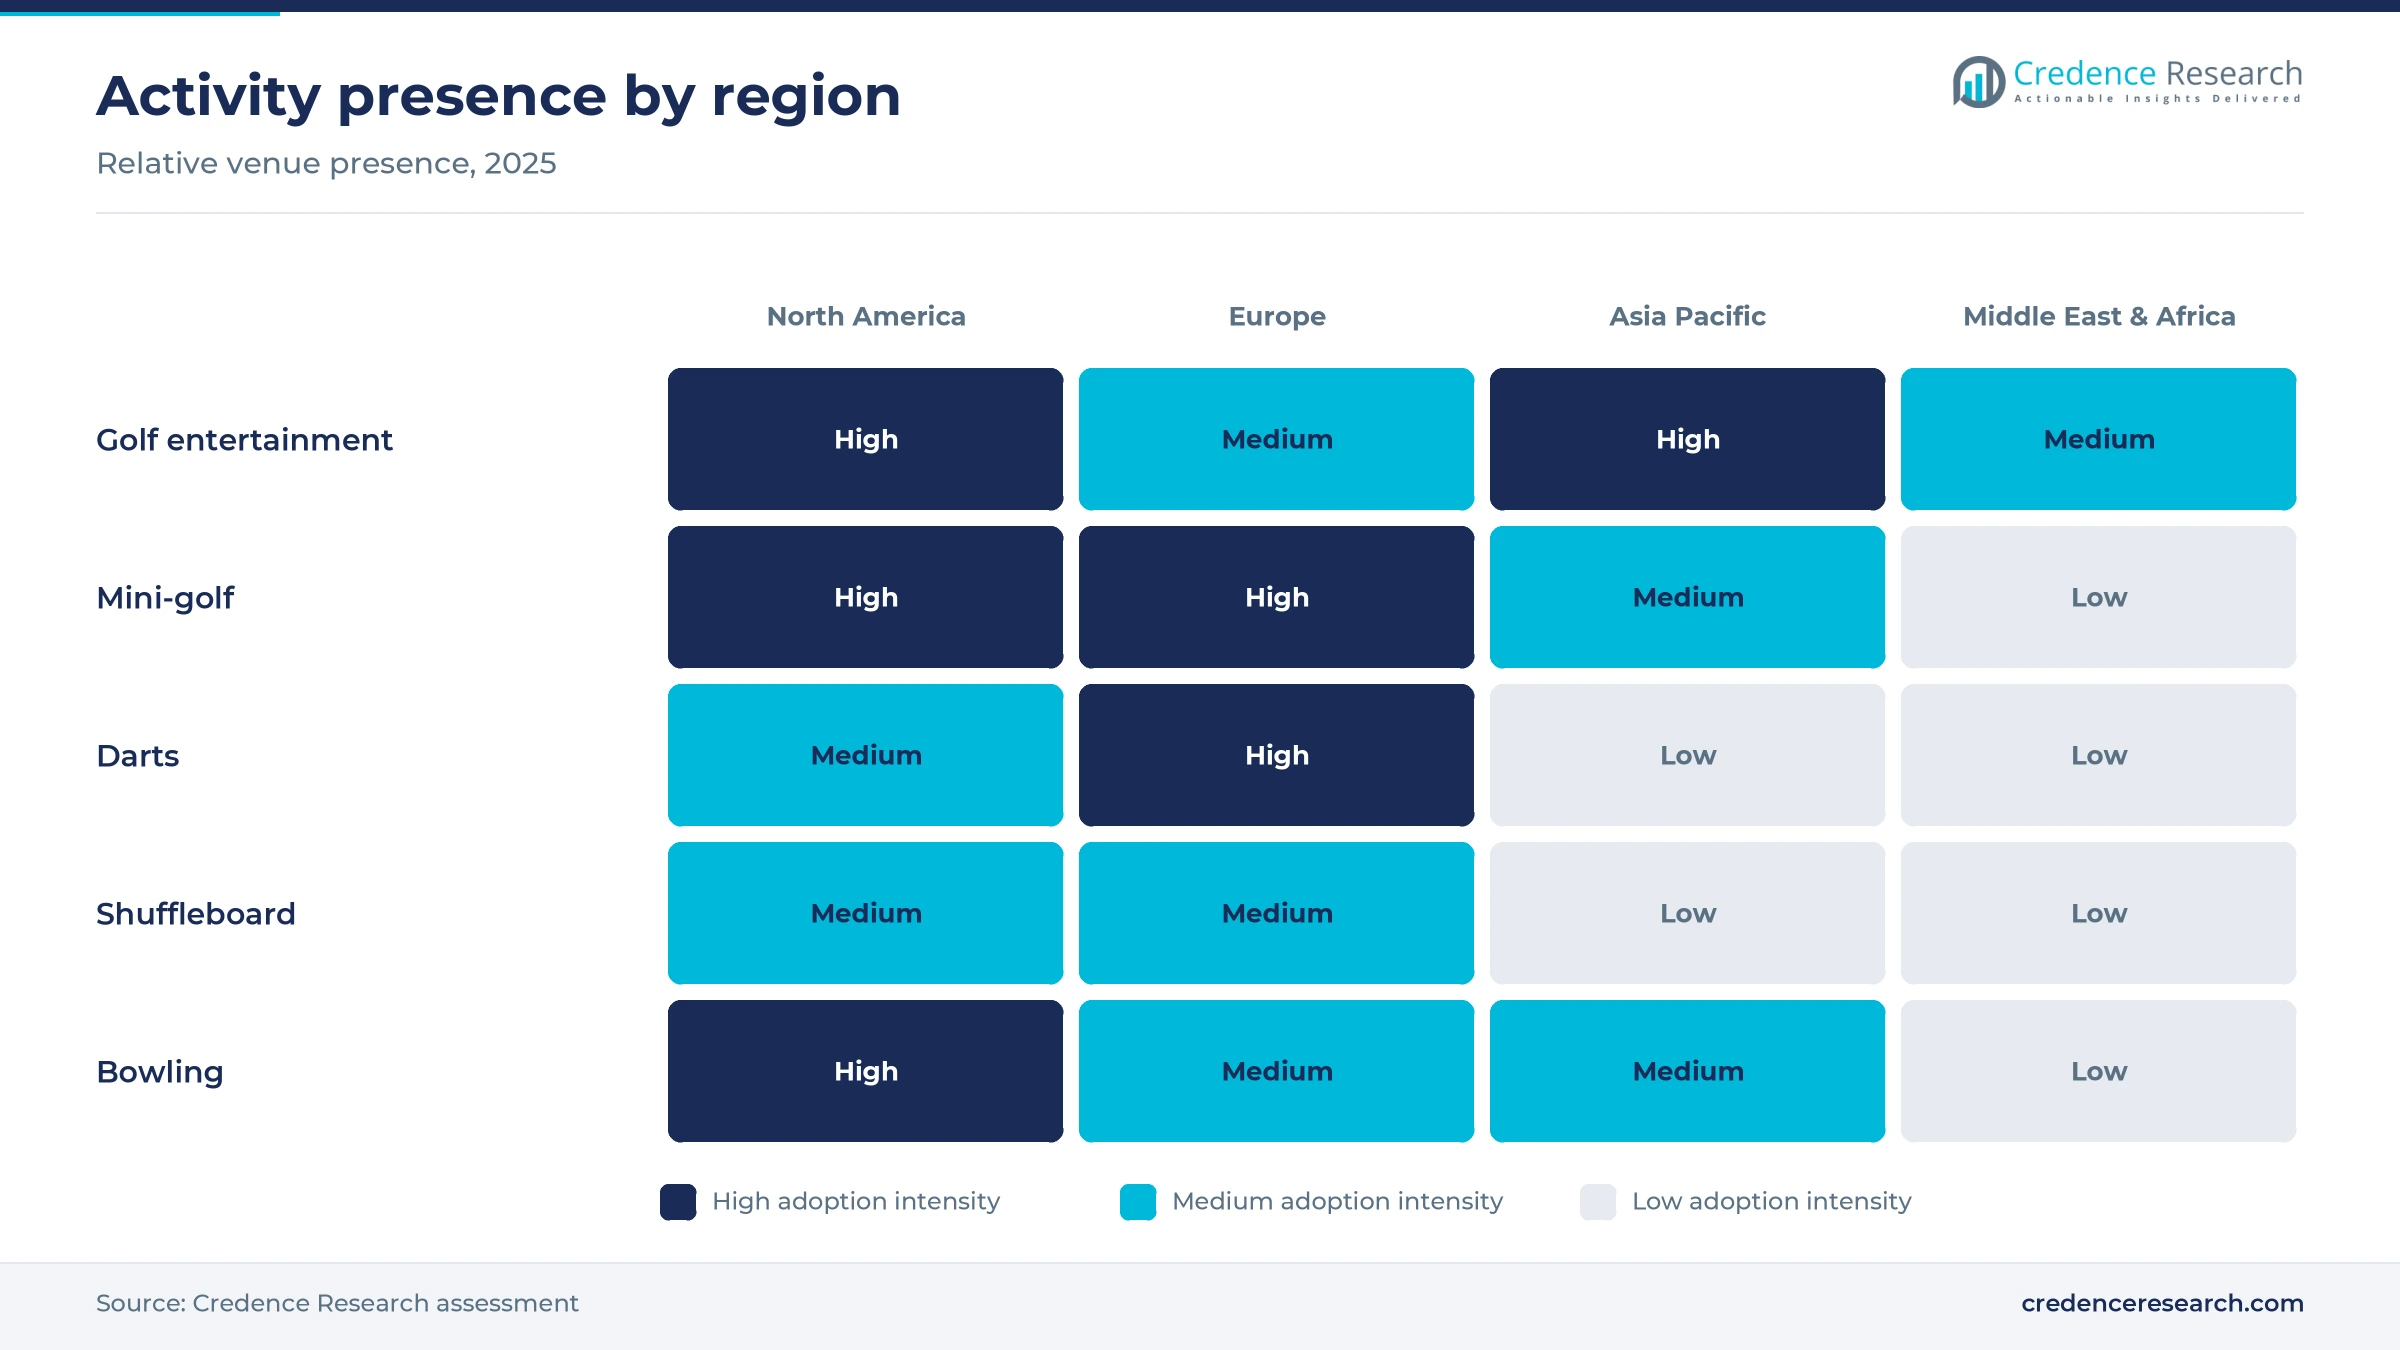
North America held 43.0% of 2025 value and grows at 7.72% a year. Topgolf, the largest off-course golf entertainment brand, ran 96 company-owned U.S. venues at the end of 2024, and its Madison site, opening Aug. 14, 2026, is its 103rd U.S. venue and first in Wisconsin, according to FSR Magazine. Lucky Strike Entertainment runs more than 360 locations across North America, including two in Canada, according to its annual filing. Puttshack, Five Iron Golf, Flight Club and Electric Shuffle add smaller urban venues in major U.S. cities.
Europe grows on the U.K. venue pipeline
Europe held 28.5% of 2025 value and grows at 7.42% a year. The U.K. accounts for most regional spending, and Savills counted more than 500 U.K. venues run by multi-site operators in 2025, up 84% since 2018. Topgolf ran four company-owned U.K. venues and a franchised venue in Germany at the end of 2024, according to its annual filing. Flight Club opened in Dublin in early 2025 through a franchise partner, according to Blooloop, which takes the format into Ireland. Growth is slower than in other regions because U.K. town centers are already well supplied.
Asia Pacific grows on screen golf and franchises
Asia Pacific held 22.0% of 2025 value and grows at 8.92% a year. South Korea has the densest network in the region, with about 8,700 Golfzon simulator venues and two-hour screen golf sessions that can cost about $18 per person, according to Seoulz. Flight Club opened franchise venues in Sydney and Melbourne in 2024, adding social darts to Australia's location-based entertainment offer, according to Blooloop. Five Iron Golf also operates two locations in Australia plus sites in Singapore and India, according to First Call Golf, which widens the premium format beyond Korea.
Latin America builds on Mexico openings
Latin America held 3.5% of 2025 value and grows at 8.62% a year. Mexico is the main market in the region, where Lucky Strike Entertainment operates four locations, according to its fiscal 2025 annual filing. Topgolf also listed a franchised venue in Mexico at the end of 2024, according to its annual report. Growth comes from mall-based bowling and golf venues in large cities, although the estate outside Mexico remains small and concentrated in a few capital cities.
Middle East & Africa is the fastest-growing region
Middle East & Africa held 3.0% of 2025 value and grows at 9.42% a year, the fastest of any region. Five Iron Golf opened its flagship at the Westin Mina Seyahi in Dubai Marina in September 2024, and its UAE franchisees raised growth financing led by Powerhouse Capital in October 2025, according to a Five Iron release. A second Dubai site at DAMAC Towers in Business Bay adds five Trackman simulators and a sports bar, which widens choice for hotel guests and residents.
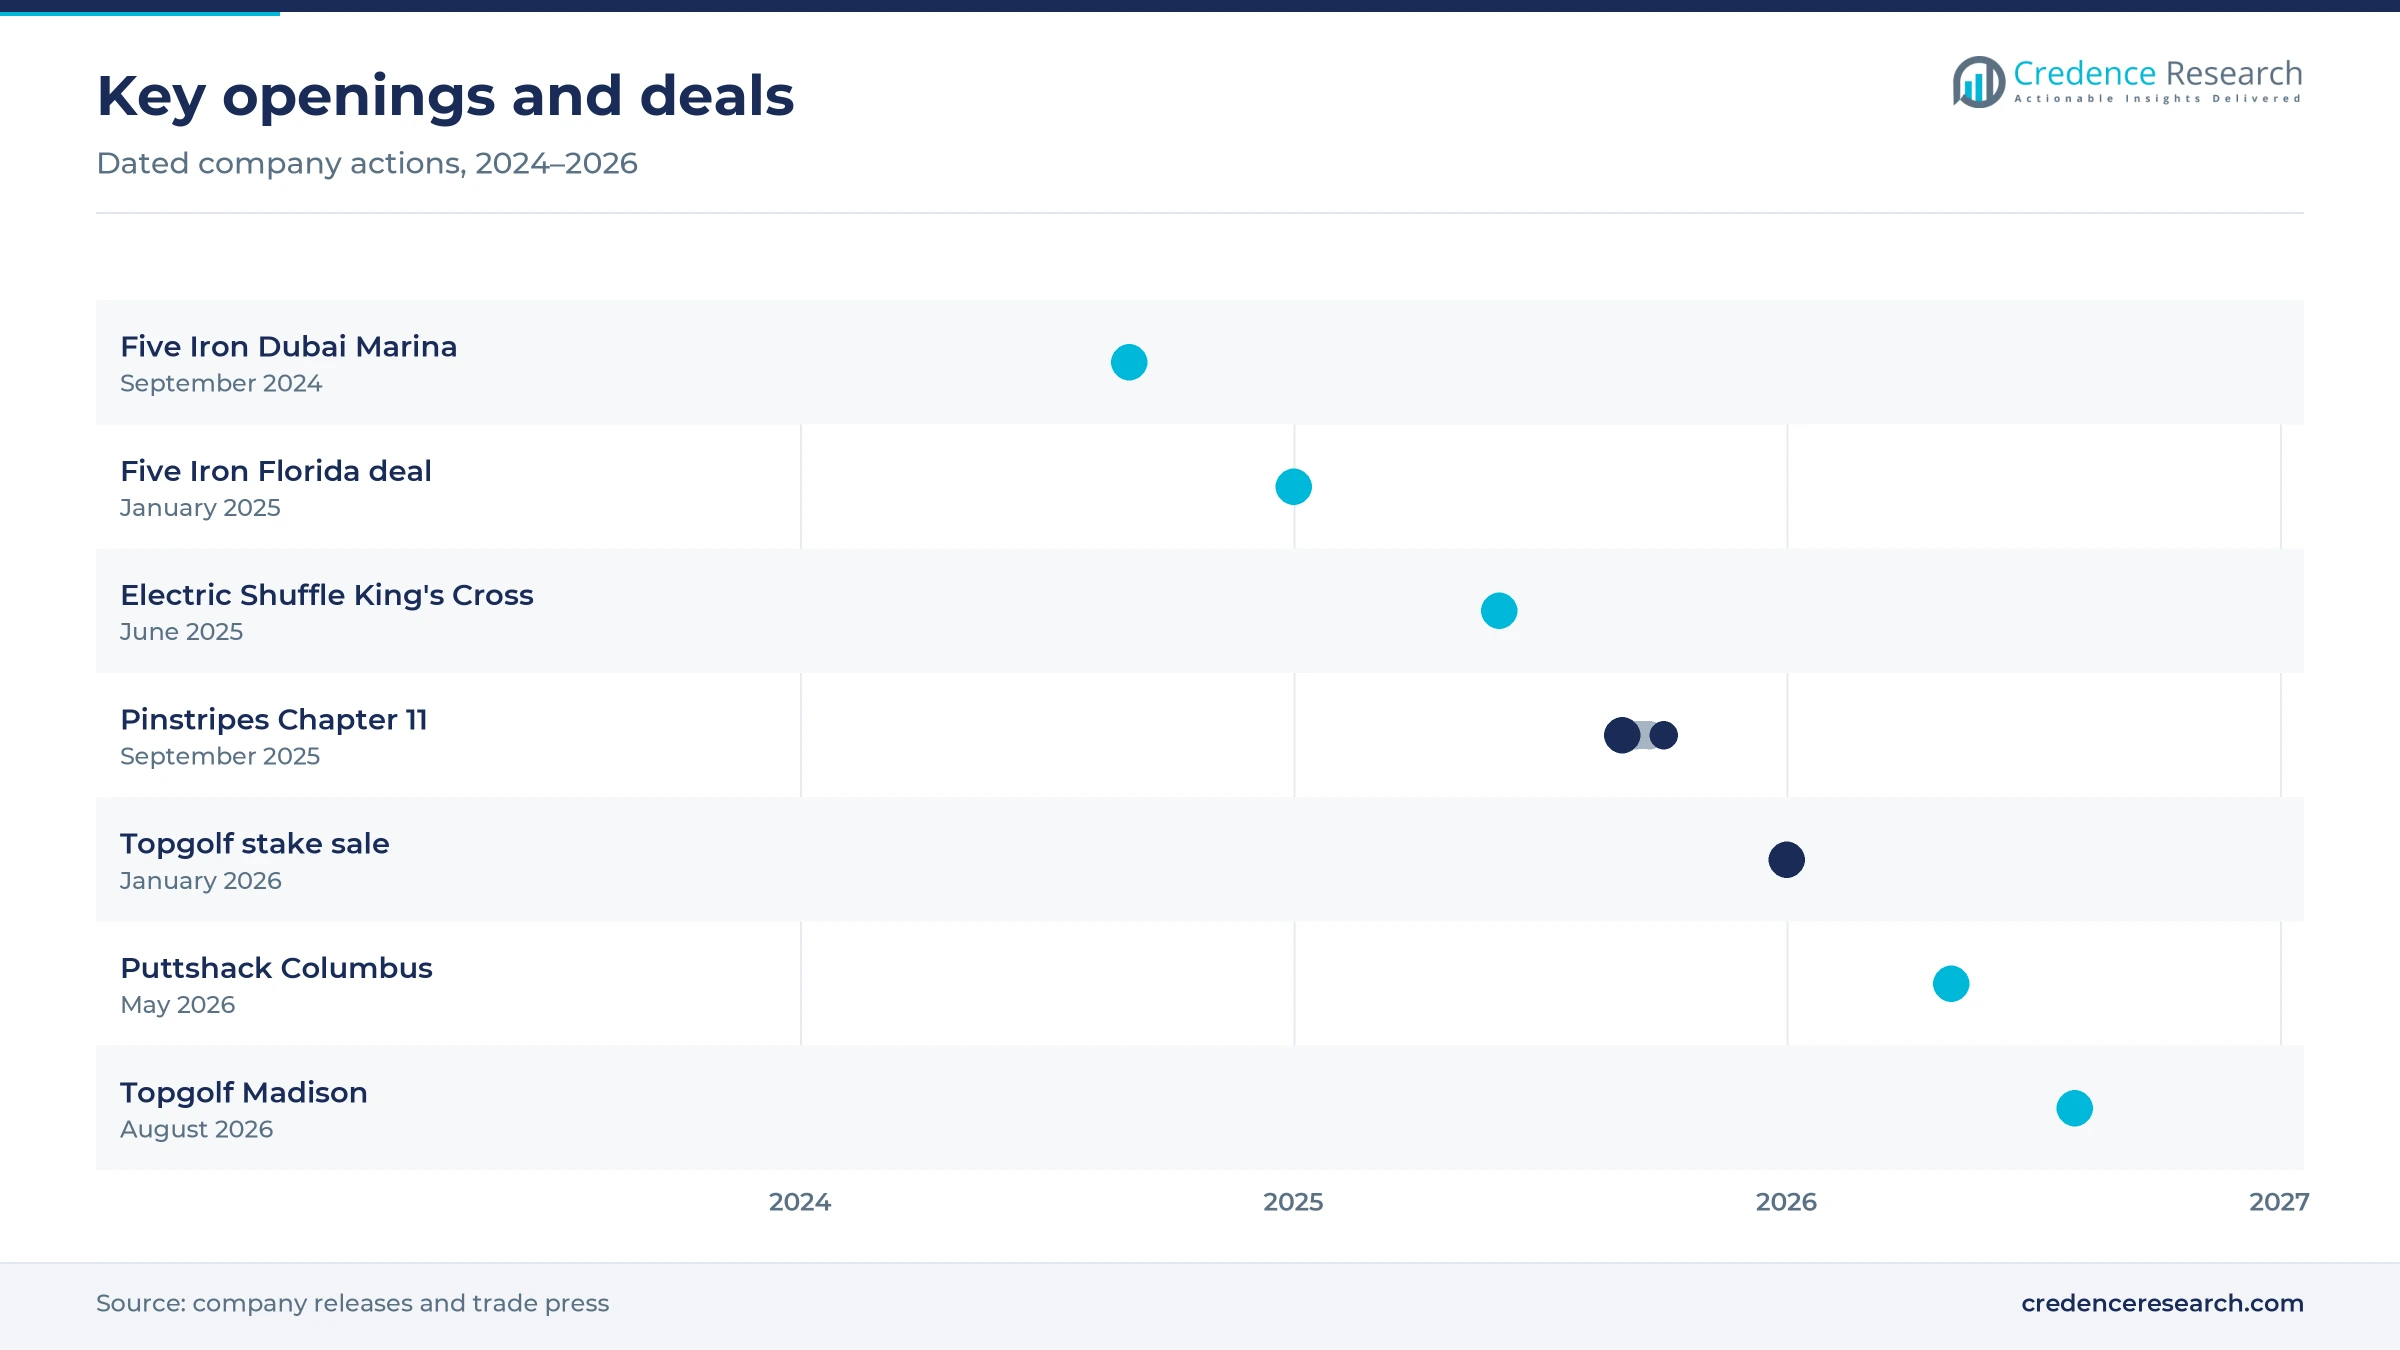
Sales, franchise deals and openings since 2024
| Development | Status and market relevance |
|---|---|
| In January 2025, Five Iron Golf signed its largest franchise deal to date, adding 12 planned locations across Florida from Miami to Jacksonville. | Franchise development in progress; it extends simulator golf venues across a new U.S. state. |
| In June 2025, Red Engine opened Electric Shuffle King's Cross in London, a 9,400-square-foot site for up to 400 guests. | Open; it raised the Electric Shuffle estate to nine venues across the U.K. and U.S. |
| In September 2025, Pinstripes Holdings filed for Chapter 11 bankruptcy protection and closed several venues. | Completed; Punch Bowl Social acquired seven U.S. locations in a sale approved in October 2025. |
| In January 2026, Leonard Green & Partners completed its purchase of 60% of Topgolf and Toptracer from Topgolf Callaway Brands. | Completed; the deal separated Topgolf venues from the golf equipment business. |
| In May 2026, Puttshack opened its first Ohio venue in Columbus, its 20th U.S. location and 24th worldwide. | Open; it adds a 12,529-square-foot mini-golf and dining site to the Midwest. |
Ball tracking and auto scoring run the game floor
- Ball tracking records the flight of every shot in golf bays and feeds game modes on bay screens, and the Toptracer system moved to Leonard Green with Topgolf in January 2026.
- Automatic scoring removes paper scorecards and speeds up group play, and Puttshack runs its proprietary Trackaball system on every hole of its courses, including the new Columbus site.
- Golf simulators such as Trackman units power Five Iron Golf venues in city storefronts, including 12 units planned for its Yas Bay site in Abu Dhabi, while Golfzon serves thousands of Korean lounges.
- Connected tables let Electric Shuffle join its shuffleboard tables, which seat up to 16 players each, into one game for groups of 32 to 400 guests.
Need a Custom Version of This Report?
Tailor the scope, geography, or segments to your exact requirements.
- Custom geography or segment scope
- Direct access to our analyst team
Golf brands, darts groups and bowling chains compete
Competition is moderately concentrated in golf entertainment and fragmented in darts, shuffleboard and mini-golf. Topgolf leads large-format golf with more than 100 venues and franchise partners in Asia, Europe and the Gulf, while Five Iron Golf competes with smaller simulator venues in city centers and a growing franchise network. Puttshack leads tech-driven indoor mini-golf in the United States and the U.K., and Red Engine runs Flight Club and Electric Shuffle, licensing Flight Club outside the U.K. Pinstripes combined bowling, bocce and Italian dining until its 2025 bankruptcy, after which Punch Bowl Social took over seven sites. Operators compete on game technology, food quality, event sales teams and access to prime leases. They also compete for leisure spending with family entertainment centers that target families with young children. Private equity owners are now pushing for faster openings and tighter costs, while independents rely on local brands and lower rents.
Companies profiled and their roles in this market
| Company | Type | Role in the market |
|---|---|---|
| Topgolf | Golf entertainment operator | Runs more than 100 venues with hitting bays and franchise sites abroad |
| Puttshack | Mini-golf operator | Runs 24 tech-driven mini-golf venues in the U.S. and U.K. |
| Flight Club | Social darts operator | Runs Red Engine U.K. sites and franchise venues in the U.S., Ireland and Australia |
| Electric Shuffle | Shuffleboard operator | Runs nine shuffleboard venues across the U.K. and U.S. |
| Five Iron Golf | Simulator golf operator | Runs 30+ simulator venues across U.S. states and five countries |
| Pinstripes | Bowling and bocce operator | Seven former sites now run by Punch Bowl Social after the 2025 sale |
Food, drink and events will set winners to 2035
Credence Research's view is that food, drink and event sales, not game fees alone, will decide which operators grow to 2035. Golf entertainment will keep the largest share because its venues hold the most guests, but darts, shuffleboard and multi-activity sites will grow faster as landlords seek smaller units in city centers. The Pinstripes bankruptcy shows that large sites with heavy debt are exposed when same-venue sales soften. Operators with franchise partners, strong group booking teams and flexible formats are better placed, especially in the Gulf and Asia Pacific, where new supply is still limited.
How Credence Research sized the market
The report uses 2025 as the base year and forecasts to 2035, with 2026 to 2035 as the growth period. Market values come from the Credence Research model, built from venue counts, typical spend per visit and visit frequency by region. Regional and segment shares are Credence Research estimates derived from venue counts by country. Sources used include company annual filings with the U.S. Securities and Exchange Commission, company press releases, venue count trackers from Savills and trade press coverage of openings, acquisitions and bankruptcies. No interviews or surveys were conducted for this edition of the report.
Franchising takes the format beyond the U.S. and U.K.
The market is expected to keep growing to 2035 as franchise partners take golf, darts and shuffleboard formats beyond the United States and the U.K. Savills expects the U.K. to reach about 1,100 sites by 2030, while Red Engine targets more than 80 Flight Club and Electric Shuffle venues by the same year. New Topgolf sites in New Jersey, Wisconsin and Abu Dhabi show that large-format golf is still expanding. However, growth will depend on payroll costs, rents and same-venue sales, so operators are likely to favor smaller, event-led sites over the largest builds.
Frequently Asked Questions
How big is the competitive socialising venue market?
Which region leads the market?
Which region grows fastest?
Which activity holds the largest share?
Which revenue stream grows fastest?
What are the main drivers of the market?
What are the main challenges?
Who are the key companies in the market?
Table of Content
Chapter 1 Market Segmentation
- 1.1 Segmentation Framework
- 1.1.1 Product and Service Classification
- 1.1.2 Application and End-Use Classification
- 1.1.3 Technology and Solution Classification
- 1.1.4 Customer and Distribution Channel Classification
- 1.1.5 Geographic Segmentation
- 1.1.6 Market Segment Definitions and Boundaries
- 1.2 By Activity
- 1.2.1 Golf Entertainment
- 1.2.2 Bowling
- 1.2.3 Mini-Golf
- 1.2.4 Darts
- 1.2.5 Shuffleboard
- 1.3 By Venue Format
- 1.3.1 Single-Activity Venues
- 1.3.2 Multi-Activity Venues
- 1.4 By Revenue Stream
- 1.4.1 Food & Beverage
- 1.4.2 Games
- 1.4.3 Events
Chapter 2 Introduction
- 2.1 Report Objectives and Scope
- 2.2 Product Definition and Industry Terminology
- 2.3 Market Inclusions and Exclusions
- 2.4 Research Process
- 2.4.1 Primary Research and Expert Interviews
- 2.4.2 Secondary Research and Source Review
- 2.4.3 Top-Down and Bottom-Up Estimation
- 2.4.4 Data Triangulation and Verification
- 2.5 Market Size Measurement Basis
- 2.5.1 2025: USD 6.00 billion → 2035: USD 12.99 billion
- 2.6 Historical and Forecast Reference Periods
- 2.6.1 Historical Period: 2018-2025
- 2.6.2 Base Year: 2025
- 2.6.3 Forecast Period: 2025-2035
- 2.7 Research Assumptions and Limitations
Chapter 3 Executive Summary
- 3.1 Market Snapshot and Key Findings
- 3.2 Base-Year Market Size, 2025
- 3.3 Forecast Market Size, 2035
- 3.4 Revenue and Volume Growth Outlook
- 3.5 Key Demand and Supply Indicators
- 3.6 Leading Market Segments
- 3.7 Fastest-Growing Market Opportunities
- 3.8 Regional Performance Highlights
- 3.9 Technology and Industry Transformation
- 3.10 Competitive Landscape Summary
- 3.11 Analyst View and Strategic Implications
Chapter 4 Global Competitive Socialising Venue Market Trends and Developments
- 4.1 Historical Industry Development, 2018-2025
- 4.2 Recent Market Trends and Developments
- 4.3 Demand and Customer Behavior Trends
- 4.4 Technology and Product Innovation
- 4.5 Artificial Intelligence, Automation and Digitalization
- 4.6 Local Manufacturing and Supply Chain Realignment
- 4.7 Industry Partnerships, Mergers and Acquisitions
- 4.8 Sustainability and Circular Economy Developments
- 4.9 Government and Private Sector Investment Trends
- 4.10 Emerging Business Models and Commercialization
- 4.11 Industry Developments and Announcements
Chapter 5 Global Competitive Socialising Venue Market Supply and Demand Analysis
- 5.1 Demand Trend and Consumption Analysis, 2018-2025
- 5.2 Demand Forecast, 2025-2035
- 5.3 Supply Chain Structure and Procurement Trends
- 5.4 Supply-Demand Gap and Bottlenecks
- 5.5 Import Dependence and Sourcing Structure
- 5.6 Regional Supply and Demand Concentration
Chapter 6 Global Competitive Socialising Venue Market Pricing Analysis
- 6.1 Pricing Structure and Measurement
- 6.2 Historical Pricing Trends, 2018-2025
- 6.3 Pricing Outlook, 2025-2035
- 6.4 Pricing by Product and Market Segment
- 6.5 Geographic Pricing Differences
- 6.6 Key Input, Energy, Labor and Logistics Costs
- 6.7 Contract Pricing and Purchasing Models
- 6.8 Pricing Sensitivity and Competitive Positioning
- 6.9 Price, Margin and Profitability Implications
Chapter 7 Global Competitive Socialising Venue Market Dynamics
- 7.1 Market Growth Drivers
- 7.1.1 Demand-Side Drivers
- 7.1.2 Technology and Innovation Drivers
- 7.1.3 Infrastructure and Investment Drivers
- 7.1.4 Regulatory and Policy Drivers
- 7.2 Market Restraints
- 7.2.1 Cost and Affordability Constraints
- 7.2.2 Technology and Adoption Barriers
- 7.2.3 Supply Chain and Operational Constraints
- 7.3 Market Challenges
- 7.3.1 Competitive Pressure and Margin Erosion
- 7.3.2 Skills, Infrastructure and Implementation Gaps
- 7.4 Emerging Market Opportunities
- 7.5 Market Dynamics Impact and Time-Horizon Assessment
Chapter 8 Global Competitive Socialising Venue Value Chain Analysis
- 8.1 Industry Value Chain Overview
- 8.2 Upstream Suppliers and Critical Inputs
- 8.3 Technology and Component Providers
- 8.4 Manufacturing or Service Delivery
- 8.5 Distribution, Channel Partners and Integrators
- 8.6 Downstream Applications and End Users
- 8.7 Value Addition and Profit Pools
- 8.8 Vertical Integration and Outsourcing
- 8.9 Supplier Concentration and Risk
- 8.10 Supply Chain Localization and Resilience
Chapter 9 Global Competitive Socialising Venue Market Regulations and Policies
- 9.1 Relevant Laws, Standards and Compliance Frameworks
- 9.2 Product, Service, Safety and Quality Requirements
- 9.3 Government Policies, Incentives and Subsidies
- 9.4 Imports, Exports and Trade Barriers
- 9.5 Public Procurement and Local Content Requirements
- 9.6 Data Protection, AI and Cybersecurity Compliance
- 9.7 Upcoming Policy Changes and Market Implications
Chapter 10 Global Competitive Socialising Venue Market Hotspots and Opportunities
- 10.1 Market Opportunity Mapping and Growth Hotspots
- 10.2 High-Growth Applications and Customer Groups
- 10.3 Underserved Markets and White-Space Opportunities
- 10.4 Emerging Technology and Product Opportunities
- 10.5 New Capacity and Investment Hotspots
- 10.6 Market Entry and Expansion Opportunities
- 10.7 Distribution and Partnership Opportunities
- 10.8 Near-Term and Long-Term Commercial Potential
- 10.9 Opportunity Attractiveness and Execution Risks
Chapter 11 Global Competitive Socialising Venue Market Outlook, 2025-2035
- 11.1 Market Size and Analysis
- 11.1.1 Revenue (Market Measurement: 2025: USD 6.00 billion → 2035: USD 12.99 billion)
- 11.1.2 Historical Market Size, 2018-2025
- 11.1.3 Base-Year Market Size, 2025
- 11.2 Market Forecast, 2025-2035
- 11.2.1 Revenue Forecast to 2035
- 11.2.2 CAGR and Year-on-Year Growth
- 11.2.3 Incremental Revenue Opportunity
- 11.3 Forecast Assumptions and Scenario Analysis
- 11.3.1 Base-Case Forecast
- 11.3.2 Optimistic and Conservative Scenarios
- 11.3.3 Technology, Pricing and Policy Sensitivities
- 11.4 Market Attractiveness and Growth Outlook
Chapter 12 Global Competitive Socialising Venue Market Segmentation and Outlook
- 12.1 Segmentation Summary and Market Shares, 2025
- 12.2 Largest and Fastest-Growing Segments
- 12.3 By Activity - Market Size and Forecast, 2025-2035
- 12.3.1 Segment Definition and Scope
- 12.3.2 Historical Market Size, 2018-2025
- 12.3.3 Revenue Forecast, 2025-2035
- 12.3.4 Base-Year Market Share, 2025
- 12.3.5 Segment CAGR and Growth Drivers
- 12.3.6 Subsegment Market Size and Forecast
- 12.3.6.1 Golf Entertainment
- 12.3.6.2 Bowling
- 12.3.6.3 Mini-Golf
- 12.3.6.4 Darts
- 12.3.6.5 Shuffleboard
- 12.3.7 Subsegment Pricing and Adoption Trends
- 12.3.8 Leading Suppliers and Competition
- 12.3.9 Regional Demand and Opportunities
- 12.4 By Venue Format - Market Size and Forecast, 2025-2035
- 12.4.1 Segment Definition and Scope
- 12.4.2 Historical Market Size, 2018-2025
- 12.4.3 Revenue Forecast, 2025-2035
- 12.4.4 Base-Year Market Share, 2025
- 12.4.5 Segment CAGR and Growth Drivers
- 12.4.6 Subsegment Market Size and Forecast
- 12.4.6.1 Single-Activity Venues
- 12.4.6.2 Multi-Activity Venues
- 12.4.7 Subsegment Pricing and Adoption Trends
- 12.4.8 Leading Suppliers and Competition
- 12.4.9 Regional Demand and Opportunities
- 12.5 By Revenue Stream - Market Size and Forecast, 2025-2035
- 12.5.1 Segment Definition and Scope
- 12.5.2 Historical Market Size, 2018-2025
- 12.5.3 Revenue Forecast, 2025-2035
- 12.5.4 Base-Year Market Share, 2025
- 12.5.5 Segment CAGR and Growth Drivers
- 12.5.6 Subsegment Market Size and Forecast
- 12.5.6.1 Food & Beverage
- 12.5.6.2 Games
- 12.5.6.3 Events
- 12.5.7 Subsegment Pricing and Adoption Trends
- 12.5.8 Leading Suppliers and Competition
- 12.5.9 Regional Demand and Opportunities
- 12.6 Segment Growth Comparison
- 12.7 Segment Attractiveness and Priority Matrix
Chapter 13 Global Competitive Socialising Venue Geographic Market Outlook, 2025-2035
- 13.1 Regional Market Size and Share, 2025
- 13.2 Regional Market Forecast, 2025-2035
- 13.3 Regional Pricing, Production and Demand Differences
- 13.4 North America
- 13.4.1 United States
- 13.4.2 Canada
- 13.4.3 Mexico
- 13.5 Europe
- 13.5.1 Germany
- 13.5.2 France
- 13.5.3 Italy
- 13.5.4 United Kingdom
- 13.5.5 Spain
- 13.5.6 Poland
- 13.5.7 Russia
- 13.5.8 Netherlands
- 13.5.9 Belgium
- 13.5.10 Sweden
- 13.5.11 Denmark
- 13.5.12 Norway
- 13.5.13 Rest of Europe
- 13.6 Asia Pacific
- 13.6.1 China
- 13.6.2 India
- 13.6.3 Japan
- 13.6.4 South Korea
- 13.6.5 Thailand
- 13.6.6 Indonesia
- 13.6.7 Vietnam
- 13.6.8 Malaysia
- 13.6.9 Australia
- 13.6.10 Rest of Asia Pacific
- 13.7 Latin America
- 13.7.1 Brazil
- 13.7.2 Argentina
- 13.7.3 Colombia
- 13.7.4 Chile
- 13.7.5 Rest of Latin America
- 13.8 Middle East
- 13.8.1 Saudi Arabia
- 13.8.2 United Arab Emirates
- 13.8.3 Turkey
- 13.8.4 Israel
- 13.8.5 Iran
- 13.8.6 Rest of the Middle East
- 13.9 Africa
- 13.9.1 South Africa
- 13.9.2 Egypt
- 13.9.3 Nigeria
- 13.9.4 Morocco
- 13.9.5 Rest of Africa
- 13.10 Regional Investment, Policy and Supply Chain Differences
- 13.11 Regional Competitive Landscape
- 13.12 Geographic Growth Hotspots
Chapter 14 Global Competitive Socialising Venue Technology, Innovation and Sustainability Outlook
- 14.1 Technology Landscape and Maturity
- 14.2 Product, Process and Service Innovation
- 14.3 AI, Automation and Digital Tools in the Industry
- 14.4 Technology Adoption and Performance Benchmarking
- 14.5 Innovation Pipeline and R&D Investment
- 14.6 Energy Efficiency and Resource Management
- 14.7 Sustainability, Recycling and Circularity
- 14.8 Technology Roadmap, 2025-2035
- 14.9 Risks of Obsolescence and Technology Substitution
Chapter 15 Global Competitive Socialising Venue Market Key Strategic Imperatives
- 15.1 Growth and Market Entry Priorities
- 15.2 High-Return Products and Segments
- 15.3 Pricing, Profitability and Cost Optimization
- 15.4 Technology Investment and Product Differentiation
- 15.5 Supply Chain Localization and Resilience
- 15.6 Distribution and Customer Acquisition
- 15.7 Partnership, Acquisition and Capacity Strategy
- 15.8 Regional Expansion Priorities
- 15.9 Short-, Medium- and Long-Term Actions
Chapter 16 Competition Outlook
- 16.1 Industry Competition Characteristics
- 16.2 Market Structure and Concentration
- 16.3 Market Share and Competitive Positioning, 2025
- 16.4 Company-Wise Revenue and Product Benchmarking
- 16.5 Production and Service Capacity Benchmarking
- 16.6 Technology, Pricing and Differentiation
- 16.7 Regional Footprint and Distribution Strength
- 16.8 Mergers, Acquisitions and Strategic Alliances
- 16.9 New Entrants and Competitive Threats
- 16.10 Porter's Five Forces and Industry Attractiveness
- 16.11 Competitive Outlook, 2025-2035
Chapter 17 Company Profiles
- 17.1 Company Coverage and Selection Criteria
- 17.2 Topgolf
- 17.2.1 Business Description
- 17.2.2 Company Ownership and Geographic Presence
- 17.2.3 Product and Service Portfolio
- 17.2.4 Manufacturing and Operating Footprint
- 17.2.5 Financial Performance and Investment
- 17.2.6 Market Share and Competitive Position
- 17.2.7 Technology and Innovation Capabilities
- 17.2.8 Strategic Alliances or Partnerships
- 17.2.9 Recent Developments
- 17.2.10 Growth Strategy and Outlook
- 17.3 Puttshack
- 17.4 Flight Club
- 17.5 Electric Shuffle
- 17.6 Five Iron Golf
- 17.7 Pinstripes
- 17.8 Other Relevant Market Participants
Note: Every listed company is profiled on the structure shown under the first company. The company list is preliminary and may change based on research findings, market developments, data availability and client requirements.
Chapter 18 Disclaimer
- 18.1 Research and Forecast Disclaimer
- 18.2 Data Source and Estimation Limitations
Note: The depth of individual sections depends on data availability for this market. Volume, capacity, trade and other unit-based metrics are included where applicable.

