
Music tourism spending follows stadium tours and festivals
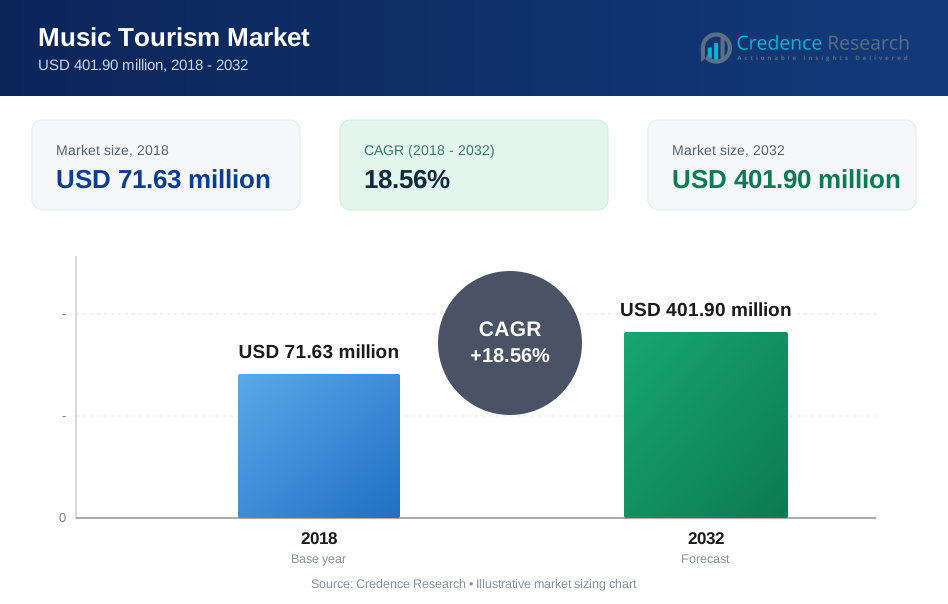
The global music tourism market was valued at USD 109.15 billion in 2025 and is projected to increase from USD 121.59 billion in 2026 to USD 321.27 billion by 2035, registering a CAGR of 11.40% during 2026–2035. Demand comes from fans who cross a city, state or border for stadium tours, festivals and heritage events, then spend on rooms, flights and meals around the ticket. North America held the largest regional share, 38.0% in 2025, because the U.S. combines arena density with festival destinations such as Coachella and Nashville. Asia Pacific is the fastest-growing region at 13.30% a year, as K-pop stadium tours, India's new concert circuit and Singapore's exclusive show strategy widen travel. The main commercial change is packaging, with promoters and travel platforms now selling presale access, flights and hotels together. Governments have also started measuring concert visitors directly, which brings public money and stricter ticket rules into a market that was once treated purely as entertainment.
What does the music tourism market count, and what does it leave out?
The market counts what music tourists spend on a trip whose main purpose is a concert, festival, cultural music event, music cruise or music heritage site. That spending covers tickets, on-site purchases, transport, accommodation and meals, whether the traveler crosses a border or stays inside the home country. Most trips are bought in two parts, a ticket from a promoter platform and travel booked separately, although bundled packages are gaining ground.
The market excludes concerts attended by local residents who make no trip, recorded music and streaming. Value passes from artists and promoters to venues and ticket platforms, then outward to airlines, hotels and restaurants, which often collect more from a fan than the ticket seller does.
Music Tourism Market Insights
- Music tourism spending of USD 109.15 billion in 2025 is forecast to reach USD 321.27 billion by 2035, an 11.40% CAGR over 2026–2035 on higher trip values and new routes.
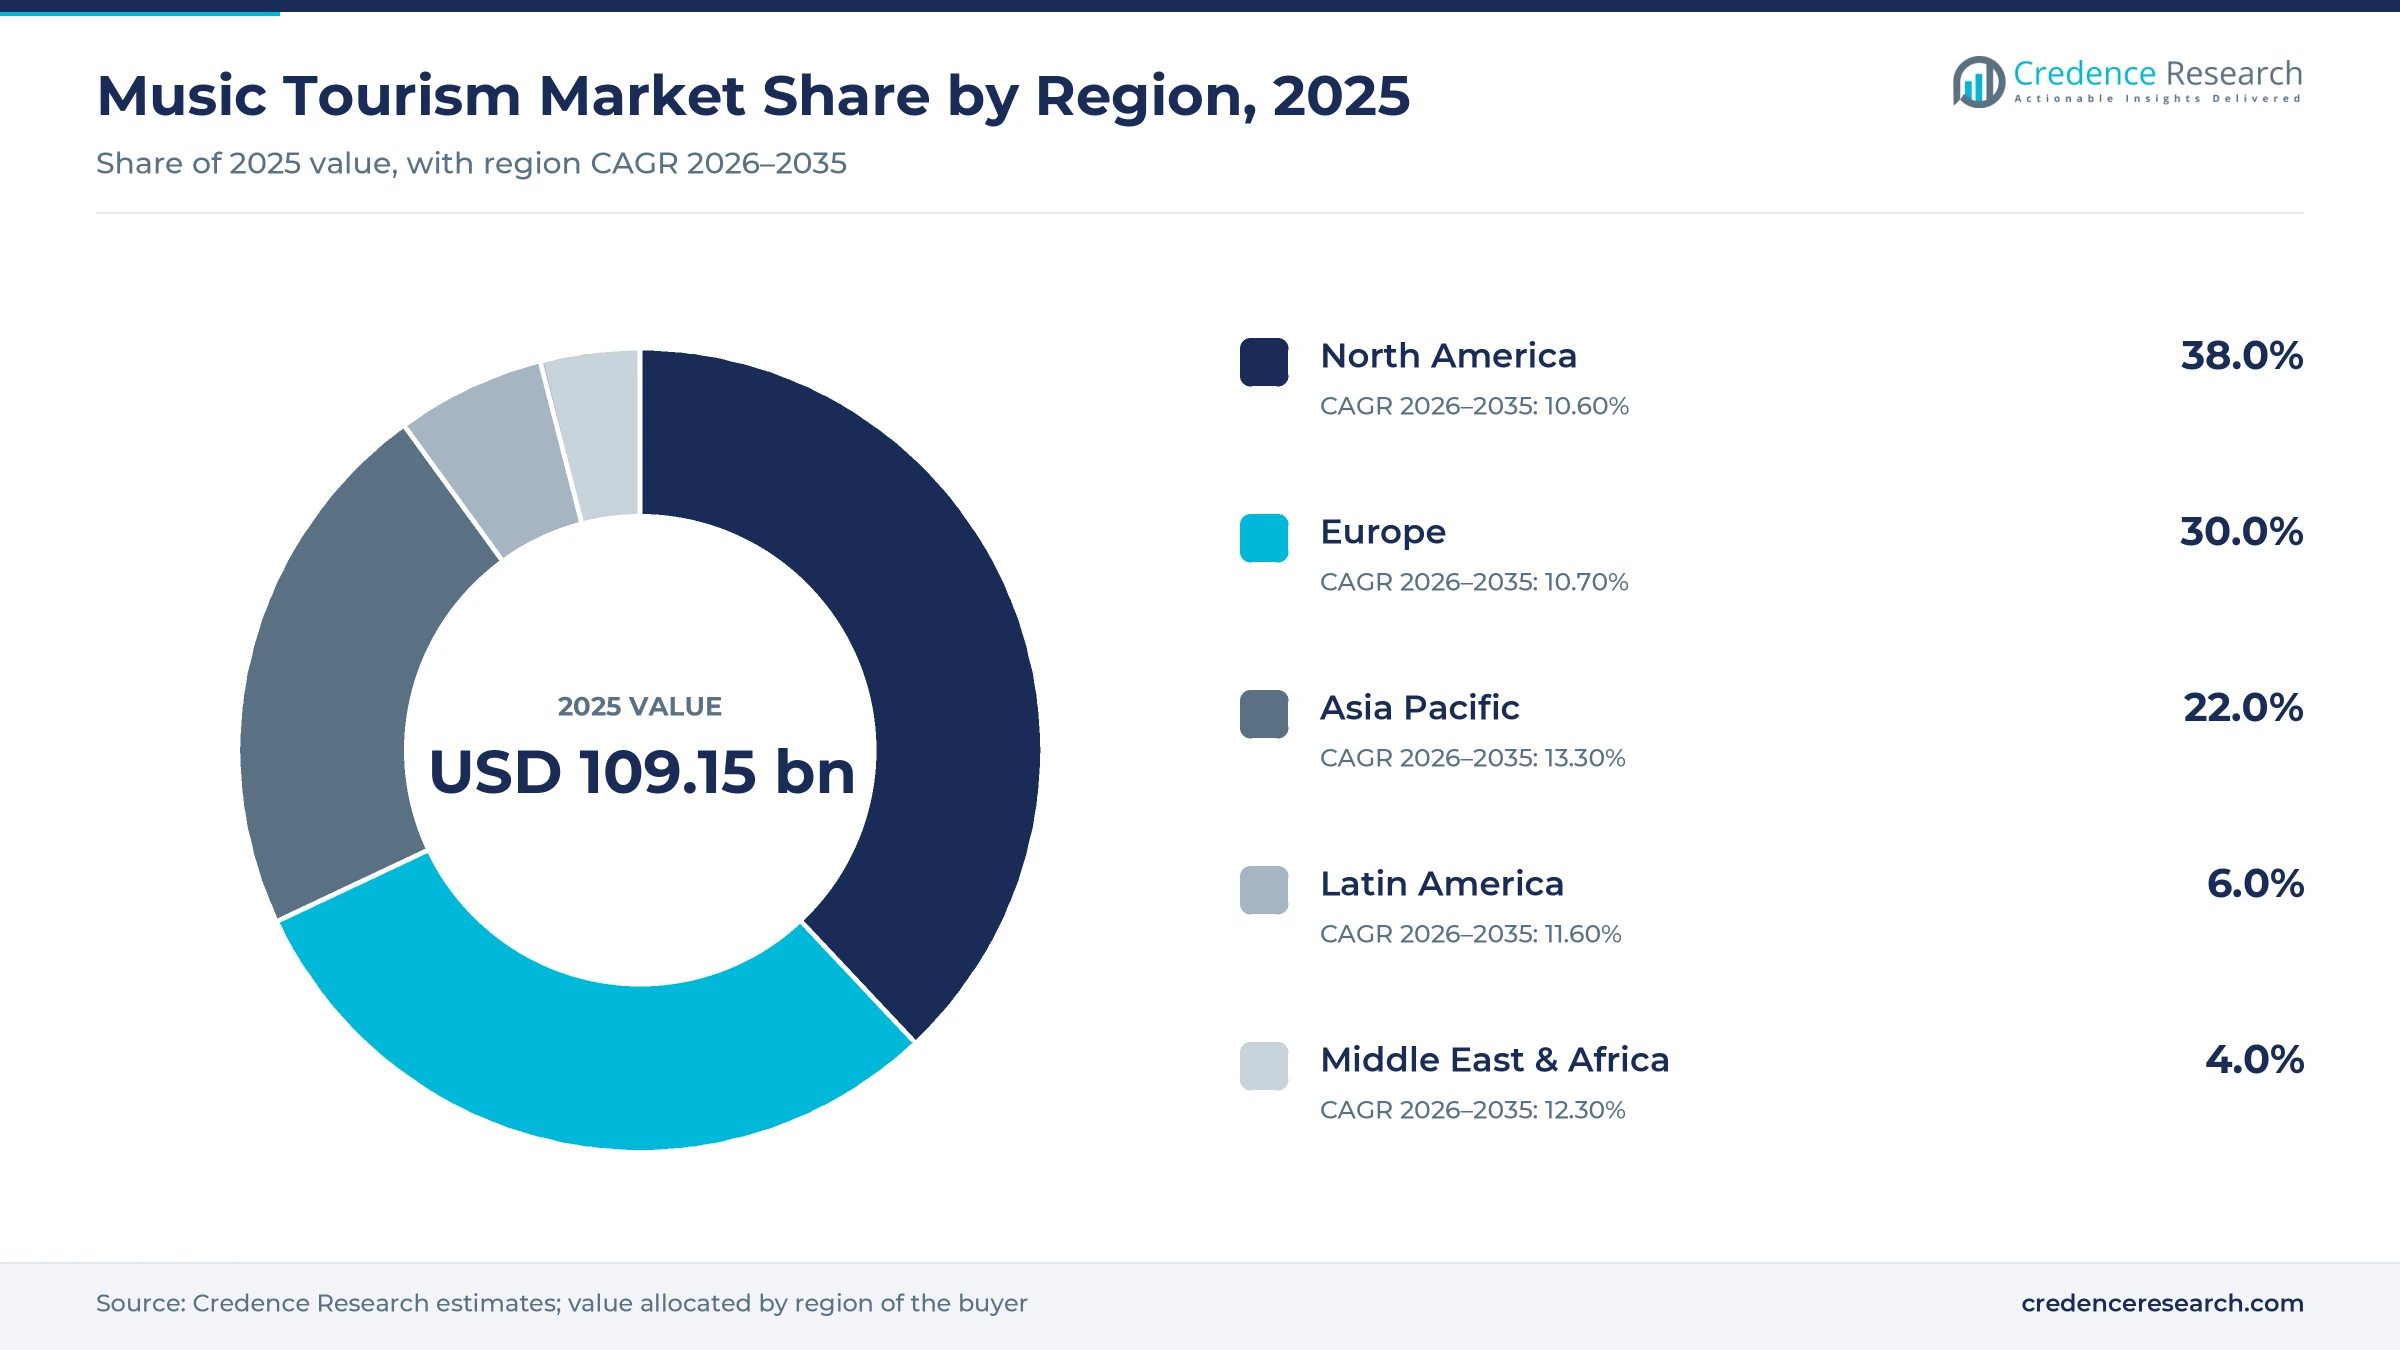
- North America held 38.0% of 2025 value, supported by U.S. festival destinations, while Asia Pacific grows fastest at 13.30% a year on stadium touring.
- Concerts and live performances led the type split with 44.0% in 2025, because stadium runs now concentrate very large traveling audiences in a few cities.
- U.K. Music counted a record 2.1 million overseas music tourists in 2025, and South Korea logged a record 2.06 million arrivals in March 2026.
- Trip.com Group and Live Nation Asia agreed a multi-year concert travel partnership in October 2025, tying presale access directly to flights and hotels across five Asian markets.
Concerts, leisure trips and direct tickets hold the value
Why do concerts outweigh festivals in fan travel value?
Based on type, the market is categorized into concerts and live performances, music festivals, cultural events, music cruises and others. Concerts & Live Performances led with 44.0% of 2025 value because stadium runs gather huge traveling audiences, as Oasis drew almost 1.4 million people to 17 U.K. shows in 2025, according to Euronews. Festivals stay capacity-bound, with Glastonbury licensed for 210,000 people, and heritage travel feeds the cultural group. Music Cruises grow fastest at 13.01% a year as Sixthman, which has carried over 540,000 guests since 2001, moves events to the larger Norwegian Joy, according to Cruise Industry News in June 2026.
Who pays for most music trips, casual travelers or superfans?
Based on end-user, the market is categorized into leisure travelers, music enthusiasts and corporate clients. Leisure Travelers led with 62.0% of 2025 value because most trips are short domestic breaks, and U.K. Music counted 22.6 million domestic music tourists in 2025 against far fewer from overseas. Music Enthusiasts grow fastest at 12.27% a year as fans follow artists between cities, with Airbnb reporting in March 2026 that Boston stay searches rose about 600% after BTS announced its tour. Corporate demand rests on sponsorship and hospitality, and Live Nation had booked over 70% of its 2026 sponsorship commitments by February 2026.
How much of the demand comes from travelers under 35?
Based on age group, the market is categorized into under 18, 18–34 years, 35–54 years, and 55+ years. 18–34 Years led with 47.0% of 2025 value because this group plans trips around artists, and 76% of Indian Gen Z respondents visited a city for the first time for a concert in a survey commissioned by Airbnb and published in January 2026. 18–34 Years also grow fastest at 11.99% a year, since 62% of those 1,102 respondents planned music trips in 2026. Older travelers remain valuable on cruises, where Sixthman has run over 240 themed sailings, which suit longer and higher-priced breaks.
Where do fans book, and how fast are travel platforms catching up?
Based on booking mode, the market is categorized into direct booking, online travel agencies and travel agents. Direct Booking led with 56.0% of 2025 value because artists sell through promoter channels and online ticketing, and Live Nation reported about 67 million fans already sold for 2026 by February 2026. Online Travel Agencies grow fastest at 12.47% a year as Trip.com Group agreed in October 2025 to sell Live Nation Asia presales with flights and hotels, citing a survey in which nearly 66% of Asia Pacific travelers would cross borders for concerts. Traditional agents still keep group charters and escorted fan trips.
| Segment Group | Leading Sub-segment | Share, 2025 | Fastest-growing Sub-segment | CAGR, 2026–2035 |
|---|---|---|---|---|
| By Type | Concerts & Live Performances | 44.0% | Music Cruises | 13.01% |
| By End-User | Leisure Travelers | 62.0% | Music Enthusiasts | 12.27% |
| By Age Group | 18–34 Years | 47.0% | 18–34 Years | 11.99% |
| By Booking Mode | Direct Booking | 56.0% | Online Travel Agencies | 12.47% |
Request a Free Sample
Fill in your details and we'll send you a free sample report.
- Sample data tables & charts
- Research methodology
Stadium runs and city policy are moving fans across borders
Stadium tours are concentrating traveling audiences in fewer cities
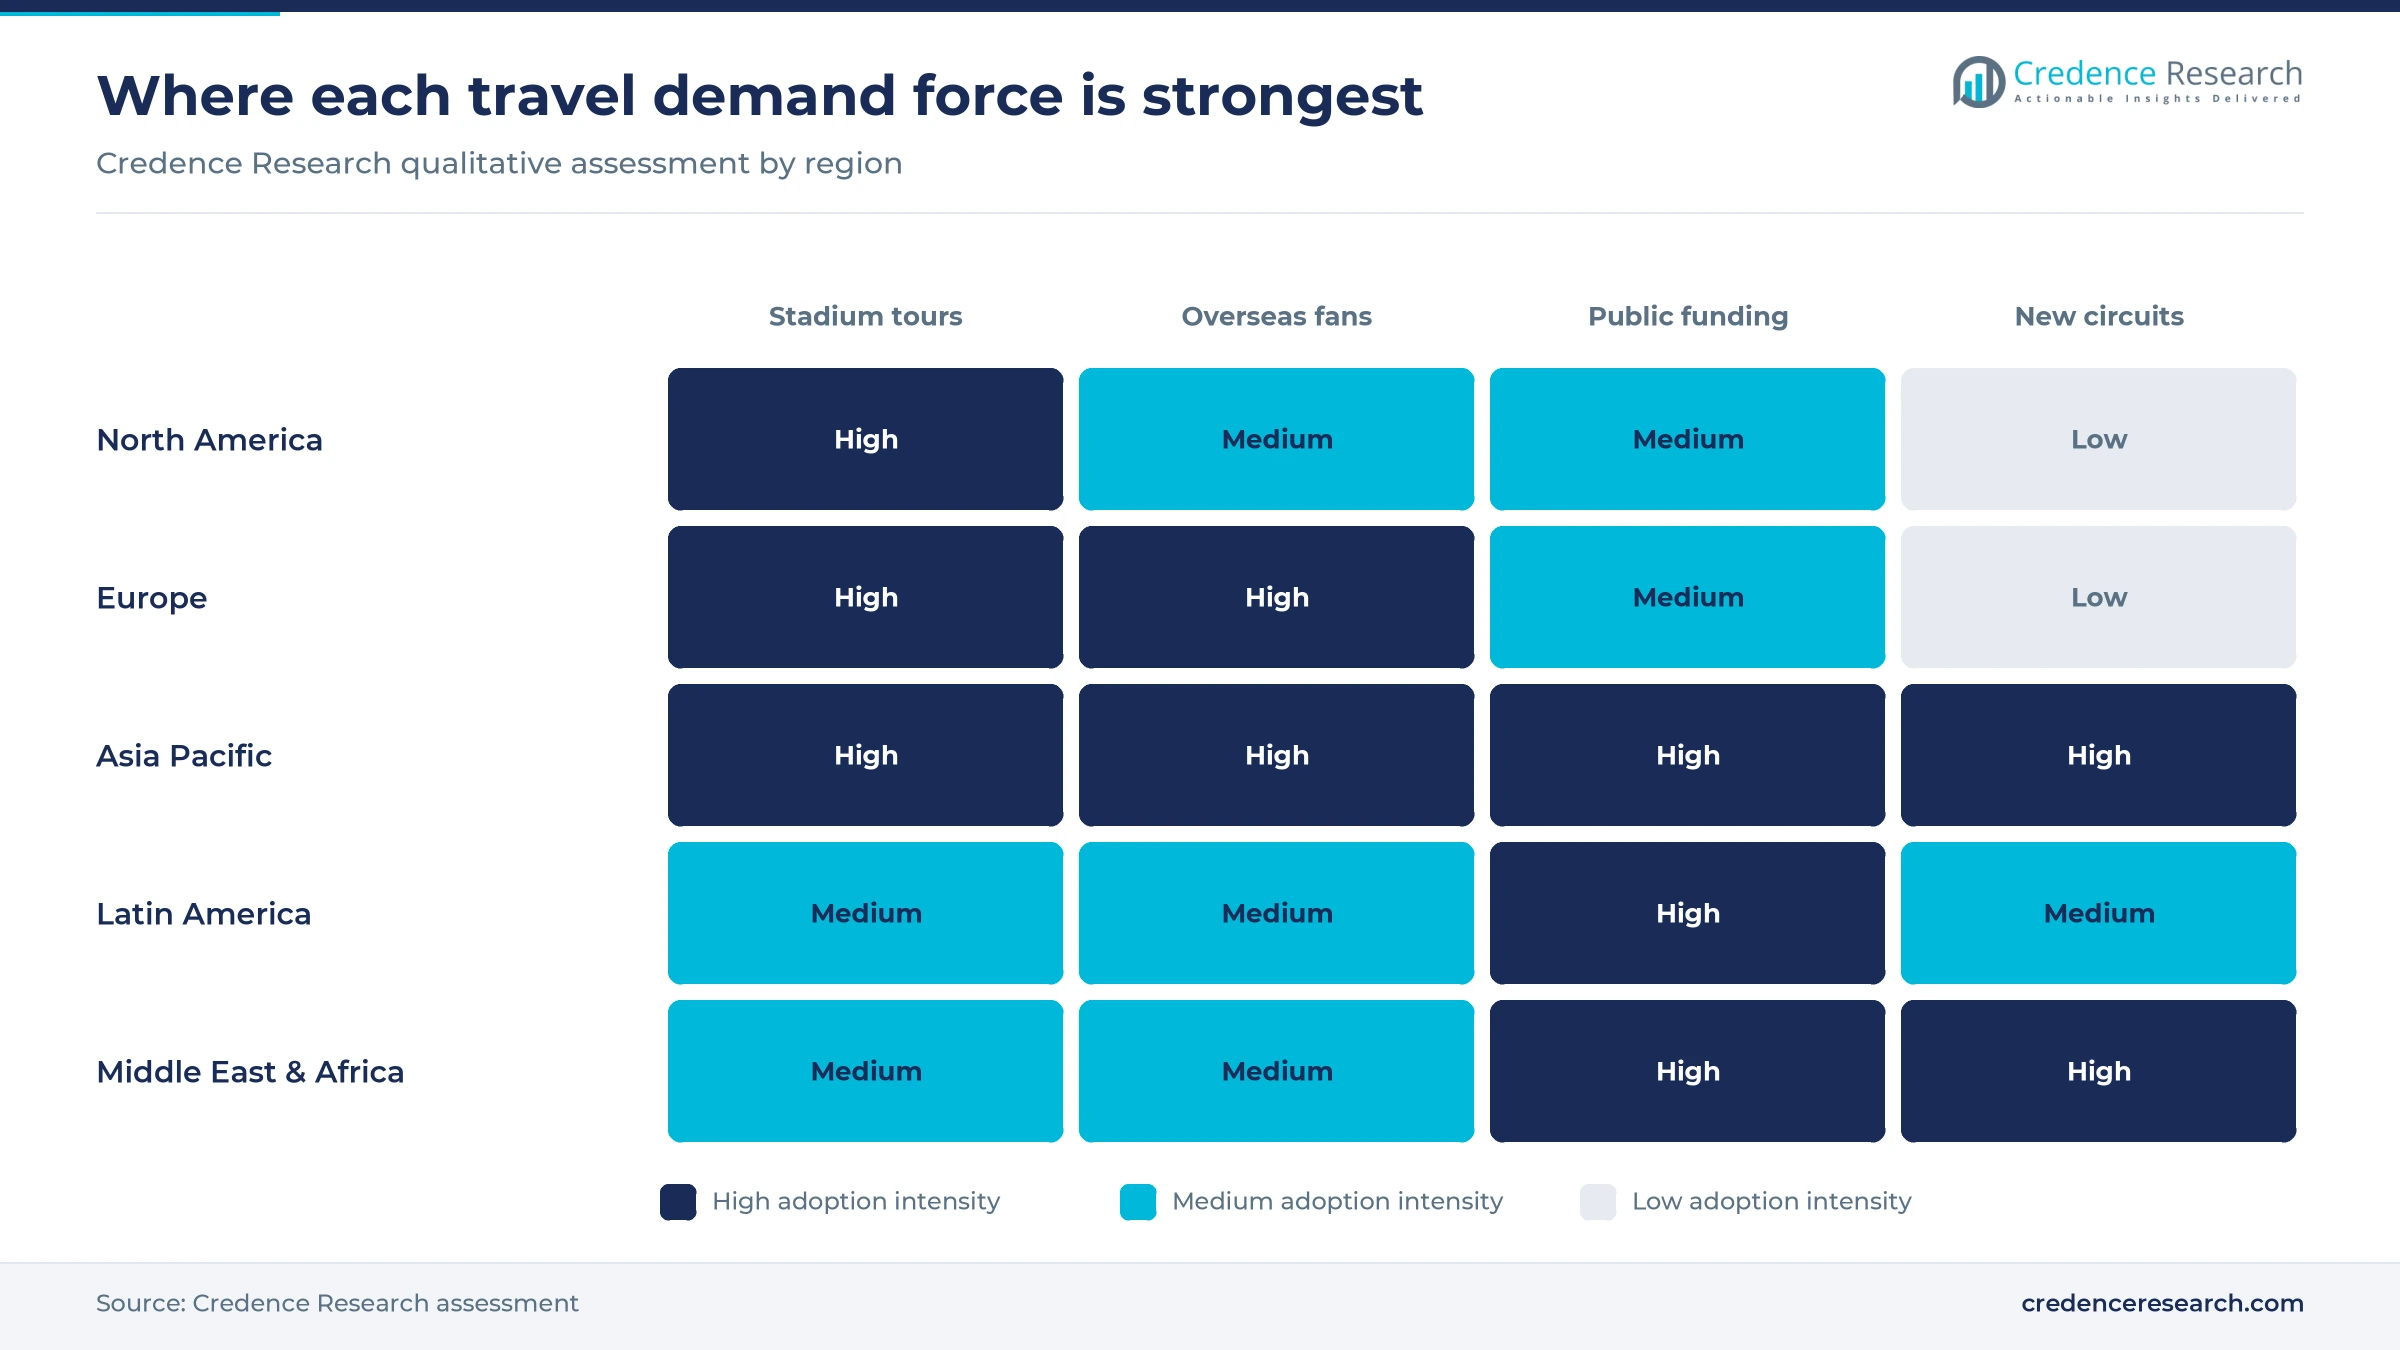
Larger tours create more trips because fans now travel to the few cities that host them. Live Nation hosted 159 million fans across about 55,000 shows in 2025, up 5%, and its fourth-quarter results in February 2026 said international markets exceeded the U.S. in fan count for the first time. In the same results the company said BTS had sold out a 41-date stadium tour, while North American stadium fans more than doubled in 2025. Oasis added a clear example in Britain, where a Barclays forecast reported by Euronews expected £766 of spending per fan across tickets, travel and rooms. As a result, concerts and live performances held 44.0% of 2025 value in the Credence Research estimate.
Overseas fans are lifting value faster than domestic visitors
Cross-border visitors spend more per trip, so even modest volumes lift the value of music tourism sharply. U.K. Music recorded a record 2.1 million overseas visitors at U.K. concerts and festivals in 2025, a 27% rise on the 1.6 million counted in 2024. VisitBritain estimated that around 440,000 of those visitors were likely from the U.S., and The Times linked that flow partly to higher ticket prices at home. Total U.K. spending rose 11.3% to £11.2 billion on only 4.8% more visitors, according to U.K. Music data published in July 2026. London took £3.4 billion of that total, up 27.4%, which shows how strongly long-haul fans favor capital-city stadium runs.
Governments now treat concert visitors as measurable tourism policy
Public bodies increasingly back concerts because they can now count the returns in tax and spending. South Korea's culture ministry used telecom and card data to show that 48,581 foreign tourists visited Goyang during the April 2026 concerts by BTS, with tour visitors staying 7.4 days on average. Governor Gavin Newsom said in an April 2026 statement that Coachella and Stagecoach together generate more than $700 million a year for California. Rio de Janeiro has pledged free Copacabana concerts each May until at least 2028, according to Agência Brasil, after city officials and Riotur projected a BRL 600 million effect from the May 2025 Lady Gaga show.
New concert circuits are opening fresh domestic travel routes
First-time routes add demand because fans who once lacked local shows now plan trips to reach them. EY-Parthenon and BookMyShow Live reported that 86% of fans traveled to Ahmedabad for Coldplay's January 2025 concerts, arriving from over 500 Indian cities. The same April 2025 study found attendees spent ₹585 on hospitality, travel, shopping and dining for every ₹100 spent on tickets. BookMyShow said in its 2025 review, reported by Outlook Respawn, that over 560,000 people traveled between cities for concerts across about 34,000 shows. Nashville shows the mature version of this pattern, because CMA Fest spending reached a record $93 million in 2026, according to the Nashville Convention and Visitors Corp.
Ticket-and-trip bundles and second cities reshape travel
The shift to ticket-and-trip bundles is moving margin to travel platforms
Bundling is the main commercial shift, because it lets a seller capture the trip as well as the seat. Trip.com Group and Live Nation Asia announced a multi-year partnership on Oct. 13, 2025, covering Hong Kong and Macau, Singapore, Thailand, South Korea and mainland China. Live Nation said its partner saw Singapore hotel bookings triple during Lady Gaga's Asia-exclusive shows, while over half of Hong Kong concertgoers extended their stay. Airbnb reinforced the pattern in March 2026, reporting Lollapalooza search growth of about 40% from out-of-state travelers. Online travel agencies therefore grow at 12.47% a year in the Credence Research estimate, which is the quickest rate among booking modes.
The rise of second cities is spreading fan spending beyond capitals
Live demand is moving outward from capitals as venues and fan bases spread to smaller cities. Skift reported in December 2025 that BookMyShow saw footfall jump 400% in Vizag, 230% in Vadodara and 188% in Guwahati. In South Korea, Busan welcomed more than 2.42 million foreign visitors in the first half of 2026, up 43.9%, helped by a June BTS stadium concert, according to The Korea Times. Britain shows the same spread at a smaller scale, because Ed Sheeran's Ipswich shows lifted East Anglia and the Mercury Prize drew 8,000 visitors to Newcastle in 2025, as the Hospitality Professionals Association reported. These routes matter because hotels in smaller cities have fewer competing sources of peak demand.
An opening for longer stays around each concert date
Extended stays are the clearest opportunity, since a ticket holder who adds nights spends far more than a same-day visitor. South Korea's culture ministry found that BTS tour visitors spent 2.91 million won on average in 2026, which was 460,000 won above typical foreign visitors. A survey commissioned by Airbnb found that 53% of Indian Gen Z respondents extended a concert trip to spend more time locally, with average spending of ₹51,000 on their latest event trip. Half of Coldplay attendees in Ahmedabad stayed more than one night. Destination marketers can therefore package city passes and regional tours with presales, which lifts hotel stays without requiring any additional concert capacity.
An opening for Middle East, Africa and Latin America destinations
Emerging destinations can win share because they can pair large public events with tourism budgets and diaspora audiences. Riyadh Season drew more than 2 million visitors within weeks of its Oct. 10, 2025 opening, according to Arab News, which shows the scale of the state entertainment calendar. In Lagos, News Express Nigeria reported N396.54 billion of consumer spending in the December season, with diaspora visitors contributing 55% and U.S.-origin travelers 27% of arrivals. Rio City Hall counted about 2.1 million people at Lady Gaga's May 2025 Copacabana show. UN Tourism data show Africa up 8% in 2025, which gives these destinations a growing inbound base to convert into music trips.
Festival closures, visa costs and resale rules test growth
Independent festivals are closing faster than new ones open
Smaller festivals remain financially fragile, which narrows the choice of destinations outside big stadium cities. The Association of Independent Festivals counted 43 U.K. festivals cancelled, postponed or closed in 2025, after a record 78 in 2024, and said 249 have disappeared since 2019 when Covid losses are included. Rural hotels and local suppliers lose those visits first when events close. The association has proposed tax relief for festivals under 30,000 capacity, although that measure would only ease the pressure.
Visa costs and slower U.S. inbound travel limit long-haul fans
Higher entry costs make long-haul music trips harder to justify for fans from visa-requiring countries. A $250 U.S. visa integrity fee took effect Oct. 1, 2025, raising the total visa cost to $442 for travelers from countries such as India, Brazil and Mexico, according to Dawn. That fee adds about 130% to the earlier $192 cost, which falls on a fan before any flight or concert ticket is bought. U.S. festivals can partly offset this loss through stronger domestic demand.
Ticket price rules could reshape how tours are sold and priced
Regulators are limiting the resale margins that some sellers rely on, and that changes how tours price their seats. Britain announced a ban in November 2025 on reselling tickets above face value after some Oasis seats were listed for more than £4,000, according to Malay Mail. The government estimated fans would save £112 million a year, while breaches could cost companies up to 10% of global turnover. Platforms also face capped service fees, although fans could gain more budget for travel.
Fire, weather and emissions scrutiny add operating risk at large sites
Large outdoor events carry physical and environmental risks that can disrupt thousands of booked trips at short notice. A fire destroyed the Tomorrowland main stage on July 16, 2025, two days before opening, leaving organizers to rework plans for an international crowd, according to AOL. Audience travel also attracts carbon scrutiny, and Coldplay answered by reporting in June 2024 a 59% cut in direct tour emissions, verified by MIT. Organizers therefore need contingency plans that protect fans who have already booked travel.
North America leads while Asia Pacific gains the most ground
| Region | Value, 2025 (USD billion) | Share, 2025 | CAGR, 2026–2035 |
|---|---|---|---|
| North America | 41.48 | 38.0% | 10.60% |
| Europe | 32.74 | 30.0% | 10.70% |
| Asia Pacific | 24.01 | 22.0% | 13.30% |
| Latin America | 6.55 | 6.0% | 11.60% |
| Middle East & Africa | 4.37 | 4.0% | 12.30% |
North America leads on festival destinations and domestic trips
North America held 38.0% of 2025 value and grows at 10.60% a year, because the U.S. music tourism base rests on domestic road and air trips. NBC Palm Springs reported about 250,000 people visiting the Coachella Valley during the 2025 festival period. CMA Fest brought fans from all 50 states and 39 countries in 2026, with an average party spending about $5,363, according to WSMV. Inbound growth is the weak point, since overseas U.S. arrivals fell 3.1% in July 2025.
Europe combines stadium runs with the most established festivals
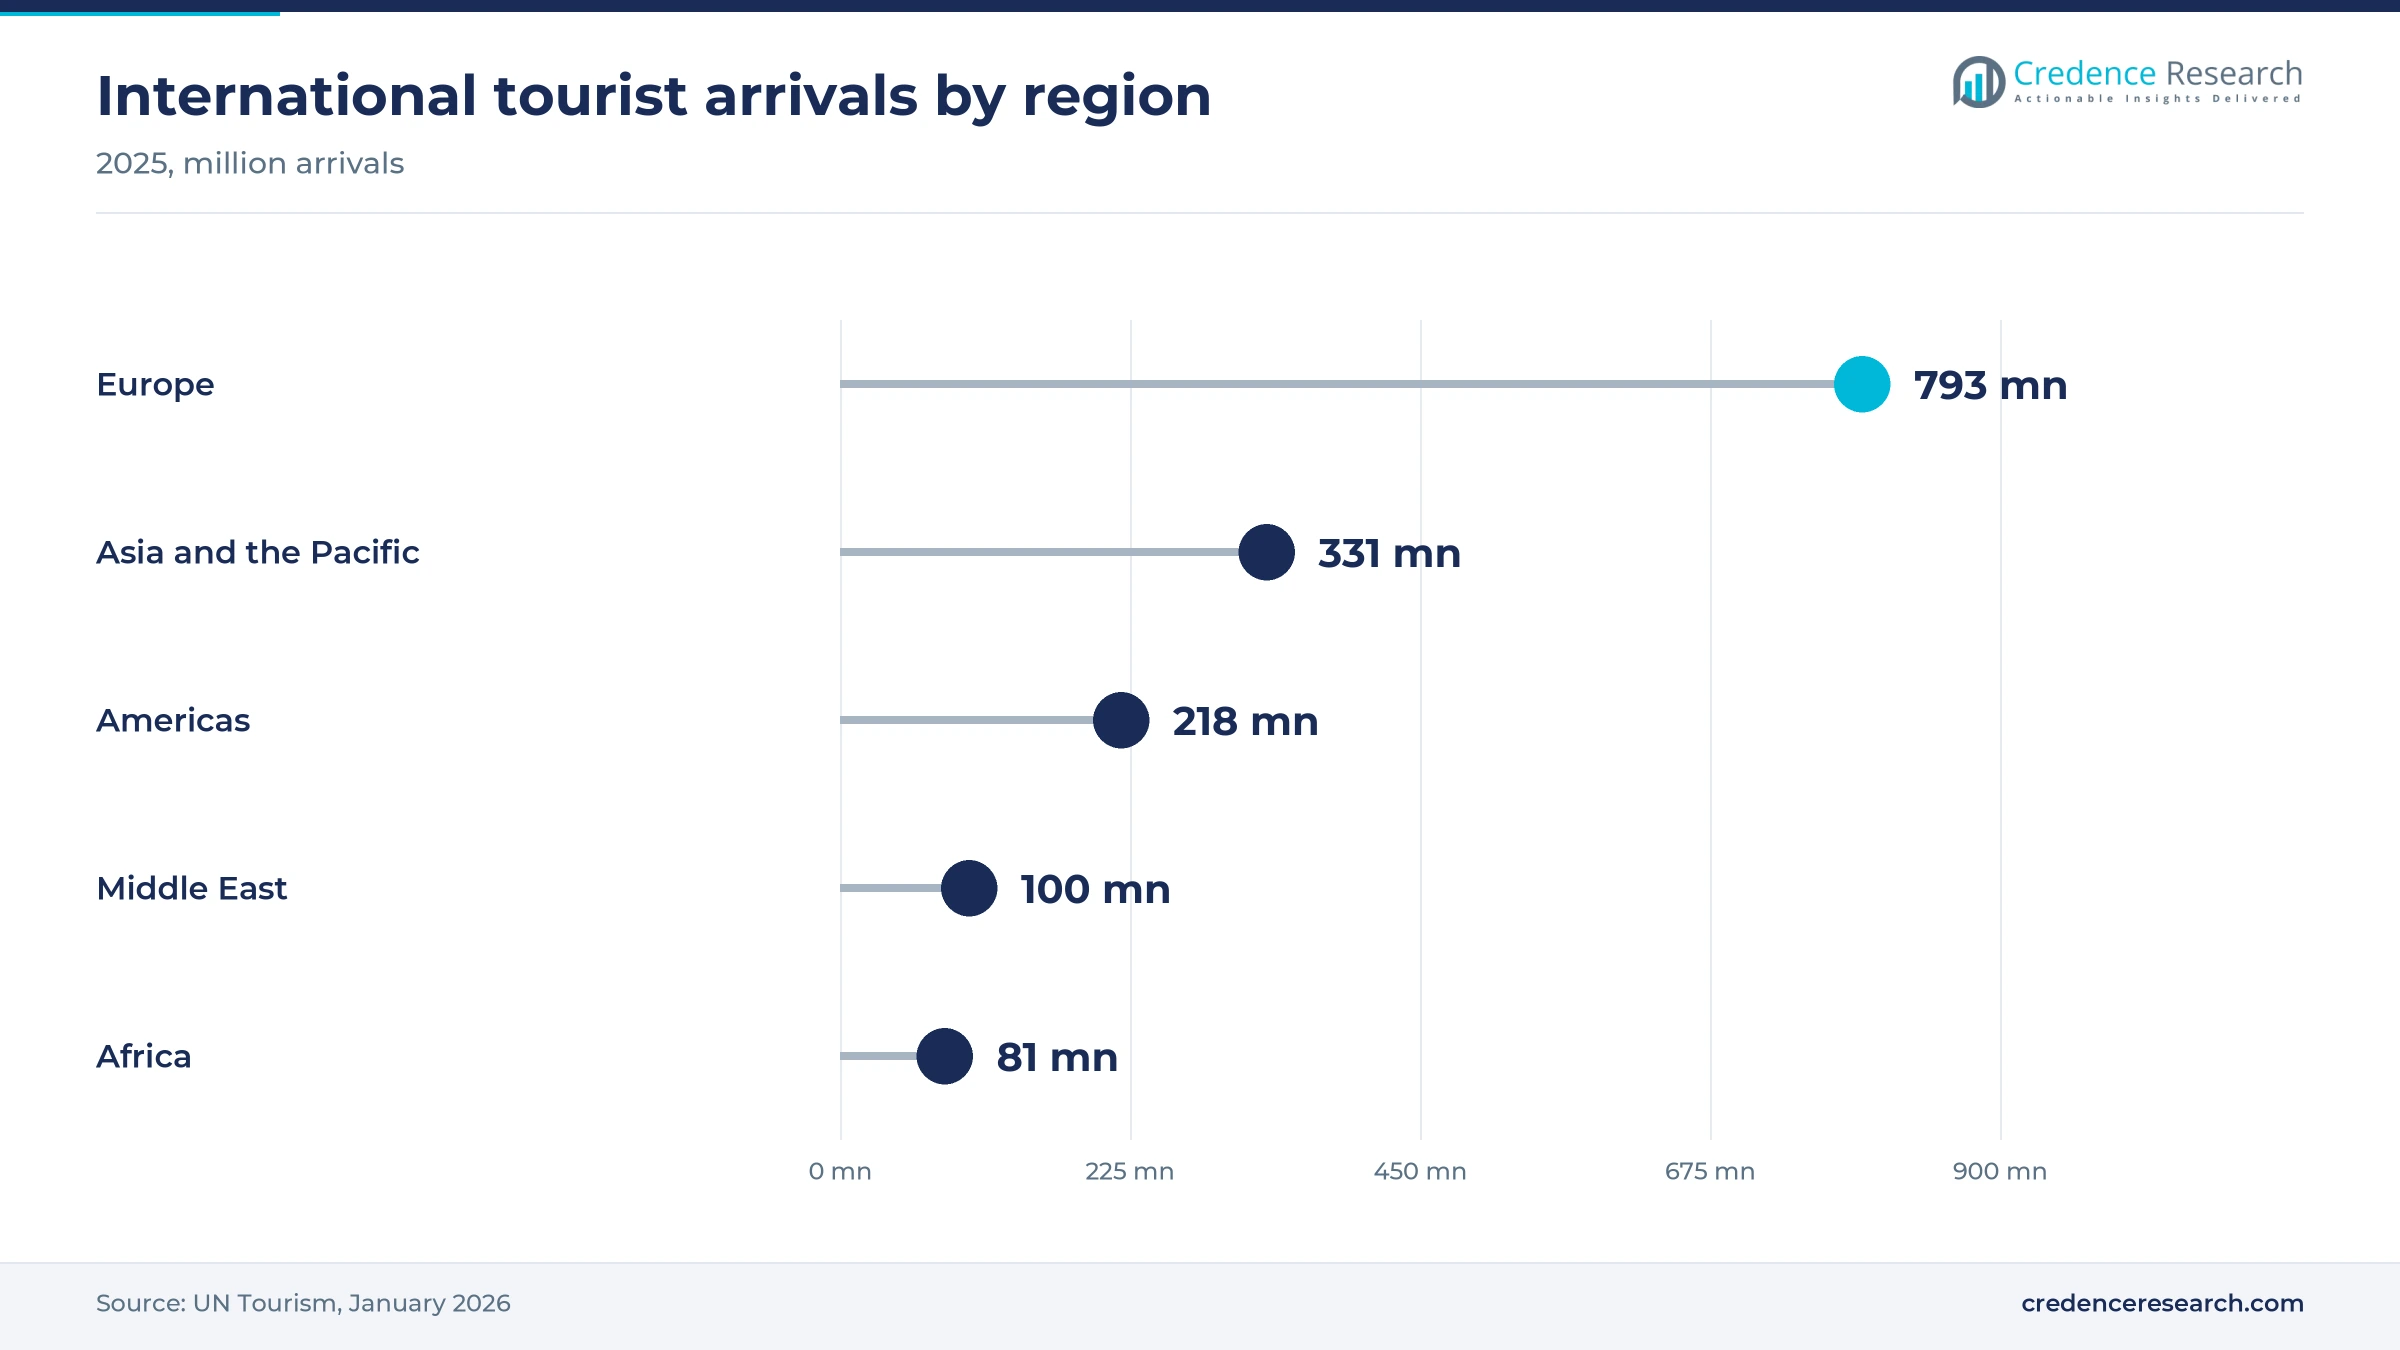
Europe held 30.0% of 2025 value and grows at 10.70% a year, with Britain as its best-measured market. The U.K. counted 24.7 million music tourists in 2025, and Glastonbury is licensed for 210,000 people on site, including staff and performers, according to AP reporting in June 2025. Glastonbury takes a fallow year in 2026, which removes one large event. UN Tourism counted 793 million arrivals in Europe in 2025, the largest regional inbound base.
Asia Pacific grows fastest on K-pop, India and Singapore
Asia Pacific held 22.0% of 2025 value and grows fastest at 13.30% a year, as South Korea, India and Singapore compete for touring dates. South Korea recorded 2.06 million arrivals in March 2026 and a record 4.76 million in the first quarter, up 23%, according to Reuters reporting carried by Malay Mail. BookMyShow reported a 17% rise in Indian live event attendance from January to November 2025. Singapore arrivals rose 8% in May 2025 during Lady Gaga's four exclusive shows.
Latin America turns free beach concerts into tourism campaigns
Latin America held 6.0% of 2025 value and grows at 11.60% a year, led by Brazil's large public events. Rio officials expected 240,000 tourists for the May 2025 Copacabana show, with international visitors staying four days and spending BRL 590.40 a day, according to Agência Brasil. The city hall later counted about 2.1 million attendees, above the expected 1.6 million. Such events create strong short stays, although hotels and transport across the region remain less developed than in Europe.
Middle East and Africa build demand through state and diaspora programs
Middle East and Africa held 4.0% of 2025 value and grows at 12.30% a year, from a small base. UN Tourism reported nearly 100 million Middle East arrivals in 2025, 39% above pre-pandemic levels, and 81 million for Africa. Saudi Arabia supports the region through General Entertainment Authority programs such as Riyadh Season, while Lagos relies on returning diaspora fans each December. Regional conflict remains the main risk, as South Korea's ministry noted when discussing travel turmoil in 2026.
Dated moves that changed how fans travel for live shows
| Development | Status and market relevance |
|---|---|
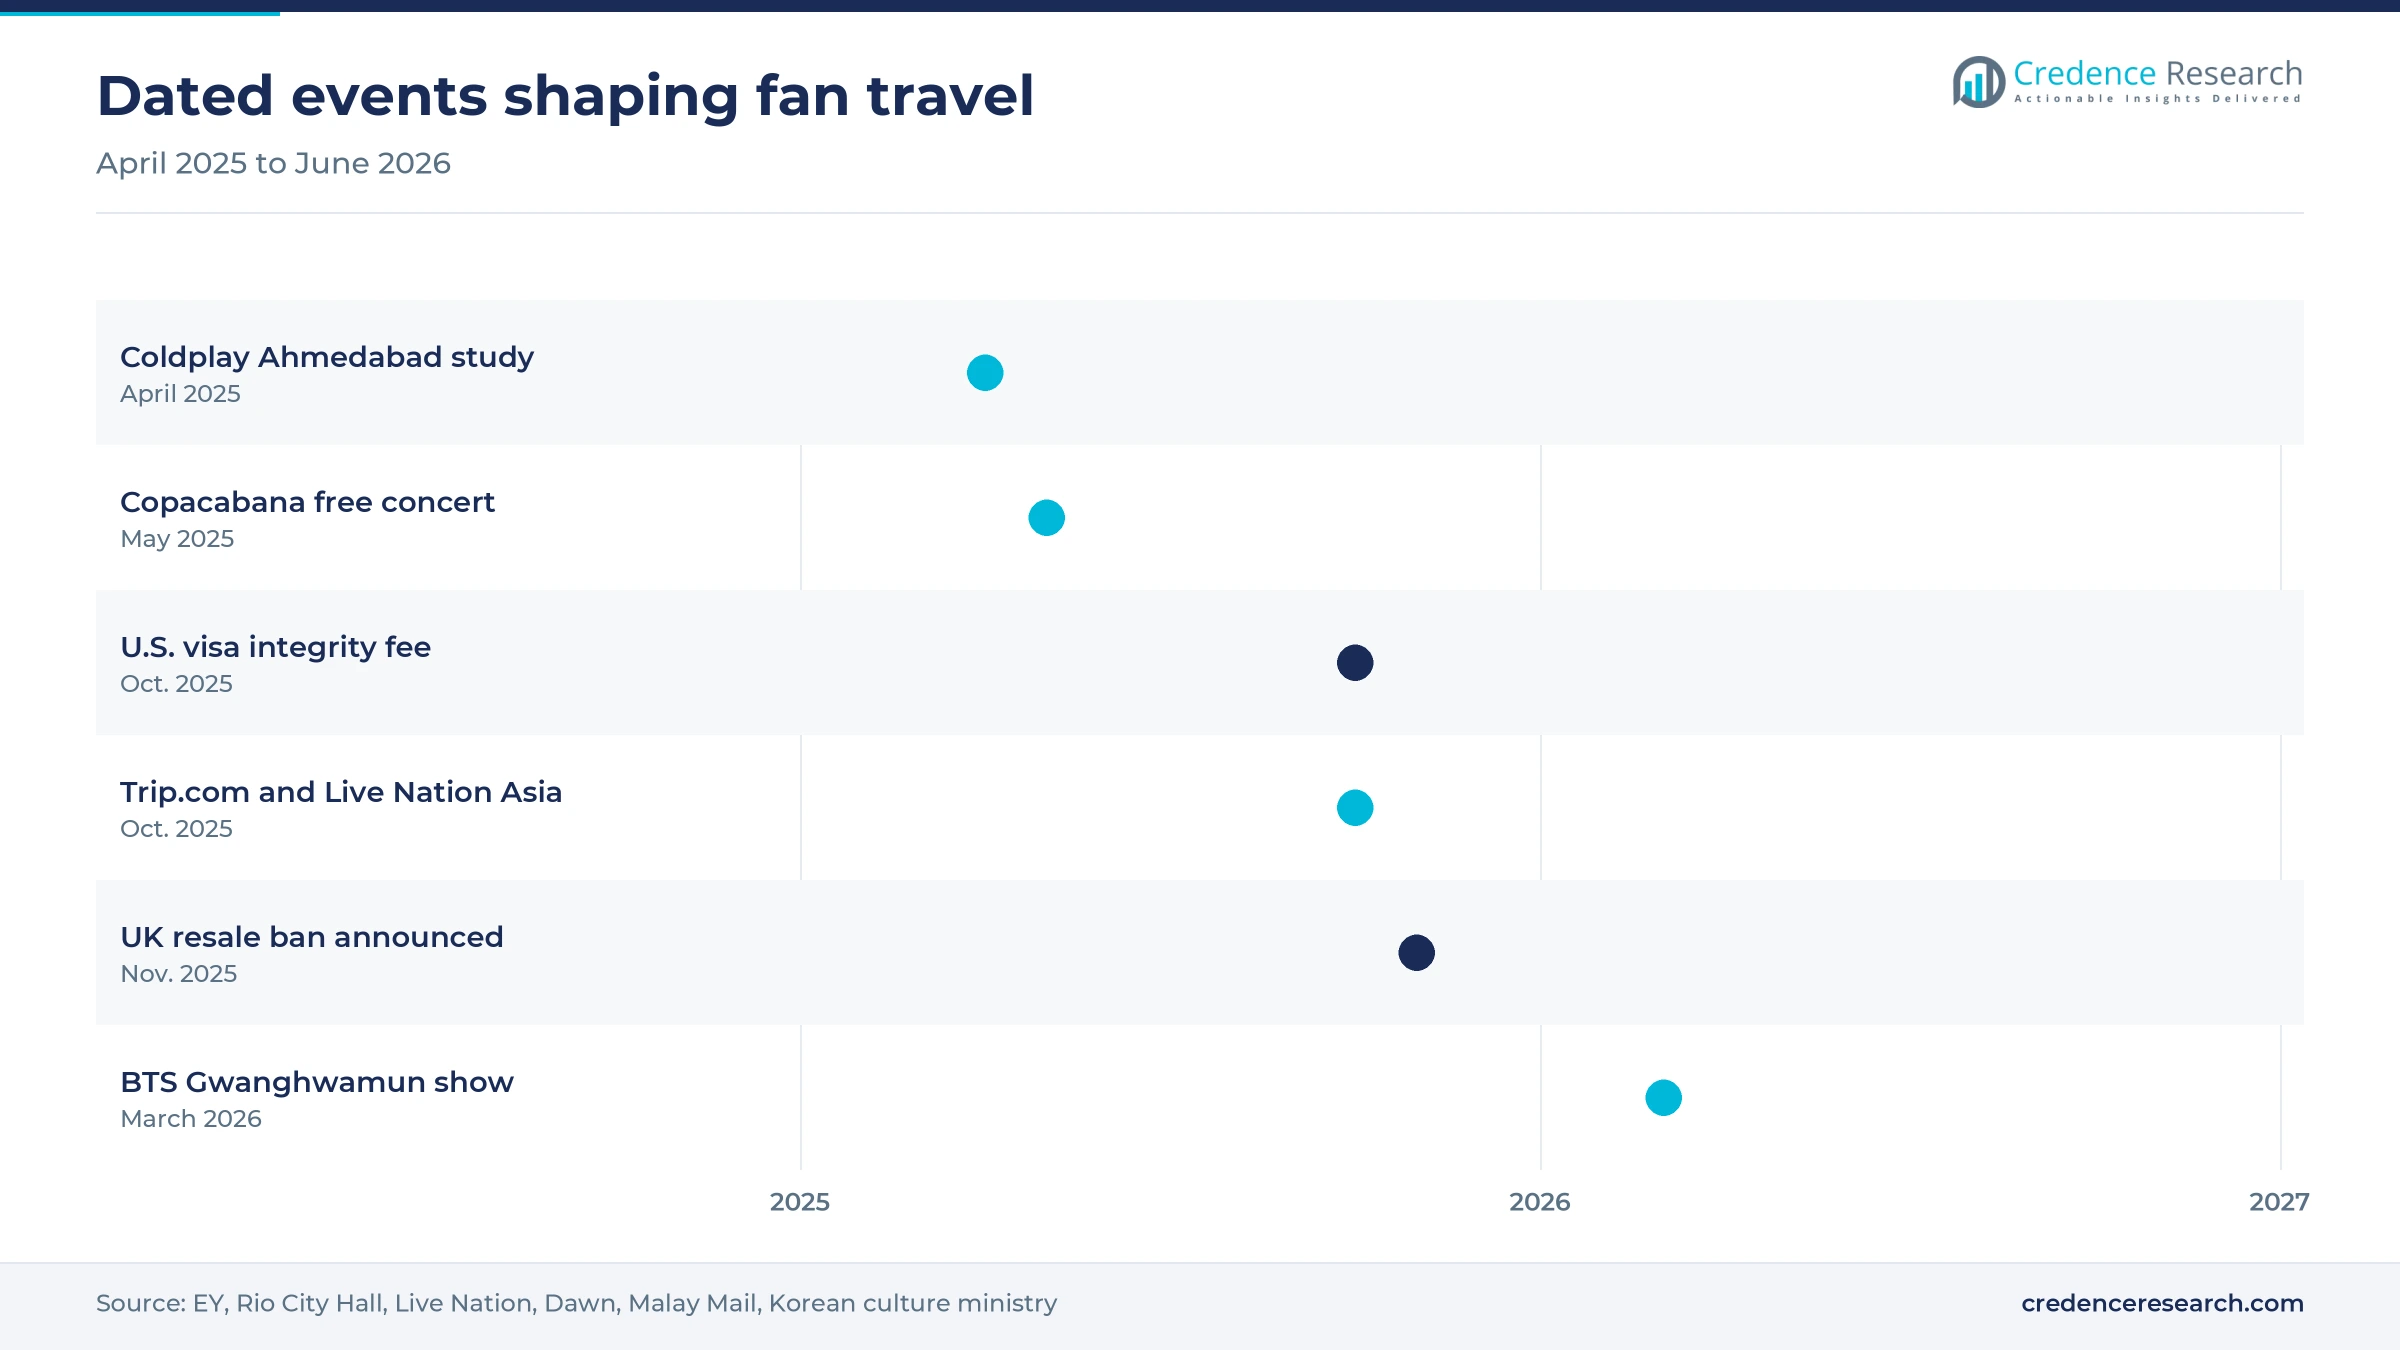
| In April 2025, EY-Parthenon and BookMyShow Live published the Coldplay Ahmedabad study, estimating a ₹641 crore economic impact from about 222,000 fans. | Published; set a benchmark for measuring concert travel in India. |
| In May 2025, Lady Gaga played a free concert on Copacabana Beach that Rio City Hall said drew about 2.1 million people. | Completed; supports the city's yearly May concert plan through at least 2028. |
| In October 2025, Trip.com Group and Live Nation Asia announced a multi-year partnership linking presales, flights and hotels in five Asian markets. | Active; first live entertainment travel move for Trip.com. |
| In November 2025, the U.K. government announced a ban on reselling event tickets above their original price. | Announced; estimated to save fans £112 million a year. |
| In March 2026, BTS returned with a performance at Gwanghwamun Square in Seoul, drawing visitors who stayed 8.7 days on average, according to the culture ministry. | Completed; the ministry launched a further inbound promotion for June 2026. |
Ticketing data, apps and booking tools shape the fan trip
- Presale registration gives artists an early demand signal, as Harry Styles reached 11.5 million registrations in the Live Nation filing for 2025.
- Search data now helps hosts anticipate demand, since Airbnb tracks stay searches by concert weekend and publishes the rise for its hosts.
- Telecom and card analysis lets governments measure stays and spending, as South Korea did for the Goyang concerts using foreign travelers' data.
- Event planning tools handle staff, routes and site plans at large shows, which became essential when Ahmedabad coordinated about 15,000 personnel for Coldplay.
Need a Custom Version of This Report?
Tailor the scope, geography, or segments to your exact requirements.
- Custom geography or segment scope
- Direct access to our analyst team
Promoters and travel platforms compete for the same fan
Competition runs along two lines, control of the artist and control of the trip. Live Nation Entertainment owns the widest route, combining promotion, venues and Ticketmaster, and it expected 2026 openings to add 5 million to 7 million fans a year. Festival brands such as Tomorrowland and Glastonbury compete on destination identity rather than scale, and Glastonbury general tickets sold out in 35 minutes in November 2024. Travel platforms are the new challengers, with Trip.com Group and Airbnb trying to own the booking around a show. Local specialists keep strong positions, including BookMyShow in India, HYBE in South Korea, MDLBEAST in Saudi Arabia and Sixthman in music cruises. No single operator controls fan spending, because hotels, airlines and restaurants collect most of the money outside the gates. Partnerships are therefore the usual route, and buyers should expect more presale and travel alliances.
Which companies shape music travel, and what does each one control?
| Company | Type | Role in the market |
|---|---|---|
| Live Nation Entertainment | Promoter and venue operator | Hosted 159 million fans in 2025 and partners with Trip.com in Asia |
| Ticketmaster | Ticketing platform | Live Nation's ticketing arm, central to primary concert sales |
| Tomorrowland | Festival brand | Belgian destination festival that Brussels Airlines served with 293 flights in 2019 |
| Glastonbury Festival Events | Festival organizer | Runs a site licensed for 210,000 people, fallow in 2026 |
| Trip.com Group | Online travel agency | Sells concert presales with flights and hotels in five Asian markets |
| Airbnb | Accommodation platform | Publishes concert stay search data and commissioned the India Gen Z survey |
| Sixthman | Music cruise operator | Norwegian Cruise Line unit with over 240 sailings since 2001 |
| BookMyShow | Ticketing and live events | Produced the Coldplay Ahmedabad shows and reports India travel data |
| HYBE | Artist label group | Ran a citywide BTS program in Seoul around the 2026 comeback |
| MDLBEAST | Festival producer | Operates Soundstorm in Riyadh, which drew about 732,000 people in 2021 |
Why repeat touring routes matter more than single events
Credence Research's view is that repeat routes matter more than any single blockbuster event. One Oasis or Coldplay run proves demand, but a city only builds lasting income when it hosts major shows every year and has rooms, flights and transit ready. Rio's yearly May concerts and Singapore's exclusive show model are stronger templates than one-off wins. The most useful data point is therefore spending per visitor rather than headline attendance. Stadium sports travel offers a comparison, because both forms of event tourism compete for the same stadium weekends and hotel inventory.
How Credence Research built this market estimate
The report uses 2025 as the base year and 2026 to 2035 as the forecast period. Market values come from the Credence Research model, built from estimated music trips multiplied by spending per trip and checked against U.K. Music data, promoter filings and UN Tourism receipts. The earlier edition of this report mislabeled its values, so the 2025 figure was rebuilt rather than rolled forward. All segment and regional splits shown here are Credence Research estimates. Sources are public filings, government statements, published event studies and news reports, and no interviews or surveys were conducted for this edition.
Asia Pacific and second-tier cities shape demand to 2035
Spending should reach USD 321.27 billion by 2035 as stadium routes extend across Asia and travel platforms make cross-border trips easier to book. UN Tourism expects international arrivals to grow 3% to 4% in 2026, after 1.52 billion in 2025, which gives music trips a supportive base. Growth should run faster than general travel because tickets and trip values both rise. The main uncertainties are entry costs, resale regulation and independent festival closures. Destinations that publish spending data and secure yearly dates should capture the largest share of new demand.
Frequently Asked Questions
How big is the music tourism market?
What is music tourism?
How large is the U.K. music tourism market?
What is driving South Korea music tourism?
How is music tourism growing in India?
How important is the U.S. in music tourism?
How many people go to Glastonbury, and which festival is biggest?
How does music tourism relate to event tourism?
Table of Content
Chapter 1 Market Segmentation
- 1.1 Segmentation Framework
- 1.1.1 Product and Service Classification
- 1.1.2 Application and End-Use Classification
- 1.1.3 Technology and Solution Classification
- 1.1.4 Customer and Distribution Channel Classification
- 1.1.5 Geographic Segmentation
- 1.1.6 Market Segment Definitions and Boundaries
- 1.2 By Type
- 1.2.1 Concerts & Live Performances
- 1.2.2 Music Festivals
- 1.2.3 Cultural Events
- 1.2.4 Music Cruises
- 1.2.5 Others
- 1.3 By End-User
- 1.3.1 Leisure Travelers
- 1.3.2 Music Enthusiasts
- 1.3.3 Corporate Clients
- 1.4 By Age Group
- 1.4.1 Under 18
- 1.4.2 18–34 Years
- 1.4.3 35–54 Years
- 1.4.4 55+ Years
- 1.5 By Booking Mode
- 1.5.1 Direct Booking
- 1.5.2 Online Travel Agencies
- 1.5.3 Travel Agents
Chapter 2 Introduction
- 2.1 Report Objectives and Scope
- 2.2 Product Definition and Industry Terminology
- 2.3 Market Inclusions and Exclusions
- 2.4 Research Process
- 2.4.1 Primary Research and Expert Interviews
- 2.4.2 Secondary Research and Source Review
- 2.4.3 Top-Down and Bottom-Up Estimation
- 2.4.4 Data Triangulation and Verification
- 2.5 Market Size Measurement Basis
- 2.5.1 2025: USD 109.15 billion → 2035: USD 321.27 billion
- 2.6 Historical and Forecast Reference Periods
- 2.6.1 Historical Period: 2018-2025
- 2.6.2 Base Year: 2025
- 2.6.3 Forecast Period: 2025-2035
- 2.7 Research Assumptions and Limitations
Chapter 3 Executive Summary
- 3.1 Market Snapshot and Key Findings
- 3.2 Base-Year Market Size, 2025
- 3.3 Forecast Market Size, 2035
- 3.4 Revenue and Volume Growth Outlook
- 3.5 Key Demand and Supply Indicators
- 3.6 Leading Market Segments
- 3.7 Fastest-Growing Market Opportunities
- 3.8 Regional Performance Highlights
- 3.9 Technology and Industry Transformation
- 3.10 Competitive Landscape Summary
- 3.11 Analyst View and Strategic Implications
Chapter 4 Global Music Tourism Market Trends and Developments
- 4.1 Historical Industry Development, 2018-2025
- 4.2 Recent Market Trends and Developments
- 4.3 Demand and Customer Behavior Trends
- 4.4 Technology and Product Innovation
- 4.5 Artificial Intelligence, Automation and Digitalization
- 4.6 Local Manufacturing and Supply Chain Realignment
- 4.7 Industry Partnerships, Mergers and Acquisitions
- 4.8 Sustainability and Circular Economy Developments
- 4.9 Government and Private Sector Investment Trends
- 4.10 Emerging Business Models and Commercialization
- 4.11 Industry Developments and Announcements
Chapter 5 Global Music Tourism Market Supply and Demand Analysis
- 5.1 Demand Trend and Consumption Analysis, 2018-2025
- 5.2 Demand Forecast, 2025-2035
- 5.3 Supply Chain Structure and Procurement Trends
- 5.4 Supply-Demand Gap and Bottlenecks
- 5.5 Import Dependence and Sourcing Structure
- 5.6 Regional Supply and Demand Concentration
Chapter 6 Global Music Tourism Market Pricing Analysis
- 6.1 Pricing Structure and Measurement
- 6.2 Historical Pricing Trends, 2018-2025
- 6.3 Pricing Outlook, 2025-2035
- 6.4 Pricing by Product and Market Segment
- 6.5 Geographic Pricing Differences
- 6.6 Key Input, Energy, Labor and Logistics Costs
- 6.7 Contract Pricing and Purchasing Models
- 6.8 Pricing Sensitivity and Competitive Positioning
- 6.9 Price, Margin and Profitability Implications
Chapter 7 Global Music Tourism Market Dynamics
- 7.1 Market Growth Drivers
- 7.1.1 Demand-Side Drivers
- 7.1.2 Technology and Innovation Drivers
- 7.1.3 Infrastructure and Investment Drivers
- 7.1.4 Regulatory and Policy Drivers
- 7.2 Market Restraints
- 7.2.1 Cost and Affordability Constraints
- 7.2.2 Technology and Adoption Barriers
- 7.2.3 Supply Chain and Operational Constraints
- 7.3 Market Challenges
- 7.3.1 Competitive Pressure and Margin Erosion
- 7.3.2 Skills, Infrastructure and Implementation Gaps
- 7.4 Emerging Market Opportunities
- 7.5 Market Dynamics Impact and Time-Horizon Assessment
Chapter 8 Global Music Tourism Value Chain Analysis
- 8.1 Industry Value Chain Overview
- 8.2 Upstream Suppliers and Critical Inputs
- 8.3 Technology and Component Providers
- 8.4 Manufacturing or Service Delivery
- 8.5 Distribution, Channel Partners and Integrators
- 8.6 Downstream Applications and End Users
- 8.7 Value Addition and Profit Pools
- 8.8 Vertical Integration and Outsourcing
- 8.9 Supplier Concentration and Risk
- 8.10 Supply Chain Localization and Resilience
Chapter 9 Global Music Tourism Market Regulations and Policies
- 9.1 Relevant Laws, Standards and Compliance Frameworks
- 9.2 Product, Service, Safety and Quality Requirements
- 9.3 Government Policies, Incentives and Subsidies
- 9.4 Imports, Exports and Trade Barriers
- 9.5 Public Procurement and Local Content Requirements
- 9.6 Data Protection, AI and Cybersecurity Compliance
- 9.7 Upcoming Policy Changes and Market Implications
Chapter 10 Global Music Tourism Market Hotspots and Opportunities
- 10.1 Market Opportunity Mapping and Growth Hotspots
- 10.2 High-Growth Applications and Customer Groups
- 10.3 Underserved Markets and White-Space Opportunities
- 10.4 Emerging Technology and Product Opportunities
- 10.5 New Capacity and Investment Hotspots
- 10.6 Market Entry and Expansion Opportunities
- 10.7 Distribution and Partnership Opportunities
- 10.8 Near-Term and Long-Term Commercial Potential
- 10.9 Opportunity Attractiveness and Execution Risks
Chapter 11 Global Music Tourism Market Outlook, 2025-2035
- 11.1 Market Size and Analysis
- 11.1.1 Revenue (Market Measurement: 2025: USD 109.15 billion → 2035: USD 321.27 billion)
- 11.1.2 Historical Market Size, 2018-2025
- 11.1.3 Base-Year Market Size, 2025
- 11.2 Market Forecast, 2025-2035
- 11.2.1 Revenue Forecast to 2035
- 11.2.2 CAGR and Year-on-Year Growth
- 11.2.3 Incremental Revenue Opportunity
- 11.3 Forecast Assumptions and Scenario Analysis
- 11.3.1 Base-Case Forecast
- 11.3.2 Optimistic and Conservative Scenarios
- 11.3.3 Technology, Pricing and Policy Sensitivities
- 11.4 Market Attractiveness and Growth Outlook
Chapter 12 Global Music Tourism Market Segmentation and Outlook
- 12.1 Segmentation Summary and Market Shares, 2025
- 12.2 Largest and Fastest-Growing Segments
- 12.3 By Type - Market Size and Forecast, 2025-2035
- 12.3.1 Segment Definition and Scope
- 12.3.2 Historical Market Size, 2018-2025
- 12.3.3 Revenue Forecast, 2025-2035
- 12.3.4 Base-Year Market Share, 2025
- 12.3.5 Segment CAGR and Growth Drivers
- 12.3.6 Subsegment Market Size and Forecast
- 12.3.6.1 Concerts & Live Performances
- 12.3.6.2 Music Festivals
- 12.3.6.3 Cultural Events
- 12.3.6.4 Music Cruises
- 12.3.6.5 Others
- 12.3.7 Subsegment Pricing and Adoption Trends
- 12.3.8 Leading Suppliers and Competition
- 12.3.9 Regional Demand and Opportunities
- 12.4 By End-User - Market Size and Forecast, 2025-2035
- 12.4.1 Segment Definition and Scope
- 12.4.2 Historical Market Size, 2018-2025
- 12.4.3 Revenue Forecast, 2025-2035
- 12.4.4 Base-Year Market Share, 2025
- 12.4.5 Segment CAGR and Growth Drivers
- 12.4.6 Subsegment Market Size and Forecast
- 12.4.6.1 Leisure Travelers
- 12.4.6.2 Music Enthusiasts
- 12.4.6.3 Corporate Clients
- 12.4.7 Subsegment Pricing and Adoption Trends
- 12.4.8 Leading Suppliers and Competition
- 12.4.9 Regional Demand and Opportunities
- 12.5 By Age Group - Market Size and Forecast, 2025-2035
- 12.5.1 Segment Definition and Scope
- 12.5.2 Historical Market Size, 2018-2025
- 12.5.3 Revenue Forecast, 2025-2035
- 12.5.4 Base-Year Market Share, 2025
- 12.5.5 Segment CAGR and Growth Drivers
- 12.5.6 Subsegment Market Size and Forecast
- 12.5.6.1 Under 18
- 12.5.6.2 18–34 Years
- 12.5.6.3 35–54 Years
- 12.5.6.4 55+ Years
- 12.5.7 Subsegment Pricing and Adoption Trends
- 12.5.8 Leading Suppliers and Competition
- 12.5.9 Regional Demand and Opportunities
- 12.6 By Booking Mode - Market Size and Forecast, 2025-2035
- 12.6.1 Segment Definition and Scope
- 12.6.2 Historical Market Size, 2018-2025
- 12.6.3 Revenue Forecast, 2025-2035
- 12.6.4 Base-Year Market Share, 2025
- 12.6.5 Segment CAGR and Growth Drivers
- 12.6.6 Subsegment Market Size and Forecast
- 12.6.6.1 Direct Booking
- 12.6.6.2 Online Travel Agencies
- 12.6.6.3 Travel Agents
- 12.6.7 Subsegment Pricing and Adoption Trends
- 12.6.8 Leading Suppliers and Competition
- 12.6.9 Regional Demand and Opportunities
- 12.7 Segment Growth Comparison
- 12.8 Segment Attractiveness and Priority Matrix
Chapter 13 Global Music Tourism End-Use and Application Market Outlook
- 13.1 End-Use Industry and Customer Demand Structure
- 13.2 Leading Applications and Customer Groups
- 13.3 End-Use Market Size, Share and Forecast
- 13.4 Major End-Use Industry Deep Dives
- 13.4.1 Customer Requirements and Use Cases
- 13.4.2 Demand and Replacement Cycles
- 13.4.3 Technical and Regulatory Considerations
- 13.4.4 Purchasing and Procurement Models
- 13.4.5 Leading Vendors and Distribution Channels
- 13.4.6 Forecast and Commercial Opportunities
- 13.5 Emerging Applications and Cross-Segment Demand
- 13.6 End-Use Industry Investment Priorities
Chapter 14 Global Music Tourism Geographic Market Outlook, 2025-2035
- 14.1 Regional Market Size and Share, 2025
- 14.2 Regional Market Forecast, 2025-2035
- 14.3 Regional Pricing, Production and Demand Differences
- 14.4 North America
- 14.4.1 United States
- 14.4.2 Canada
- 14.4.3 Mexico
- 14.5 Europe
- 14.5.1 Germany
- 14.5.2 France
- 14.5.3 Italy
- 14.5.4 United Kingdom
- 14.5.5 Spain
- 14.5.6 Poland
- 14.5.7 Russia
- 14.5.8 Netherlands
- 14.5.9 Belgium
- 14.5.10 Sweden
- 14.5.11 Denmark
- 14.5.12 Norway
- 14.5.13 Rest of Europe
- 14.6 Asia Pacific
- 14.6.1 China
- 14.6.2 India
- 14.6.3 Japan
- 14.6.4 South Korea
- 14.6.5 Thailand
- 14.6.6 Indonesia
- 14.6.7 Vietnam
- 14.6.8 Malaysia
- 14.6.9 Australia
- 14.6.10 Rest of Asia Pacific
- 14.7 Latin America
- 14.7.1 Brazil
- 14.7.2 Argentina
- 14.7.3 Colombia
- 14.7.4 Chile
- 14.7.5 Rest of Latin America
- 14.8 Middle East
- 14.8.1 Saudi Arabia
- 14.8.2 United Arab Emirates
- 14.8.3 Turkey
- 14.8.4 Israel
- 14.8.5 Iran
- 14.8.6 Rest of the Middle East
- 14.9 Africa
- 14.9.1 South Africa
- 14.9.2 Egypt
- 14.9.3 Nigeria
- 14.9.4 Morocco
- 14.9.5 Rest of Africa
- 14.10 Regional Investment, Policy and Supply Chain Differences
- 14.11 Regional Competitive Landscape
- 14.12 Geographic Growth Hotspots
Chapter 15 Global Music Tourism Technology, Innovation and Sustainability Outlook
- 15.1 Technology Landscape and Maturity
- 15.2 Product, Process and Service Innovation
- 15.3 AI, Automation and Digital Tools in the Industry
- 15.4 Technology Adoption and Performance Benchmarking
- 15.5 Innovation Pipeline and R&D Investment
- 15.6 Energy Efficiency and Resource Management
- 15.7 Sustainability, Recycling and Circularity
- 15.8 Technology Roadmap, 2025-2035
- 15.9 Risks of Obsolescence and Technology Substitution
Chapter 16 Global Music Tourism Market Key Strategic Imperatives
- 16.1 Growth and Market Entry Priorities
- 16.2 High-Return Products and Segments
- 16.3 Pricing, Profitability and Cost Optimization
- 16.4 Technology Investment and Product Differentiation
- 16.5 Supply Chain Localization and Resilience
- 16.6 Distribution and Customer Acquisition
- 16.7 Partnership, Acquisition and Capacity Strategy
- 16.8 Regional Expansion Priorities
- 16.9 Short-, Medium- and Long-Term Actions
Chapter 17 Competition Outlook
- 17.1 Industry Competition Characteristics
- 17.2 Market Structure and Concentration
- 17.3 Market Share and Competitive Positioning, 2025
- 17.4 Company-Wise Revenue and Product Benchmarking
- 17.5 Production and Service Capacity Benchmarking
- 17.6 Technology, Pricing and Differentiation
- 17.7 Regional Footprint and Distribution Strength
- 17.8 Mergers, Acquisitions and Strategic Alliances
- 17.9 New Entrants and Competitive Threats
- 17.10 Porter's Five Forces and Industry Attractiveness
- 17.11 Competitive Outlook, 2025-2035
Chapter 18 Company Profiles
- 18.1 Company Coverage and Selection Criteria
- 18.2 Live Nation Entertainment
- 18.2.1 Business Description
- 18.2.2 Company Ownership and Geographic Presence
- 18.2.3 Product and Service Portfolio
- 18.2.4 Manufacturing and Operating Footprint
- 18.2.5 Financial Performance and Investment
- 18.2.6 Market Share and Competitive Position
- 18.2.7 Technology and Innovation Capabilities
- 18.2.8 Strategic Alliances or Partnerships
- 18.2.9 Recent Developments
- 18.2.10 Growth Strategy and Outlook
- 18.3 Ticketmaster
- 18.4 Tomorrowland
- 18.5 Glastonbury Festival Events
- 18.6 Trip.com Group
- 18.7 Airbnb
- 18.8 Sixthman
- 18.9 BookMyShow
- 18.10 HYBE
- 18.11 MDLBEAST
- 18.12 Other Relevant Market Participants
Note: Every listed company is profiled on the structure shown under the first company. The company list is preliminary and may change based on research findings, market developments, data availability and client requirements.
Chapter 19 Disclaimer
- 19.1 Research and Forecast Disclaimer
- 19.2 Data Source and Estimation Limitations
Note: The depth of individual sections depends on data availability for this market. Volume, capacity, trade and other unit-based metrics are included where applicable.

