
Overnight coaches carry most long-distance road travel
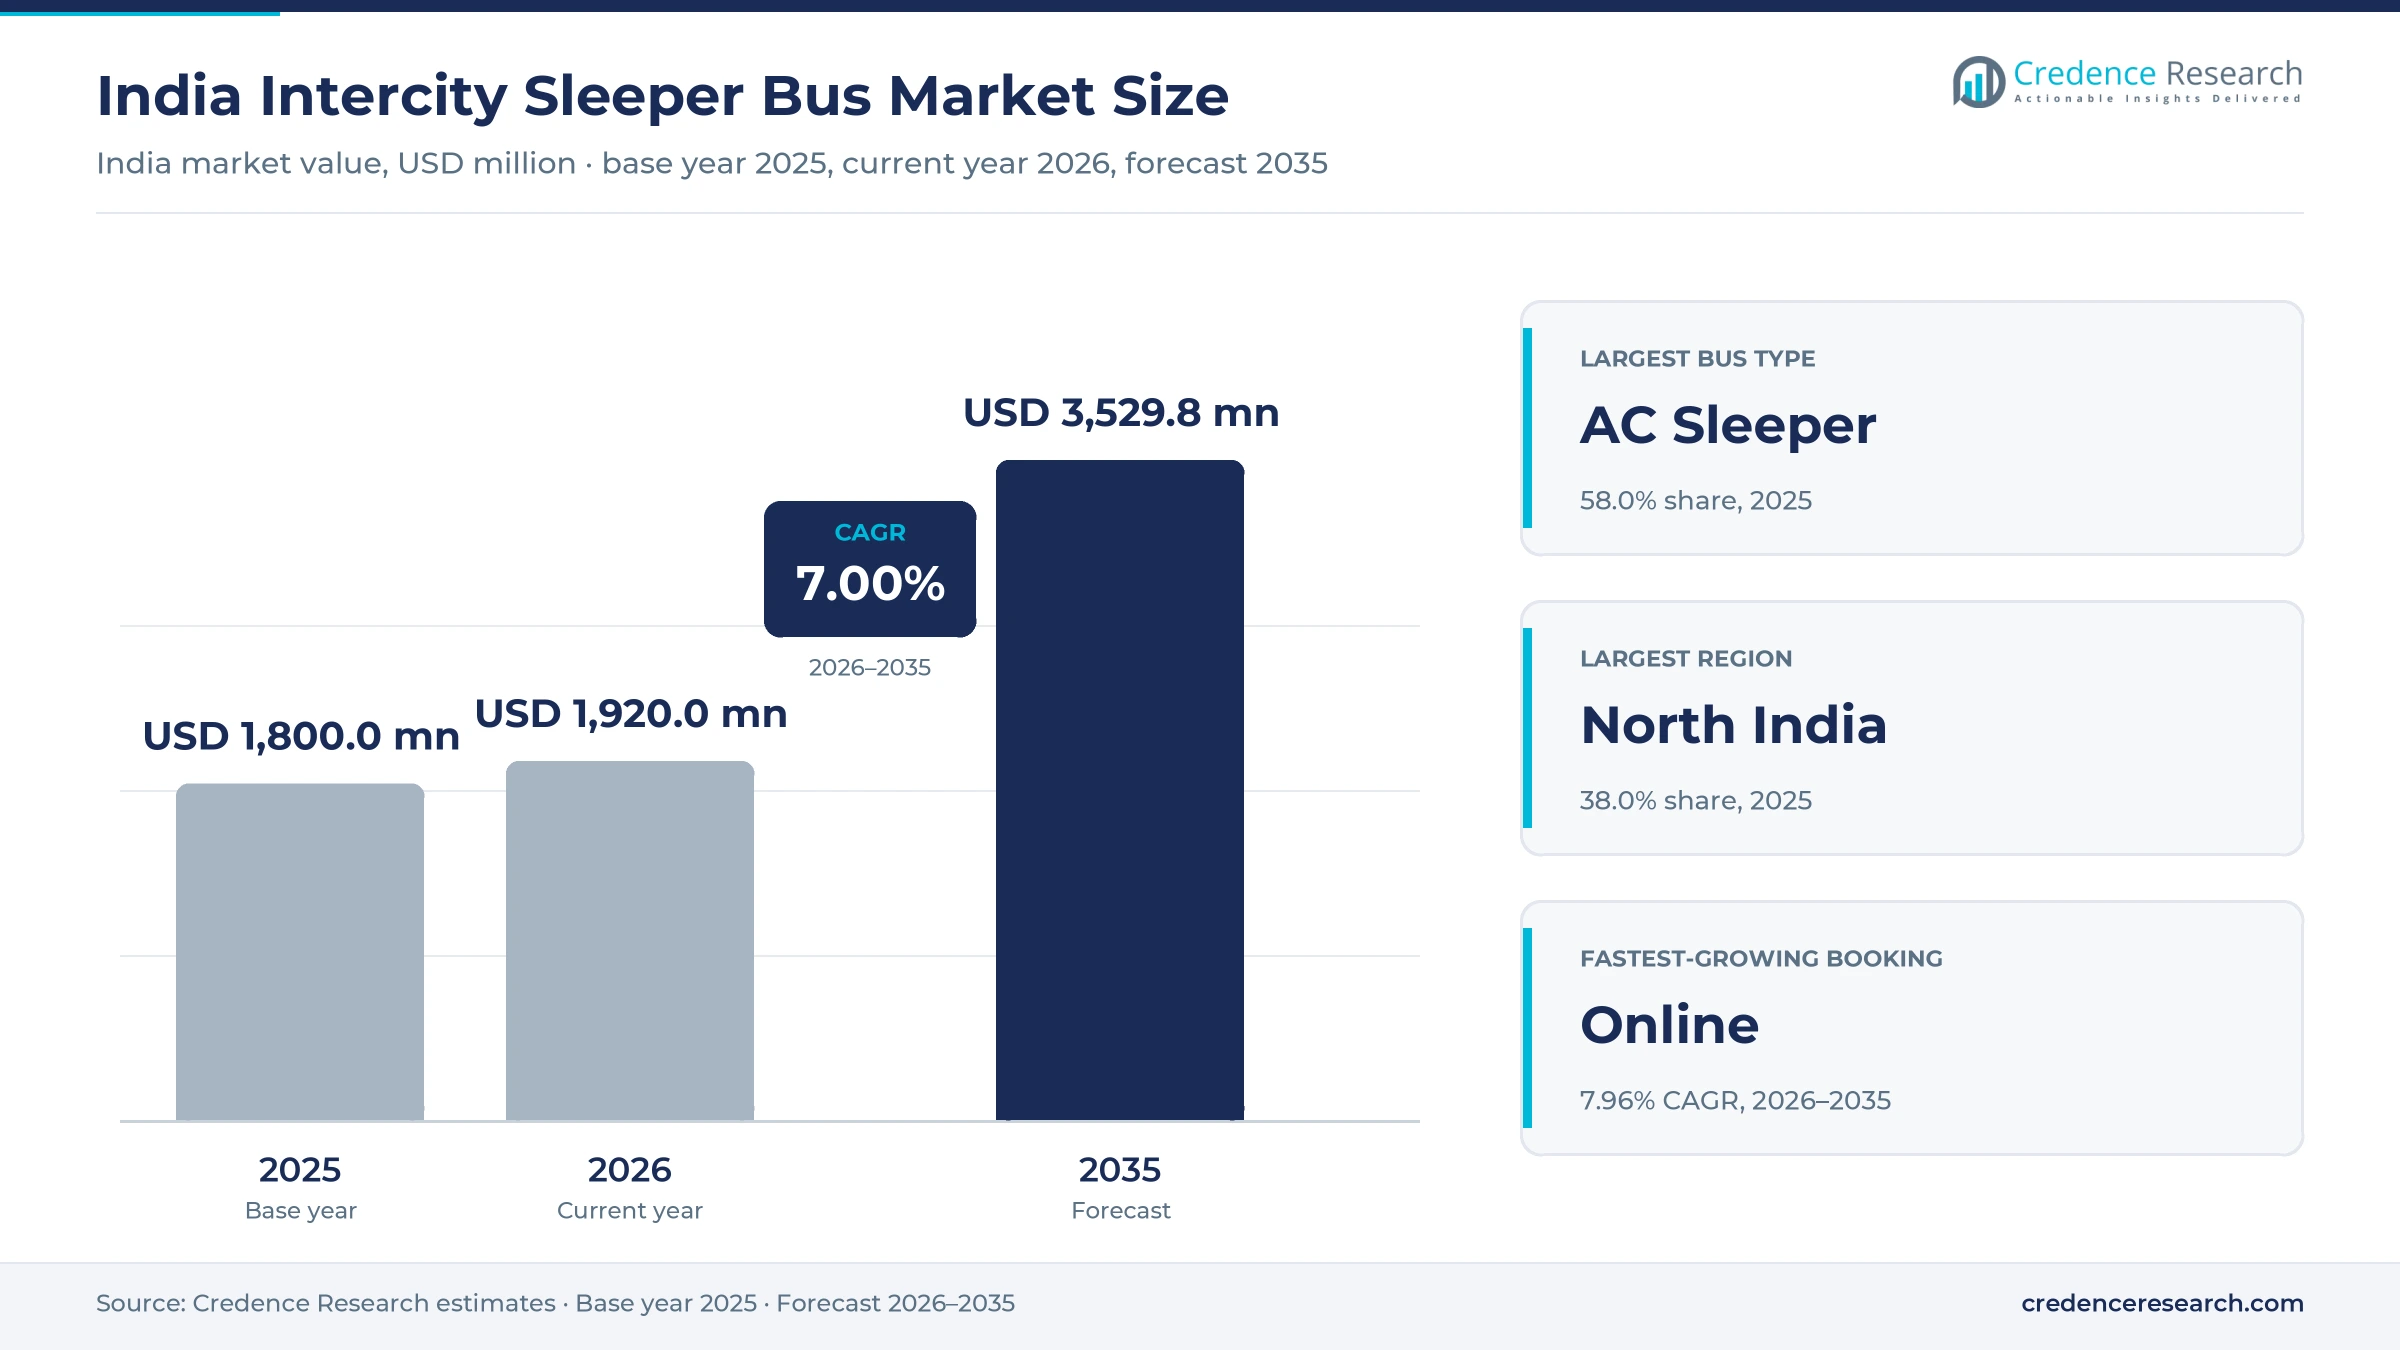
The India intercity sleeper bus market was valued at USD 1.80 billion in 2025 and is projected to increase from USD 1.92 billion in 2026 to USD 3.53 billion by 2035, registering a CAGR of 7.00% during 2026–2035. Overnight travel between cities 300 to 1,000 kilometers apart gives sleeper coaches their core demand, because a berth replaces a hotel night and a lost working day. North India held the largest regional share, 38.0% in 2025, supported by heavy pilgrimage and migrant traffic from Uttar Pradesh, Bihar and Delhi. East India is the fastest-growing region at 7.69% a year as Odisha and West Bengal corridors fill earlier in festival seasons. The Ministry of Road Transport and Highways adds a regulatory change, because its revised bus body code took effect on Sept. 1, 2025, and new sleeper coaches now need accredited builders and inspected fire systems. As a result, certified AC fleets are gaining ground over older locally built coaches.
What counts as a sleeper berth sale, and where do travelers buy one?
The market counts the annual fare value of sleeper berths sold on intercity coaches in India, covering AC sleepers, non-AC sleepers and the berth decks of seater-sleeper coaches run by private operators and state transport undertakings. Travelers buy berths through online platforms and operator apps or at agent counters and depots, and fares move with season, day of week and berth position.
The market excludes seat-only coaches, city and school buses, charter hire and the sale of the vehicles themselves. Chassis makers, accredited body builders, financiers and ticketing platforms sit upstream, while state transport departments set permits, fare caps and safety inspections that shape what operators can charge.
India Intercity Sleeper Bus Market Insights
- The India intercity sleeper bus market rises from USD 1.80 billion in 2025 to USD 3.53 billion by 2035, a 7.00% CAGR built on full overnight berths and premium coaches.
- North India held 38.0% of 2025 value, and Uttar Pradesh was the main destination for 15.7% of overnight visitor trips in the latest national tourism survey.
- AC sleepers led with 58.0% of 2025 value, as AC services reached 72% of intercity bus journeys between October 2025 and March 2026.
- Union Minister Nitin Gadkari announced in January 2026 that only accredited manufacturers may build sleeper coaches, after six fires killed 145 people in six months.
- VRL Travels, SRS Travels, Orange Travels and IntrCity SmartBus compete with state fleets such as KSRTC and SETC, while redBus and AbhiBus sell most online berths.
AC sleepers lead as travelers trade up to berths
Why do AC sleepers carry most berth revenue?
Based on bus, the market is categorized into AC sleeper, non-AC sleeper and seater-sleeper coaches. AC Sleeper coaches led with 58.0% of 2025 value because travelers are paying for comfort, and AC services rose to 72% of intercity journeys in the six months to March 2026 from 67% a year earlier, according to redBus. AC Sleeper coaches also grow fastest at 7.45% a year as state fleets trade up, with SETC in Tamil Nadu ordering 20 Volvo sleepers in October 2025. Seater-sleeper hybrids took 34% of journeys, which keeps them central on mixed-demand routes.
How do routes above and below 500 kilometers divide sleeper demand?
Based on route, the market is categorized into over 500 km and under 500 km routes. Over 500 km routes led with 57.0% of 2025 value because berths earn their premium on full overnight runs, and IntrCity SmartBus reports an average trip of more than 311 miles with about 95% of services running overnight, according to TechCrunch in October 2025. Under 500 km routes grow fastest at 7.39% a year as shorter corridors fill and as NueGo launched electric AC sleepers in March 2025 on pairs such as Bangalore to Chennai, where a 350-kilometer battery range suffices.
Why is online booking the larger and faster channel for berths?
Based on booking, the market is categorized into online and offline sales. Online booking led with 56.0% of 2025 value because berth buyers want to choose a lower or upper berth before travel, and redBus counted 6,858 active private operators on its platform in the half year to March 2026. Online booking also grows fastest at 7.96% a year as AbhiBus added seven state transport partners to reach 17 in the quarter to September 2025, according to ixigo. Offline sales remain large, since a February 2024 IAMAI study found non-AC bus ticketing still mostly offline.
| Segment Group | Leading Sub-segment | Share, 2025 | Fastest-growing Sub-segment | CAGR, 2026–2035 |
|---|---|---|---|---|
| By Bus | AC Sleeper | 58.0% | AC Sleeper | 7.45% |
| By Route | Over 500 km | 57.0% | Under 500 km | 7.39% |
| By Booking | Online | 56.0% | Online | 7.96% |
Request a Free Sample
Fill in your details and we'll send you a free sample report.
- Sample data tables & charts
- Research methodology
Full berths, apps and new routes lift sleeper revenue
Long-distance travel demand keeps sleeper berths full
Long-distance travel demand gives sleeper operators high and steady occupancy, because overnight coaches serve trips that rail cannot always absorb. Intercity bus journeys rose 24% to 147.19 million between October 2025 and March 2026, and sleeper buses took 52% of them, according to redBus. Seat fill averaged 77% nationally in that period and reached 83% in Andhra Pradesh and Telangana. The Ministry of Statistics found that buses carried 48% of rural and 44% of urban visitor trips in the 30-day recall of its Domestic Tourism Expenditure Survey for July 2025 to June 2026. Pilgrimage was the purpose of 48% of overnight trips, which supports weekend and festival peaks. In the Credence Research model this adds about 2.94 percentage points to annual growth to 2035.
Digital ticketing and premium coaches widen appeal
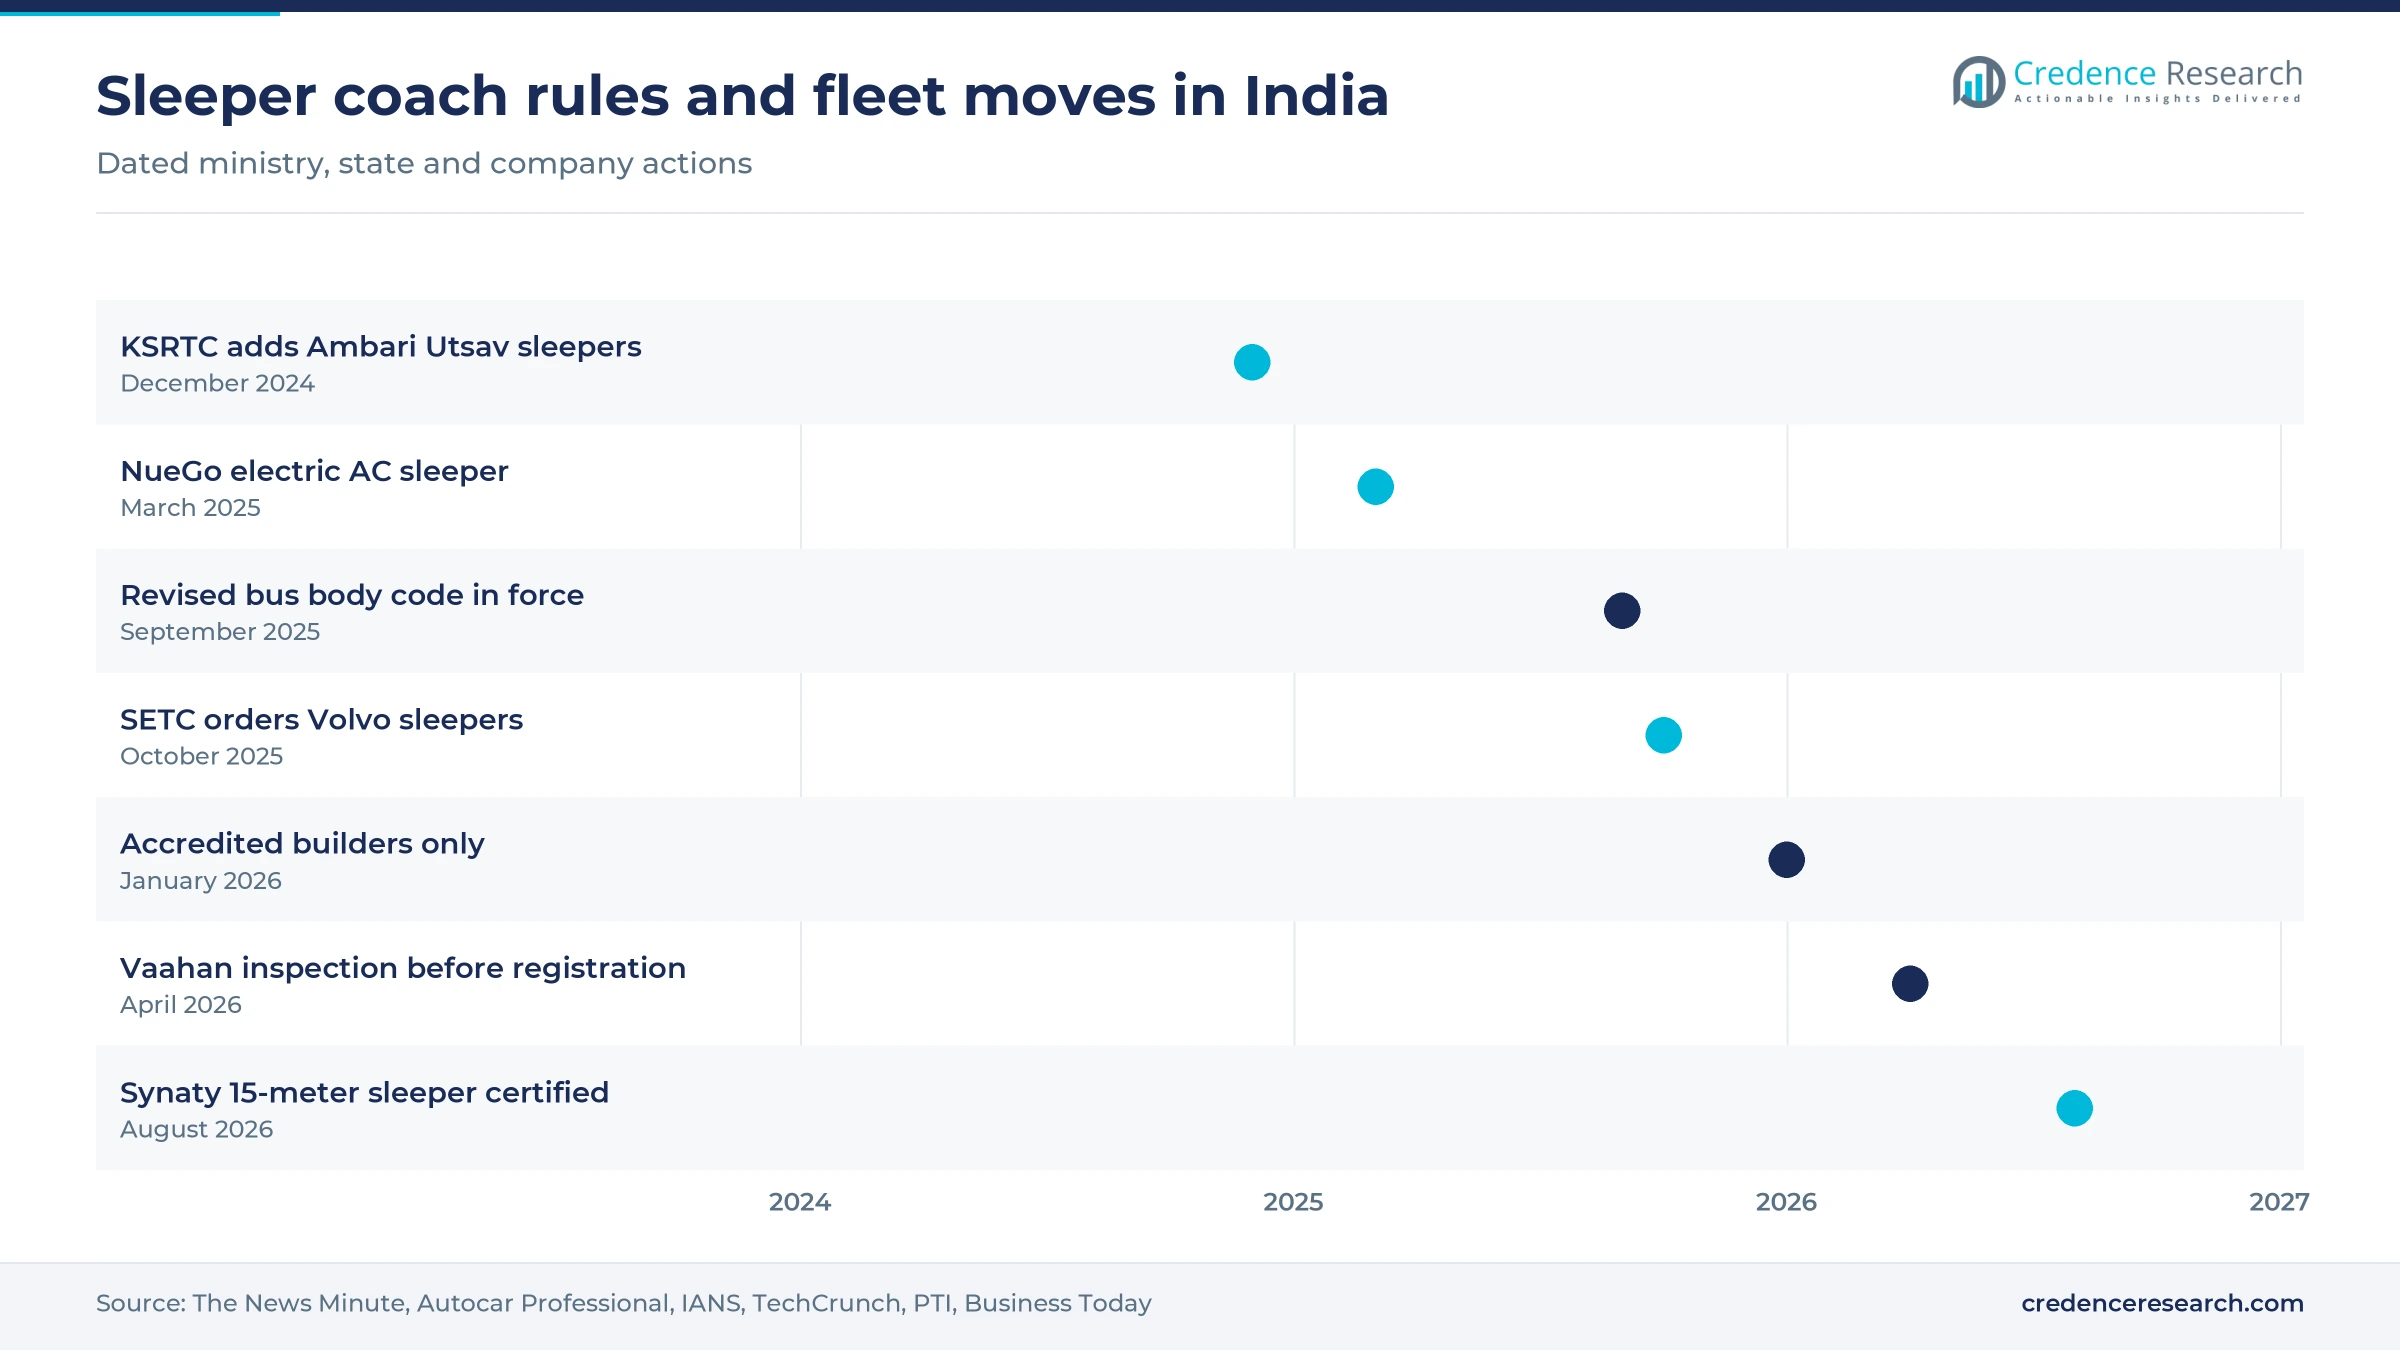
Digital ticketing and better coaches make overnight bus travel easier to choose, especially for travelers aged 18 to 36, who made 69% of redBus bookings in the half year to March 2026. Ixigo reported that bus gross transaction value on AbhiBus grew 51% in the quarter to September 2025, as seven more state transport corporations joined the platform. State fleets are trading up too, and SETC in Tamil Nadu ordered 20 Volvo multi-axle sleepers, some with lavatories and all with AIS 135 fire suppression in October 2025, according to IANS. KSRTC in Karnataka doubled its Ambari Utsav sleeper fleet to 40 coaches in December 2024. In the Credence Research model this adds about 1.89 percentage points to annual growth to 2035.
New routes and dynamic pricing raise revenue per trip
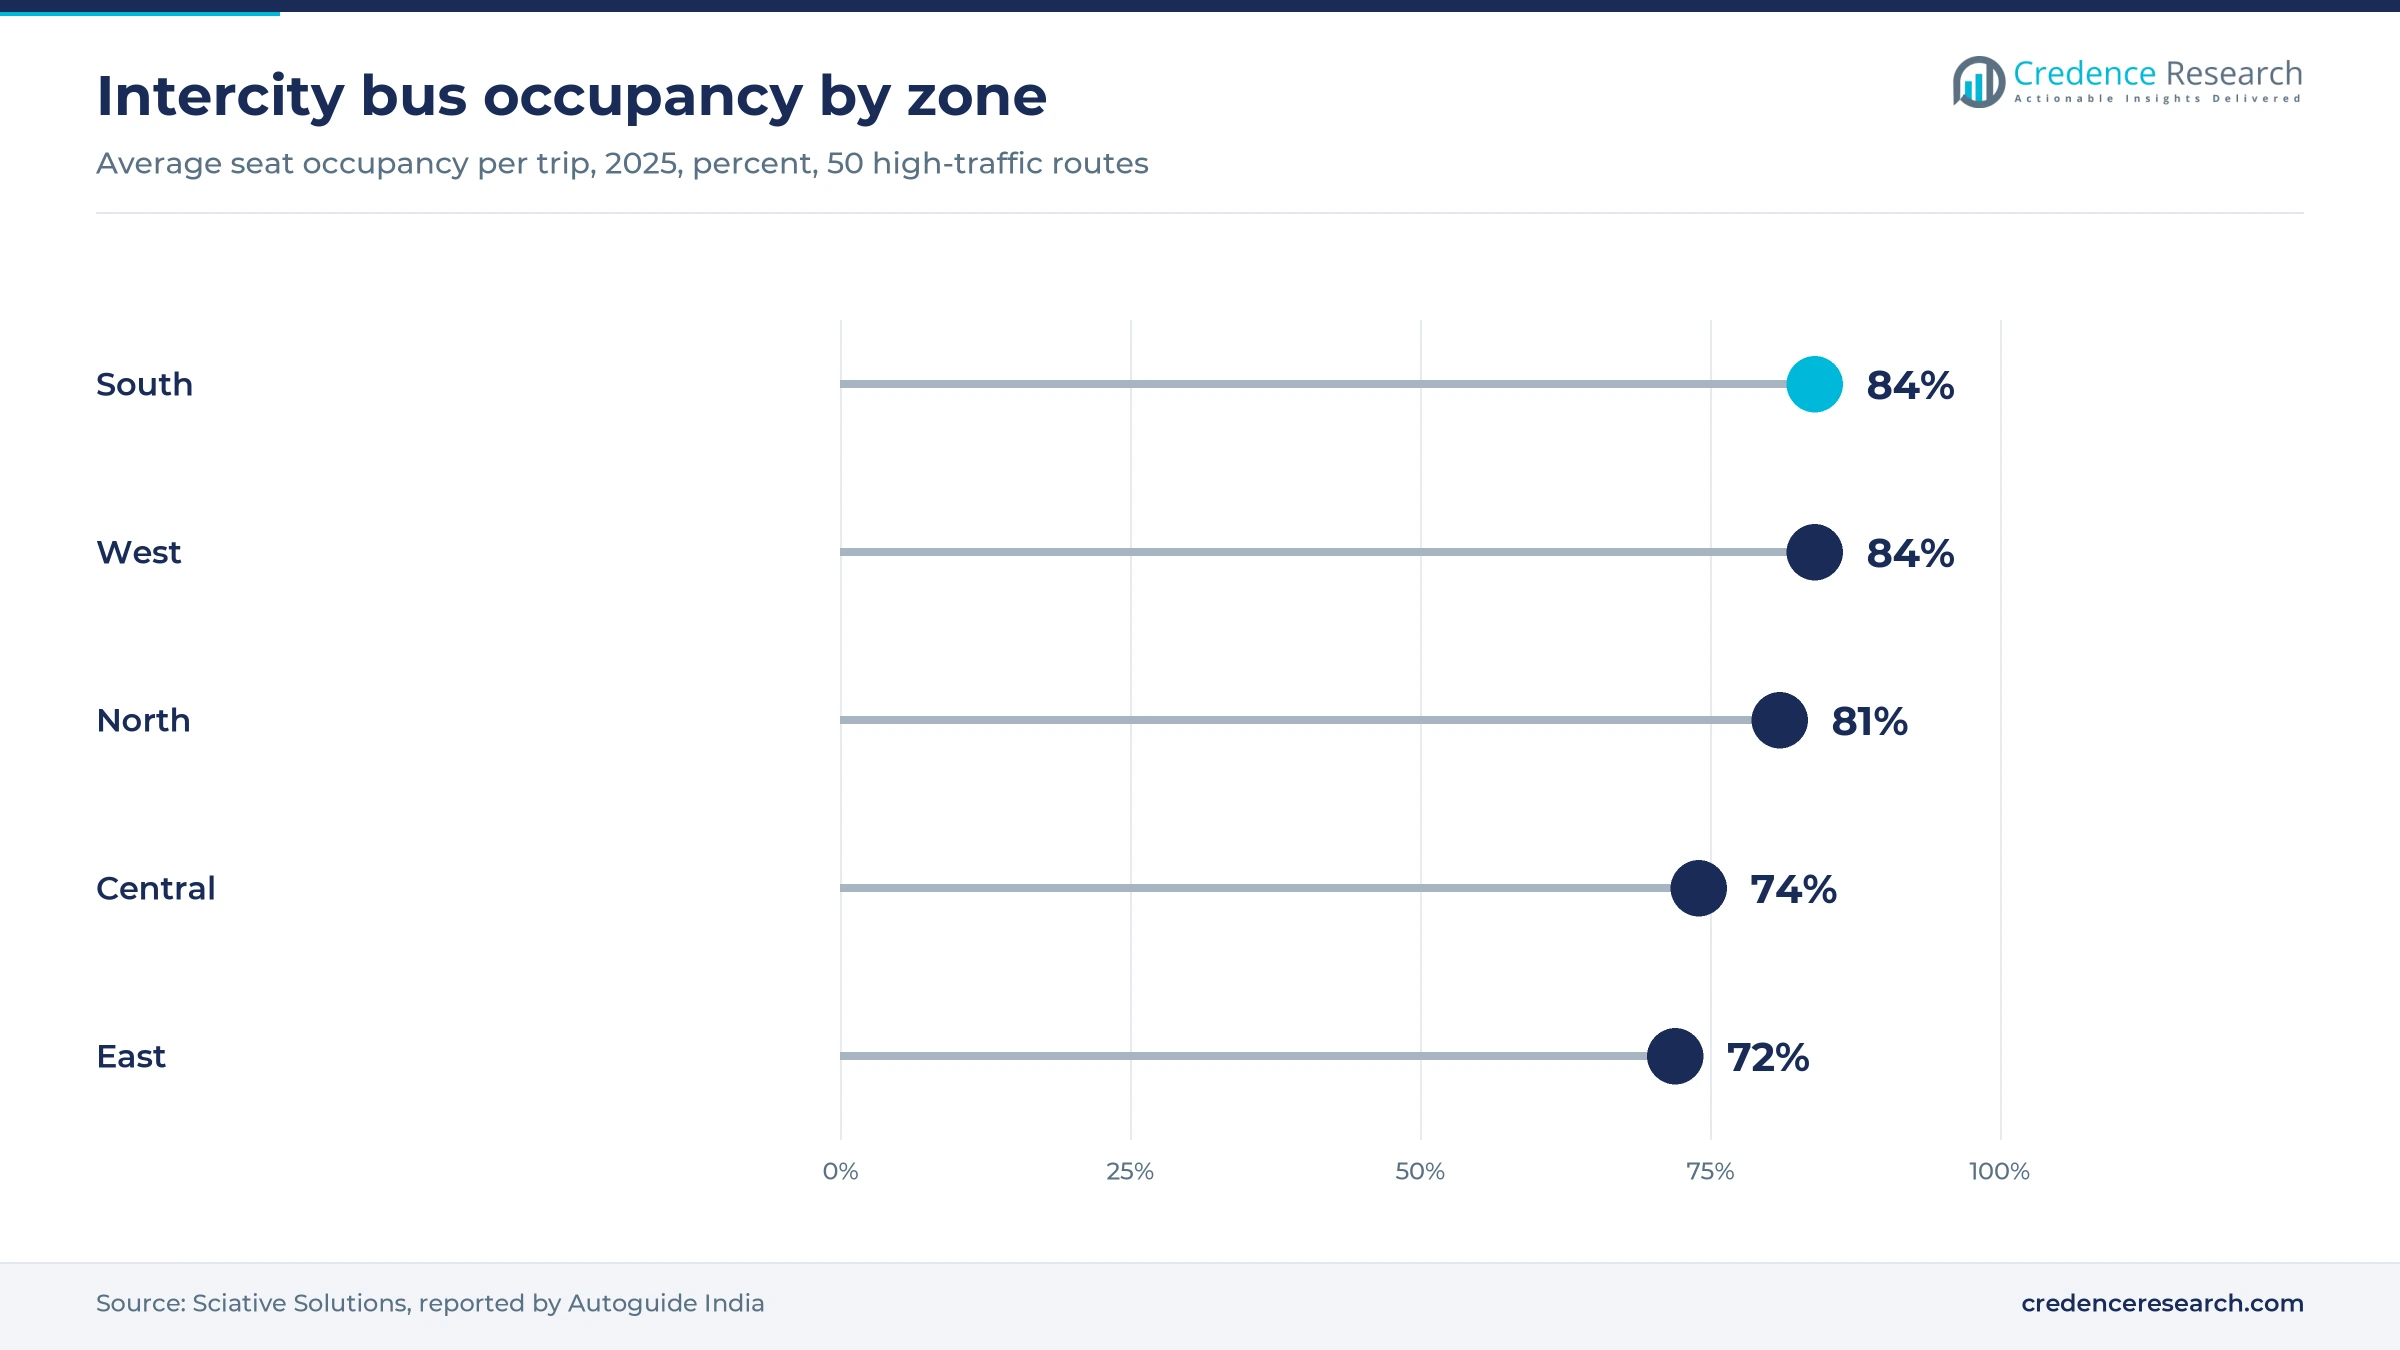
Route expansion and data-driven pricing raise the revenue that each coach earns per night. RedBus counted 878,394 unique intercity routes in the half year to March 2026, up from 670,346 six months earlier, and connected towns rose to 12,551. Sciative put average revenue per intercity trip at INR 40,892 in 2025, with average occupancy of 79% across 50 high-traffic routes and an average highest seat price of INR 4,692. Advance Diwali bookings in 2025 rose more than 45% from the year before, according to Sciative data reported by BW Retail World. Operators now buy revenue management software to price berths by demand. In the Credence Research model this adds about 1.19 percentage points to annual growth to 2035.
Lower tax and fresh capital fund fleet additions
Lower tax on new coaches and fresh equity are funding the fleets that sleeper growth requires. The GST Council cut the rate on buses from 28% to 18% at its 56th meeting on Sept. 3, 2025, according to Autocar Professional, which lowers the cost of commercial vehicles for private fleets. IntrCity SmartBus raised a USD 30 million Series D led by A91 Partners in October 2025, according to TechCrunch, and said it aims to double its fleet across more than 630 routes in 15 states. VRL Travels, operating as Vijayanand Travels, ordered 100 Volvo 9600 luxury sleepers in 2024, according to Coach Builders India. As a result, AC Sleeper coaches keep 58.0% of value as fleets renew.
Safety rules and premium formats reshape the fleet
Shift toward certified coaches after fatal fires
Fatal fires are moving sleeper coach construction from local workshops toward certified builders. A private sleeper bus from Hyderabad to Bengaluru caught fire near Kurnool on Oct. 24, 2025, killing 20 people, according to All India Radio. Union Minister Nitin Gadkari announced in January 2026 that only accredited manufacturers may build sleeper coaches, citing six fires and 145 deaths in six months, according to Autocar Professional. In April 2026 he said new sleeper coaches would not be registered without physical and video inspection of fire detection systems and emergency exits, with each record uploaded to the Vaahan portal, according to PTI. Synaty Automotive then received ICAT certification under AIS-119 and AIS-153 for a 15-meter sleeper in August 2026.
Rise of 15-meter multi-axle and luxury formats
Longer multi-axle coaches are becoming the premium format for overnight routes, because they fit more berths and onboard facilities. Synaty Automotive's 15-meter coach offers 42 berths or a hybrid layout of 21 berths and 42 seats, according to Business Today in August 2026. SETC's 20 Volvo sleepers are also 15-meter multi-axle coaches with air suspension, electronic stability control and lavatories on some units, according to IANS. VRL Travels described its 100 Volvo 9600 sleepers as the gold class of luxury travel in its 2024 order. IntrCity SmartBus adds washrooms on most coaches and runs air-conditioned boarding lounges, according to TechCrunch. These moves widen the gap between luxury coaches and older non-AC sleepers, which grow slowest.
Opening for electric sleepers on shorter corridors
Electric sleepers open a new product for corridors that fit within one battery charge. NueGo introduced what it called India's first electric AC sleeper in March 2025, according to Autocar Professional, on routes including Delhi to Amritsar, Bangalore to Chennai and Vijayawada to Visakhapatnam. The coach offers a range of 350 kilometers per charge, which fast charging can extend to 600 kilometers a day. Operator IntrCity also equips each coach with real-time tracking hardware and an in-house operating system that monitors cabin conditions, which eases the move to battery-electric coaches with tighter energy planning. Routes under 500 kilometers are the faster-growing route segment, so operators that match electric range to these corridors can win early contracts.
Opening for Tier 2 and Tier 3 networks
Smaller cities offer the largest untapped base for sleeper operators that build hub-and-spoke networks. Smaller cities and towns produced 62% of journeys booked on redBus in the half year to March 2026, against 31% from metro cities. IntrCity SmartBus said its October 2025 funding would expand services in Tier 2 and Tier 3 cities, according to Acko Drive. FlixBus India announced in September 2026 that it would add 120 buses across its southern network, with new links to Guntur, Coonoor and Ooty, according to Autocar Professional. AbhiBus now sells tickets for 17 state transport corporations, which widens the reach of depot routes. Operators that pair these feeder routes with Online sales can capture demand that previously relied on agents.
Retrofits, fare caps and court scrutiny weigh on operators
Safety retrofits raise costs for older fleets
Safety retrofits raise costs for operators of older coaches, because new rules require upgrades within a short window. Directions issued after NHRC action give existing sleeper buses 30 days to fit fire detection and suppression systems and require operators to remove driver cabin partitions and sliding berth doors immediately and carry extinguishers of at least 10 kilograms, according to Coach Builders India. Chassis-extended sleeper coaches are now banned outright from commercial service. Small owners with locally built coaches feel this most, so phased financing and accredited retrofit shops are the practical remedies.
Fare caps limit festival pricing
Fare caps limit how far operators can lift prices in peak weeks, when much of the annual margin is earned. Pune's regional transport office warned operators on Oct. 10, 2025, that private buses may charge at most 1.5 times the MSRTC fare under 2018 rules, according to the Free Press Journal. One traveler to Nagpur reported paying INR 1,200 to INR 1,500 for a usual INR 600 ticket. Operators therefore face penalties if dynamic pricing breaches the cap, so transparent fare bands are the safer path.
Court scrutiny adds compliance uncertainty
Court scrutiny is adding uncertainty over how sleeper standards will be enforced. A sleeper bus fire near Jewar on the Yamuna Expressway killed nine passengers on the night of Sept. 23 to 24, 2026, according to LiveLaw. The Allahabad High Court then issued notice to the transport ministry in October 2026, after Uttar Pradesh argued that testing stations must check compliance with AIS-119 and AIS-135. Operators may face fresh inspection drives as a result, so complete certification records are the best protection.
Added capacity pulls average fares down
Added capacity is pulling average fares down even as journeys grow. The average seat price on redBus fell 3% to INR 966 in the half year to March 2026, while active private operators rose to 6,858 from 5,850 a year earlier. FlixBus India also plans 120 more southern buses in late 2026. Operators on crowded corridors therefore face thinner yields, so differentiated berths, onboard services and pricing discipline remain the main remedies.
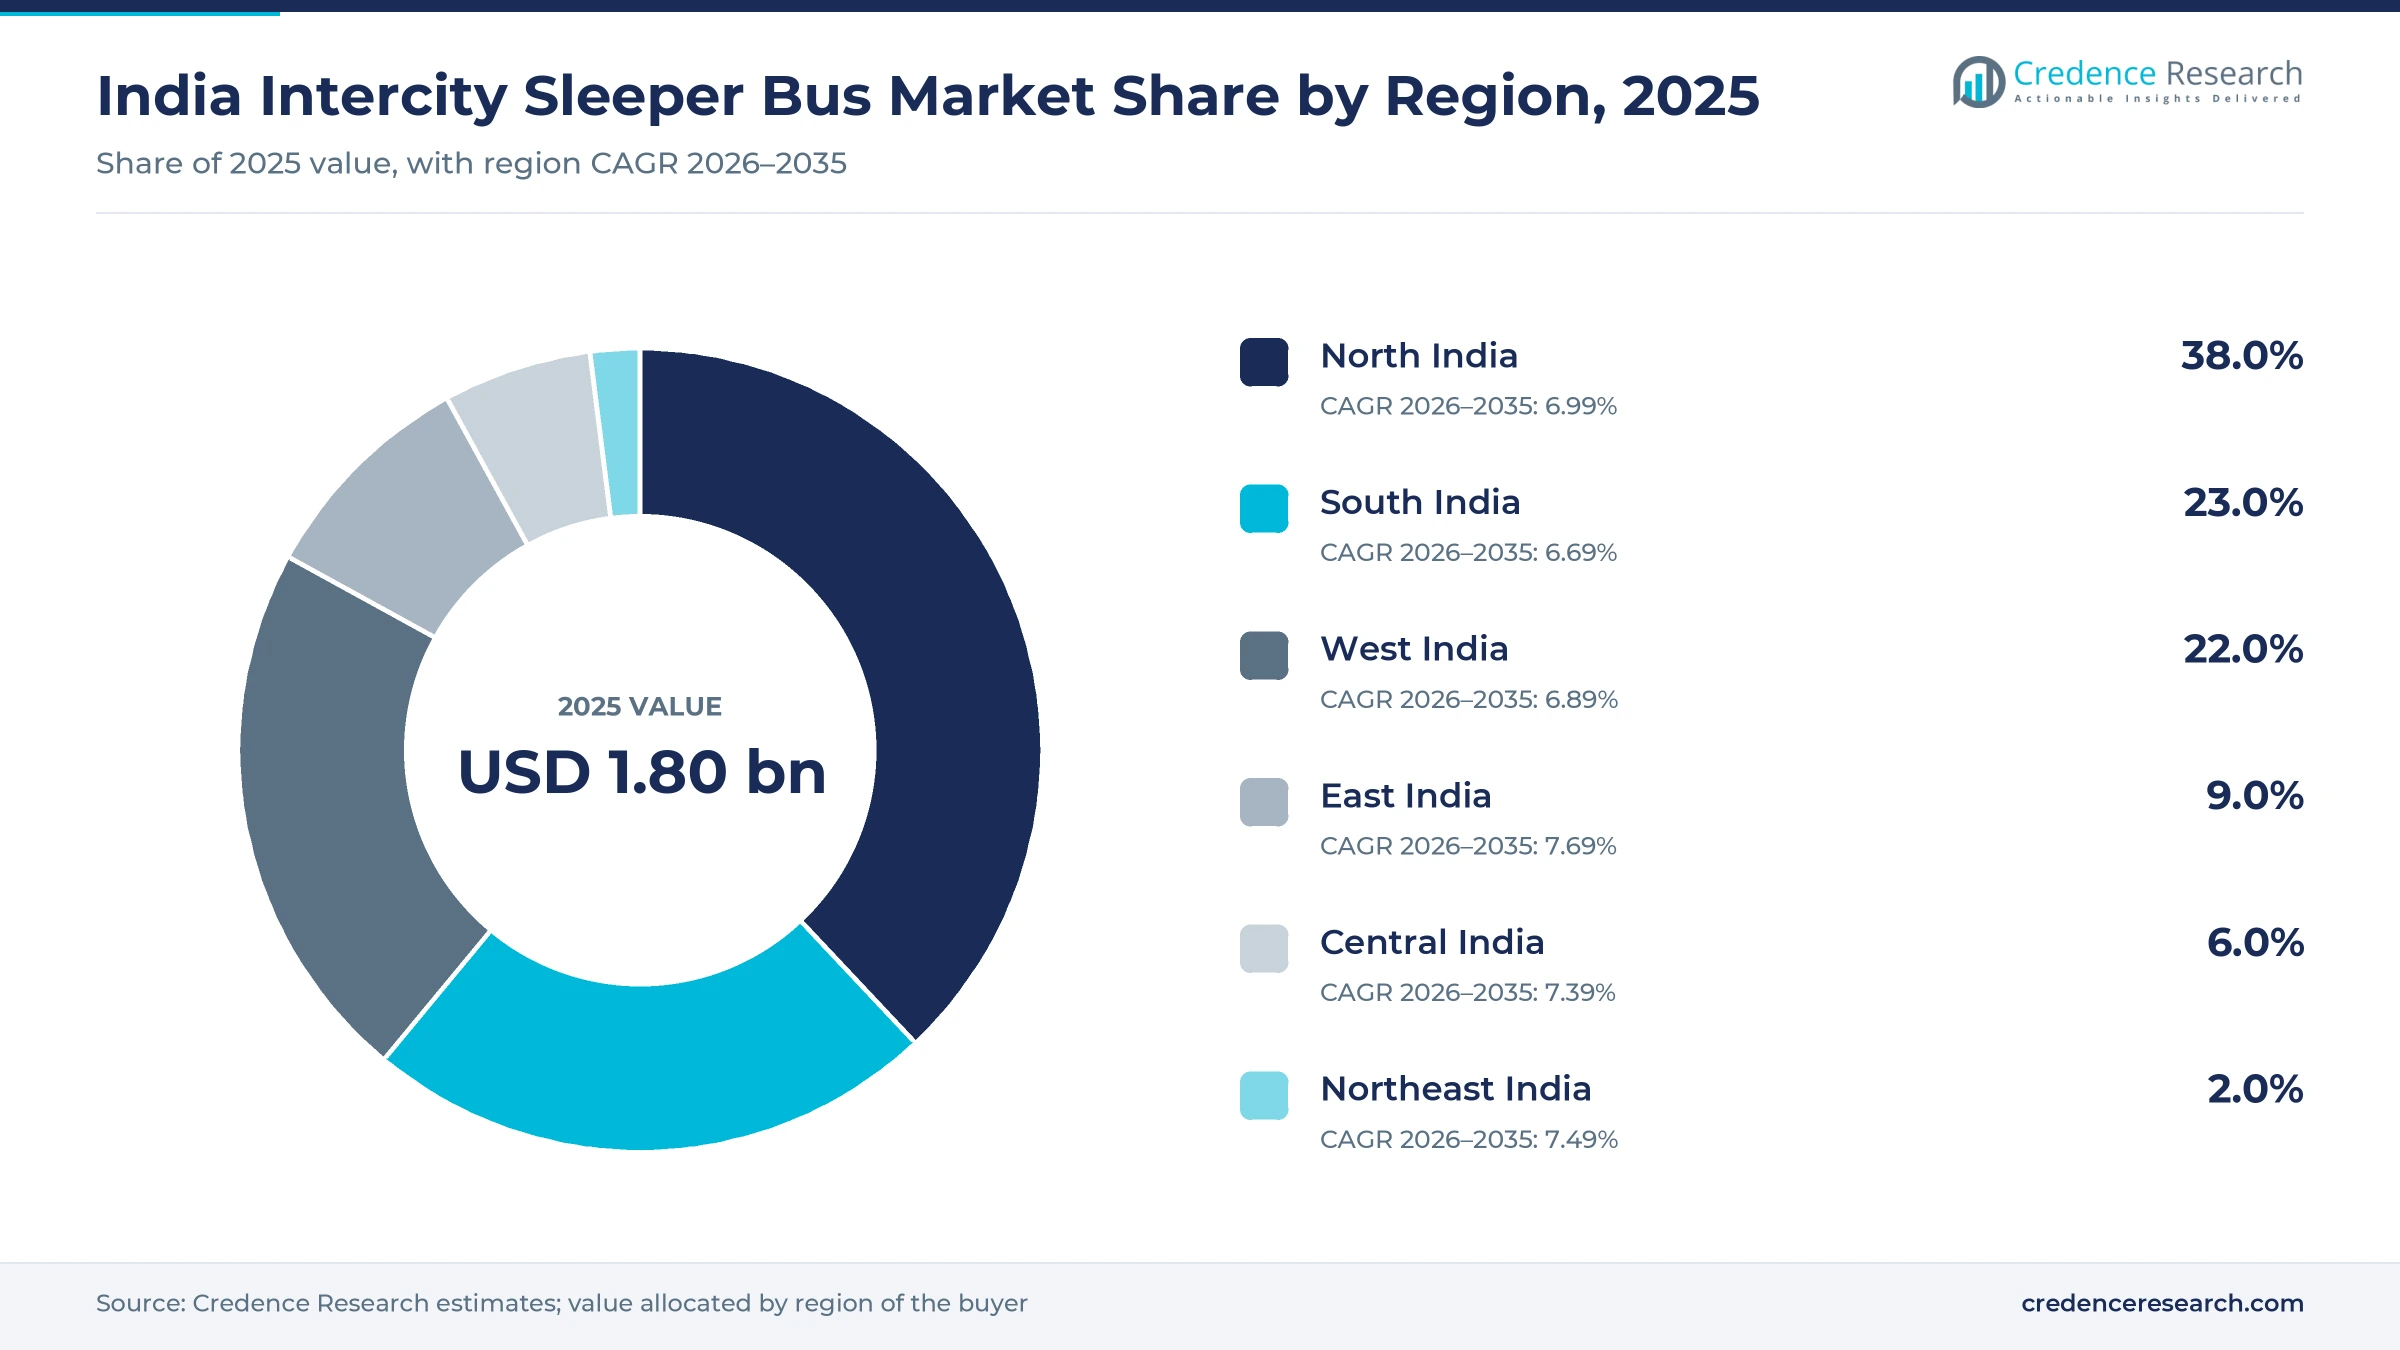
Pilgrim corridors put the north ahead as the east fills up
| Region | Value, 2025 (USD billion) | Share, 2025 | CAGR, 2026–2035 |
|---|---|---|---|
| North India | 0.68 | 38.0% | 6.99% |
| South India | 0.41 | 23.0% | 6.69% |
| West India | 0.40 | 22.0% | 6.89% |
| East India | 0.16 | 9.0% | 7.69% |
| Central India | 0.11 | 6.0% | 7.39% |
| Northeast India | 0.04 | 2.0% | 7.49% |
North India leads on pilgrimage and migrant traffic
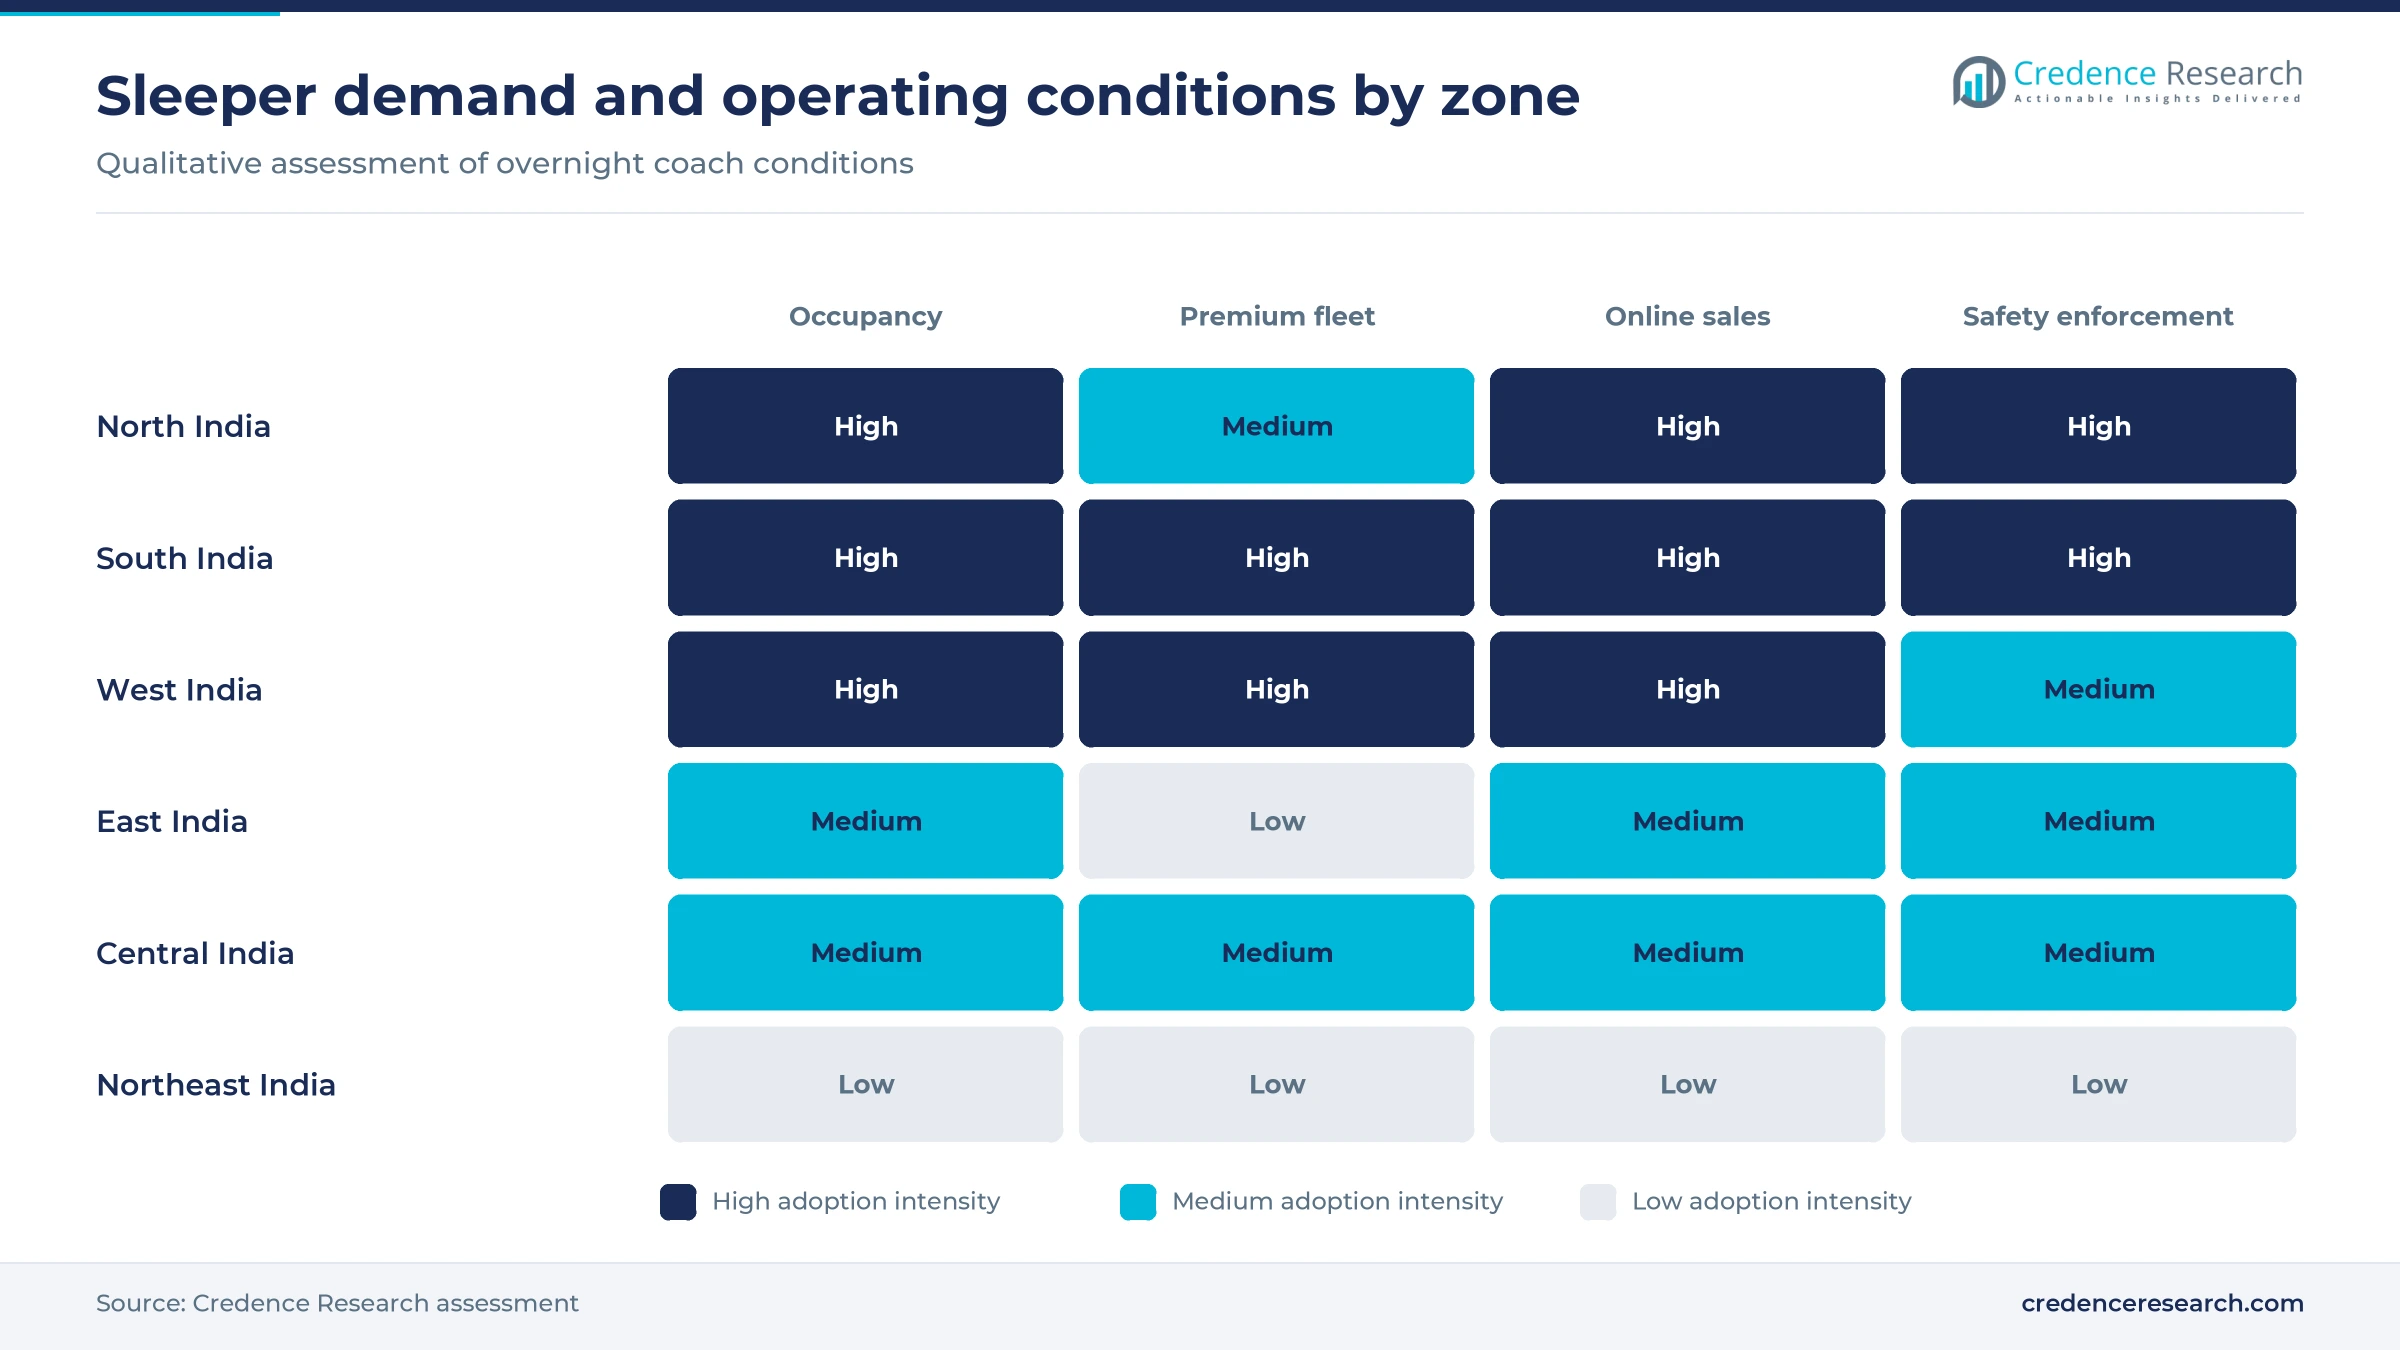
North India held 38.0% of 2025 value and grows at 6.99% a year, supported by long migrant and pilgrimage corridors. Uttar Pradesh was the main destination for 15.7% of overnight visitor trips in the 365-day recall of the national tourism survey for 2025-26. Advance Diwali bookings on Delhi to Varanasi rose 51% in 2025, according to BW Retail World. Northern routes averaged 81% occupancy in 2025, according to Sciative, and IntrCity SmartBus covers the zone from Jammu to Uttarakhand.
South India runs the most efficient sleeper routes
South India held 23.0% of 2025 value and grows at 6.69% a year, the slowest pace because its network is mature. Southern routes reached 84% occupancy and INR 50,278 in revenue per trip in 2025, according to Sciative. State fleets compete directly here, with KSRTC running 40 Ambari Utsav sleepers from Bengaluru and SETC adding 20 Volvo sleepers in Tamil Nadu. Private operators such as SRS Travels and Orange Travels run dense Bengaluru and Hyderabad schedules.
West India pairs Maharashtra volume with Gujarat links
West India held 22.0% of 2025 value and grows at 6.89% a year. Maharashtra and Goa took 16% of intercity seat bookings on redBus in the half year to March 2026, the largest share of any state group. Western routes also reached 84% occupancy in 2025 with balanced weekday and weekend demand, according to Sciative. Fare caps tied to MSRTC rates, however, limit festival pricing across Maharashtra, while VRL Travels runs long services into Gujarat and Goa.
East India fills faster in festival seasons
East India held 9.0% of 2025 value and is the fastest zone at 7.69% a year, because occupancy is rising from a lower base. Advance occupancy on Puri to Kolkata reached 31% before Diwali 2025, up from 22% a year earlier, according to BW Retail World. Eastern routes posted the highest seat price sold nationally in 2025, INR 14,800, according to Sciative. Bihar also took 10.5% of overnight trips in the 30-day recall of the national tourism survey.
Central India grows on Indore and Mumbai corridors
Central India held 6.0% of 2025 value and grows at 7.39% a year. Advance Diwali bookings on Mumbai to Indore rose 46% in 2025, according to BW Retail World, which shows strong pull from western metros. Occupancy is lower here, however, at 74% in 2025, according to Sciative, and Madhya Pradesh and Chhattisgarh had the lowest seat fill of any state group at 63% in the half year to September 2025, according to redBus.
Northeast India grows from a small base
Northeast India held 2.0% of 2025 value and grows at 7.49% a year from a small base. Guwahati opened a new interstate bus terminal on Jan. 1, 2025, designed to handle night bus services as well, according to The Sentinel. Even so, connected towns on redBus rose to 12,551 by March 2026 from 11,177 six months earlier, which brings more small towns online. AbhiBus also sells tickets for 17 state transport corporations, which widens access to depot routes.
Fires and fleet orders set the agenda from 2024
| Development | Status and market relevance |
|---|---|
| In December 2024, KSRTC added 20 Ambari Utsav sleepers in Karnataka, bringing that fleet to 40 coaches. | In service on Bengaluru routes to Mangaluru, Hyderabad, Vijayawada and Kerala |
| In March 2025, NueGo introduced electric AC sleepers on routes such as Delhi to Amritsar and Bangalore to Chennai. | Operating, with 350 kilometers of range per charge |
| In October 2025, SETC in Tamil Nadu ordered 20 Volvo multi-axle sleepers, its first premium sleeper coaches. | Being inducted on long-distance state and interstate routes |
| In October 2025, IntrCity SmartBus raised a USD 30 million Series D led by A91 Partners to expand its network. | Funds directed to safety, fleet technology and Tier 2 and Tier 3 cities |
| In January 2026, the transport ministry restricted sleeper coach building to accredited manufacturers and ordered retrofits. | In force, with Vaahan inspections for new registrations from April 2026 |
Fire suppression and pricing tools change operations
- Fire detection and suppression systems detect and fight engine and cabin fires, and SETC's new Volvo sleepers carry systems that meet AIS 135.
- Emergency exits with hammers and lighting must be inspected on video before a new sleeper coach is registered on the Vaahan portal.
- Dynamic pricing engines set berth fares by demand, and Sciative tracked an average highest seat price of INR 4,692 across 50 routes in 2025.
- Real-time tracking hardware lets IntrCity SmartBus monitor CCTV, sound and temperature inside each coach through its own fleet management platform.
- Electric drivetrains give NueGo sleepers a range of 350 kilometers per charge, which suits overnight pairs under 500 kilometers.
Need a Custom Version of This Report?
Tailor the scope, geography, or segments to your exact requirements.
- Custom geography or segment scope
- Direct access to our analyst team
Regional fleets compete with branded networks
Competition is regional, because most berths are sold by family-owned fleets that dominate particular corridors. VRL Travels runs Volvo 9600 sleepers across Karnataka, Maharashtra, Andhra Pradesh, Telangana, Gujarat and Goa, while SRS Travels sells sleeper and semi-sleeper services from its Karnataka base and lists about 533 routes from Hyderabad on MakeMyTrip. Orange Travels runs AC sleeper and Volvo services on Bengaluru, Hyderabad, Vijayawada and Tirupati routes, according to its AbhiBus listing. IntrCity SmartBus follows an asset-light model with more than 50 partner operators and about 600 daily trips. State transport undertakings such as KSRTC and SETC compete on price and trust with their own sleepers. FlixBus India and NueGo add branded networks, and redBus and AbhiBus sell tickets for most of these fleets. Certified coaches and on-time records will decide share as safety rules tighten.
Companies profiled and their roles in this market
| Company | Type | Role in the market |
|---|---|---|
| VRL Travels | Private operator | Runs Volvo 9600 luxury sleepers under the Vijayanand Travels name across six western and southern states |
| SRS Travels | Private operator | Karnataka-based fleet with sleeper and semi-sleeper services and about 533 routes listed from Hyderabad |
| Orange Travels | Private operator | Runs AC sleeper and Volvo coaches between Bengaluru, Hyderabad, Vijayawada and Tirupati |
| IntrCity SmartBus | Branded network | Asset-light overnight network with 50+ partner operators, about 600 daily trips and boarding lounges |
| State transport undertakings | Public operators | KSRTC runs 40 Ambari Utsav sleepers and SETC ordered 20 Volvo sleepers in October 2025 |
| redBus | Ticketing platform | Sells tickets for 6,858 active private operators and publishes the BusTrack industry report |
| AbhiBus | Ticketing platform | Ixigo unit selling tickets for 17 state transport corporations as of September 2025 |
| FlixBus India | Branded network | Adding 120 southern buses in 2026, including a Volvo sleeper on Hyderabad to Puducherry |
| NueGo | Electric operator | Launched electric AC sleepers on intercity routes in March 2025 |
Certified fleets will win the overnight traveler
Credence Research's view is that certification, not fleet size alone, will decide who holds the overnight traveler by 2035. The fires at Kurnool and on the Yamuna Expressway have turned safety into a buying criterion, and the ministry's accreditation and Vaahan inspection rules make that visible to regulators and travelers alike. As a result, operators with factory-built AC sleepers and clean records should gain share from older local builds. Fare caps and falling average seat prices limit pricing power, so occupancy and route density will matter more than fare increases. Electric sleepers will likely start on corridors under 500 kilometers.
How Credence Research sized sleeper travel in India
The report uses 2025 as the base year and 2026 to 2035 as the forecast period. Market values come from the Credence Research model, and bus, route, booking and regional splits are Credence Research estimates. The inputs are government statistics such as the Domestic Tourism Expenditure Survey, ministry announcements, court records, operator and platform disclosures, booking analytics published by ticketing and pricing firms, and press reports of fleet orders. No interviews or surveys were conducted for this edition, and festival pricing varies widely by corridor, so regional values carry more uncertainty than the national total.
Safer, larger and partly electric fleets by 2035
The market is forecast to reach USD 3.53 billion by 2035, growing at a 7.00% CAGR from USD 1.92 billion in 2026. Full overnight berths, new Tier 2 and Tier 3 routes and steady fleet renewal should carry most of that growth through 2030. Safety certification will then separate operators, because coaches built by accredited manufacturers and inspected on the Vaahan portal will win platform placement and traveler trust. Electric sleepers should spread on corridors under 500 kilometers as charging improves. North India stays the largest zone to 2035, while East India keeps the fastest pace.
Frequently Asked Questions
How big is the India intercity sleeper bus market?
Which bus type leads the market?
Which region is largest?
Which region grows fastest?
What safety rules now apply to sleeper buses?
How are sleeper berths booked?
Are electric sleeper buses available in India?
Who are the main companies in this market?
Table of Content
Chapter 1 Market Segmentation
- 1.1 Segmentation Framework
- 1.1.1 Product and Service Classification
- 1.1.2 Application and End-Use Classification
- 1.1.3 Technology and Solution Classification
- 1.1.4 Customer and Distribution Channel Classification
- 1.1.5 Geographic Segmentation
- 1.1.6 Market Segment Definitions and Boundaries
- 1.2 By Bus
- 1.2.1 AC Sleeper
- 1.2.2 Seater-Sleeper
- 1.2.3 Non-AC Sleeper
- 1.3 By Route
- 1.3.1 Over 500 km
- 1.3.2 Under 500 km
- 1.4 By Booking
- 1.4.1 Online
- 1.4.2 Offline
Chapter 2 Introduction
- 2.1 Report Objectives and Scope
- 2.2 Product Definition and Industry Terminology
- 2.3 Market Inclusions and Exclusions
- 2.4 Research Process
- 2.4.1 Primary Research and Expert Interviews
- 2.4.2 Secondary Research and Source Review
- 2.4.3 Top-Down and Bottom-Up Estimation
- 2.4.4 Data Triangulation and Verification
- 2.5 Market Size Measurement Basis
- 2.5.1 2025: USD 1.80 billion → 2035: USD 3.53 billion
- 2.6 Historical and Forecast Reference Periods
- 2.6.1 Historical Period: 2018-2025
- 2.6.2 Base Year: 2025
- 2.6.3 Forecast Period: 2025-2035
- 2.7 Research Assumptions and Limitations
Chapter 3 Executive Summary
- 3.1 Market Snapshot and Key Findings
- 3.2 Base-Year Market Size, 2025
- 3.3 Forecast Market Size, 2035
- 3.4 Revenue and Volume Growth Outlook
- 3.5 Key Demand and Supply Indicators
- 3.6 Leading Market Segments
- 3.7 Fastest-Growing Market Opportunities
- 3.8 Regional Performance Highlights
- 3.9 Technology and Industry Transformation
- 3.10 Competitive Landscape Summary
- 3.11 Analyst View and Strategic Implications
Chapter 4 India Intercity Sleeper Bus Market Trends and Developments
- 4.1 Historical Industry Development, 2018-2025
- 4.2 Recent Market Trends and Developments
- 4.3 Demand and Customer Behavior Trends
- 4.4 Technology and Product Innovation
- 4.5 Artificial Intelligence, Automation and Digitalization
- 4.6 Local Manufacturing and Supply Chain Realignment
- 4.7 Industry Partnerships, Mergers and Acquisitions
- 4.8 Sustainability and Circular Economy Developments
- 4.9 Government and Private Sector Investment Trends
- 4.10 Emerging Business Models and Commercialization
- 4.11 Industry Developments and Announcements
Chapter 5 India Intercity Sleeper Bus Market Supply and Demand Analysis
- 5.1 Demand Trend and Consumption Analysis, 2018-2025
- 5.2 Demand Forecast, 2025-2035
- 5.3 Supply Chain Structure and Procurement Trends
- 5.4 Supply-Demand Gap and Bottlenecks
- 5.5 Import Dependence and Sourcing Structure
- 5.6 Regional Supply and Demand Concentration
Chapter 6 India Intercity Sleeper Bus Market Pricing Analysis
- 6.1 Pricing Structure and Measurement
- 6.2 Historical Pricing Trends, 2018-2025
- 6.3 Pricing Outlook, 2025-2035
- 6.4 Pricing by Product and Market Segment
- 6.5 Geographic Pricing Differences
- 6.6 Key Input, Energy, Labor and Logistics Costs
- 6.7 Contract Pricing and Purchasing Models
- 6.8 Pricing Sensitivity and Competitive Positioning
- 6.9 Price, Margin and Profitability Implications
Chapter 7 India Intercity Sleeper Bus Market Dynamics
- 7.1 Market Growth Drivers
- 7.1.1 Demand-Side Drivers
- 7.1.2 Technology and Innovation Drivers
- 7.1.3 Infrastructure and Investment Drivers
- 7.1.4 Regulatory and Policy Drivers
- 7.2 Market Restraints
- 7.2.1 Cost and Affordability Constraints
- 7.2.2 Technology and Adoption Barriers
- 7.2.3 Supply Chain and Operational Constraints
- 7.3 Market Challenges
- 7.3.1 Competitive Pressure and Margin Erosion
- 7.3.2 Skills, Infrastructure and Implementation Gaps
- 7.4 Emerging Market Opportunities
- 7.5 Market Dynamics Impact and Time-Horizon Assessment
Chapter 8 India Intercity Sleeper Bus Value Chain Analysis
- 8.1 Industry Value Chain Overview
- 8.2 Upstream Suppliers and Critical Inputs
- 8.3 Technology and Component Providers
- 8.4 Manufacturing or Service Delivery
- 8.5 Distribution, Channel Partners and Integrators
- 8.6 Downstream Applications and End Users
- 8.7 Value Addition and Profit Pools
- 8.8 Vertical Integration and Outsourcing
- 8.9 Supplier Concentration and Risk
- 8.10 Supply Chain Localization and Resilience
Chapter 9 India Intercity Sleeper Bus Market Regulations and Policies
- 9.1 Relevant Laws, Standards and Compliance Frameworks
- 9.2 Product, Service, Safety and Quality Requirements
- 9.3 Government Policies, Incentives and Subsidies
- 9.4 Imports, Exports and Trade Barriers
- 9.5 Public Procurement and Local Content Requirements
- 9.6 Data Protection, AI and Cybersecurity Compliance
- 9.7 Upcoming Policy Changes and Market Implications
Chapter 10 India Intercity Sleeper Bus Market Hotspots and Opportunities
- 10.1 Market Opportunity Mapping and Growth Hotspots
- 10.2 High-Growth Applications and Customer Groups
- 10.3 Underserved Markets and White-Space Opportunities
- 10.4 Emerging Technology and Product Opportunities
- 10.5 New Capacity and Investment Hotspots
- 10.6 Market Entry and Expansion Opportunities
- 10.7 Distribution and Partnership Opportunities
- 10.8 Near-Term and Long-Term Commercial Potential
- 10.9 Opportunity Attractiveness and Execution Risks
Chapter 11 India Intercity Sleeper Bus Market Outlook, 2025-2035
- 11.1 Market Size and Analysis
- 11.1.1 Revenue (Market Measurement: 2025: USD 1.80 billion → 2035: USD 3.53 billion)
- 11.1.2 Historical Market Size, 2018-2025
- 11.1.3 Base-Year Market Size, 2025
- 11.2 Market Forecast, 2025-2035
- 11.2.1 Revenue Forecast to 2035
- 11.2.2 CAGR and Year-on-Year Growth
- 11.2.3 Incremental Revenue Opportunity
- 11.3 Forecast Assumptions and Scenario Analysis
- 11.3.1 Base-Case Forecast
- 11.3.2 Optimistic and Conservative Scenarios
- 11.3.3 Technology, Pricing and Policy Sensitivities
- 11.4 Market Attractiveness and Growth Outlook
Chapter 12 India Intercity Sleeper Bus Market Segmentation and Outlook
- 12.1 Segmentation Summary and Market Shares, 2025
- 12.2 Largest and Fastest-Growing Segments
- 12.3 By Bus - Market Size and Forecast, 2025-2035
- 12.3.1 Segment Definition and Scope
- 12.3.2 Historical Market Size, 2018-2025
- 12.3.3 Revenue Forecast, 2025-2035
- 12.3.4 Base-Year Market Share, 2025
- 12.3.5 Segment CAGR and Growth Drivers
- 12.3.6 Subsegment Market Size and Forecast
- 12.3.6.1 AC Sleeper
- 12.3.6.2 Seater-Sleeper
- 12.3.6.3 Non-AC Sleeper
- 12.3.7 Subsegment Pricing and Adoption Trends
- 12.3.8 Leading Suppliers and Competition
- 12.3.9 Regional Demand and Opportunities
- 12.4 By Route - Market Size and Forecast, 2025-2035
- 12.4.1 Segment Definition and Scope
- 12.4.2 Historical Market Size, 2018-2025
- 12.4.3 Revenue Forecast, 2025-2035
- 12.4.4 Base-Year Market Share, 2025
- 12.4.5 Segment CAGR and Growth Drivers
- 12.4.6 Subsegment Market Size and Forecast
- 12.4.6.1 Over 500 km
- 12.4.6.2 Under 500 km
- 12.4.7 Subsegment Pricing and Adoption Trends
- 12.4.8 Leading Suppliers and Competition
- 12.4.9 Regional Demand and Opportunities
- 12.5 By Booking - Market Size and Forecast, 2025-2035
- 12.5.1 Segment Definition and Scope
- 12.5.2 Historical Market Size, 2018-2025
- 12.5.3 Revenue Forecast, 2025-2035
- 12.5.4 Base-Year Market Share, 2025
- 12.5.5 Segment CAGR and Growth Drivers
- 12.5.6 Subsegment Market Size and Forecast
- 12.5.6.1 Online
- 12.5.6.2 Offline
- 12.5.7 Subsegment Pricing and Adoption Trends
- 12.5.8 Leading Suppliers and Competition
- 12.5.9 Regional Demand and Opportunities
- 12.6 Segment Growth Comparison
- 12.7 Segment Attractiveness and Priority Matrix
Chapter 13 India Intercity Sleeper Bus Geographic Market Outlook, 2025-2035
- 13.1 Domestic Market Distribution and Demand Clusters
- 13.2 State- or Province-Wise Market Size and Forecast, 2025-2035
- 13.3 City and Metropolitan Market Outlook
- 13.4 Industrial, Manufacturing and Commercial Clusters
- 13.5 Geographic Concentration of Key End Users
- 13.6 Local Pricing and Purchasing Differences
- 13.7 Domestic Production Facilities and Capacity Map
- 13.8 Local Infrastructure and Project Pipeline
- 13.9 State-Level Policy and Incentive Differences
- 13.10 Subnational Investment Hotspots and Opportunities
- 13.11 Distribution and Logistics Networks
- 13.12 Domestic Competitive Footprint
Chapter 14 India Intercity Sleeper Bus Technology, Innovation and Sustainability Outlook
- 14.1 Technology Landscape and Maturity
- 14.2 Product, Process and Service Innovation
- 14.3 AI, Automation and Digital Tools in the Industry
- 14.4 Technology Adoption and Performance Benchmarking
- 14.5 Innovation Pipeline and R&D Investment
- 14.6 Energy Efficiency and Resource Management
- 14.7 Sustainability, Recycling and Circularity
- 14.8 Technology Roadmap, 2025-2035
- 14.9 Risks of Obsolescence and Technology Substitution
Chapter 15 India Intercity Sleeper Bus Market Key Strategic Imperatives
- 15.1 Growth and Market Entry Priorities
- 15.2 High-Return Products and Segments
- 15.3 Pricing, Profitability and Cost Optimization
- 15.4 Technology Investment and Product Differentiation
- 15.5 Supply Chain Localization and Resilience
- 15.6 Distribution and Customer Acquisition
- 15.7 Partnership, Acquisition and Capacity Strategy
- 15.8 Regional Expansion Priorities
- 15.9 Short-, Medium- and Long-Term Actions
Chapter 16 Competition Outlook
- 16.1 Industry Competition Characteristics
- 16.2 Market Structure and Concentration
- 16.3 Market Share and Competitive Positioning, 2025
- 16.4 Company-Wise Revenue and Product Benchmarking
- 16.5 Production and Service Capacity Benchmarking
- 16.6 Technology, Pricing and Differentiation
- 16.7 Regional Footprint and Distribution Strength
- 16.8 Mergers, Acquisitions and Strategic Alliances
- 16.9 New Entrants and Competitive Threats
- 16.10 Porter's Five Forces and Industry Attractiveness
- 16.11 Competitive Outlook, 2025-2035
Chapter 17 Company Profiles
- 17.1 Company Coverage and Selection Criteria
- 17.2 VRL Travels
- 17.2.1 Business Description
- 17.2.2 Company Ownership and Geographic Presence
- 17.2.3 Product and Service Portfolio
- 17.2.4 Manufacturing and Operating Footprint
- 17.2.5 Financial Performance and Investment
- 17.2.6 Market Share and Competitive Position
- 17.2.7 Technology and Innovation Capabilities
- 17.2.8 Strategic Alliances or Partnerships
- 17.2.9 Recent Developments
- 17.2.10 Growth Strategy and Outlook
- 17.3 SRS Travels
- 17.4 Orange Travels
- 17.5 IntrCity SmartBus
- 17.6 State transport undertakings
- 17.7 redBus
- 17.8 AbhiBus
- 17.9 FlixBus India
- 17.10 NueGo
- 17.11 Other Relevant Market Participants
Note: Every listed company is profiled on the structure shown under the first company. The company list is preliminary and may change based on research findings, market developments, data availability and client requirements.
Chapter 18 Disclaimer
- 18.1 Research and Forecast Disclaimer
- 18.2 Data Source and Estimation Limitations
Note: The depth of individual sections depends on data availability for this market. Volume, capacity, trade and other unit-based metrics are included where applicable.

