
Fewer children and more spending per child set the base
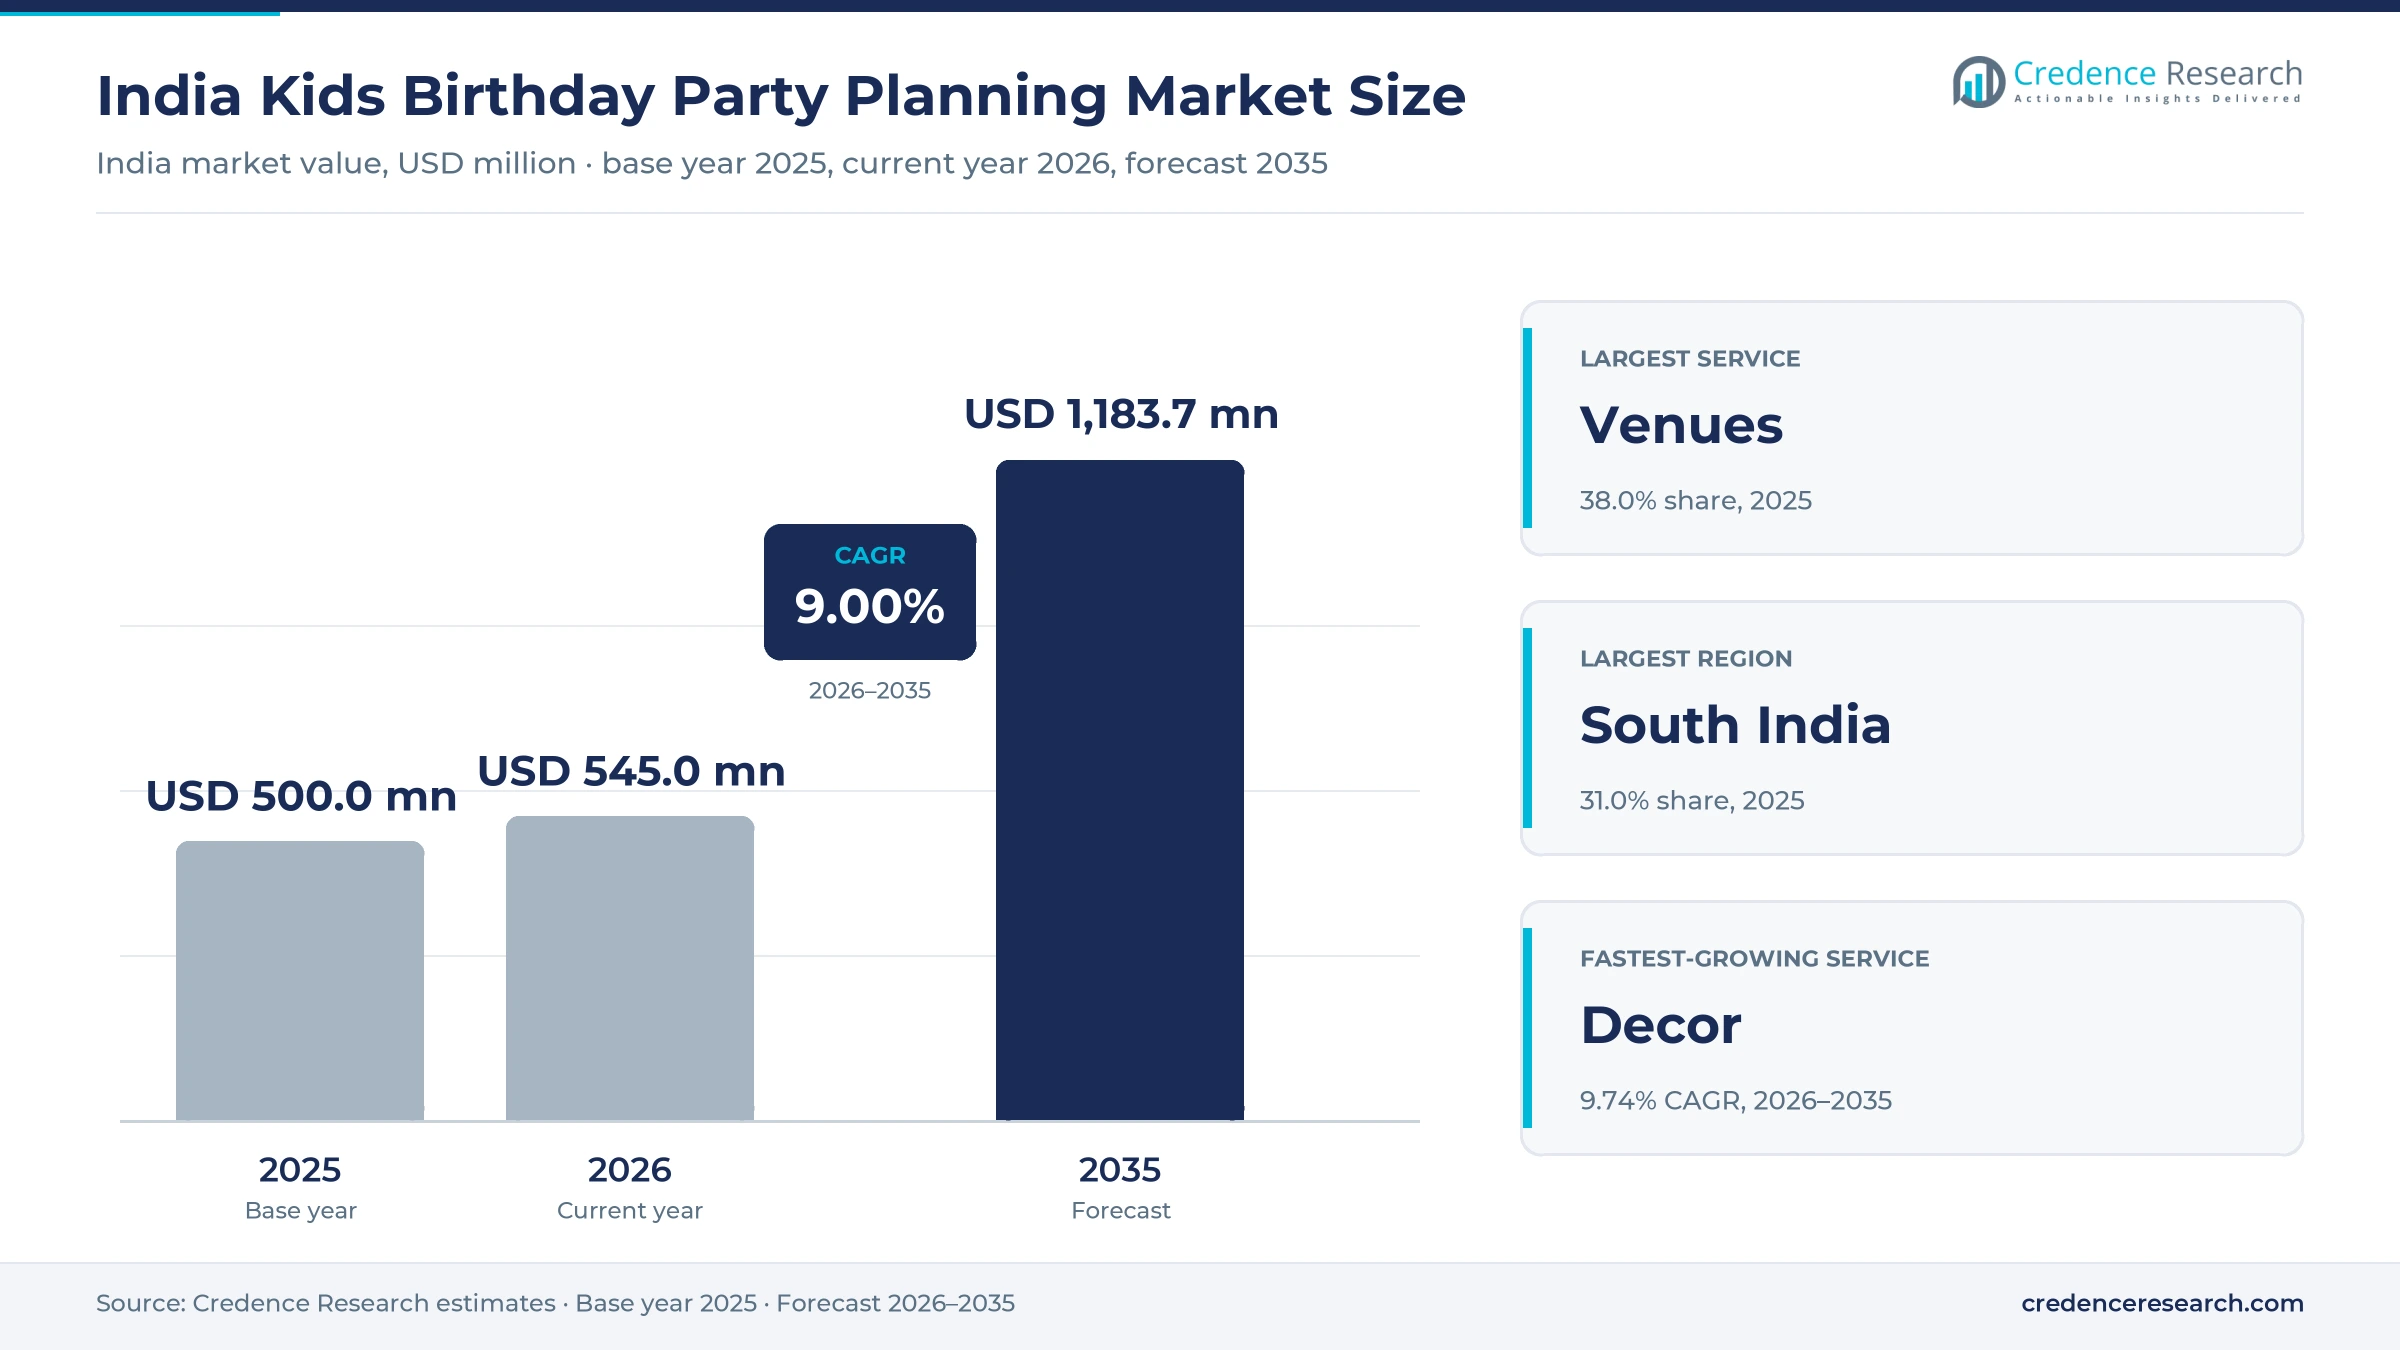
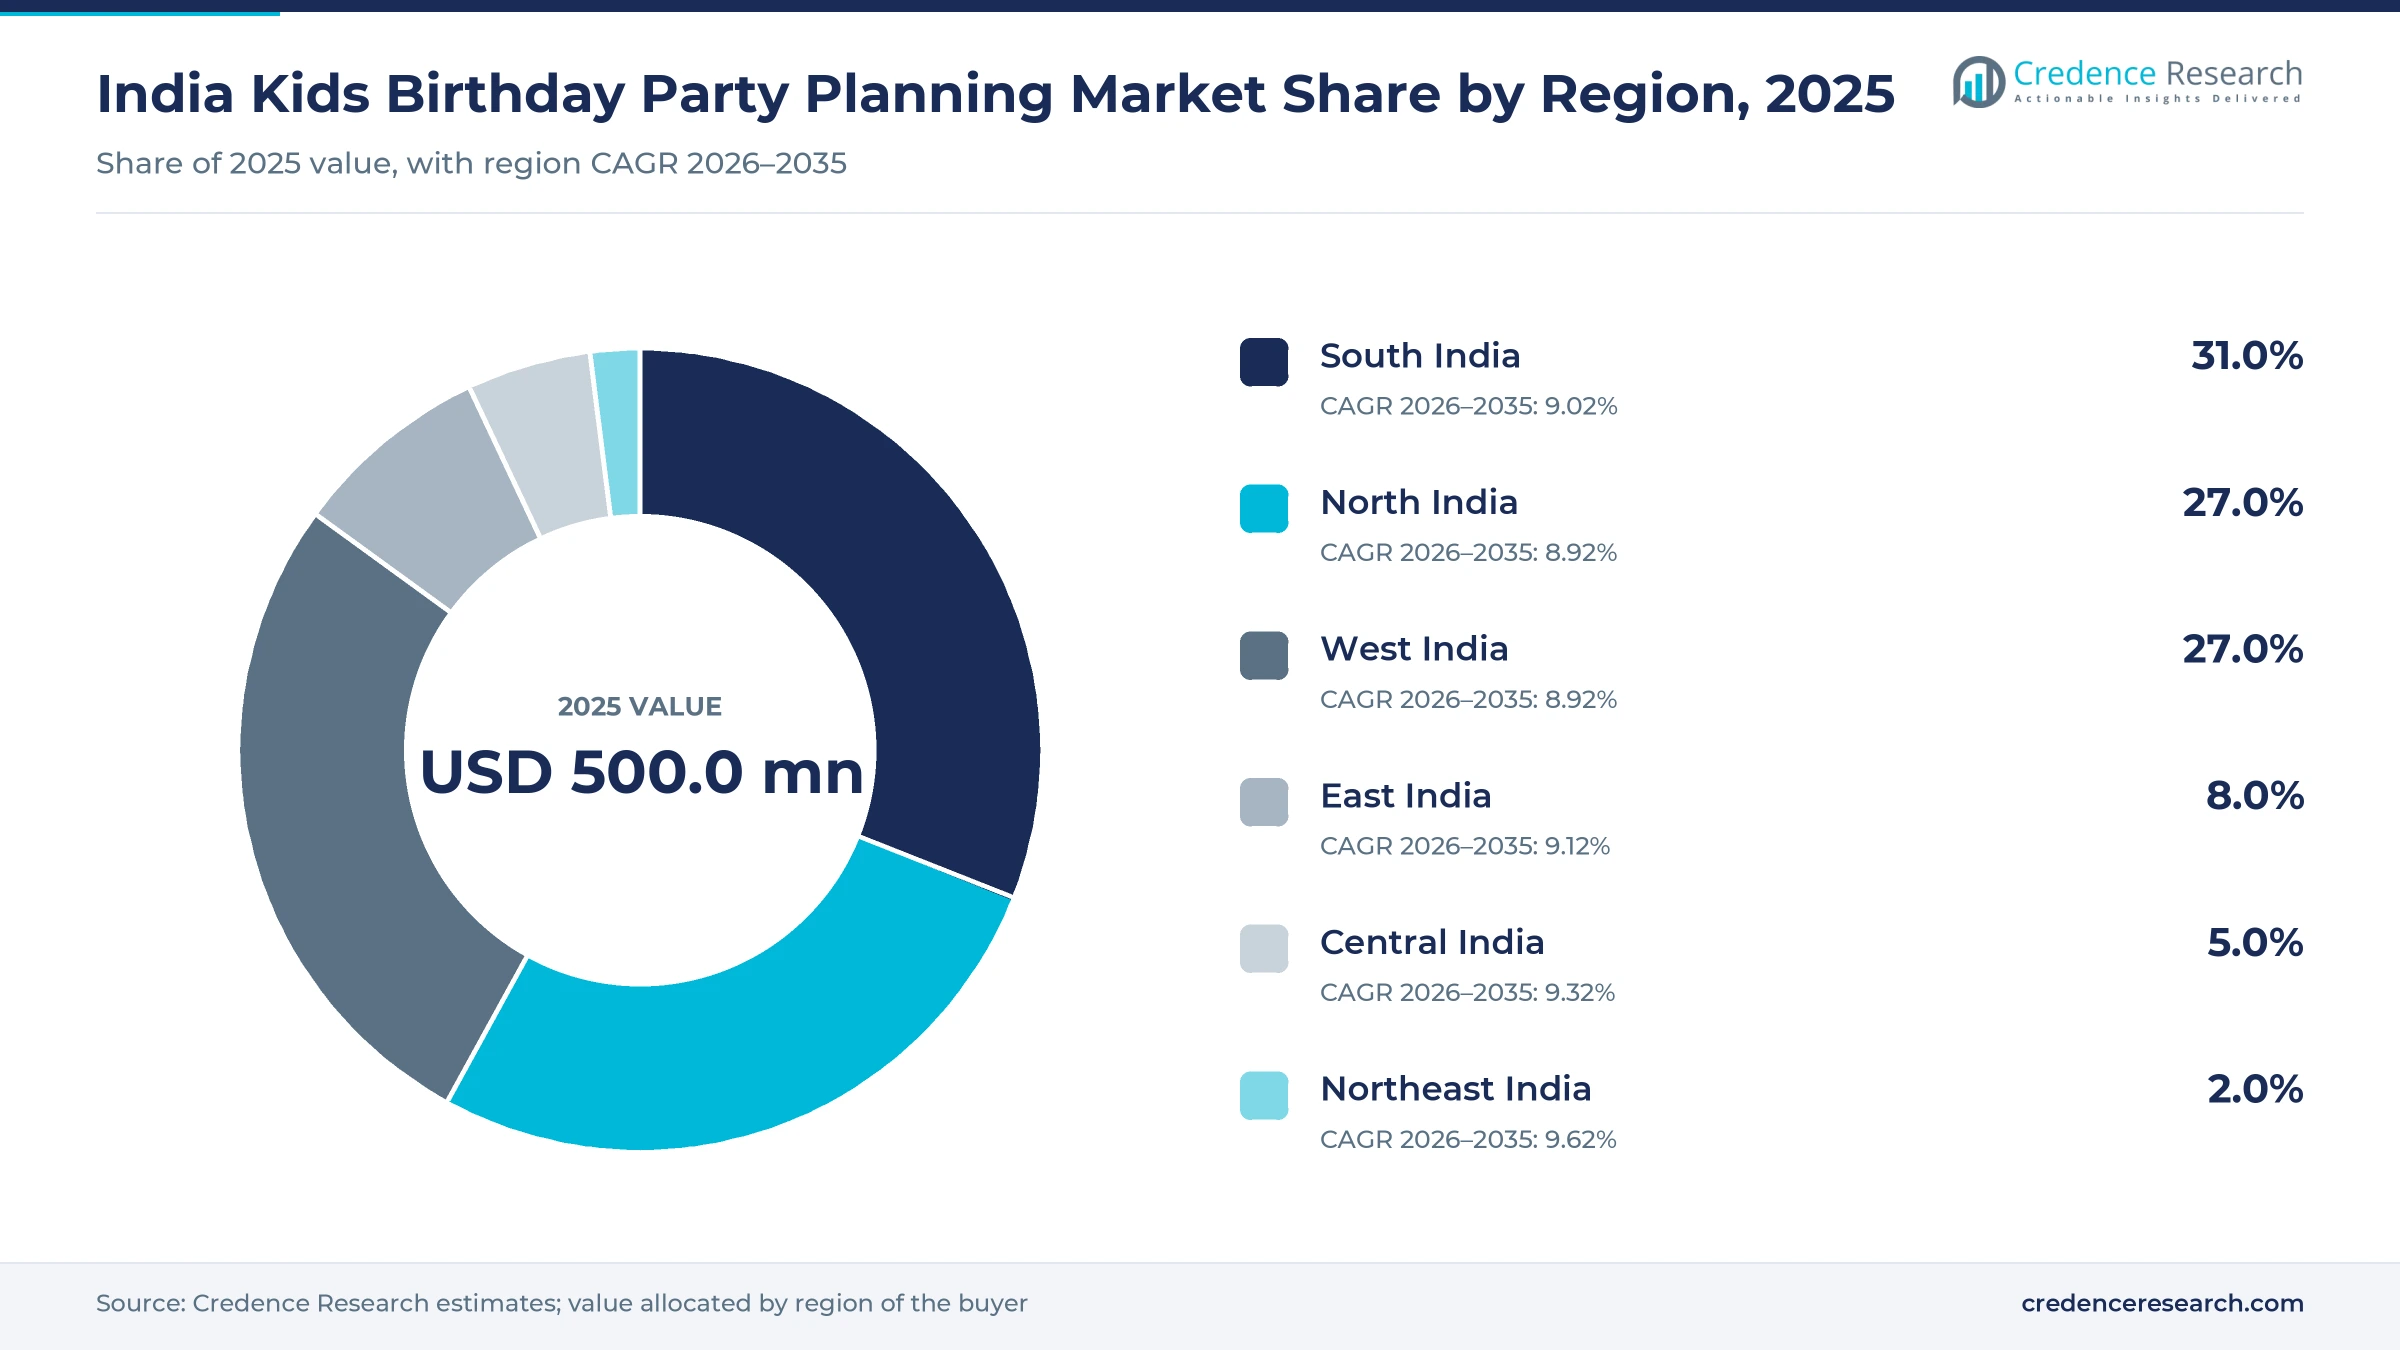
The India kids birthday party planning market was valued at USD 500.0 million in 2025 and is projected to increase from USD 545.0 million in 2026 to USD 1.18 billion by 2035, registering a CAGR of 9.00% during 2026–2035. Demand comes from urban parents who hire venues, decorators, entertainers and caterers for birthdays that used to be organized at home with family help. South India held the largest regional share, 31.0% in 2025, supported by the high urban household spending of Telangana, Tamil Nadu and Karnataka. Northeast India is the fastest-growing region at 9.62% a year, from a small base, as mall-based venues arrive in cities such as Agartala. Commercially, the most important change is the move from single services toward bundles, in which decor platforms add entertainers and food while arcade operators sell packaged parties with a host, private room and games.
What counts as kids birthday party spending, and who pays it?
The market counts paid services bought for the birthdays of children aged one to 12, including venue packages, balloon and theme decoration, entertainers and activity hosts, and party cakes and catering. Parents usually buy these services online or directly from a venue, often combining several local vendors for one event.
The market excludes return gifts, packaged party goods sold without a service, and general visits to play zones that are not party bookings. Weddings, corporate events and adult milestone celebrations are also excluded, even when the same vendors serve them.
India Kids Birthday Party Planning Market Insights
- The market grows from USD 500.0 million in 2025 to USD 1.18 billion by 2035, a 9.00% CAGR built on paid services replacing home-organized birthdays in metro and tier-2 cities.
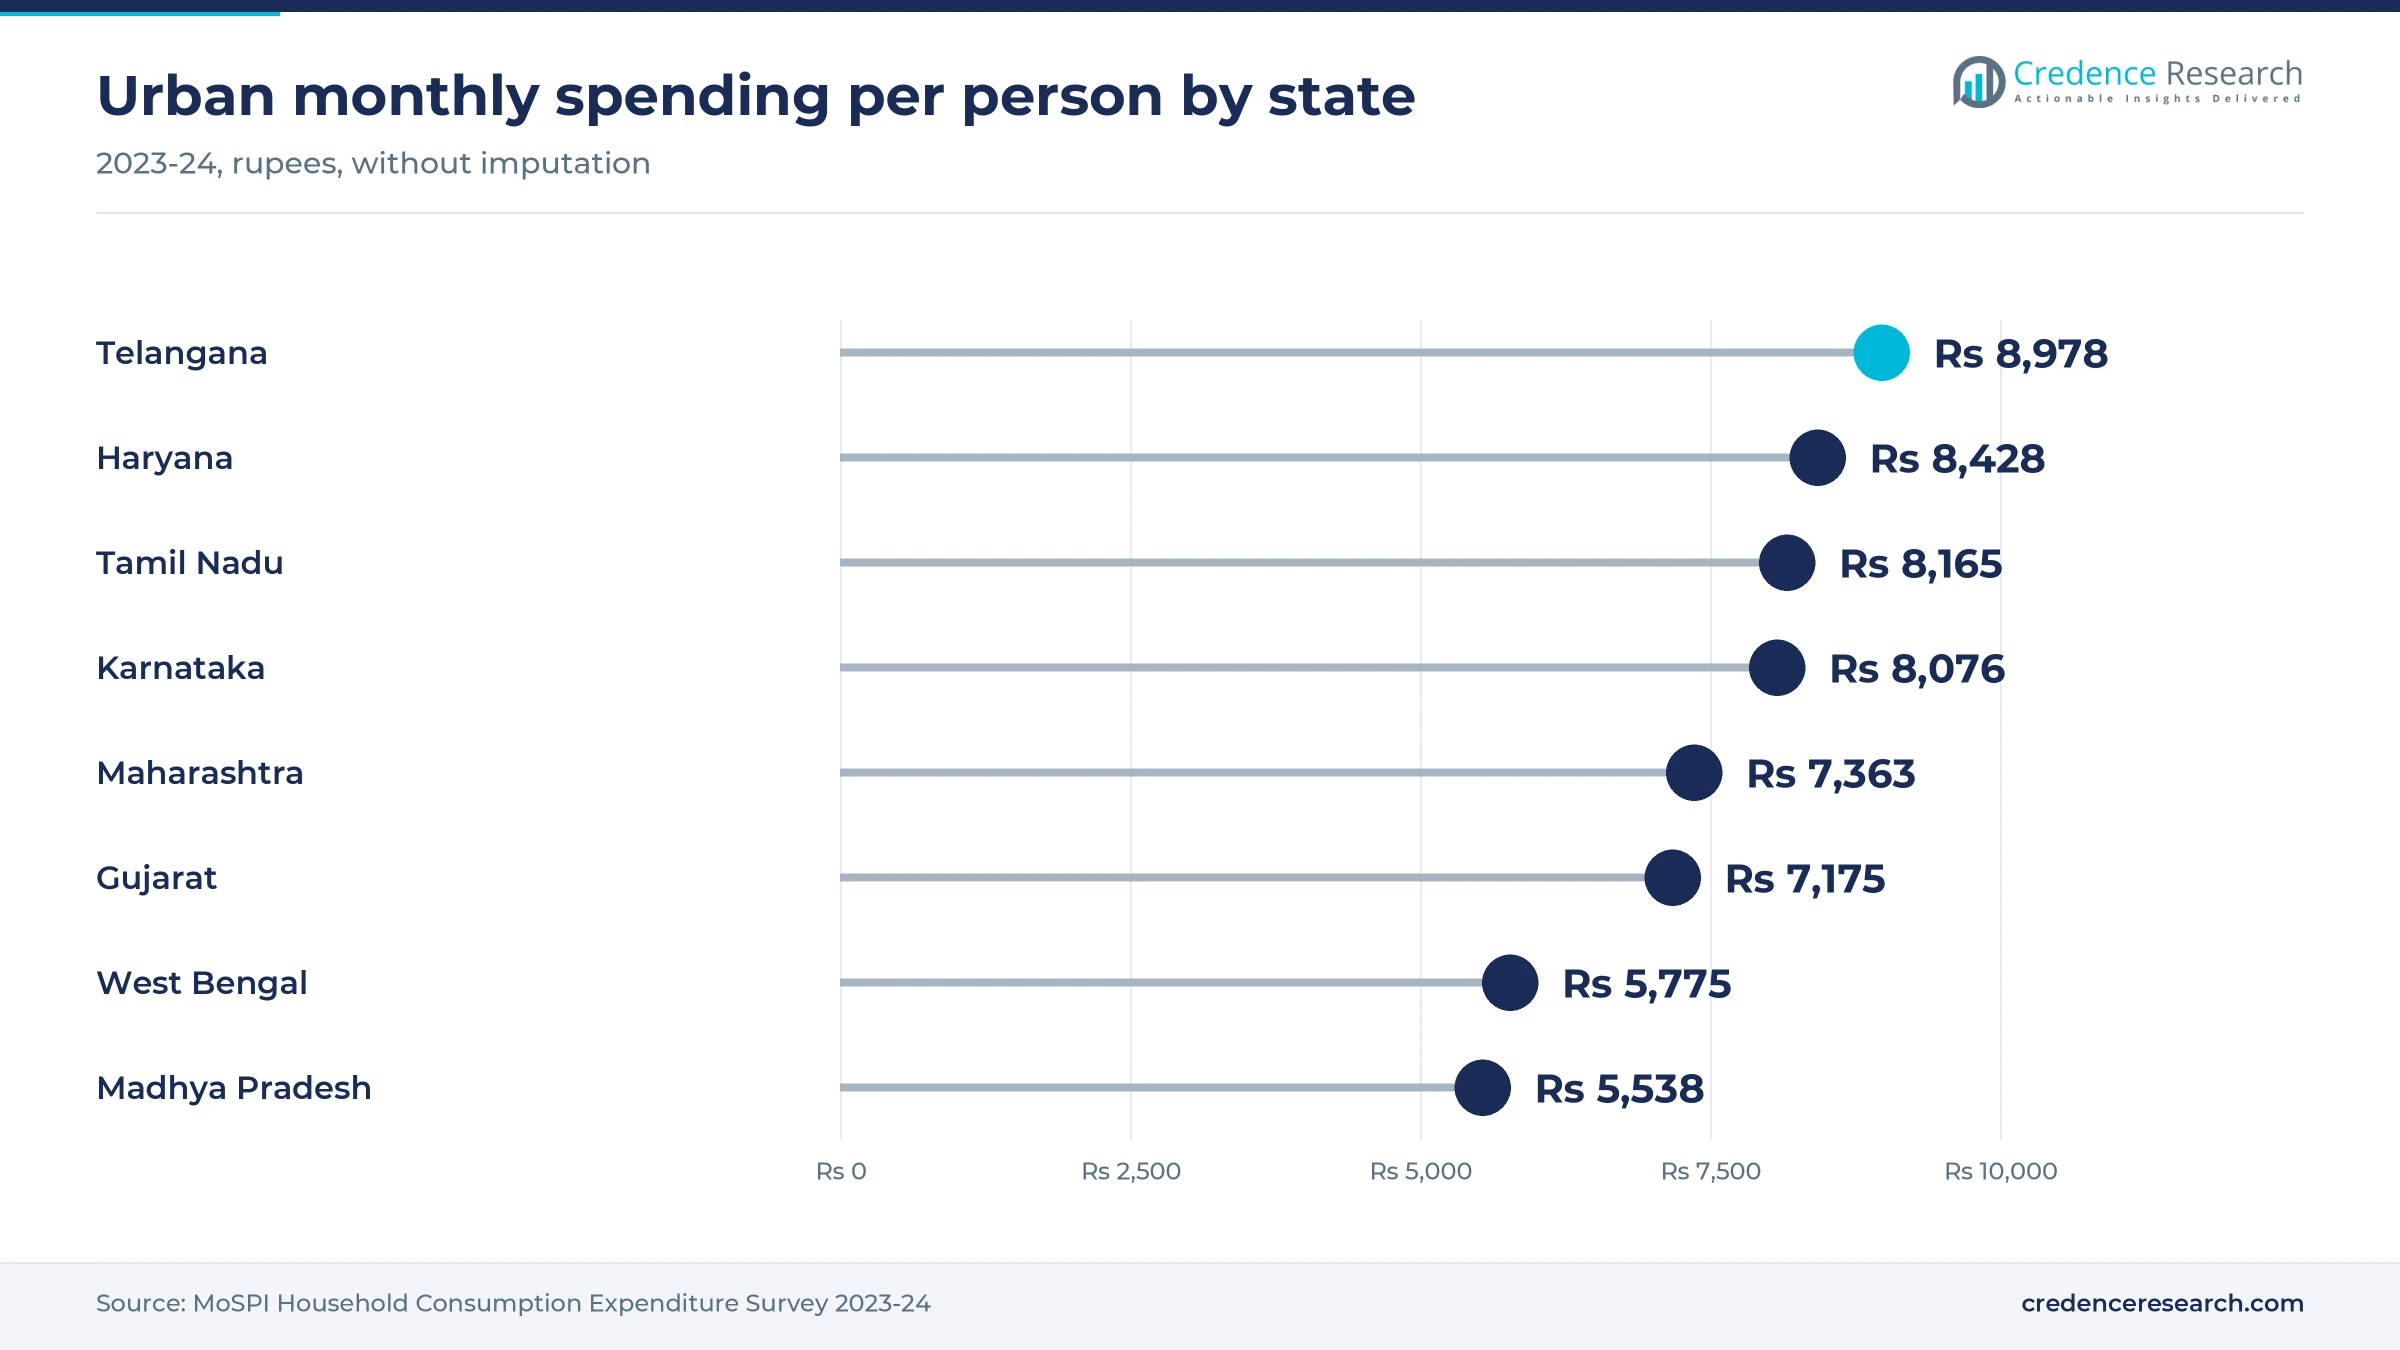
- South India led with 31.0% of 2025 value, supported by urban monthly spending of Rs 8,978 per person in Telangana and Rs 8,165 in Tamil Nadu.
- Venues held 38.0% of 2025 value, because packaged rooms at chains such as Timezone, which has more than 70 venues, solve hosting, games and supervision together.
- CherishX reports more than 1 million celebrations since 2015, and it has added catering to decor, activities and invitations, moving decor platforms toward complete party bundles.
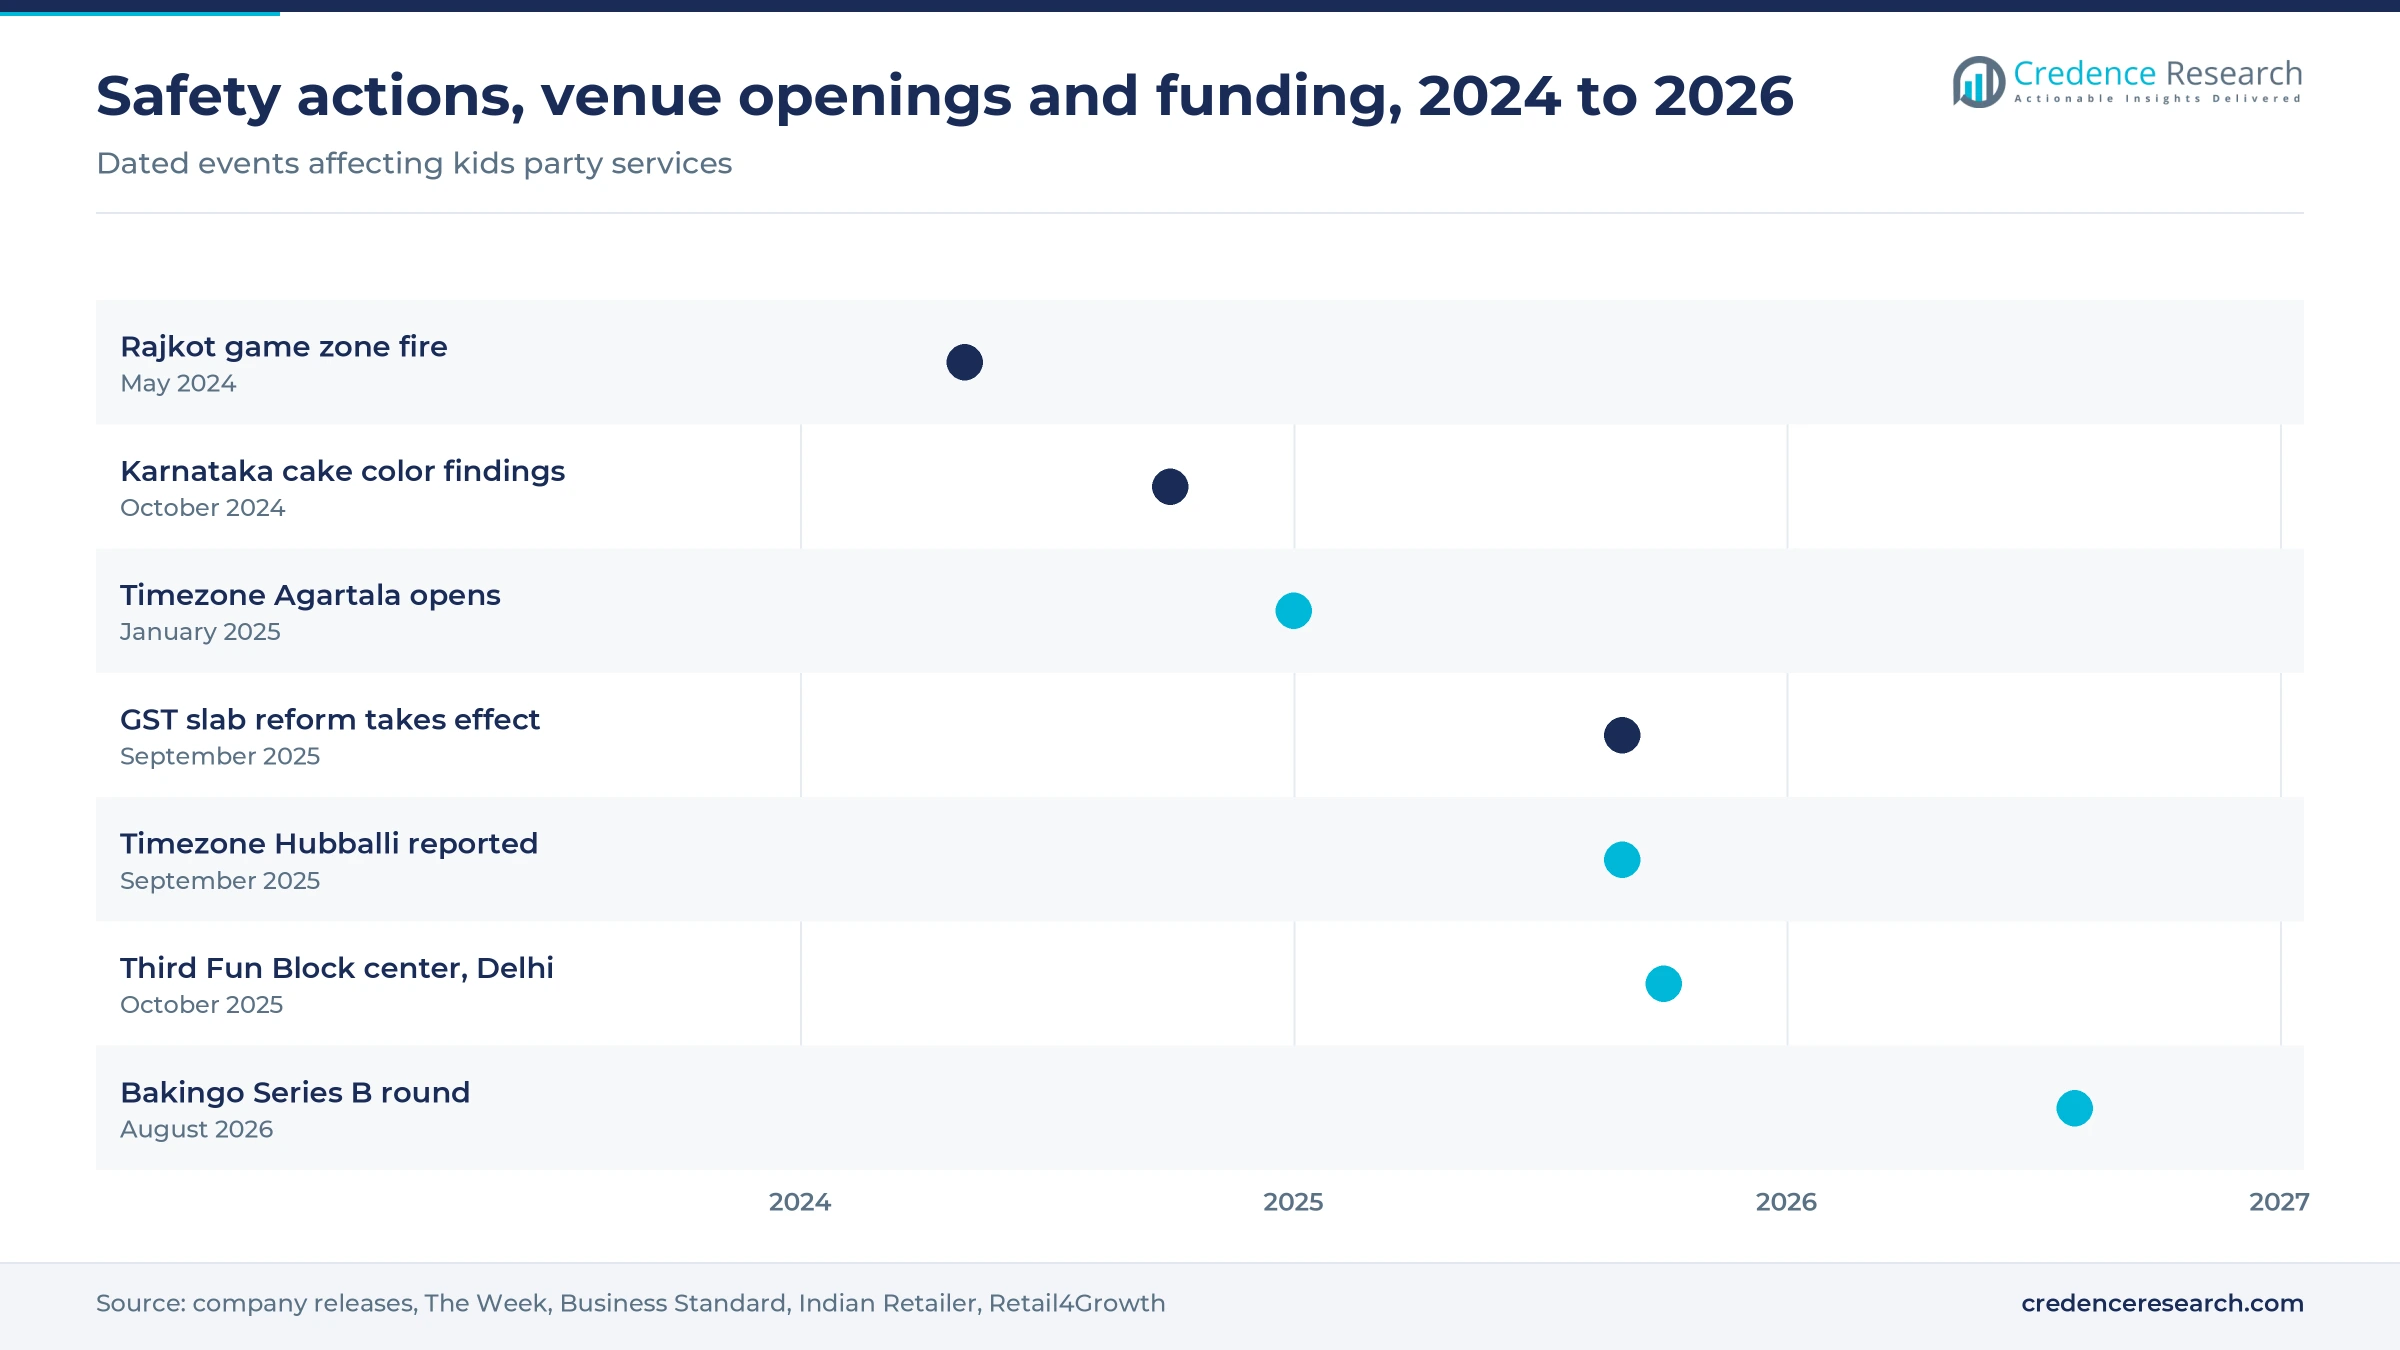
- In August 2026, Bakingo raised Rs 100 crore for growth from over 100 cloud kitchens, which shows investor interest in delivering celebration cakes across more than 30 cities.
Venues lead while decor grows fastest on shareable themes
Why do venues take the largest share of party budgets?
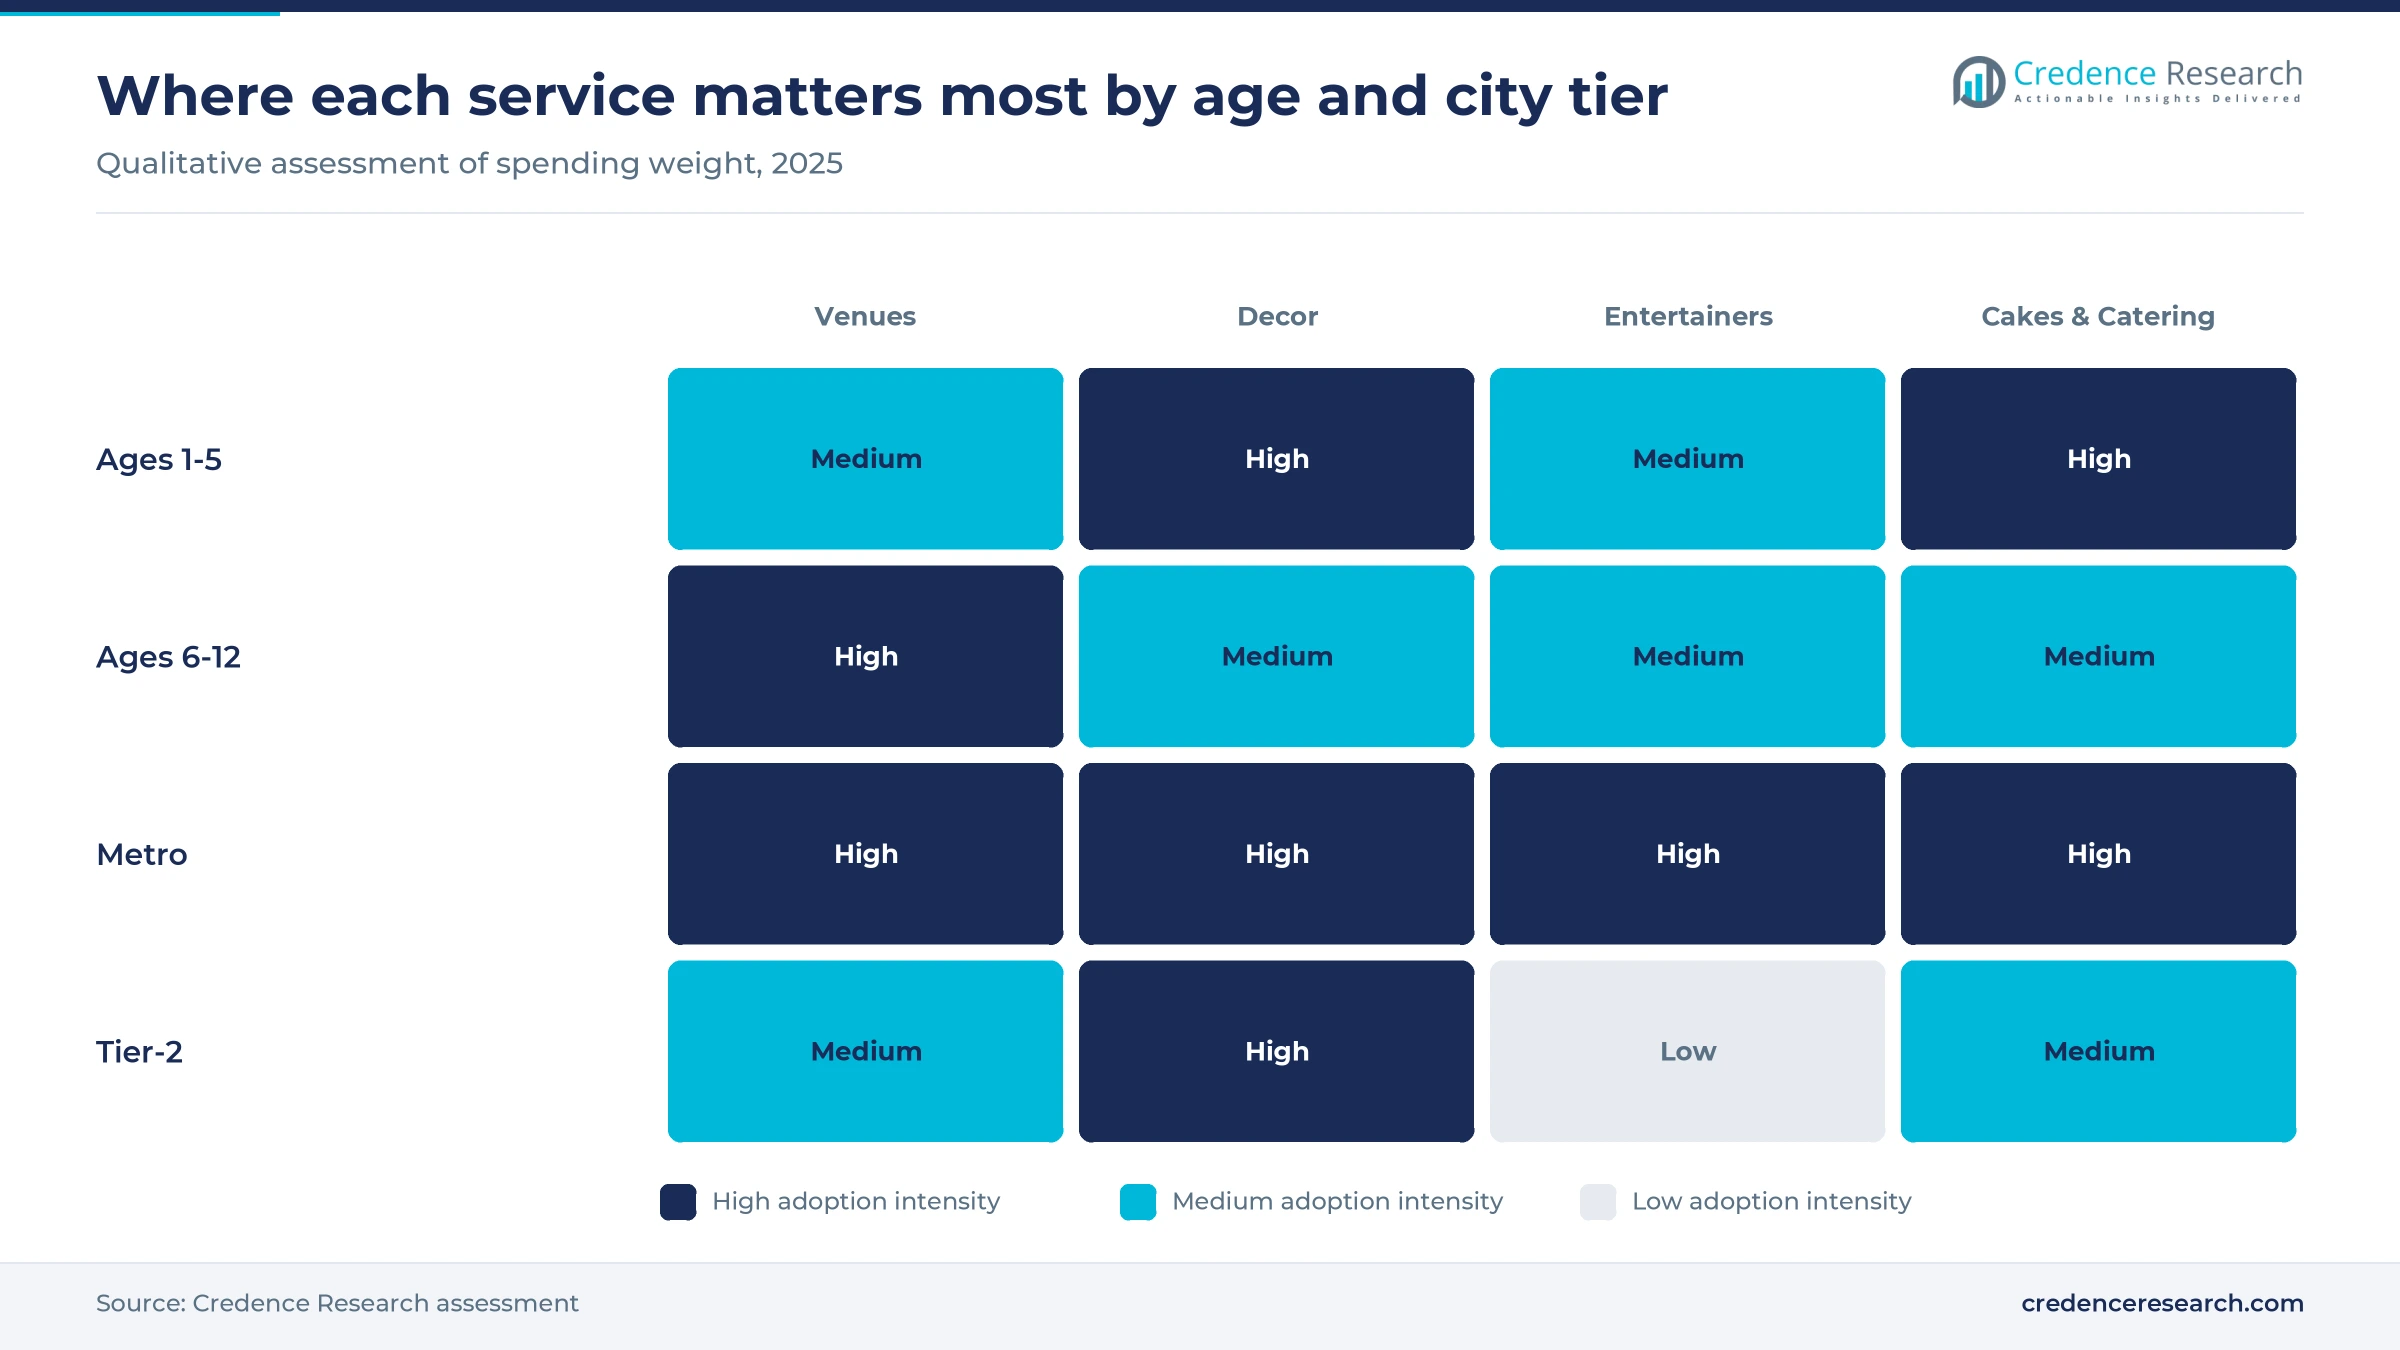
Based on service, the market is categorized into venues, decor, entertainers and cakes and catering. Venues led with 38.0% of 2025 value, because a single package covers space, games and supervision, and Timezone typically lists its Lite package at Rs 999 with a minimum of 10 guests at many of its venues. Independent banquet hall owners also take larger gatherings in smaller cities. Decor grows fastest at 9.74% a year, as CherishX prices kids theme decoration from Rs 1,699 and offers more than 100 themes, which brings a styled setup within reach of a home party.
How does the child's age change what parents buy?
Based on age, the market is categorized into ages 1-5 and ages 6-12. Ages 6-12 led with 56.0% of 2025 value, because older children invite classmates and want active games, and Timezone sets a minimum age of six years and a height of 3.5 feet for attractions. As a result, attraction-led packages suit this older group better. Ages 1-5 grows fastest at 9.39% a year, as Landmark Leisure designs Fun City for children aged 1 to 12 and CherishX suggests puppet shows and face painting for five-year-olds, giving parents of young children more supervised options.
Why are tier-2 cities growing faster than the metros?
Based on city tier, the market is categorized into metro and tier-2. Metro led with 66.0% of 2025 value, because Anarock counted about 73.06 million square feet of Grade A mall space in the top seven cities in the first half of 2026, and branded party rooms cluster in such malls. Tier-2 grows fastest at 9.91% a year, as new venues reach smaller cities. Timezone opened a venue of nearly 10,000 square feet with a dedicated party room at Inorbit Mall in Hubballi, which Indian Retailer reported in September 2025.
| Segment Group | Leading Sub-segment | Share, 2025 | Fastest-growing Sub-segment | CAGR, 2026–2035 |
|---|---|---|---|---|
| By Service | Venues | 38.0% | Decor | 9.74% |
| By Age | Ages 6-12 | 56.0% | Ages 1-5 | 9.39% |
| By City Tier | Metro | 66.0% | Tier-2 | 9.91% |
Request a Free Sample
Fill in your details and we'll send you a free sample report.
- Sample data tables & charts
- Research methodology
Themed events, venues and add-ons drive value growth
Parents book professionally themed parties for children
Smaller families are spending more on each child, which makes a professionally run birthday easier to justify. The Sample Registration System report for 2023, covered by PTI in September 2025, put the share of children aged 0 to 14 at 24.2%, down from 36.3% in 1991, while the total fertility rate fell to 1.9. At the same time, MoSPI reported that urban monthly spending per person averaged Rs 6,996 in 2023-24, with non-food items taking about 60% of it. CherishX, which began in 2015, now describes itself as a partner for more than 1 million celebrations. In the Credence Research model this driver adds about 3.33 percentage points to party planning demand growth each year to 2035.
Indoor entertainment venues bundle party experiences
Mall-based family entertainment centers have turned birthdays into a packaged product, which removes most of the organizing work from parents. Timezone reported more than 70 venues across 30 cities and 20 states in July 2025, and its Lite, Classic and Premium packages combine game time, prize games, attractions and a host. SkyJumper lists a presence in more than 19 cities and offers members party discounts of up to 15%, with food, decoration, a private area and supervised games included. Timezone also planned birthday discounts for its top loyalty tier. In the Credence Research model this driver adds about 2.43 percentage points to party planning demand growth each year to 2035.
Shareable decor and add-ons raise booking value
Photographs and short videos now shape what parents book, because a party is also a piece of family content. A Meta-commissioned study cited by afaqs in September 2025 found that 92% of Indian users prefer Reels over other short-form formats, and 80% of Indians said they find new brands on Meta platforms. That visibility supports paid extras well beyond the basic setup. CherishX in Hyderabad lists Rs 3,499 for a magic show, Rs 2,999 for live cartoon mascots and Rs 9,399 for a bubble house, so one add-on can exceed the price of the decoration itself. In the Credence Research model this driver adds about 1.80 percentage points to party planning demand growth each year to 2035.
Dark kitchens put custom party cakes within quick reach
Celebration cake supply has moved closer to the customer, which shortens planning time and widens choice for parents outside the largest metros. Bakingo raised Rs 100 crore in a Series B round reported on Aug. 11, 2026, and it now runs more than 100 cloud kitchens in over 30 cities, up from 75 kitchens in November 2023. Ferns N Petals, which sells designer and personalized cakes, operates in more than 400 cities and towns and plans to expand its metro dark stores from 21 to about 40 within a year. This reach adds to the wider organized bakery supply, and it makes a custom cake easier to add to any booking.
Bundled booking and tier-2 mall rooms open new revenue
Shift from single decor orders to complete party bundles
Decor platforms are moving toward complete events, because one booking is worth more than several separate orders and parents dislike managing many vendors. CherishX now lists five kids party packages that combine decoration, games and accessories, and its Pune page describes food catering as newly introduced. Its Hyderabad activity page runs to 54 items, from tattoo artists at Rs 1,999 to game coordinators at Rs 3,399. Rival 7eventzz, founded in 2020, reports more than 50,000 birthdays and designs starting at Rs 1,499. Many of these vendors also work in wedding decor, which helps them hold crews and suppliers through the year.
Rise of learning-led play formats at party venues
Venue operators are adding learning themes to play, because parents of younger children want a party that feels more purposeful than an arcade visit. Landmark Leisure India opened its third Fun Block center at Unity One Elegante Mall in Delhi, reported on Oct. 17, 2025, with STEM activity zones alongside an adventure play arena and a cafe. India Retailing reported in March 2025 that Fun City offers more than 100 activities and prizes for children aged 1 to 12, while its sister format Tridom covers 45,000 square feet. These formats also give venues reasons to sell weekday parties to school groups.
Opportunity in party rooms at tier-2 mall openings
Smaller-city malls offer an opening for operators able to reach families who have few organized party options today. Timezone opened at Polo Mall in Agartala in January 2025 with more than 9,000 square feet and two party rooms, then reached Hubballi that September with one dedicated room. Space in the largest cities is tightening, since Anarock put Grade A mall vacancy in the top seven cities at 5% in the first half of 2026, a five-year low. An Anarock report also said that tier-2 and tier-3 cities account for 65% of online shopping, which suggests parents there already buy services digitally. Operators can pair small rooms with local decor and catering partners.
Opening for allergy-aware children's party menus
Children's food offers a clear opening for caterers, because parents now ask for detailed changes and pay for professional menus. Mint reported in November 2023 that a children's party menu for 12 guests can cost more than 20,000 rupees, excluding the cake. Its report listed requests covering gluten, nuts, lactose and eggs, along with low-sugar and jaggery-only cakes. Parties are typically planned at least two months ahead, which gives caterers time to adapt, and Karnataka's October 2024 cake findings make ingredient disclosure a selling point. Firms in wedding catering already have the kitchens and crews for this work, and a separate children's menu can fill slower weekday dates between larger family functions.
Fire rules, food dyes and tax costs squeeze party operators
Fire safety scrutiny raises the cost of play venues
The TRP game zone fire in Rajkot on May 25, 2024, killed at least 27 people, and The Week reported that the site had no fire no-objection certificate. Karnataka ordered checks on Bengaluru gaming zones the next day. As a result, venue owners face closer inspection of exits, licenses and temporary structures, and smaller operators feel the compliance cost most. Mall-based sites with certified systems can turn this into a selling point with parents.
Food color findings put party cakes under watch
Karnataka's food safety department said in October 2024 that 12 of 235 cake samples it tested contained artificial colors above permitted limits, including Allura Red and Sunset Yellow. Because bright theme cakes depend on strong colors, home bakers and small bakeries are the most exposed. Parents and planners may then favor branded suppliers, which raises costs for small vendors. Written ingredient lists and natural colors offer a practical mitigation for most kitchens.
A high tax rate lifts the cost of formal bookings
Busy, a tax software publisher, lists event management, planning and venue rental at 18% GST, and the September 2025 reform left that rate in place while moving gyms and salons to the lower slab. This gap pushes small organized planners to compete against informal vendors who stay below the registration threshold. Parents comparing quotes often see the tax as an avoidable extra, so registered firms must justify it through reliability, written invoices and supervised service.
Low entry prices and thin demand limit small-city margins
Decor prices start near Rs 1,499 at 7eventzz and Rs 1,699 at CherishX, which leaves little room once crew travel and materials are paid. Inc42 reported in September 2024 that delivery firms in smaller cities face lower population density and smaller order sizes, and party vendors meet similar limits. Weekend peaks also leave crews idle for much of the week. Operators can respond by pooling crews across occasions and raising the share of add-ons in each booking.
South India leads the six zones on urban household spend
| Region | Value, 2025 (USD million) | Share, 2025 | CAGR, 2026–2035 |
|---|---|---|---|
| South India | 155.0 | 31.0% | 9.02% |
| North India | 135.0 | 27.0% | 8.92% |
| West India | 135.0 | 27.0% | 8.92% |
| East India | 40.0 | 8.0% | 9.12% |
| Central India | 25.0 | 5.0% | 9.32% |
| Northeast India | 10.0 | 2.0% | 9.62% |
South India leads on high urban household spending
South India held a 31.0% share of 2025 party planning value and grows at 9.02% a year, because its urban households rank among the highest spenders in India. MoSPI data show monthly spending per person of Rs 8,978 in urban Telangana, Rs 8,165 in Tamil Nadu and Rs 8,076 in Karnataka for 2023-24. A paper from the Economic Advisory Council to the Prime Minister put the southern states at about 30.6% of national GDP in 2023-24. Fun City announced its fifth Bengaluru outlet in November 2023, and Hubballi now has Timezone.
North India builds on the largest mall base
North India held a 27.0% share of 2025 party planning value and grows at 8.92% a year, supported by Delhi-NCR, which Anarock credits with 19.42 million square feet of Grade A mall stock, the most of any city in the first half of 2026. Urban Haryana also reported monthly spending per person of Rs 8,428 in 2023-24. Landmark Leisure has placed its Fun Block centers in Dwarka, Greater Noida and North West Delhi, while Bakingo listed Gurugram, Noida, Jaipur, Chandigarh and Lucknow among its cities in November 2023.
West India pairs Mumbai scale with safety scrutiny
West India held a 27.0% share of 2025 party planning value and grows at 8.92% a year, with Mumbai and Pune as its main party markets. Urban monthly spending per person reached Rs 7,363 in Maharashtra and Rs 7,175 in Gujarat in 2023-24. Timezone opened its largest flagship at Inorbit Mall in Malad in June 2025, at 24,626 square feet, The Tribune reported. The 2024 Rajkot fire also happened in this zone, so new game sites here face especially close questions on fire clearance.
East India grows from lower household budgets
East India held an 8.0% share of 2025 party planning value and grows at 9.12% a year, as lower budgets keep most parties at home or in local halls. Urban monthly spending per person was Rs 5,775 in West Bengal, Rs 5,825 in Odisha and Rs 5,080 in Bihar in 2023-24. Kolkata offers the main organized base, since Anarock reported its mall vacancy at just 1.3% in the first half of 2026, which limits new party room space there.
Central India starts from a small organized base
Central India held 5.0% of 2025 value and grows at 9.32% a year, because organized supply is thin outside the larger cities of Madhya Pradesh and Chhattisgarh. Urban monthly spending per person was Rs 5,538 in Madhya Pradesh and Rs 4,927 in Chhattisgarh in 2023-24, according to MoSPI. Timezone already lists a separate Central group in its venue finder, which shows the region is now part of national chain planning.
Northeast India gains its first branded party rooms
Northeast India held 2.0% of 2025 value and grows the fastest at 9.62% a year, from a very small base. Timezone opened in Agartala in January 2025 with two party rooms and party hosts, which gave Tripura a branded option for children's birthdays. Urban Assam also reported monthly spending per person of Rs 6,794 in 2023-24, higher than in most eastern and central states, which supports demand in Guwahati.
Venue openings and safety actions marked 2024 to 2026
| Development | Status and market relevance |
|---|---|
| In May 2024, the TRP game zone fire in Rajkot killed at least 27 people, and Karnataka then ordered safety checks on Bengaluru gaming zones. | Closer inspection of play venues continues across states |
| In October 2024, Karnataka's food safety department reported artificial colors above permitted limits in 12 of 235 cake samples. | Bakeries were cautioned, and scrutiny of theme cakes followed |
| In January 2025, Timezone opened at Polo Mall in Agartala with more than 9,000 square feet and two party rooms. | Operating, and it extends branded rooms to the Northeast |
| In October 2025, Landmark Leisure India opened its third Fun Block center at Unity One Elegante Mall in Delhi. | Operating, with STEM zones aimed at families |
| In August 2026, Bakingo raised Rs 100 crore in a Series B round led by existing investor Faering Capital. | Funds support expansion from over 100 cloud kitchens |
Booking pages and dark kitchens reshape the service
- Online booking pages let parents compare venue packages by location, since Timezone shows availability and price for each of its sites.
- Theme catalogs help decor platforms sell by picture, and CherishX lists more than 100 themes from Unicorn to Jungle Safari.
- Cloud kitchens allow bakers such as Bakingo to customize cakes near the customer without opening a full retail store.
- Loyalty programs give venues repeat bookings, as SkyJumper ties its party discounts to silver, gold and platinum membership tiers.
Need a Custom Version of This Report?
Tailor the scope, geography, or segments to your exact requirements.
- Custom geography or segment scope
- Direct access to our analyst team
Venue chains and decor platforms face local planners
Competition is local and fragmented, because most birthdays are still served by neighborhood decorators, bakers and party halls that sell within one city. Venue chains compete at the organized end, where Timezone reported more than 70 venues in July 2025 and SkyJumper lists more than 28 centers. Landmark Leisure competes through Fun City and Fun Block, which target younger children and families in malls. Decor platforms such as CherishX and 7eventzz win on catalog breadth and on published prices, then sell entertainers and activities as add-ons. Ferns N Petals and Bakingo reach the market through celebration cakes, and both are investing in faster delivery networks. Local planners remain strongest at larger custom parties, where personal trust and flexibility count for more than a listed price. Pricing is set venue by venue and city by city, so operators win through location, weekend capacity, safety record and the ability to bundle services.
Companies profiled and their roles in this market
| Company | Type | Role in the market |
|---|---|---|
| Timezone | Arcade and party venue chain | Reported more than 70 venues across 30 cities in July 2025; sells hosted party packages with private rooms. |
| CherishX | Decor and party services platform | Operating since 2015; lists more than 100 themes, entertainers, activities and newly added catering. |
| Landmark Leisure (Fun City, Fun Block) | Children's play center operator | Designs Fun City for ages 1 to 12; opened its third Fun Block center in Delhi in October 2025. |
| SkyJumper | Trampoline park chain | Lists more than 28 centers and party packages with food, decoration and a dedicated host. |
| Ferns N Petals | Gifting and cakes brand | Sells designer and personalized cakes; operates in more than 400 cities and towns. |
| Bakingo | Cloud kitchen cake brand | Runs more than 100 cloud kitchens in over 30 cities; raised Rs 100 crore in August 2026. |
| 7eventzz | Decor and party services platform | Founded in 2020; reports more than 50,000 birthdays and designs from Rs 1,499. |
Bundling matters more than adding another decor theme
Credence Research's view is that the operators gaining most will sell the whole party rather than another decor theme. Prices at the entry level are already close to Rs 1,500, so decor alone offers limited margin, while add-ons such as a Rs 3,499 magic show lift the value of each booking. Venues keep the advantage of supervision and safety assurance, especially after the 2024 Rajkot fire. The most assumption-heavy figure in this report is the share of families buying a paid service each year, which should be read as an estimate.
How the party service estimates were built
The report uses 2025 as the base year and forecasts to 2035. Market values come from the Credence Research model, and regional and segment splits are Credence Research estimates informed by public data. Sources include MoSPI household spending data, the Sample Registration System, state food safety notices, company pages and releases, and retail and real estate trade publications. A bottom-up check used the number of urban children, an assumed share of families buying a paid service and published service prices. No primary interviews or surveys were conducted for this edition, and listed prices may vary by city and date.
Smaller cities and younger age groups shape growth to 2035
The market is projected to reach USD 1.18 billion by 2035, and tier-2 cities and younger age groups should grow fastest, although metros and older children still add the larger dollar amounts. Fertility at 1.9 suggests that the number of children will not drive this growth, so spending per child must do the work. Operators that open small party rooms in new malls and offer food, entertainers and decor in one booking are best placed. However, stricter inspections, the tax rate on event services and color rules in bakery work could slow smaller vendors, which would shift more of this growth toward organized chains.
Frequently Asked Questions
How big is the India kids birthday party planning market?
Which region leads the market?
Which service is largest?
Which age group spends the most?
How much does a kids party service cost in India?
Why are tier-2 cities growing faster?
What are the main risks for operators?
Who are the main companies?
Table of Content
Chapter 1 Market Segmentation
- 1.1 Segmentation Framework
- 1.1.1 Product and Service Classification
- 1.1.2 Application and End-Use Classification
- 1.1.3 Technology and Solution Classification
- 1.1.4 Customer and Distribution Channel Classification
- 1.1.5 Geographic Segmentation
- 1.1.6 Market Segment Definitions and Boundaries
- 1.2 By Service
- 1.2.1 Venues
- 1.2.2 Decor
- 1.2.3 Entertainers
- 1.2.4 Cakes & Catering
- 1.3 By Age
- 1.3.1 Ages 1-5
- 1.3.2 Ages 6-12
- 1.4 By City Tier
- 1.4.1 Metro
- 1.4.2 Tier-2
Chapter 2 Introduction
- 2.1 Report Objectives and Scope
- 2.2 Product Definition and Industry Terminology
- 2.3 Market Inclusions and Exclusions
- 2.4 Research Process
- 2.4.1 Primary Research and Expert Interviews
- 2.4.2 Secondary Research and Source Review
- 2.4.3 Top-Down and Bottom-Up Estimation
- 2.4.4 Data Triangulation and Verification
- 2.5 Market Size Measurement Basis
- 2.5.1 2025: USD 500.0 million → 2035: USD 1.18 billion
- 2.6 Historical and Forecast Reference Periods
- 2.6.1 Historical Period: 2018-2025
- 2.6.2 Base Year: 2025
- 2.6.3 Forecast Period: 2025-2035
- 2.7 Research Assumptions and Limitations
Chapter 3 Executive Summary
- 3.1 Market Snapshot and Key Findings
- 3.2 Base-Year Market Size, 2025
- 3.3 Forecast Market Size, 2035
- 3.4 Revenue and Volume Growth Outlook
- 3.5 Key Demand and Supply Indicators
- 3.6 Leading Market Segments
- 3.7 Fastest-Growing Market Opportunities
- 3.8 Regional Performance Highlights
- 3.9 Technology and Industry Transformation
- 3.10 Competitive Landscape Summary
- 3.11 Analyst View and Strategic Implications
Chapter 4 India Kids Birthday Party Planning Market Trends and Developments
- 4.1 Historical Industry Development, 2018-2025
- 4.2 Recent Market Trends and Developments
- 4.3 Demand and Customer Behavior Trends
- 4.4 Technology and Product Innovation
- 4.5 Artificial Intelligence, Automation and Digitalization
- 4.6 Local Manufacturing and Supply Chain Realignment
- 4.7 Industry Partnerships, Mergers and Acquisitions
- 4.8 Sustainability and Circular Economy Developments
- 4.9 Government and Private Sector Investment Trends
- 4.10 Emerging Business Models and Commercialization
- 4.11 Industry Developments and Announcements
Chapter 5 India Kids Birthday Party Planning Market Supply and Demand Analysis
- 5.1 Demand Trend and Consumption Analysis, 2018-2025
- 5.2 Demand Forecast, 2025-2035
- 5.3 Supply Chain Structure and Procurement Trends
- 5.4 Supply-Demand Gap and Bottlenecks
- 5.5 Import Dependence and Sourcing Structure
- 5.6 Regional Supply and Demand Concentration
Chapter 6 India Kids Birthday Party Planning Market Pricing Analysis
- 6.1 Pricing Structure and Measurement
- 6.2 Historical Pricing Trends, 2018-2025
- 6.3 Pricing Outlook, 2025-2035
- 6.4 Pricing by Product and Market Segment
- 6.5 Geographic Pricing Differences
- 6.6 Key Input, Energy, Labor and Logistics Costs
- 6.7 Contract Pricing and Purchasing Models
- 6.8 Pricing Sensitivity and Competitive Positioning
- 6.9 Price, Margin and Profitability Implications
Chapter 7 India Kids Birthday Party Planning Market Dynamics
- 7.1 Market Growth Drivers
- 7.1.1 Demand-Side Drivers
- 7.1.2 Technology and Innovation Drivers
- 7.1.3 Infrastructure and Investment Drivers
- 7.1.4 Regulatory and Policy Drivers
- 7.2 Market Restraints
- 7.2.1 Cost and Affordability Constraints
- 7.2.2 Technology and Adoption Barriers
- 7.2.3 Supply Chain and Operational Constraints
- 7.3 Market Challenges
- 7.3.1 Competitive Pressure and Margin Erosion
- 7.3.2 Skills, Infrastructure and Implementation Gaps
- 7.4 Emerging Market Opportunities
- 7.5 Market Dynamics Impact and Time-Horizon Assessment
Chapter 8 India Kids Birthday Party Planning Value Chain Analysis
- 8.1 Industry Value Chain Overview
- 8.2 Upstream Suppliers and Critical Inputs
- 8.3 Technology and Component Providers
- 8.4 Manufacturing or Service Delivery
- 8.5 Distribution, Channel Partners and Integrators
- 8.6 Downstream Applications and End Users
- 8.7 Value Addition and Profit Pools
- 8.8 Vertical Integration and Outsourcing
- 8.9 Supplier Concentration and Risk
- 8.10 Supply Chain Localization and Resilience
Chapter 9 India Kids Birthday Party Planning Market Regulations and Policies
- 9.1 Relevant Laws, Standards and Compliance Frameworks
- 9.2 Product, Service, Safety and Quality Requirements
- 9.3 Government Policies, Incentives and Subsidies
- 9.4 Imports, Exports and Trade Barriers
- 9.5 Public Procurement and Local Content Requirements
- 9.6 Data Protection, AI and Cybersecurity Compliance
- 9.7 Upcoming Policy Changes and Market Implications
Chapter 10 India Kids Birthday Party Planning Market Hotspots and Opportunities
- 10.1 Market Opportunity Mapping and Growth Hotspots
- 10.2 High-Growth Applications and Customer Groups
- 10.3 Underserved Markets and White-Space Opportunities
- 10.4 Emerging Technology and Product Opportunities
- 10.5 New Capacity and Investment Hotspots
- 10.6 Market Entry and Expansion Opportunities
- 10.7 Distribution and Partnership Opportunities
- 10.8 Near-Term and Long-Term Commercial Potential
- 10.9 Opportunity Attractiveness and Execution Risks
Chapter 11 India Kids Birthday Party Planning Market Outlook, 2025-2035
- 11.1 Market Size and Analysis
- 11.1.1 Revenue (Market Measurement: 2025: USD 500.0 million → 2035: USD 1.18 billion)
- 11.1.2 Historical Market Size, 2018-2025
- 11.1.3 Base-Year Market Size, 2025
- 11.2 Market Forecast, 2025-2035
- 11.2.1 Revenue Forecast to 2035
- 11.2.2 CAGR and Year-on-Year Growth
- 11.2.3 Incremental Revenue Opportunity
- 11.3 Forecast Assumptions and Scenario Analysis
- 11.3.1 Base-Case Forecast
- 11.3.2 Optimistic and Conservative Scenarios
- 11.3.3 Technology, Pricing and Policy Sensitivities
- 11.4 Market Attractiveness and Growth Outlook
Chapter 12 India Kids Birthday Party Planning Market Segmentation and Outlook
- 12.1 Segmentation Summary and Market Shares, 2025
- 12.2 Largest and Fastest-Growing Segments
- 12.3 By Service - Market Size and Forecast, 2025-2035
- 12.3.1 Segment Definition and Scope
- 12.3.2 Historical Market Size, 2018-2025
- 12.3.3 Revenue Forecast, 2025-2035
- 12.3.4 Base-Year Market Share, 2025
- 12.3.5 Segment CAGR and Growth Drivers
- 12.3.6 Subsegment Market Size and Forecast
- 12.3.6.1 Venues
- 12.3.6.2 Decor
- 12.3.6.3 Entertainers
- 12.3.6.4 Cakes & Catering
- 12.3.7 Subsegment Pricing and Adoption Trends
- 12.3.8 Leading Suppliers and Competition
- 12.3.9 Regional Demand and Opportunities
- 12.4 By Age - Market Size and Forecast, 2025-2035
- 12.4.1 Segment Definition and Scope
- 12.4.2 Historical Market Size, 2018-2025
- 12.4.3 Revenue Forecast, 2025-2035
- 12.4.4 Base-Year Market Share, 2025
- 12.4.5 Segment CAGR and Growth Drivers
- 12.4.6 Subsegment Market Size and Forecast
- 12.4.6.1 Ages 1-5
- 12.4.6.2 Ages 6-12
- 12.4.7 Subsegment Pricing and Adoption Trends
- 12.4.8 Leading Suppliers and Competition
- 12.4.9 Regional Demand and Opportunities
- 12.5 By City Tier - Market Size and Forecast, 2025-2035
- 12.5.1 Segment Definition and Scope
- 12.5.2 Historical Market Size, 2018-2025
- 12.5.3 Revenue Forecast, 2025-2035
- 12.5.4 Base-Year Market Share, 2025
- 12.5.5 Segment CAGR and Growth Drivers
- 12.5.6 Subsegment Market Size and Forecast
- 12.5.6.1 Metro
- 12.5.6.2 Tier-2
- 12.5.7 Subsegment Pricing and Adoption Trends
- 12.5.8 Leading Suppliers and Competition
- 12.5.9 Regional Demand and Opportunities
- 12.6 Segment Growth Comparison
- 12.7 Segment Attractiveness and Priority Matrix
Chapter 13 India Kids Birthday Party Planning Geographic Market Outlook, 2025-2035
- 13.1 Domestic Market Distribution and Demand Clusters
- 13.2 State- or Province-Wise Market Size and Forecast, 2025-2035
- 13.3 City and Metropolitan Market Outlook
- 13.4 Industrial, Manufacturing and Commercial Clusters
- 13.5 Geographic Concentration of Key End Users
- 13.6 Local Pricing and Purchasing Differences
- 13.7 Domestic Production Facilities and Capacity Map
- 13.8 Local Infrastructure and Project Pipeline
- 13.9 State-Level Policy and Incentive Differences
- 13.10 Subnational Investment Hotspots and Opportunities
- 13.11 Distribution and Logistics Networks
- 13.12 Domestic Competitive Footprint
Chapter 14 India Kids Birthday Party Planning Technology, Innovation and Sustainability Outlook
- 14.1 Technology Landscape and Maturity
- 14.2 Product, Process and Service Innovation
- 14.3 AI, Automation and Digital Tools in the Industry
- 14.4 Technology Adoption and Performance Benchmarking
- 14.5 Innovation Pipeline and R&D Investment
- 14.6 Energy Efficiency and Resource Management
- 14.7 Sustainability, Recycling and Circularity
- 14.8 Technology Roadmap, 2025-2035
- 14.9 Risks of Obsolescence and Technology Substitution
Chapter 15 India Kids Birthday Party Planning Market Key Strategic Imperatives
- 15.1 Growth and Market Entry Priorities
- 15.2 High-Return Products and Segments
- 15.3 Pricing, Profitability and Cost Optimization
- 15.4 Technology Investment and Product Differentiation
- 15.5 Supply Chain Localization and Resilience
- 15.6 Distribution and Customer Acquisition
- 15.7 Partnership, Acquisition and Capacity Strategy
- 15.8 Regional Expansion Priorities
- 15.9 Short-, Medium- and Long-Term Actions
Chapter 16 Competition Outlook
- 16.1 Industry Competition Characteristics
- 16.2 Market Structure and Concentration
- 16.3 Market Share and Competitive Positioning, 2025
- 16.4 Company-Wise Revenue and Product Benchmarking
- 16.5 Production and Service Capacity Benchmarking
- 16.6 Technology, Pricing and Differentiation
- 16.7 Regional Footprint and Distribution Strength
- 16.8 Mergers, Acquisitions and Strategic Alliances
- 16.9 New Entrants and Competitive Threats
- 16.10 Porter's Five Forces and Industry Attractiveness
- 16.11 Competitive Outlook, 2025-2035
Chapter 17 Company Profiles
- 17.1 Company Coverage and Selection Criteria
- 17.2 CherishX
- 17.2.1 Business Description
- 17.2.2 Company Ownership and Geographic Presence
- 17.2.3 Product and Service Portfolio
- 17.2.4 Manufacturing and Operating Footprint
- 17.2.5 Financial Performance and Investment
- 17.2.6 Market Share and Competitive Position
- 17.2.7 Technology and Innovation Capabilities
- 17.2.8 Strategic Alliances or Partnerships
- 17.2.9 Recent Developments
- 17.2.10 Growth Strategy and Outlook
- 17.3 Ferns N Petals
- 17.4 Timezone
- 17.5 Landmark Leisure (Fun City, Fun Block)
- 17.6 SkyJumper
- 17.7 Bakingo
- 17.8 7eventzz
- 17.9 Other Relevant Market Participants
Note: Every listed company is profiled on the structure shown under the first company. The company list is preliminary and may change based on research findings, market developments, data availability and client requirements.
Chapter 18 Disclaimer
- 18.1 Research and Forecast Disclaimer
- 18.2 Data Source and Estimation Limitations
Note: The depth of individual sections depends on data availability for this market. Volume, capacity, trade and other unit-based metrics are included where applicable.

