
Weddings fund the venues while corporate dates smooth them
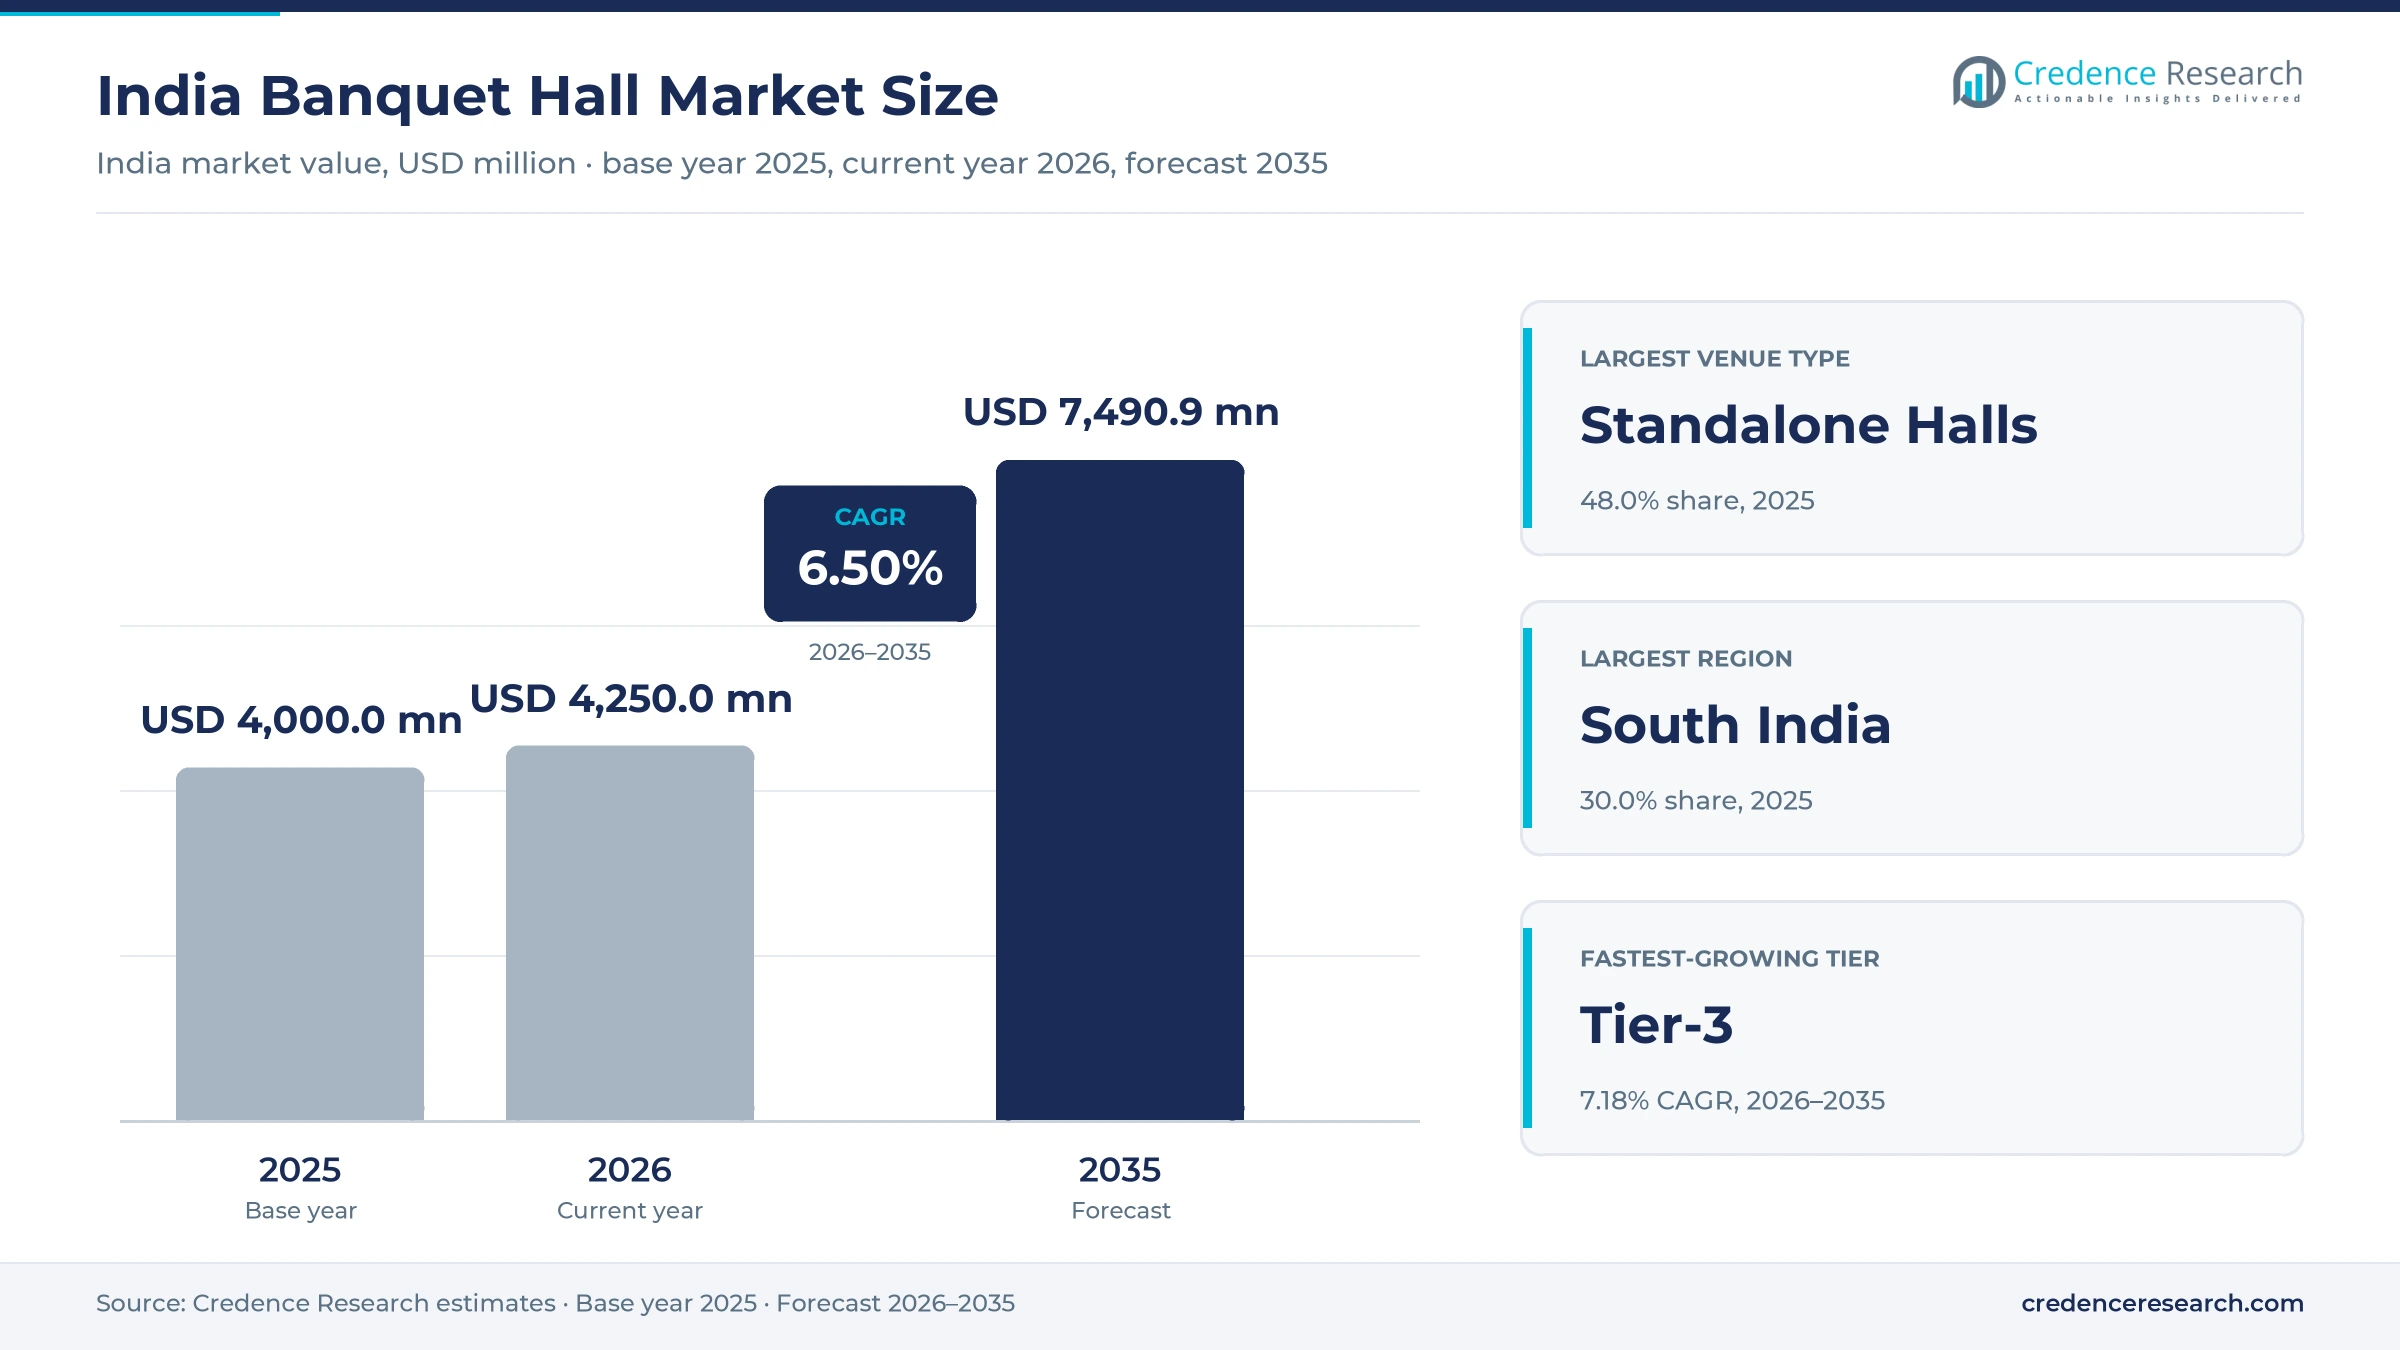
The India banquet hall market was valued at USD 4.00 billion in 2025 and is projected to increase from USD 4.25 billion in 2026 to USD 7.49 billion by 2035, registering a CAGR of 6.50% during 2026–2035. Demand rests on family weddings, receptions, corporate meetings and milestone parties, for which hosts rent a hall, hotel ballroom or lawn and usually buy food and event services with it. South India held the largest regional share, 30.0% in 2025, narrowly ahead of North India because of its dense mix of marriage halls, convention hotels and technology-sector corporate demand. Northeast India is the fastest-growing region at 6.89% a year, from a small base, as branded hotels with function space arrive in cities such as Guwahati. Commercially, the most important change is the move of hotel development into smaller cities, where new properties commonly open with banquet rooms and compete directly with independent hall owners for local bookings.
What counts as banquet hall revenue in India, and who pays it?
The market counts venue rental and in-house event packages paid to hotel banquets, standalone halls and farmhouses and lawns for weddings, corporate functions and social events. Hosts usually buy a date and a guest minimum, often priced per plate, with decoration and planning added by the venue or by outside vendors.
Independent catering contracts for off-premises events, exhibition centers sold by the square meter, room nights and travel are excluded. The value chain runs from landowners and hotel owners through venue operators and online booking platforms to families, companies and event planners, who together decide which dates fill.
India Banquet Hall Market Insights
- The market grows from USD 4.00 billion in 2025 to USD 7.49 billion by 2035, a 6.50% CAGR that rests on venue pricing, smaller-city capacity and corporate dates.
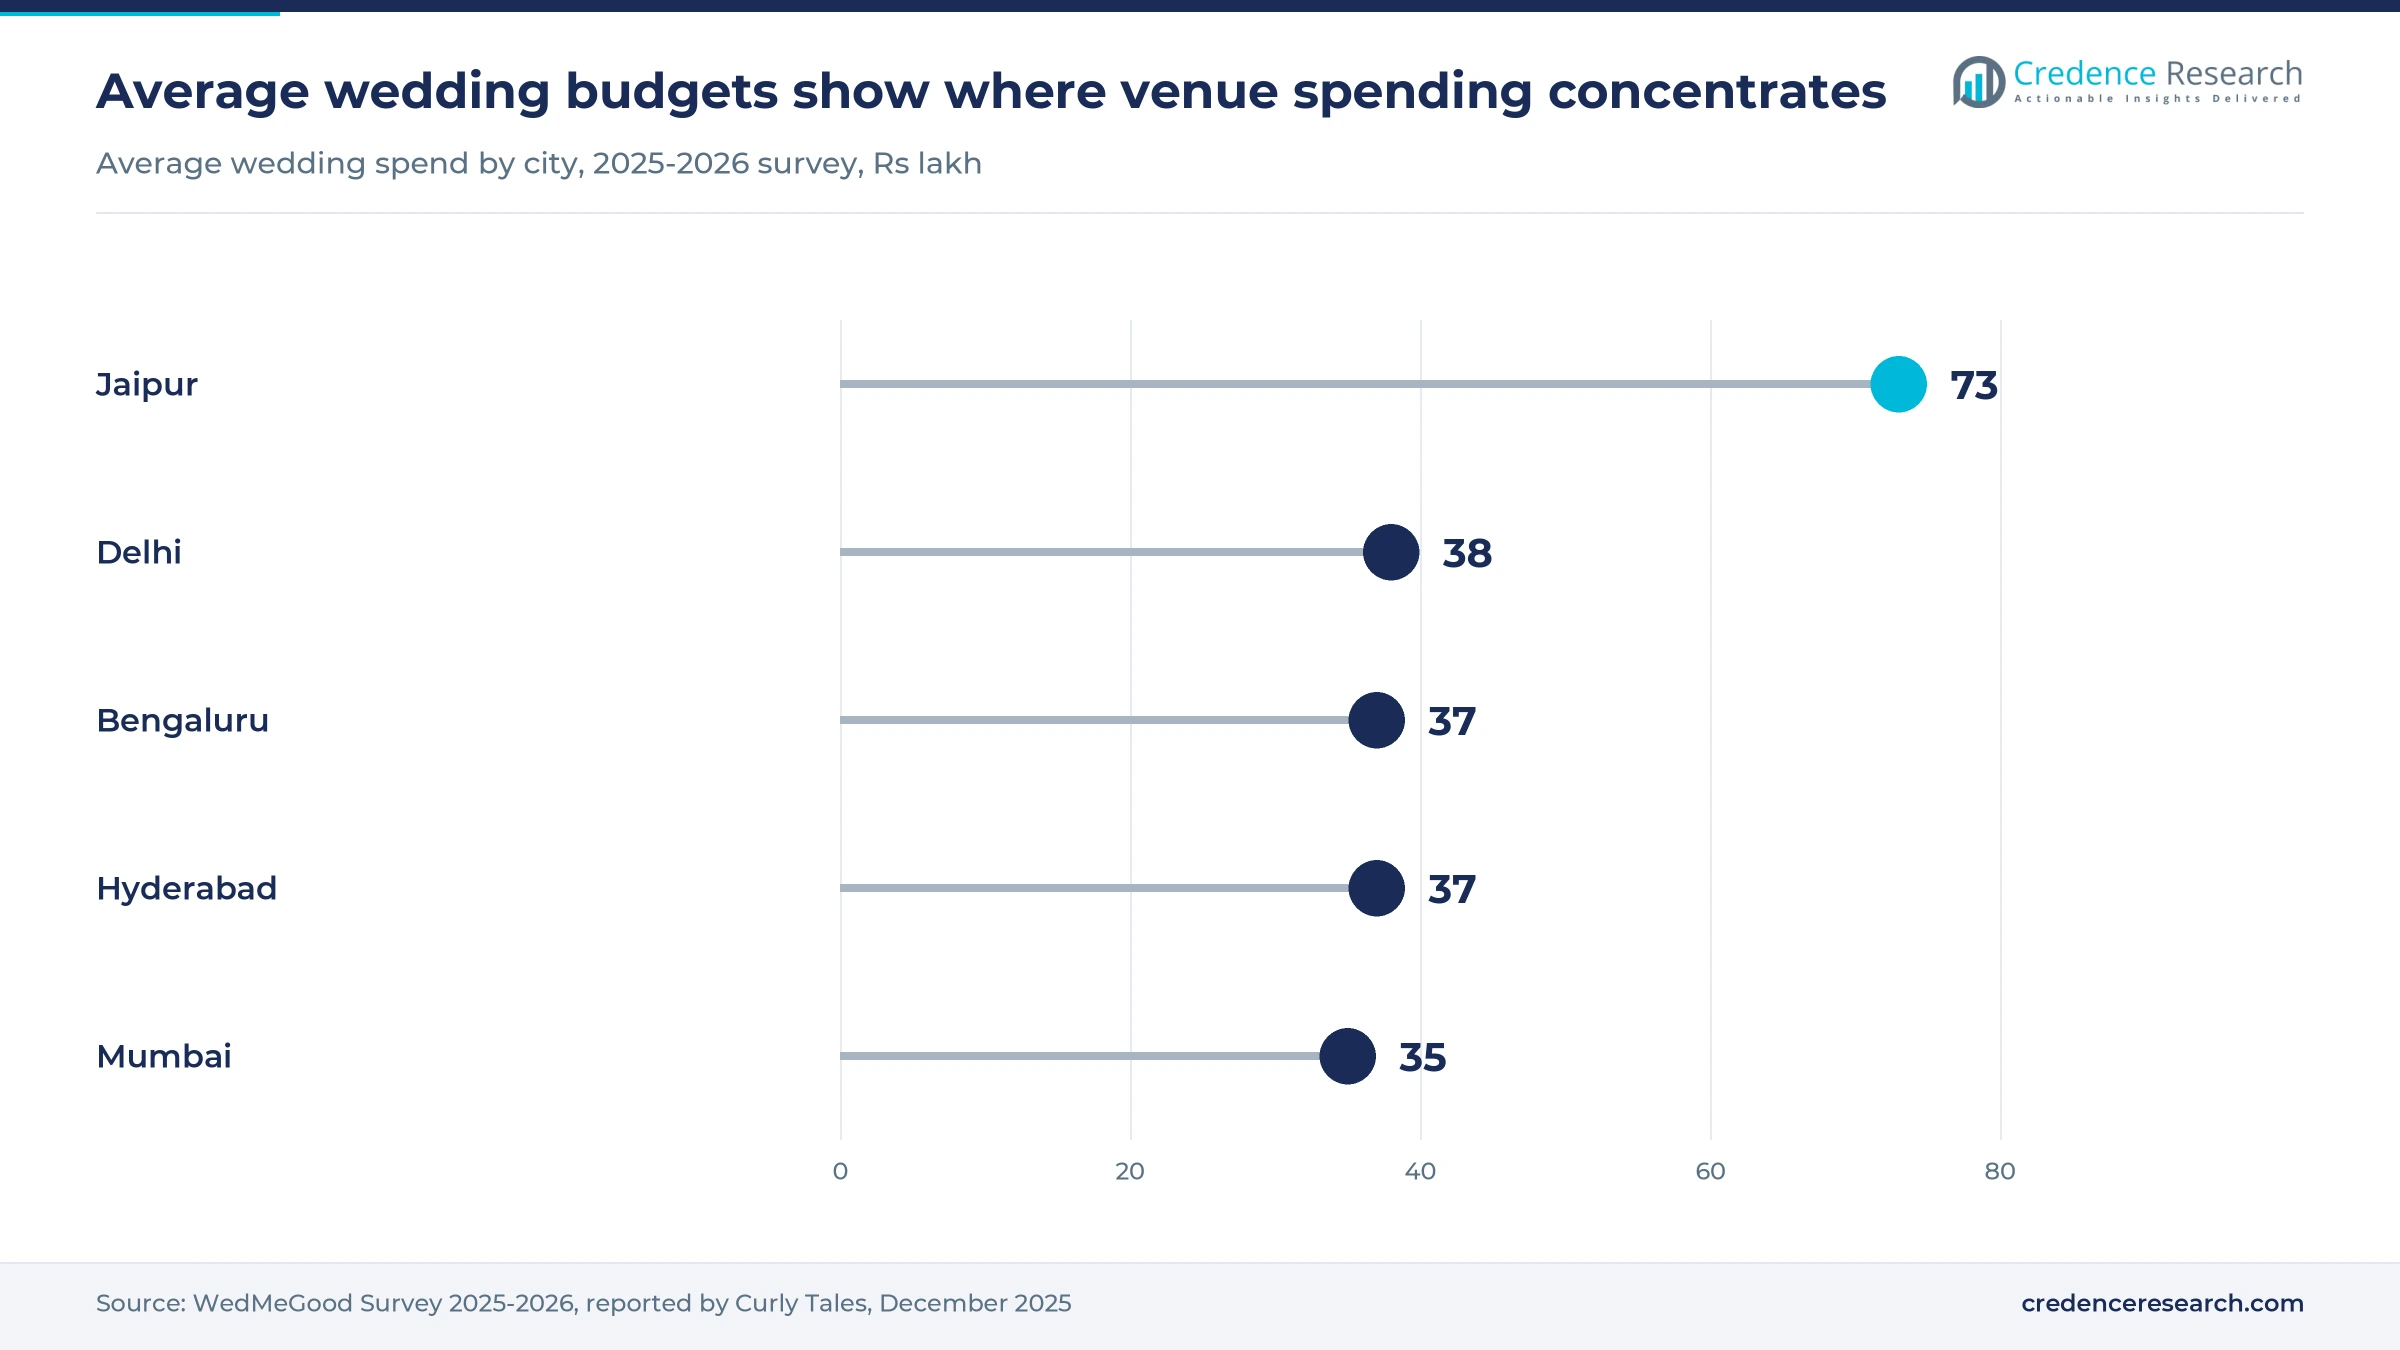
- South India led with 30.0% of 2025 value, supported by Bengaluru and Hyderabad, where average wedding budgets reached Rs 37 lakh in a WedMeGood survey of 2,000 couples.
- Standalone Halls held 48.0% of 2025 value, because most family functions are held in local halls that price well below the five-star hotels of the metros.
- The central government capped commercial LPG supply at 20% of average monthly volumes on March 12, 2026, which exposed how dependent banquet kitchens are on a single fuel.
- HVS Anarock counted record 2025 signings of 64,118 hotel keys across 586 properties, so hotel function space will keep pressing on independent venues in smaller cities.
Standalone halls lead as hotels gain on bundled events
Why standalone halls carry the largest share of venue value
Based on venue, the market is categorized into hotel banquets, standalone halls and farmhouses and lawns. Standalone Halls led with 48.0% of 2025 value because the online platform Mandap alone advertises 50,000 venues, a scale of local supply that no hotel group approaches. Hotel Banquets grow fastest at 7.17% a year, as ITC Hotels reported in January 2026 that banqueting led an 8% rise in food and beverage income. Farmhouses and lawns remain a Delhi-region staple, where FNP Venues markets Shagun Farm in New Delhi for weddings and events, although outdoor sites face tighter local scrutiny.
How weddings set the calendar and corporate dates fill the gaps
Based on event, the market is categorized into weddings, corporate and social functions. Weddings led with 62.0% of 2025 value because the Confederation of All India Traders estimated about 4.6 million weddings between Nov. 1 and Dec. 14, 2025, in one season. Corporate events grow fastest at 7.18% a year, as conference venues add scale, and the general manager of Novotel Hyderabad Convention Centre told Travel Trade Journal in September 2025 that more than 75% of revenue is MICE-driven. Social functions such as anniversaries and birthdays fill smaller rooms on dates that weddings leave open.
Where smaller cities are adding bookings faster than metros
Based on city tier, the market is categorized into metro, tier-2 and tier-3 cities. Metro cities led with 46.0% of 2025 value because rates are highest there, and WedMeGood put average wedding budgets at Rs 38 lakh in Delhi and Rs 35 lakh in Mumbai in its 2025-2026 survey. Tier-3 cities grow fastest at 7.18% a year, as HVS Anarock found that tier-3 and tier-4 locations took 45.4% of branded hotel keys signed in the 11 months to November 2025. Many of those hotels are planned with function rooms that serve local families.
| Segment Group | Leading Sub-segment | Share, 2025 | Fastest-growing Sub-segment | CAGR, 2026–2035 |
|---|---|---|---|---|
| By Venue | Standalone Halls | 48.0% | Hotel Banquets | 7.17% |
| By Event | Weddings | 62.0% | Corporate | 7.18% |
| By City Tier | Metro | 46.0% | Tier-3 | 7.18% |
Request a Free Sample
Fill in your details and we'll send you a free sample report.
- Sample data tables & charts
- Research methodology
Wedding spend and hotel supply set the growth pace
Urban social events and weddings sustain banquet occupancy
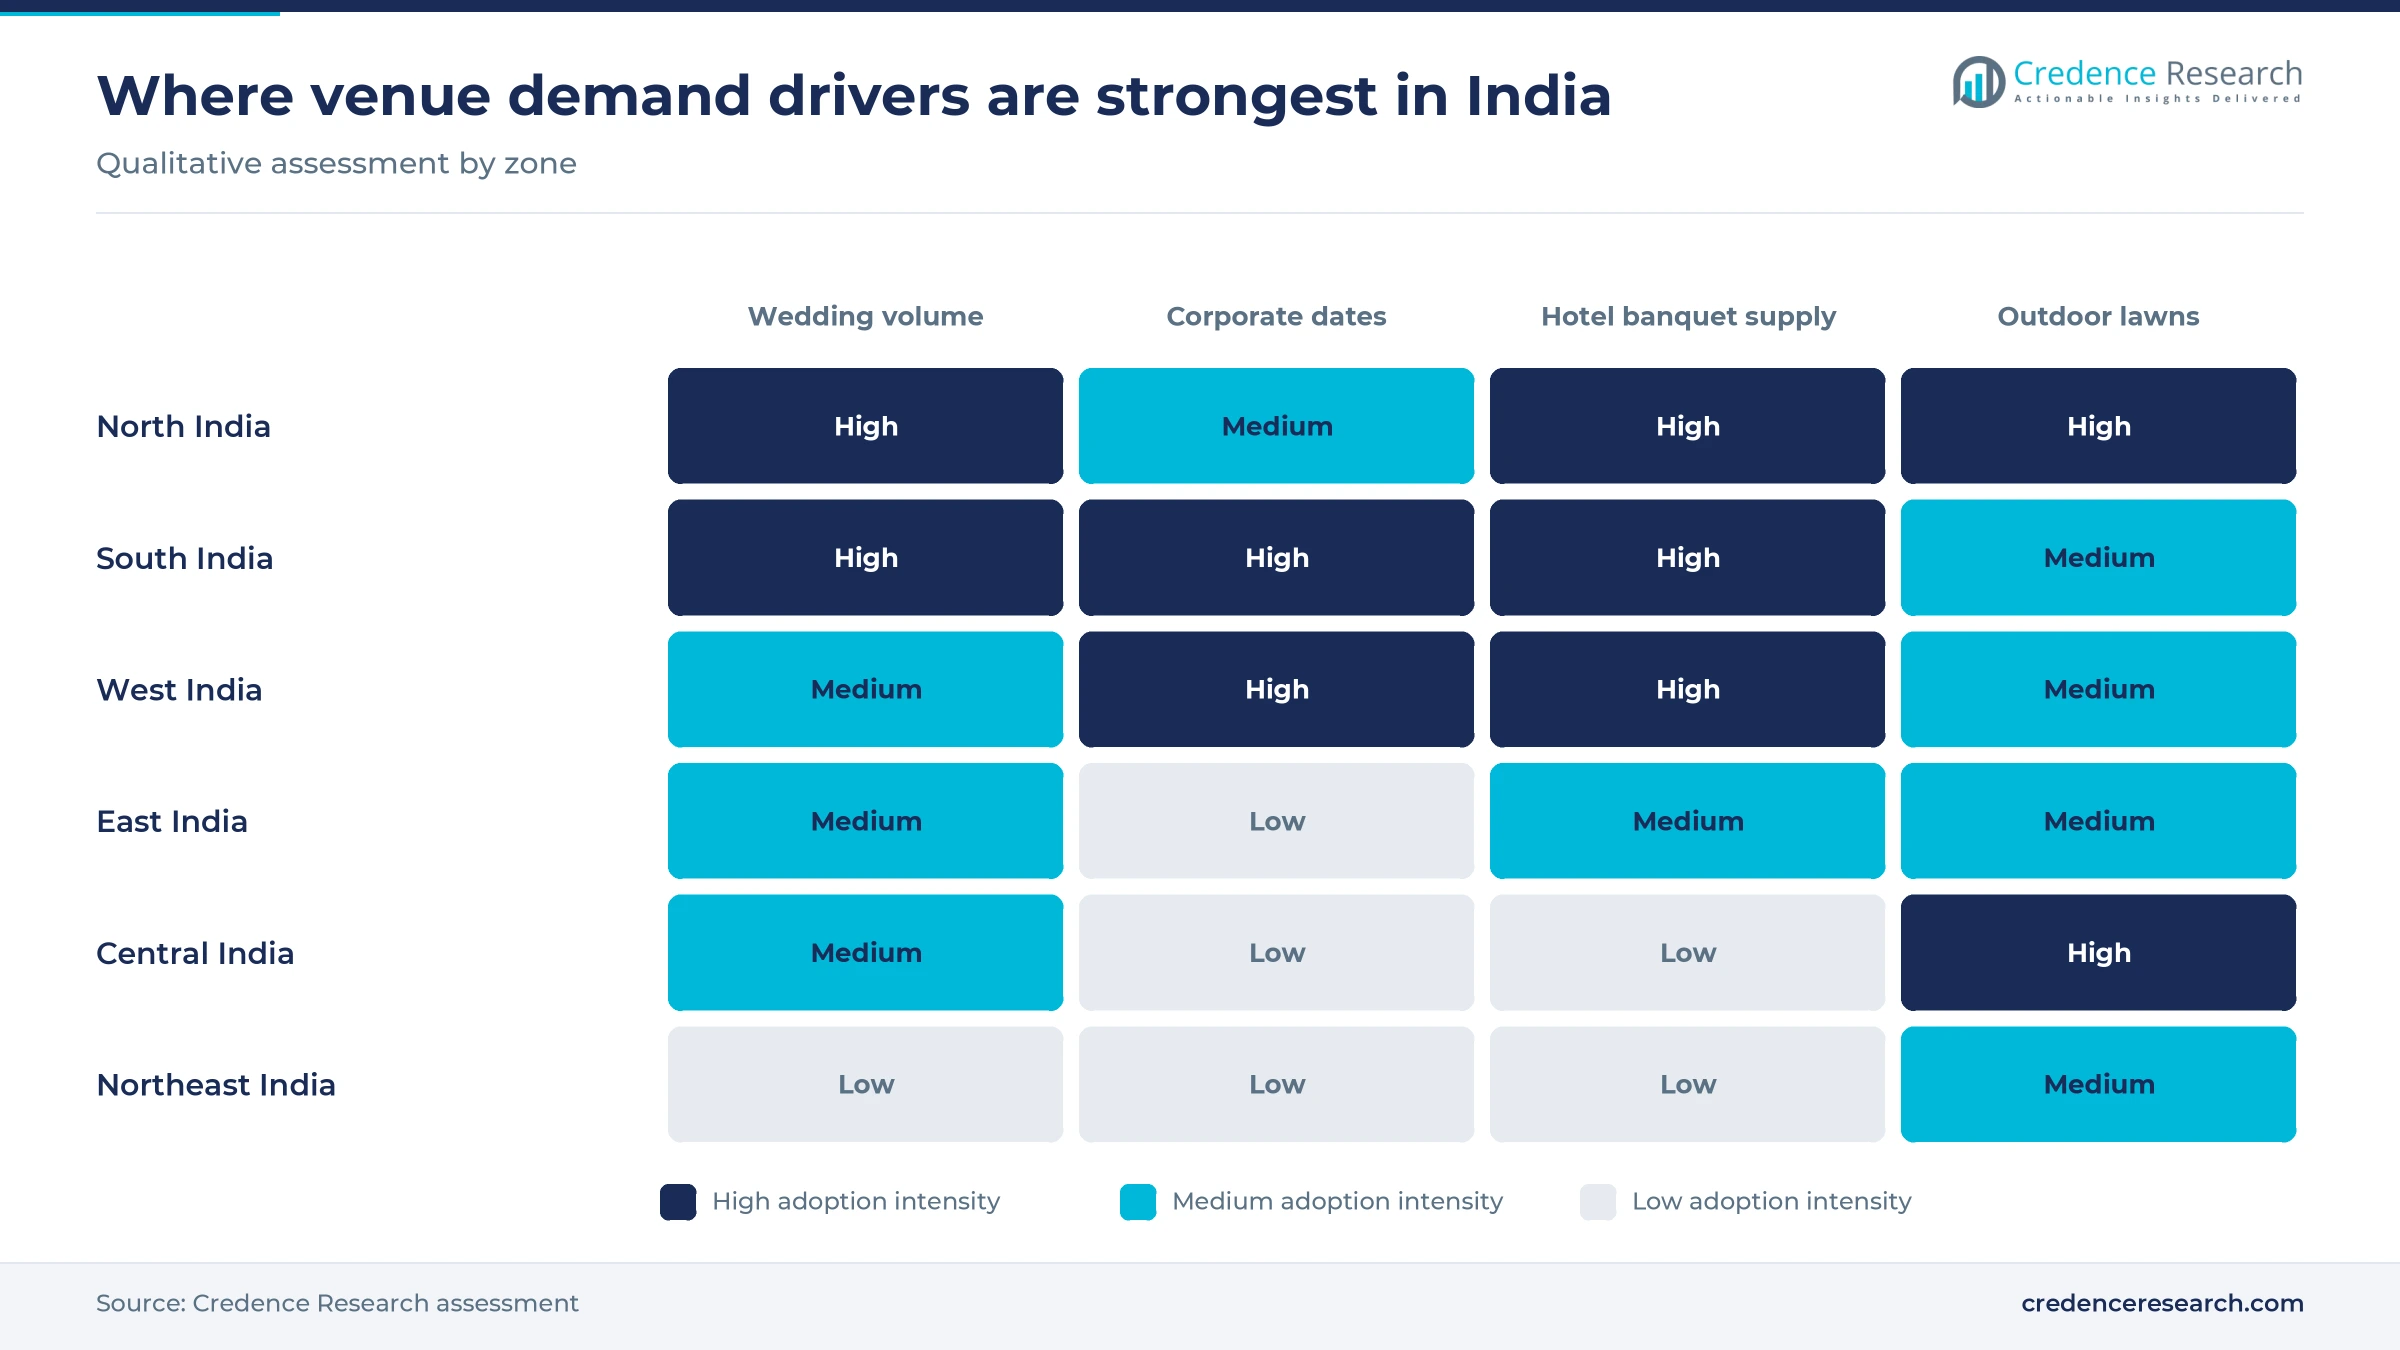
Urban households increasingly hold functions in rented venues because homes and neighborhoods cannot seat a typical guest list. World Bank data show India's urban population reached about 522 million in 2025, or 35.7% of the population, up from about 513 million a year earlier. The Confederation of All India Traders counted about 4.6 million weddings and Rs 6.5 lakh crore of trade in the 2025 season, with Delhi alone accounting for about 480,000 weddings. Business India reported in November 2025 that average weddings host 310 to 330 guests over several ceremonies, so each booking can take more than one room or date. In the Credence Research model this adds about 2.40 percentage points to annual growth to 2035, which makes it the largest single driver.
Premium venues bundle catering and event planning services
Bundling raises revenue per date because hosts prefer one contract covering space, food and decoration. Business India estimated in November 2025 that venue and catering together take about 35% of total wedding costs, which explains why operators add wedding catering and wedding decor to their packages. A survey of 2,000 couples published by IBEF in March 2025 found the average venue cost rose to Rs 6 lakh from Rs 4.7 lakh in 2023, while 31% of couples would pay more than Rs 10 lakh. Marriott sells this model under Shaadi by Marriott, and Radisson uses The Art of Weddings. In the Credence Research model bundling adds about 1.76 percentage points to annual growth to 2035.
Expansion into tier-2 cities adds capacity and booking volume
Hotel development is moving toward smaller cities, and new properties there usually open with function space that serves local weddings. HVS Anarock reported that 45.4% of branded keys signed in the 11 months to November 2025 were in tier-3 and tier-4 locations, with tier-2 cities taking another 28.3%. Business India quoted IHCL as saying these markets make up over 70% of its pipeline, and IHCL reported 255 hotels in that pipeline in May 2026. Lemon Tree Hotels announced signings in Raipur and Jalandhar on April 23, 2026, and each includes a banquet hall for local demand. In the Credence Research model this expansion adds about 1.30 percentage points to annual growth to 2035.
Corporate meetings and conferences fill weekday calendars
Corporate demand lifts yield because companies book weekdays that families usually leave empty, and conference and incentive travel now shapes where large function space is built. ITC Hotels cited MICE alongside corporate travel for its 12% rise in room income in the December 2025 quarter, according to Storyboard18. IHCL chief Puneet Chhatwal told Business Standard on Nov. 5, 2025, that weddings and MICE would drive 10% to 12% growth in that quarter. Skift reported in January 2026 that ITC Hotels had leased a 3,600-square-meter plot at Yashobhoomi in Delhi for a five-star hotel with banqueting. These commitments help explain why Corporate events lead growth across event types.
Convention formats and state wedding drives open new room
Shift toward large convention-style hotels and halls
Larger formats are gaining ground because a single site can host a wedding, a conference and a product launch across its rooms. Travel Trade Journal reported in September 2025 that The Leela Ambience Convention Hotel in Delhi has 83,228 square feet of indoor space, while The Leela Bhartiya City in Bengaluru offers 66,000 square feet. Hilton Bengaluru Embassy Manyata has more than 60,000 square feet and 22 breakout rooms, which suits split corporate demand. Independent operators are responding too, and ExpoInn Suites & Convention lists a 230,000-square-foot hall, a 190,000-square-foot lawn and 15 halls. As a result, the largest functions increasingly concentrate in a small group of purpose-built sites near metros.
Rise of online venue search and comparison in smaller cities
Venue discovery is moving online, which gives independent halls wider reach and makes their prices easier to compare. HVS reported in August 2023 that online searches for wedding banquet halls rose 28% in 2022, while searches in tier-2 cities rose at least 33%. Mandap, the Matrimony.com service, now advertises 50,000 venues with live date availability and free expert support. VenueLook lists wedding, engagement, birthday and corporate venues, which shows how platforms now cover the full event mix. However, writer Dhairya Chheda argued on Substack in January 2025 that the industry remains fragmented and unorganized, so listings have not yet produced a dominant national brand and most halls still sell directly to local families.
Opportunity in state-run resorts and heritage wedding sites
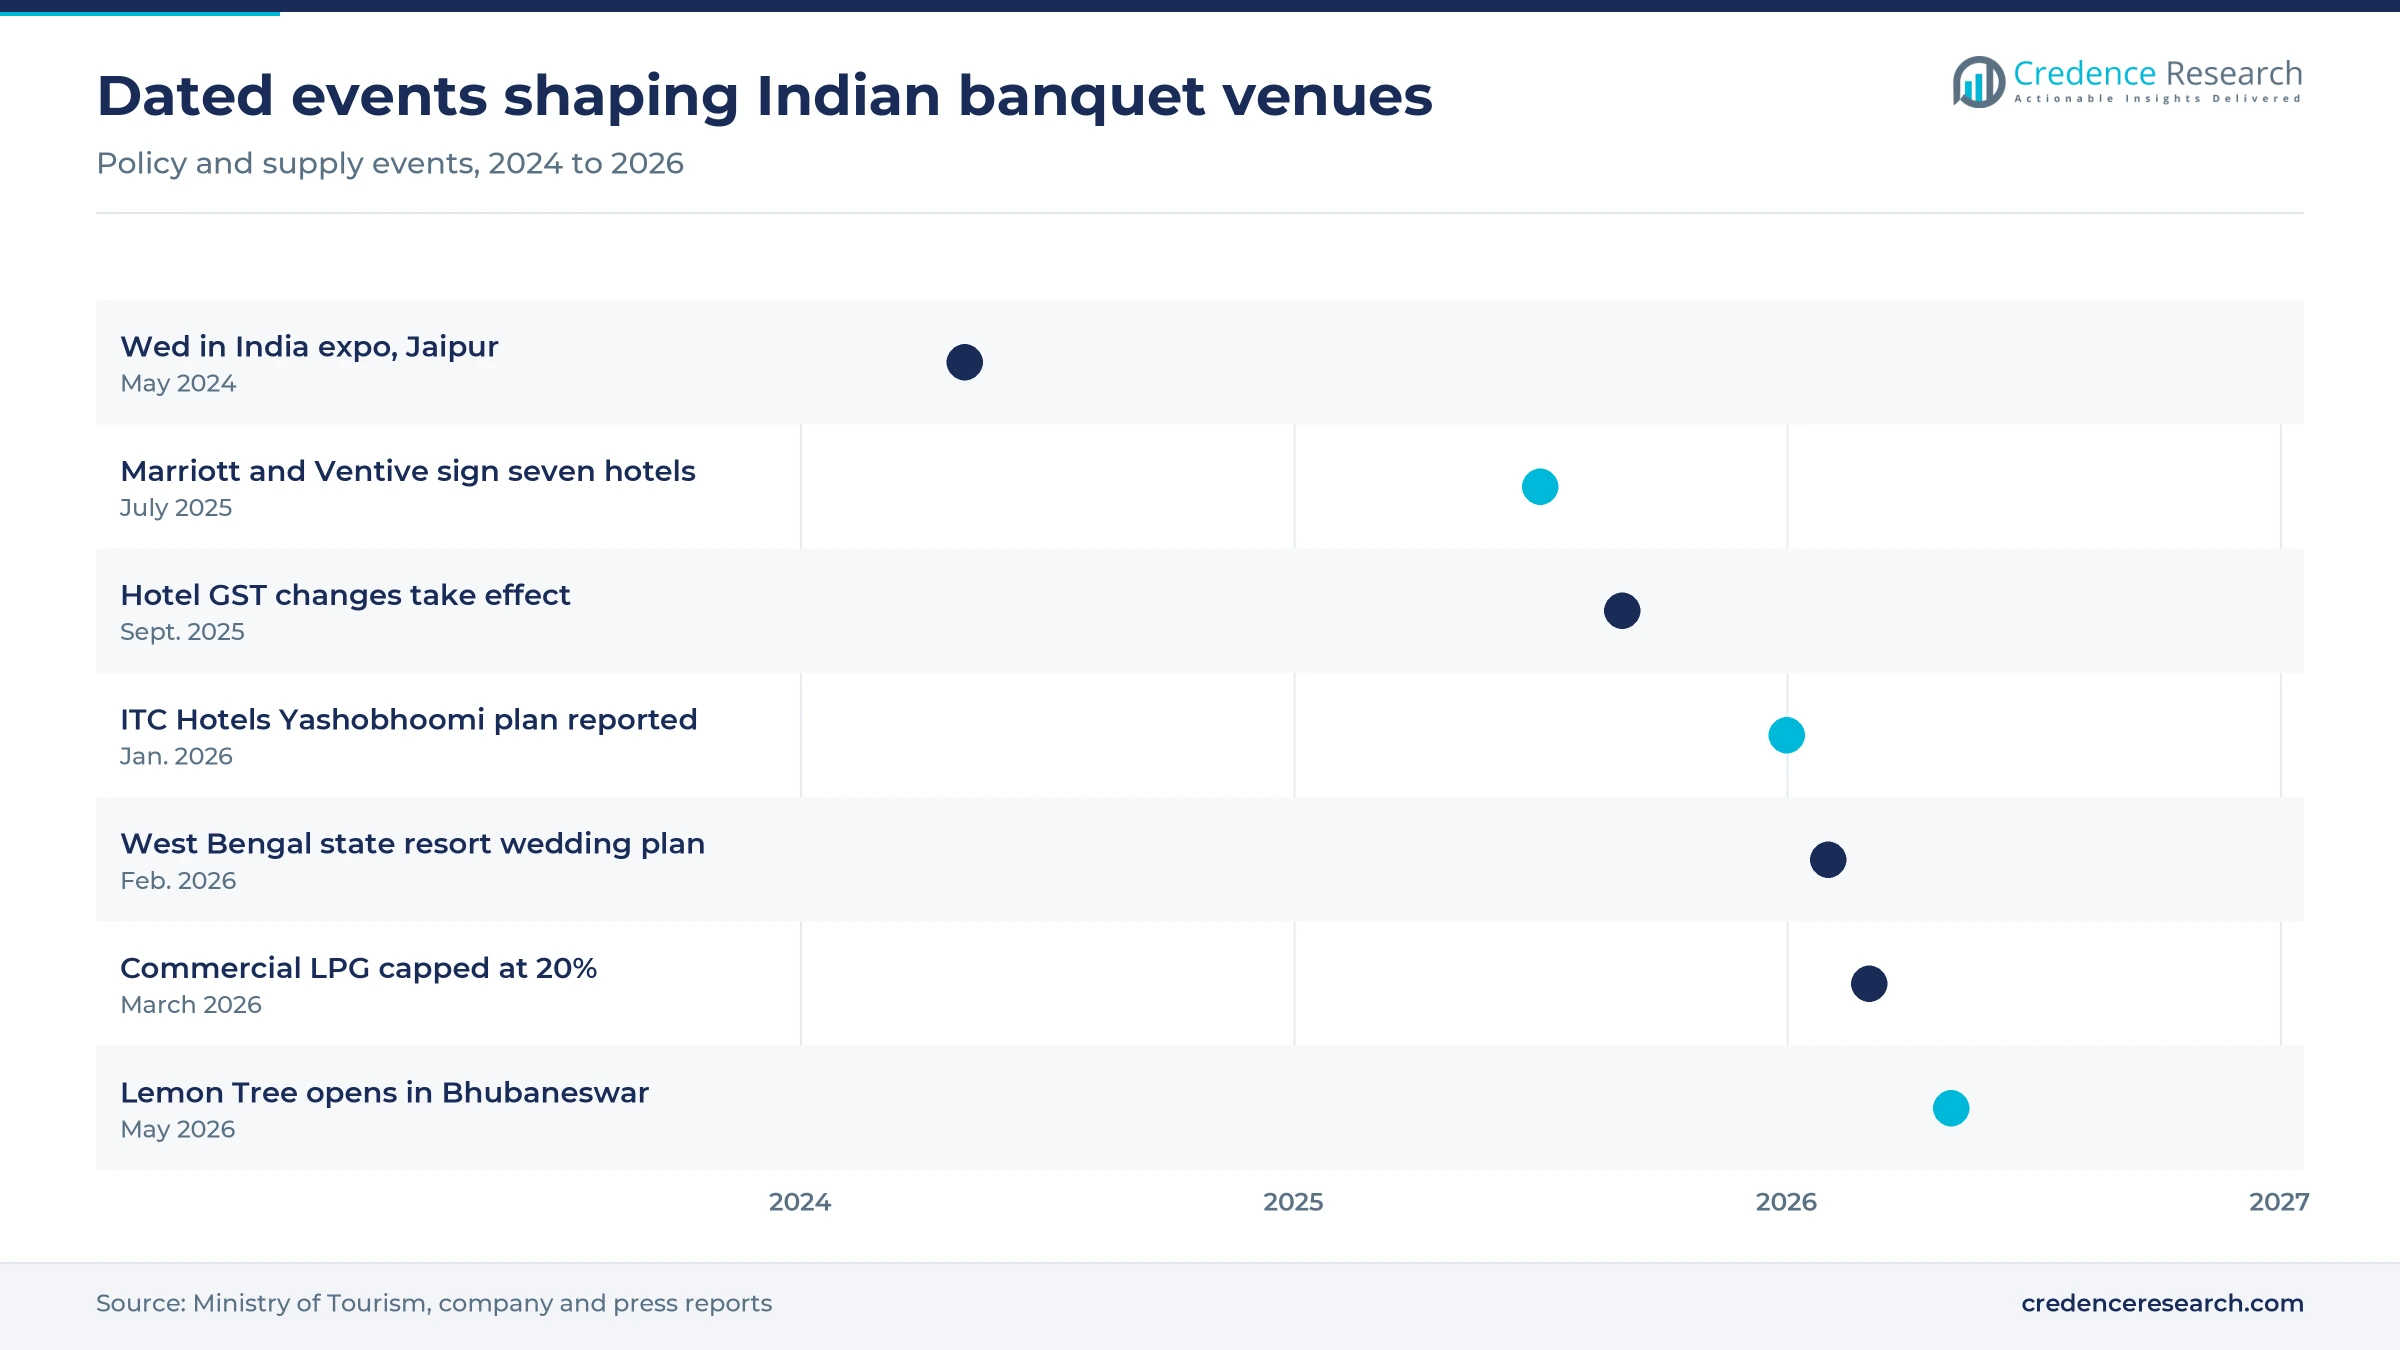
State tourism departments are opening new supply, which creates room for private operators. West Bengal officials said in February 2026 that about 40 state-run resorts would host middle-class destination weddings, with modern banquet halls added before the next winter season. Metro Vaartha reported in October 2025 that Madhya Pradesh is upgrading Khajuraho, Mandu, Orchha and Maheshwar as wedding sites. Karnataka officials are mapping forts and other venues, with Chitradurga under study, according to a December 2025 Visit in Rajasthan report. Telangana launched Wed in Telangana, and its events chamber is seeking permission for functions after 11 p.m., according to Deccan Chronicle in September 2025. Travel Trade Journal also cited a Rs 25 crore Jodhpur MICE Centre in Rajasthan. Operators with event experience can bid early for these sites.
Opportunity to win weddings that now go overseas
Weddings held abroad represent spending that Indian venues could capture, and government messaging now favors that shift. Business India estimated in November 2025 that Indians spend about Rs 1 lakh crore a year on overseas weddings. Prime Minister Narendra Modi again urged families in Vadodara on May 12, 2026, to marry in India and proposed the Statue of Unity as a venue. The Ministry of Tourism told Parliament in March 2025 about its India Says I Do campaign and the Wed in India expo held in Jaipur on May 5, 2024. WedMeGood found that nearly 90% of destination weddings already stay in India, so venues with rooms and large halls start with a demand advantage.
Fuel, noise, licensing and seasonality squeeze operators
Dependence on commercial LPG exposes banquet kitchens
Kitchens rely heavily on cylinders, and supply can fail quickly. The central government capped commercial LPG at 20% of average monthly supply on March 12, 2026, according to Down To Earth, and one manager told Business Today that the venue held only four to five days of LPG stock and might refuse bookings. Free Press Journal reported commercial cylinders at Rs 3,074 in Bhopal and Rs 3,296 in Gwalior. Thin-margin halls suffer most, so operators are reviewing backup systems and commercial kitchen equipment that can run on other fuels.
Noise enforcement limits late functions at urban venues
Noise rules constrain late events because many halls sit close to housing. After a Jan. 5, 2024, inspection in Delhi, the pollution control committee recorded 76.4 decibels at one hall against a 65-decibel daytime limit, and it fined two halls Rs 60,000 and Rs 10,000, according to Everything Experiential. Repeat complaints can bring tribunal scrutiny and lost dates for the venues involved. As a result, operators are investing in acoustic work, earlier finishes and indoor rooms for music.
Licensing drives can close marriage gardens at short notice
Licensing remains a real risk for lawn and garden venues, many of which grew up without complete approvals. Bhopal Municipal Corporation sealed 17 marriage gardens in May 2025 for operating without valid licenses and adequate safety arrangements, according to The Hitavada. Hosts with advance bookings face disruption when a site closes during the season. Owners therefore need to regularize licenses and safety measures, which raises fixed costs for smaller farmhouses and lawn operators.
Seasonal wedding dates leave halls empty for long stretches
Demand clusters around auspicious dates, which leaves many rooms idle in other months and limits annual yield. HVS reported in August 2023 that 45% of wedding banquet demand in online searches fell between February and May, and the 2025 national season counted by traders ran only about six weeks. Standalone halls feel this most because they lack room income. Operators respond with weekday corporate rates, smaller social packages and early deposits, although those measures rarely close the gap entirely.
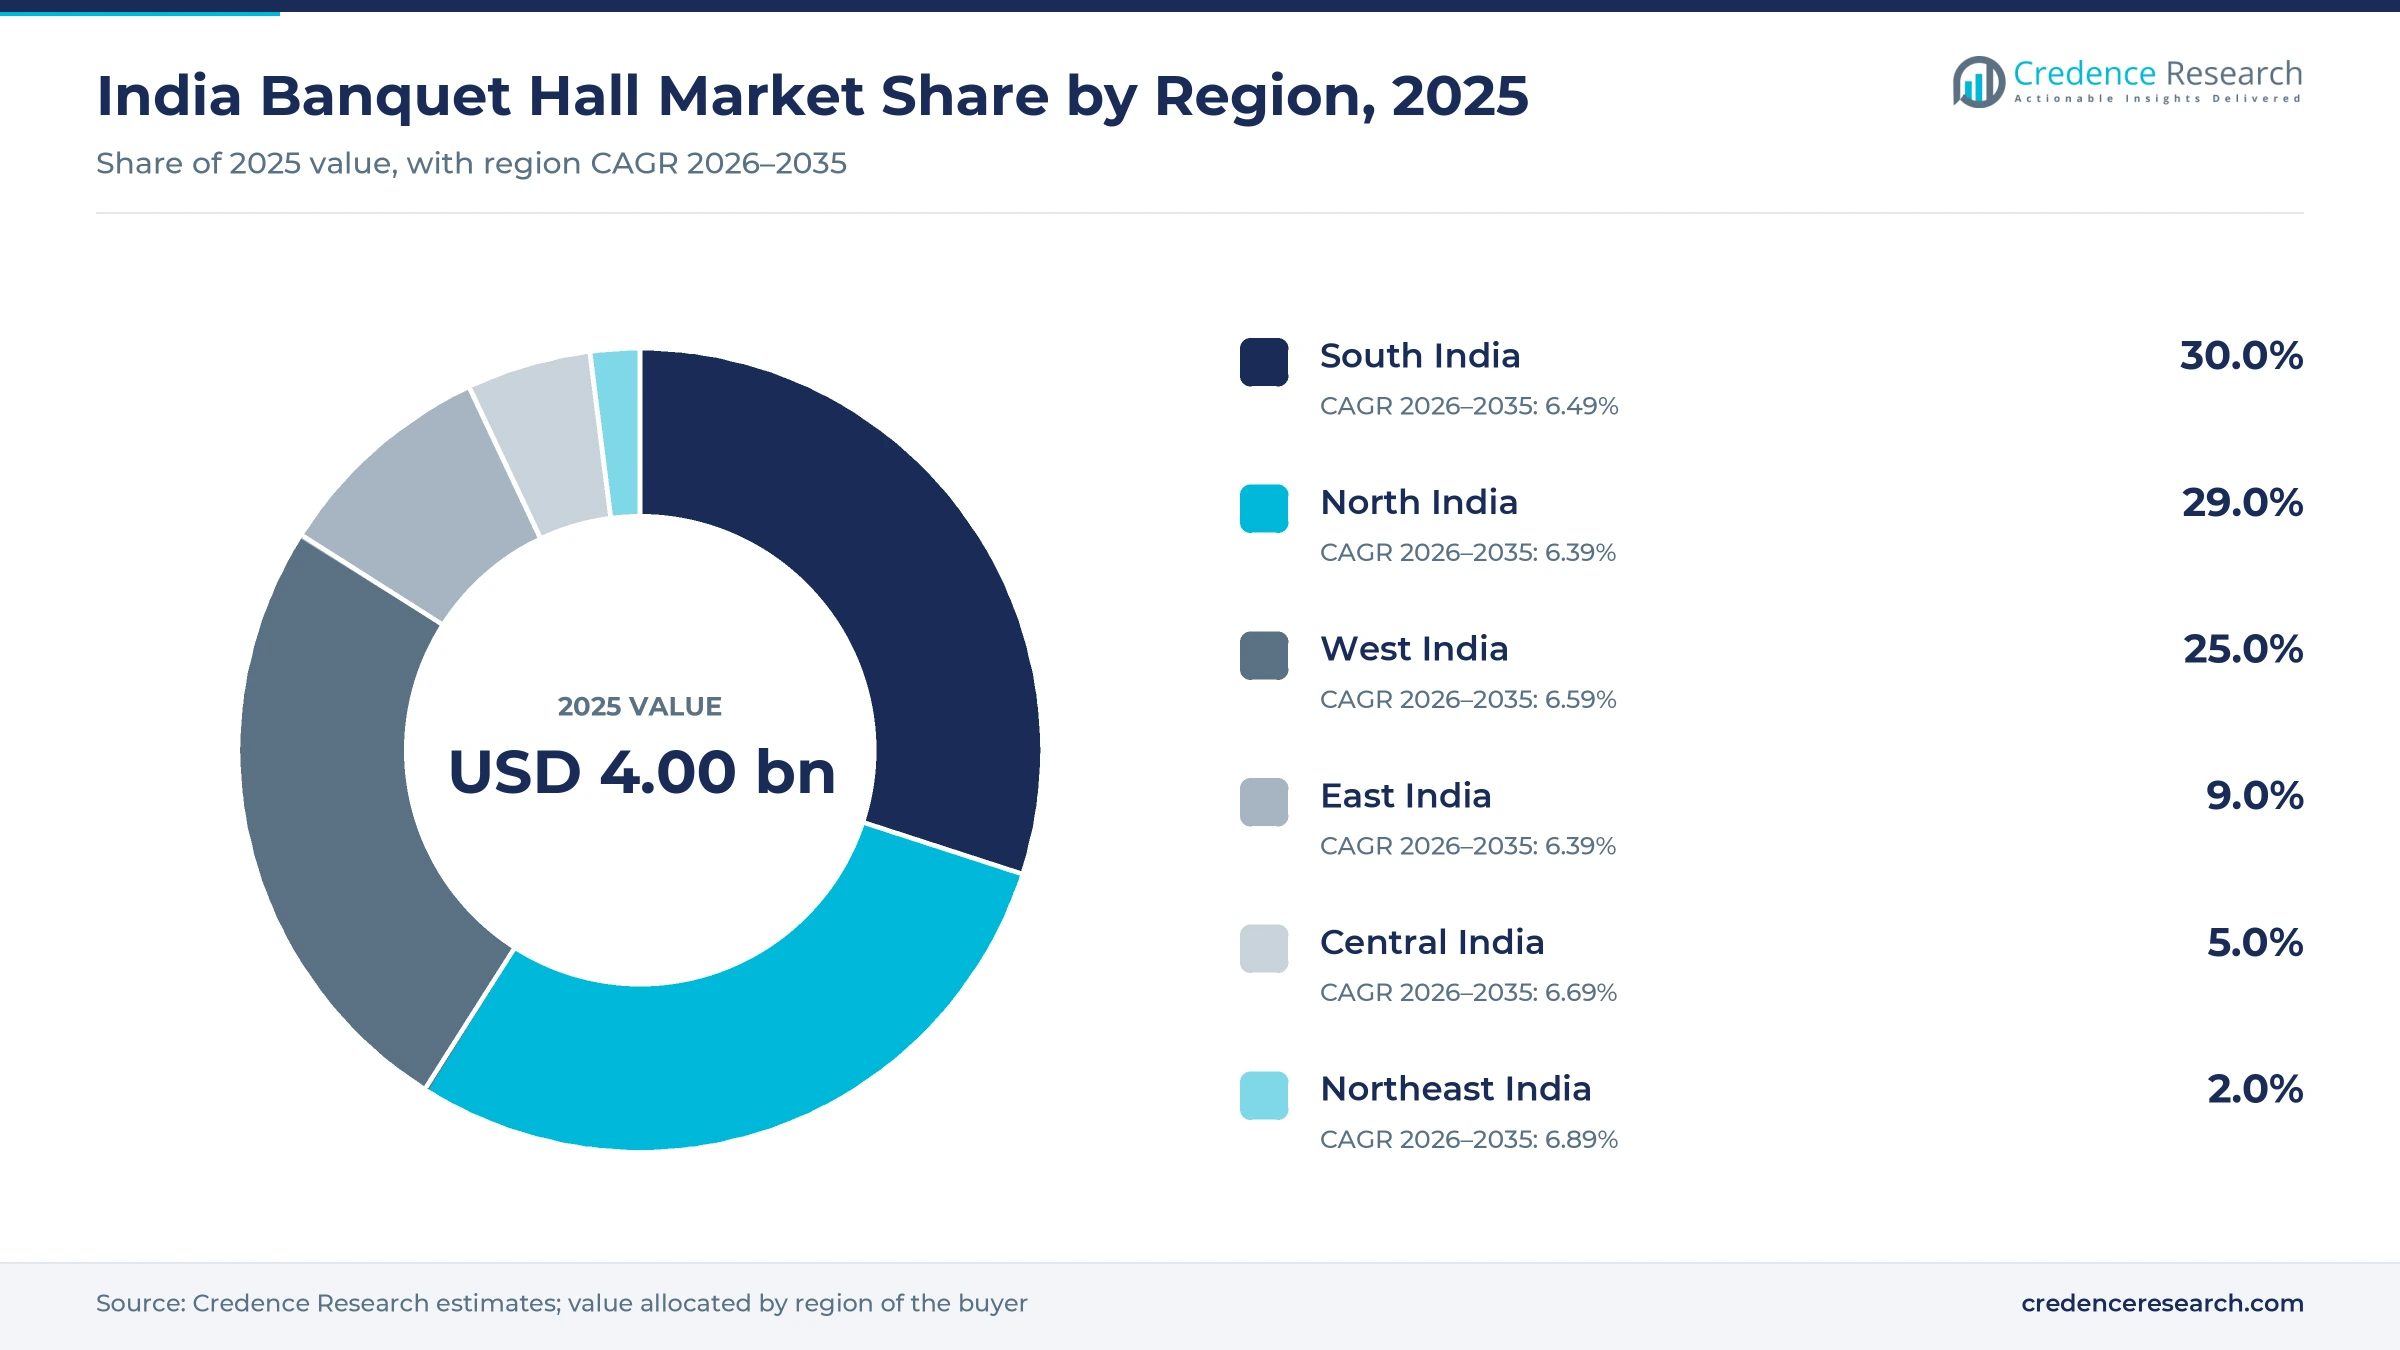
South India edges North India on value across six zones
| Region | Value, 2025 (USD billion) | Share, 2025 | CAGR, 2026–2035 |
|---|---|---|---|
| South India | 1.20 | 30.0% | 6.49% |
| North India | 1.16 | 29.0% | 6.39% |
| West India | 1.00 | 25.0% | 6.59% |
| East India | 0.36 | 9.0% | 6.39% |
| Central India | 0.20 | 5.0% | 6.69% |
| Northeast India | 0.08 | 2.0% | 6.89% |
South India leads on halls, hotels and corporate demand
South India held 30.0% of 2025 value and grows at 6.49% a year, supported by a deep base of marriage halls and convention hotels. HVS Anarock reported that average room rates rose 30% to 32% in Hyderabad and 22% to 24% in Bengaluru in November 2025, which points to strong event-season pricing. The traders' confederation also singled out Karnataka for strong growth in banquet services during the 2025 season, and Kerala Travel Mart has promoted nine destinations through its Wedding and MICE Conclave.
North India rests on Delhi and the Rajasthan wedding circuit
North India held 29.0% of 2025 value and grows at 6.39% a year, a slightly slower pace because its largest venue clusters are already mature. The traders' confederation counted about 480,000 weddings and Rs 1.8 lakh crore of trade in Delhi during the 2025 season. WedMeGood put the average budget in Jaipur at Rs 73 lakh, the highest among surveyed cities. Business Today reported in July 2025 that the 327-key Fairmont Udaipur Palace opened with 140,000 square feet of event space aimed at large Indian weddings.
West India blends Mumbai corporate dates with Maharashtra weddings
West India held 25.0% of 2025 value and grows at 6.59% a year, helped by corporate functions in Mumbai and Pune and by large Gujarat venues. The traders' confederation named Maharashtra for strong growth in banquet services in 2025. Ventive Hospitality and Marriott signed seven hotels with 1,548 rooms in India and Sri Lanka on July 8, 2025, including sites in Pune, Navi Mumbai and Mundra. Travel Trade Journal lists Mahatma Mandir in Gandhinagar at more than one million square feet for very large gatherings.
East India gets new banquet supply from hotels and the state
East India held 9.0% of 2025 value and grows at 6.39% a year, as lower spending per event keeps its share below the population weight of the zone. Supply is nonetheless improving, and Lemon Tree Hotels opened a 50-room first phase in Bhubaneswar on May 14, 2026, with banquet and conference space. West Bengal also plans wedding use of about 40 state-run resorts in Darjeeling, Kalimpong, Digha and other locations, which would add affordable options by the next winter.
Central India benefits from full venues and a tourism push
Central India held 5.0% of 2025 value and grows at 6.69% a year, from a modest base of marriage gardens and city hotels. The Times of India reported in November 2025 that Madhya Pradesh wedding business could pass Rs 40,000 crore that season, and a state hotel association chairman said venues were operating near full capacity. Lemon Tree's 78-room signing in Raipur adds a banquet hall in Chhattisgarh, while Bhopal has also tightened licensing for marriage gardens.
Northeast India starts small but gains branded function space
Northeast India held 2.0% of 2025 value and grows fastest at 6.89% a year, although absolute spending remains small compared with other zones. Guwahati is the main hub for the region and the focus of new supply. Lemon Tree Hotels announced a Lemon Tree Premier there in November 2025 with about 300 rooms, 50 serviced apartments, banquet facilities and meeting spaces. A single project of that size can noticeably change the supply of branded function rooms in the city.
Hotel signings and an LPG cap marked the past year
| Development | Status and market relevance |
|---|---|
| In May 2026, Lemon Tree Hotels opened a 50-room first phase in Bhubaneswar with banquet and conference spaces. | Open; a further 15 rooms are planned in the second phase. |
| In April 2026, Lemon Tree Hotels announced signings in Raipur and Jalandhar, each with a banquet hall and a conference room. | Signed; shows function rooms in smaller-city hotel designs. |
| In March 2026, the central government capped commercial LPG supply at 20% of average monthly volumes after the West Asia conflict disrupted imports. | Enforced from March 12; banquet managers warned they might refuse bookings. |
| In February 2026, West Bengal said about 40 state-run resorts would host destination weddings after banquet upgrades. | Planned for the next winter season; private partners were invited. |
| In January 2026, Skift reported that ITC Hotels would build a five-star hotel with banqueting at Yashobhoomi in Delhi. | Land leased; strengthens the capital's convention district. |
Booking tools and flexible halls change venue operations
- Live availability tools let hosts check dates and compare venue photos, pricing and capacity, and Mandap offers them across its listings.
- Divisible halls and breakout rooms allow one site to sell several smaller events on the same date, and the many rooms at ExpoInn and Hilton Bengaluru Embassy Manyata suit that approach.
- Boundary noise monitoring matters because Delhi inspectors measured sound one meter from the boundary wall when they penalized two halls in 2024.
- Backup cooking arrangements gained attention in March 2026, when operators told Business Today they might switch to coal and warned of slower batch cooking.
Need a Custom Version of This Report?
Tailor the scope, geography, or segments to your exact requirements.
- Custom geography or segment scope
- Direct access to our analyst team
Hotel chains chase premium dates in a fragmented trade
Competition is local and fragmented, because most halls are owned by families or small businesses that sell within a single city. Hotel chains compete at the premium end, where IHCL reported 630 hotels in May 2026 and ITC Hotels has attributed food and beverage growth to banqueting. Marriott sells weddings under Shaadi by Marriott, and its Series by Marriott brand reached 75 signings across 43 cities within six months of its debut. Lemon Tree Hotels is taking banquet rooms into cities such as Raipur, Jalandhar and Guwahati, which brings branded competition to independent owners there. Large independents such as ExpoInn and FNP Venues compete on scale and outdoor space, while VenueLook and Mandap compete for the customer's first search. Prices are set date by date, so operators win through location, parking, kitchen quality and the ability to bundle services.
Companies profiled and their roles in this market
| Company | Type | Role in the market |
|---|---|---|
| Indian Hotels Company (IHCL) | Luxury and upscale hotel group | Reported 630 hotels and 255 in its pipeline in May 2026; its chief cited weddings and MICE as quarterly growth drivers. |
| ITC Hotels | Luxury hotel group | Attributed December 2025 quarter food and beverage growth to banqueting; plans a Yashobhoomi hotel with banqueting. |
| Marriott International | Global hotel group | Sells weddings as Shaadi by Marriott; signed seven hotels with Ventive in July 2025. |
| Lemon Tree Hotels | Domestic hotel group | Signed function-ready hotels in Raipur, Jalandhar and Guwahati, and opened in Bhubaneswar in May 2026. |
| The Leela | Luxury hotel group | Operates convention hotels in Delhi and Bengaluru with 83,228 and 66,000 square feet of event space. |
| ExpoInn Suites & Convention | Independent convention venue | Lists a 230,000-square-foot hall, a 190,000-square-foot lawn and 15 halls. |
| FNP Venues | Independent venue operator | Markets Delhi-region wedding venues, including Shagun Farm in New Delhi. |
| VenueLook | Venue booking platform | Lists banquet halls and party venues for weddings, birthdays and corporate events. |
| Mandap (Matrimony.com) | Venue booking platform | Advertises 50,000 venues with live availability and free booking support. |
Date yield matters more than adding more floor space
Credence Research's view is that the value in this market will be won on date yield rather than on new floor space. Wedding dates are few, so the operators that do best will fill weekdays with corporate and social bookings and will sell food and decoration under one contract. Hotels hold an advantage because their rooms give hosts a complete package, although standalone halls still win on price and on the sheer number of local families. The March 2026 LPG cap also showed that kitchen resilience now belongs in every operator's planning.
How the venue market estimates were built
The report uses 2025 as the base year and 2026 to 2035 as the forecast period. Market values come from the Credence Research model, and segment and regional splits are Credence Research estimates informed by public evidence. Sources include trade body releases, World Bank data, parliamentary replies, company announcements, published surveys and press reports. No interviews or primary surveys were conducted for this particular report.
Smaller cities and corporate dates shape growth to 2035
The market is projected to reach USD 7.49 billion by 2035, with growth of 6.50% a year resting on three things. Smaller cities will keep gaining function space as signed hotels open, and that will press independent halls to improve kitchens, parking and compliance. Corporate events will take a larger share of dates as new convention districts mature around Delhi, Bengaluru and Hyderabad. State wedding campaigns may also bring new heritage and resort venues, but their effect depends on approvals. Fuel supply and local licensing remain the risks most likely to disturb individual seasons.
Frequently Asked Questions
How big is the India banquet hall market?
Which region leads the India banquet hall market?
Which venue type is largest?
Which event type generates the most banquet value?
Why are smaller cities important for banquet venues?
What was the effect of the 2026 LPG cap?
What regulatory risks do venues face?
Who are the main companies in the market?
Table of Content
Chapter 1 Market Segmentation
- 1.1 Segmentation Framework
- 1.1.1 Product and Service Classification
- 1.1.2 Application and End-Use Classification
- 1.1.3 Technology and Solution Classification
- 1.1.4 Customer and Distribution Channel Classification
- 1.1.5 Geographic Segmentation
- 1.1.6 Market Segment Definitions and Boundaries
- 1.2 By Venue
- 1.2.1 Hotel Banquets
- 1.2.2 Standalone Halls
- 1.2.3 Farmhouses & Lawns
- 1.3 By Event
- 1.3.1 Weddings
- 1.3.2 Corporate
- 1.3.3 Social
- 1.4 By City Tier
- 1.4.1 Metro
- 1.4.2 Tier-2
- 1.4.3 Tier-3
Chapter 2 Introduction
- 2.1 Report Objectives and Scope
- 2.2 Product Definition and Industry Terminology
- 2.3 Market Inclusions and Exclusions
- 2.4 Research Process
- 2.4.1 Primary Research and Expert Interviews
- 2.4.2 Secondary Research and Source Review
- 2.4.3 Top-Down and Bottom-Up Estimation
- 2.4.4 Data Triangulation and Verification
- 2.5 Market Size Measurement Basis
- 2.5.1 2025: USD 4.00 billion → 2035: USD 7.49 billion
- 2.6 Historical and Forecast Reference Periods
- 2.6.1 Historical Period: 2018-2025
- 2.6.2 Base Year: 2025
- 2.6.3 Forecast Period: 2025-2035
- 2.7 Research Assumptions and Limitations
Chapter 3 Executive Summary
- 3.1 Market Snapshot and Key Findings
- 3.2 Base-Year Market Size, 2025
- 3.3 Forecast Market Size, 2035
- 3.4 Revenue and Volume Growth Outlook
- 3.5 Key Demand and Supply Indicators
- 3.6 Leading Market Segments
- 3.7 Fastest-Growing Market Opportunities
- 3.8 Regional Performance Highlights
- 3.9 Technology and Industry Transformation
- 3.10 Competitive Landscape Summary
- 3.11 Analyst View and Strategic Implications
Chapter 4 India Banquet Hall Market Trends and Developments
- 4.1 Historical Industry Development, 2018-2025
- 4.2 Recent Market Trends and Developments
- 4.3 Demand and Customer Behavior Trends
- 4.4 Technology and Product Innovation
- 4.5 Artificial Intelligence, Automation and Digitalization
- 4.6 Local Manufacturing and Supply Chain Realignment
- 4.7 Industry Partnerships, Mergers and Acquisitions
- 4.8 Sustainability and Circular Economy Developments
- 4.9 Government and Private Sector Investment Trends
- 4.10 Emerging Business Models and Commercialization
- 4.11 Industry Developments and Announcements
Chapter 5 India Banquet Hall Market Supply and Demand Analysis
- 5.1 Demand Trend and Consumption Analysis, 2018-2025
- 5.2 Demand Forecast, 2025-2035
- 5.3 Supply Chain Structure and Procurement Trends
- 5.4 Supply-Demand Gap and Bottlenecks
- 5.5 Import Dependence and Sourcing Structure
- 5.6 Regional Supply and Demand Concentration
Chapter 6 India Banquet Hall Market Pricing Analysis
- 6.1 Pricing Structure and Measurement
- 6.2 Historical Pricing Trends, 2018-2025
- 6.3 Pricing Outlook, 2025-2035
- 6.4 Pricing by Product and Market Segment
- 6.5 Geographic Pricing Differences
- 6.6 Key Input, Energy, Labor and Logistics Costs
- 6.7 Contract Pricing and Purchasing Models
- 6.8 Pricing Sensitivity and Competitive Positioning
- 6.9 Price, Margin and Profitability Implications
Chapter 7 India Banquet Hall Market Dynamics
- 7.1 Market Growth Drivers
- 7.1.1 Demand-Side Drivers
- 7.1.2 Technology and Innovation Drivers
- 7.1.3 Infrastructure and Investment Drivers
- 7.1.4 Regulatory and Policy Drivers
- 7.2 Market Restraints
- 7.2.1 Cost and Affordability Constraints
- 7.2.2 Technology and Adoption Barriers
- 7.2.3 Supply Chain and Operational Constraints
- 7.3 Market Challenges
- 7.3.1 Competitive Pressure and Margin Erosion
- 7.3.2 Skills, Infrastructure and Implementation Gaps
- 7.4 Emerging Market Opportunities
- 7.5 Market Dynamics Impact and Time-Horizon Assessment
Chapter 8 India Banquet Hall Value Chain Analysis
- 8.1 Industry Value Chain Overview
- 8.2 Upstream Suppliers and Critical Inputs
- 8.3 Technology and Component Providers
- 8.4 Manufacturing or Service Delivery
- 8.5 Distribution, Channel Partners and Integrators
- 8.6 Downstream Applications and End Users
- 8.7 Value Addition and Profit Pools
- 8.8 Vertical Integration and Outsourcing
- 8.9 Supplier Concentration and Risk
- 8.10 Supply Chain Localization and Resilience
Chapter 9 India Banquet Hall Market Regulations and Policies
- 9.1 Relevant Laws, Standards and Compliance Frameworks
- 9.2 Product, Service, Safety and Quality Requirements
- 9.3 Government Policies, Incentives and Subsidies
- 9.4 Imports, Exports and Trade Barriers
- 9.5 Public Procurement and Local Content Requirements
- 9.6 Data Protection, AI and Cybersecurity Compliance
- 9.7 Upcoming Policy Changes and Market Implications
Chapter 10 India Banquet Hall Market Hotspots and Opportunities
- 10.1 Market Opportunity Mapping and Growth Hotspots
- 10.2 High-Growth Applications and Customer Groups
- 10.3 Underserved Markets and White-Space Opportunities
- 10.4 Emerging Technology and Product Opportunities
- 10.5 New Capacity and Investment Hotspots
- 10.6 Market Entry and Expansion Opportunities
- 10.7 Distribution and Partnership Opportunities
- 10.8 Near-Term and Long-Term Commercial Potential
- 10.9 Opportunity Attractiveness and Execution Risks
Chapter 11 India Banquet Hall Market Outlook, 2025-2035
- 11.1 Market Size and Analysis
- 11.1.1 Revenue (Market Measurement: 2025: USD 4.00 billion → 2035: USD 7.49 billion)
- 11.1.2 Historical Market Size, 2018-2025
- 11.1.3 Base-Year Market Size, 2025
- 11.2 Market Forecast, 2025-2035
- 11.2.1 Revenue Forecast to 2035
- 11.2.2 CAGR and Year-on-Year Growth
- 11.2.3 Incremental Revenue Opportunity
- 11.3 Forecast Assumptions and Scenario Analysis
- 11.3.1 Base-Case Forecast
- 11.3.2 Optimistic and Conservative Scenarios
- 11.3.3 Technology, Pricing and Policy Sensitivities
- 11.4 Market Attractiveness and Growth Outlook
Chapter 12 India Banquet Hall Market Segmentation and Outlook
- 12.1 Segmentation Summary and Market Shares, 2025
- 12.2 Largest and Fastest-Growing Segments
- 12.3 By Venue - Market Size and Forecast, 2025-2035
- 12.3.1 Segment Definition and Scope
- 12.3.2 Historical Market Size, 2018-2025
- 12.3.3 Revenue Forecast, 2025-2035
- 12.3.4 Base-Year Market Share, 2025
- 12.3.5 Segment CAGR and Growth Drivers
- 12.3.6 Subsegment Market Size and Forecast
- 12.3.6.1 Hotel Banquets
- 12.3.6.2 Standalone Halls
- 12.3.6.3 Farmhouses & Lawns
- 12.3.7 Subsegment Pricing and Adoption Trends
- 12.3.8 Leading Suppliers and Competition
- 12.3.9 Regional Demand and Opportunities
- 12.4 By Event - Market Size and Forecast, 2025-2035
- 12.4.1 Segment Definition and Scope
- 12.4.2 Historical Market Size, 2018-2025
- 12.4.3 Revenue Forecast, 2025-2035
- 12.4.4 Base-Year Market Share, 2025
- 12.4.5 Segment CAGR and Growth Drivers
- 12.4.6 Subsegment Market Size and Forecast
- 12.4.6.1 Weddings
- 12.4.6.2 Corporate
- 12.4.6.3 Social
- 12.4.7 Subsegment Pricing and Adoption Trends
- 12.4.8 Leading Suppliers and Competition
- 12.4.9 Regional Demand and Opportunities
- 12.5 By City Tier - Market Size and Forecast, 2025-2035
- 12.5.1 Segment Definition and Scope
- 12.5.2 Historical Market Size, 2018-2025
- 12.5.3 Revenue Forecast, 2025-2035
- 12.5.4 Base-Year Market Share, 2025
- 12.5.5 Segment CAGR and Growth Drivers
- 12.5.6 Subsegment Market Size and Forecast
- 12.5.6.1 Metro
- 12.5.6.2 Tier-2
- 12.5.6.3 Tier-3
- 12.5.7 Subsegment Pricing and Adoption Trends
- 12.5.8 Leading Suppliers and Competition
- 12.5.9 Regional Demand and Opportunities
- 12.6 Segment Growth Comparison
- 12.7 Segment Attractiveness and Priority Matrix
Chapter 13 India Banquet Hall Geographic Market Outlook, 2025-2035
- 13.1 Domestic Market Distribution and Demand Clusters
- 13.2 State- or Province-Wise Market Size and Forecast, 2025-2035
- 13.3 City and Metropolitan Market Outlook
- 13.4 Industrial, Manufacturing and Commercial Clusters
- 13.5 Geographic Concentration of Key End Users
- 13.6 Local Pricing and Purchasing Differences
- 13.7 Domestic Production Facilities and Capacity Map
- 13.8 Local Infrastructure and Project Pipeline
- 13.9 State-Level Policy and Incentive Differences
- 13.10 Subnational Investment Hotspots and Opportunities
- 13.11 Distribution and Logistics Networks
- 13.12 Domestic Competitive Footprint
Chapter 14 India Banquet Hall Technology, Innovation and Sustainability Outlook
- 14.1 Technology Landscape and Maturity
- 14.2 Product, Process and Service Innovation
- 14.3 AI, Automation and Digital Tools in the Industry
- 14.4 Technology Adoption and Performance Benchmarking
- 14.5 Innovation Pipeline and R&D Investment
- 14.6 Energy Efficiency and Resource Management
- 14.7 Sustainability, Recycling and Circularity
- 14.8 Technology Roadmap, 2025-2035
- 14.9 Risks of Obsolescence and Technology Substitution
Chapter 15 India Banquet Hall Market Key Strategic Imperatives
- 15.1 Growth and Market Entry Priorities
- 15.2 High-Return Products and Segments
- 15.3 Pricing, Profitability and Cost Optimization
- 15.4 Technology Investment and Product Differentiation
- 15.5 Supply Chain Localization and Resilience
- 15.6 Distribution and Customer Acquisition
- 15.7 Partnership, Acquisition and Capacity Strategy
- 15.8 Regional Expansion Priorities
- 15.9 Short-, Medium- and Long-Term Actions
Chapter 16 Competition Outlook
- 16.1 Industry Competition Characteristics
- 16.2 Market Structure and Concentration
- 16.3 Market Share and Competitive Positioning, 2025
- 16.4 Company-Wise Revenue and Product Benchmarking
- 16.5 Production and Service Capacity Benchmarking
- 16.6 Technology, Pricing and Differentiation
- 16.7 Regional Footprint and Distribution Strength
- 16.8 Mergers, Acquisitions and Strategic Alliances
- 16.9 New Entrants and Competitive Threats
- 16.10 Porter's Five Forces and Industry Attractiveness
- 16.11 Competitive Outlook, 2025-2035
Chapter 17 Company Profiles
- 17.1 Company Coverage and Selection Criteria
- 17.2 Indian Hotels Company (IHCL)
- 17.2.1 Business Description
- 17.2.2 Company Ownership and Geographic Presence
- 17.2.3 Product and Service Portfolio
- 17.2.4 Manufacturing and Operating Footprint
- 17.2.5 Financial Performance and Investment
- 17.2.6 Market Share and Competitive Position
- 17.2.7 Technology and Innovation Capabilities
- 17.2.8 Strategic Alliances or Partnerships
- 17.2.9 Recent Developments
- 17.2.10 Growth Strategy and Outlook
- 17.3 ITC Hotels
- 17.4 Marriott International
- 17.5 Lemon Tree Hotels
- 17.6 The Leela
- 17.7 ExpoInn Suites & Convention
- 17.8 FNP Venues
- 17.9 VenueLook
- 17.10 Mandap (Matrimony.com)
- 17.11 Other Relevant Market Participants
Note: Every listed company is profiled on the structure shown under the first company. The company list is preliminary and may change based on research findings, market developments, data availability and client requirements.
Chapter 18 Disclaimer
- 18.1 Research and Forecast Disclaimer
- 18.2 Data Source and Estimation Limitations
Note: The depth of individual sections depends on data availability for this market. Volume, capacity, trade and other unit-based metrics are included where applicable.

