
Battery scooters move from early adopters to mass commuters
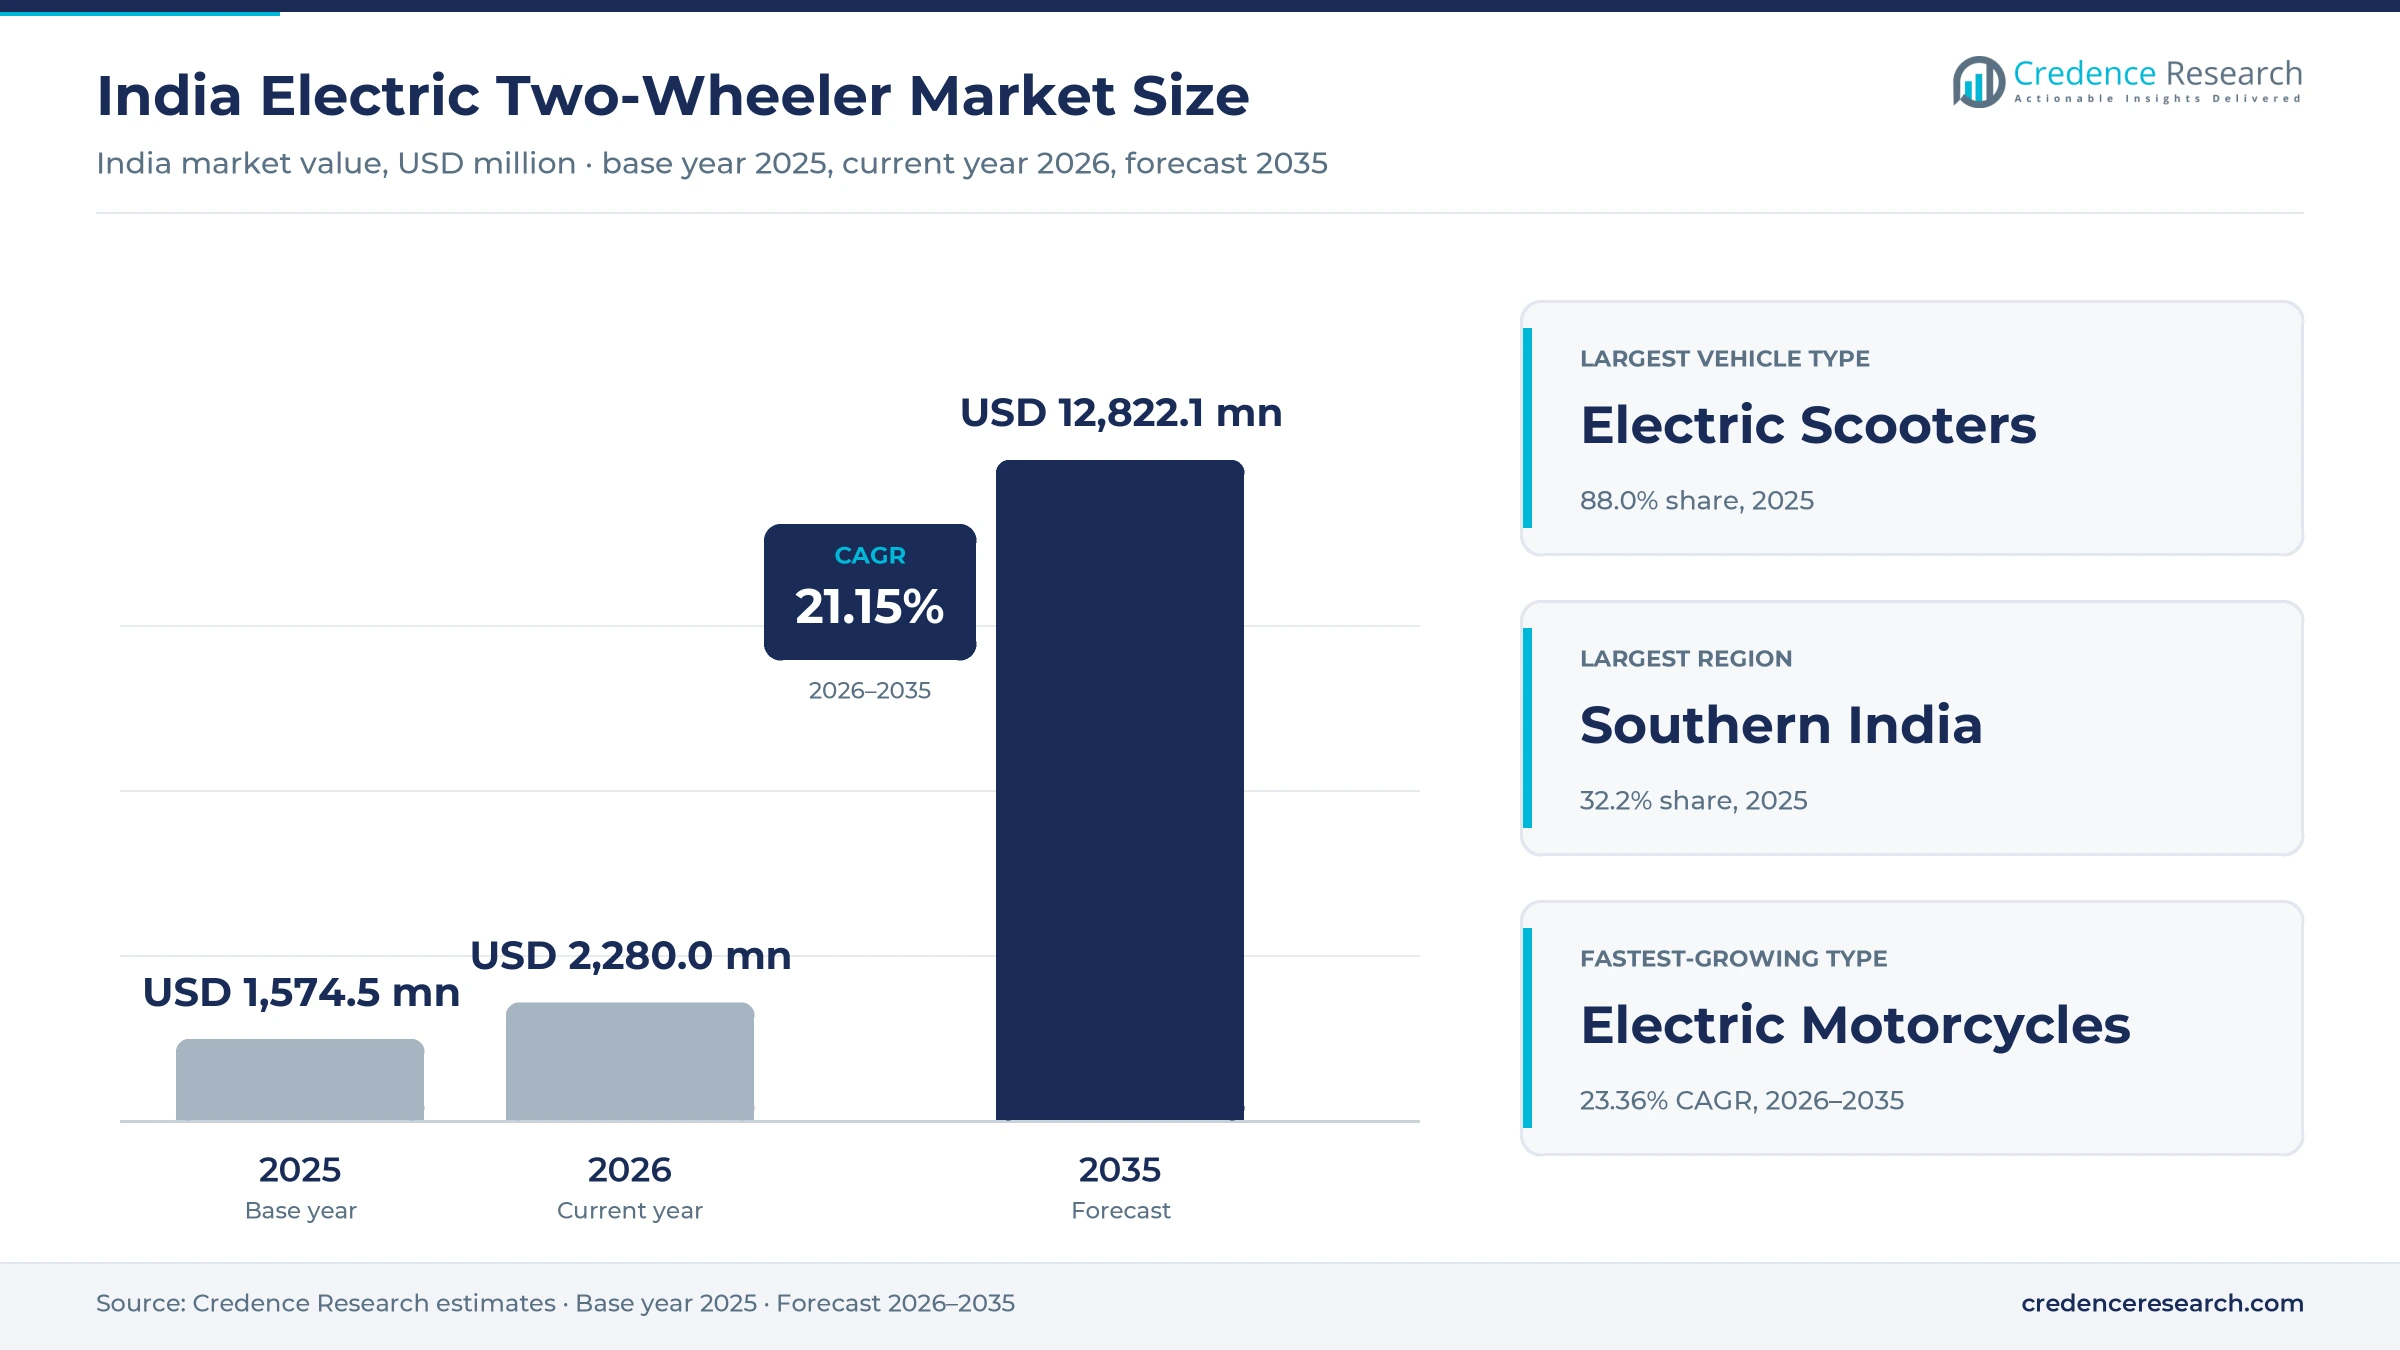
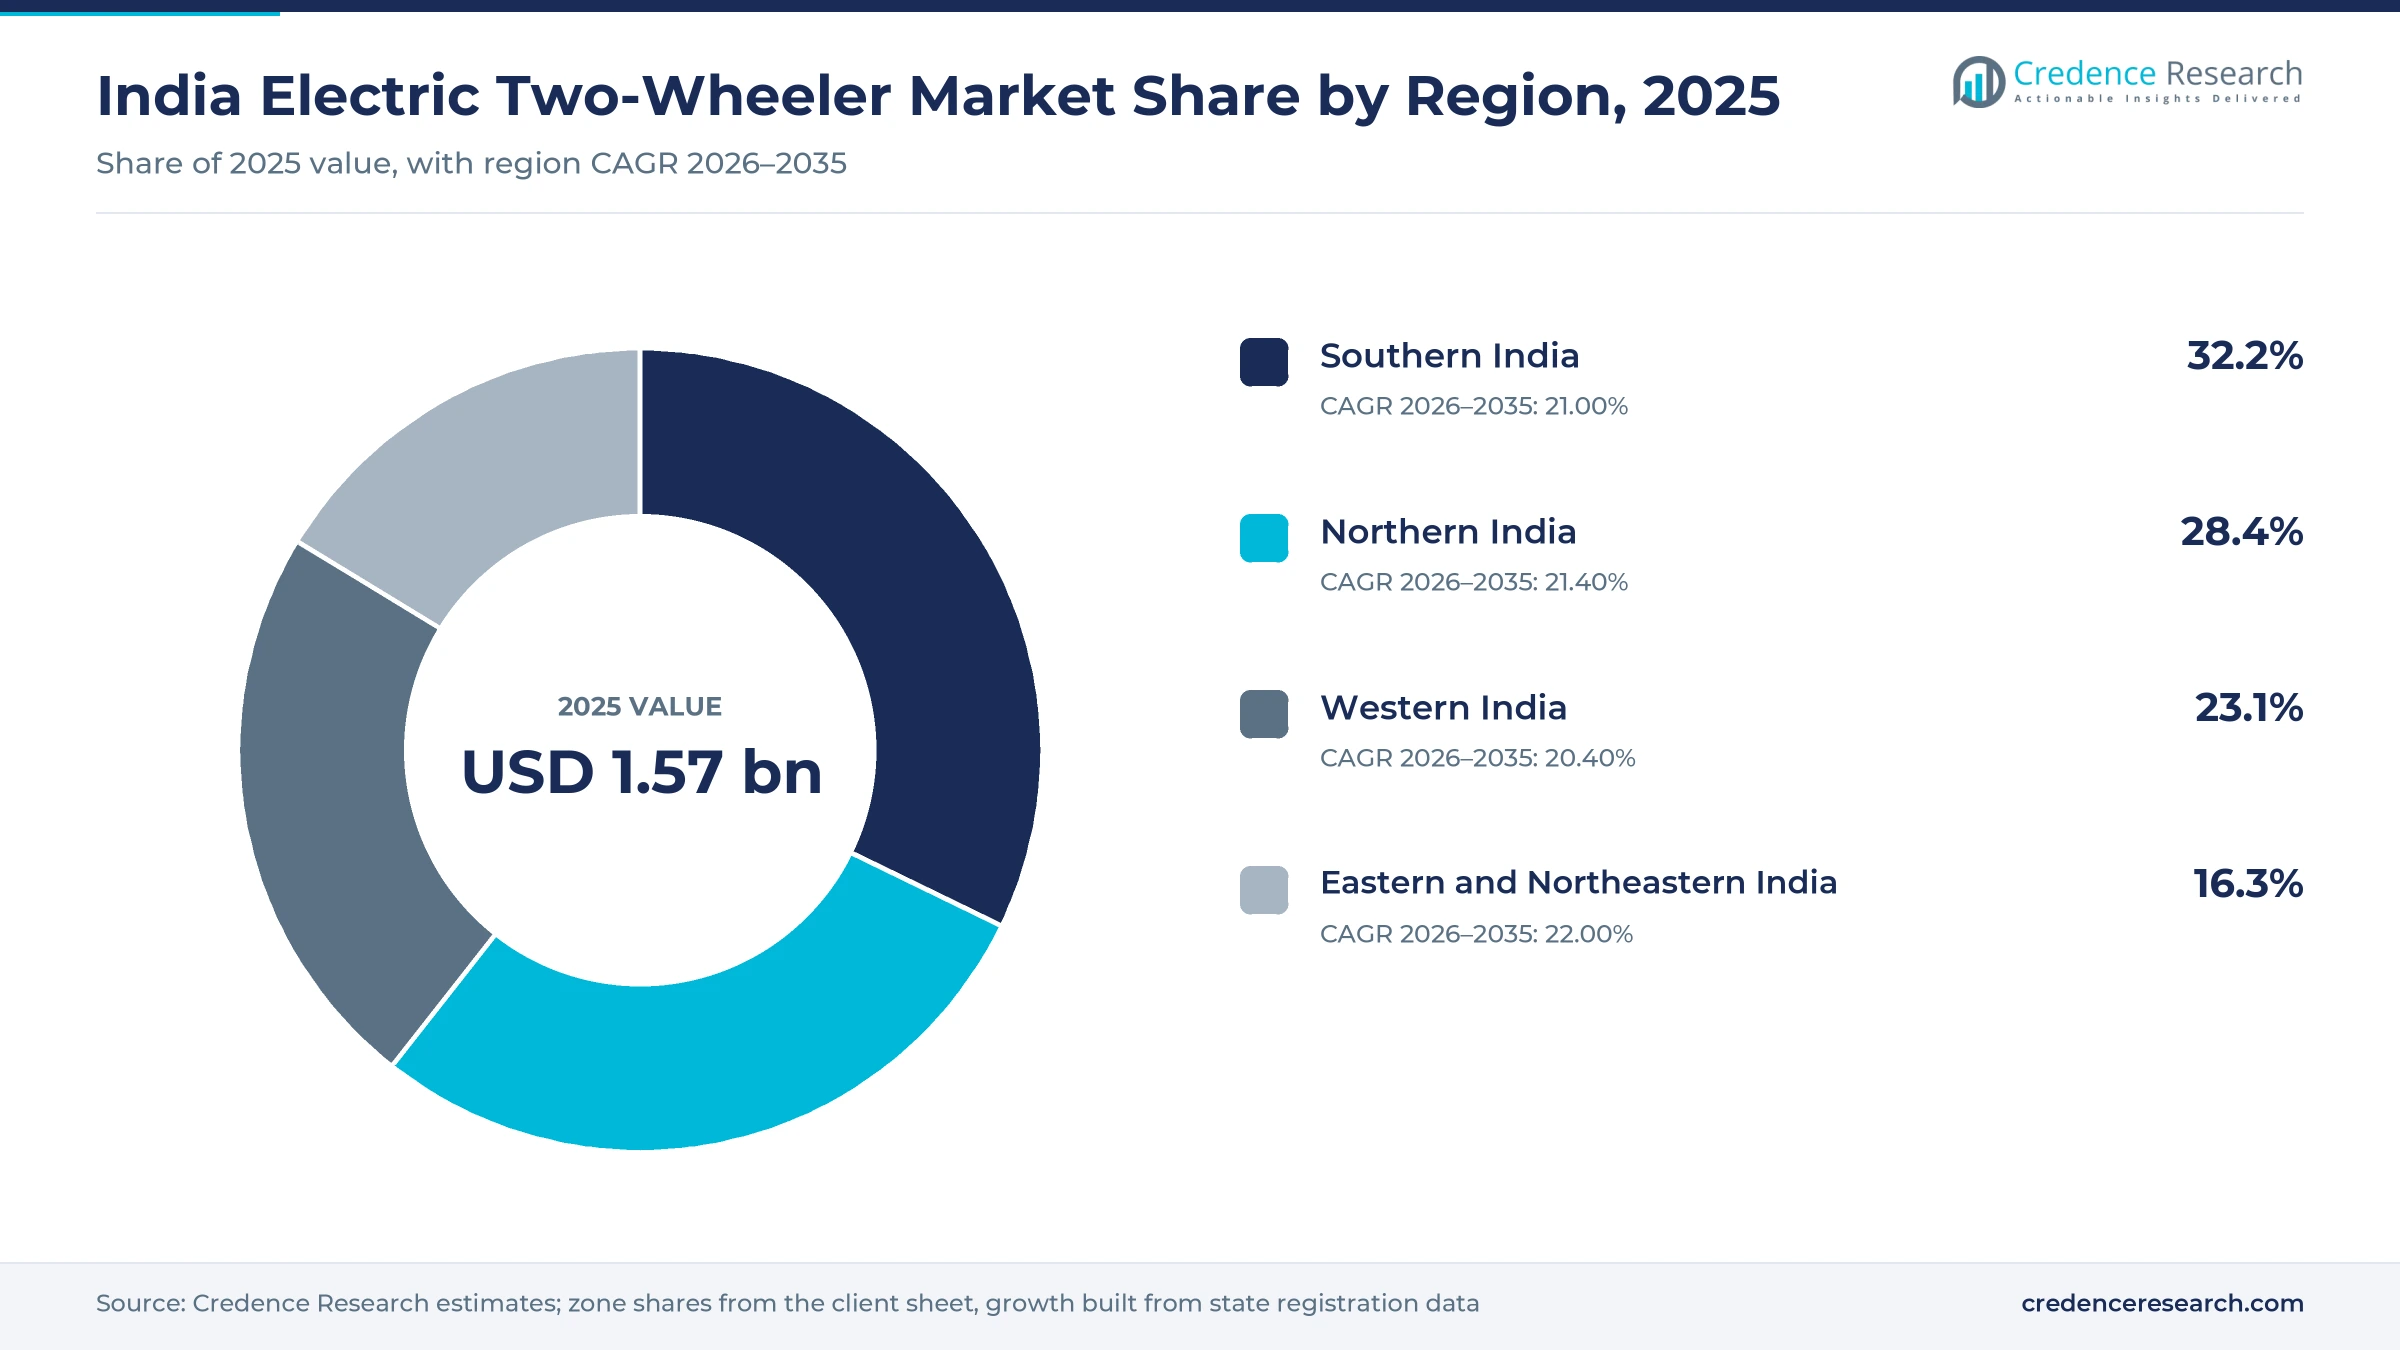
The India electric two-wheeler market was valued at USD 1.57 billion in 2025 and is projected to increase from USD 2.28 billion in 2026 to USD 12.82 billion by 2035, registering a CAGR of 21.15% during 2026–2035. Demand comes from daily commuters replacing petrol scooters, from delivery and rental fleets that value low running costs, and from buyers in smaller towns where dealers now stock several battery brands. Southern India held the largest regional share, 32.2% in 2025, because Karnataka, Tamil Nadu and Kerala combine high adoption with nearby scooter plants. Eastern and Northeastern India is the fastest-growing region at 22.00% a year, as registrations in Odisha, Bihar and West Bengal rise from a smaller base. Market leadership has also changed, because established motorcycle makers with national service networks overtook the startup brands that led sales until 2024. As a result, product range, dealer reach and battery sourcing now decide which brands win buyers.
What does the estimate count, from mopeds to battery motorcycles?
The estimate measures the value of new battery electric scooters, motorcycles and mopeds sold in India, at the ex-showroom prices that private buyers, delivery and rental fleets, and companies pay. It covers registered vehicles sold through brand dealers, company-owned stores, online channels and direct fleet contracts.
The estimate excludes low-speed models that need no registration, bicycles with electric assist, used vehicles, chargers, battery rental fees and exports. The value chain runs from cell, motor and controller suppliers through scooter makers to dealers, financiers and swap network operators that serve riders after the sale.
India Electric Two-Wheeler Market Insights
- The India electric two-wheeler market was valued at USD 1.57 billion in 2025 and is projected to reach USD 12.82 billion by 2035, registering a CAGR of 21.15% during 2026–2035.
- Southern India held a 32.2% share of 2025 value, because Karnataka and Tamil Nadu together registered more than 300,000 battery two-wheelers that year.
- Electric scooters led with 88.0% of 2025 value, because commuters favor step-through designs with under-seat storage for city trips.
- Registrations reached about 15.61 lakh units from January to September 2026, already more than the full-year total for 2025, based on Vahan data.
- TVS Motor, Bajaj Auto, Ather Energy and Hero MotoCorp's Vida held about 76% of registrations in September 2026, as established makers gained share.
Scooters dominate value as swappable packs grow fastest
Why do battery scooters hold most of the value?
Based on vehicle type, the market is categorized into electric scooters, electric motorcycles and electric mopeds. Electric Scooters led with 88.0% of 2025 value, because commuters and families favor step-through designs with flat floors and storage. Electric Motorcycles grow fastest at 23.36% a year, as new commuter models give buyers a battery option in the largest petrol segment.
How quickly are swappable packs gaining ground?
Based on battery type, the market is categorized into fixed lithium-ion batteries, removable lithium-ion batteries and swappable battery systems. Fixed Lithium-ion Batteries led with 78.0% of 2025 value, because most leading models use a fixed pack charged at home. Swappable Battery Systems grow fastest at 23.53% a year, as swap networks cut purchase prices by keeping battery ownership with the operator.
Which buyers account for the largest share of sales?
Based on customer type, the market is categorized into private individual buyers, commercial fleet operators and corporate and institutional buyers. Private Individual Buyers led with 80.0% of 2025 value, because commuters buy most registered scooters through dealers with retail finance. Commercial Fleet Operators grow fastest at 22.15% a year, as delivery and rental fleets value low cost per kilometer.
Why does the mid-market tier carry most of the value?
Based on price tier, the market is categorized into value, mid-market and premium models. Mid-Market models led with 55.0% of 2025 value, because the best-selling family scooters are priced near INR 1 lakh after incentives. Value models grow fastest at 21.96% a year, as battery rental plans and smaller packs bring entry prices close to petrol scooters.
| Segment Group | Leading Sub-segment | Share, 2025 | Fastest-growing Sub-segment | CAGR, 2026–2035 |
|---|---|---|---|---|
| By Vehicle Type | Electric Scooters | 88.0% | Electric Motorcycles | 23.36% |
| By Battery Type | Fixed Lithium-ion Batteries | 78.0% | Swappable Battery Systems | 23.53% |
| By Customer Type | Private Individual Buyers | 80.0% | Commercial Fleet Operators | 22.15% |
| By Price Tier | Mid-Market | 55.0% | Value | 21.96% |
Request a Free Sample
Fill in your details and we'll send you a free sample report.
- Sample data tables & charts
- Research methodology
Buyer uptake, maker scale and local cells lift volumes
How is consumer adoption scaling battery scooter retail?
Battery two-wheelers have moved from early enthusiasts to mainstream commuters, which widens the base of first-time and replacement buyers. Registrations reached 1,279,951 units in 2025, up from 1,149,416 in 2024, according to Rushlane analysis of Vahan data. Growth then quickened, because Vahan data for January to September 2026 show about 15.61 lakh registrations against 9.61 lakh a year earlier, as reported by Angel One. Battery models also reached 11.6% of all two-wheeler registrations in September 2026, according to EVreporter. As a result, private individual buyers remain the largest customer group with 80.0% of 2025 value, while dealers in smaller towns now stock several battery brands beside petrol models.
Why do maker scale and new plants widen product choice?
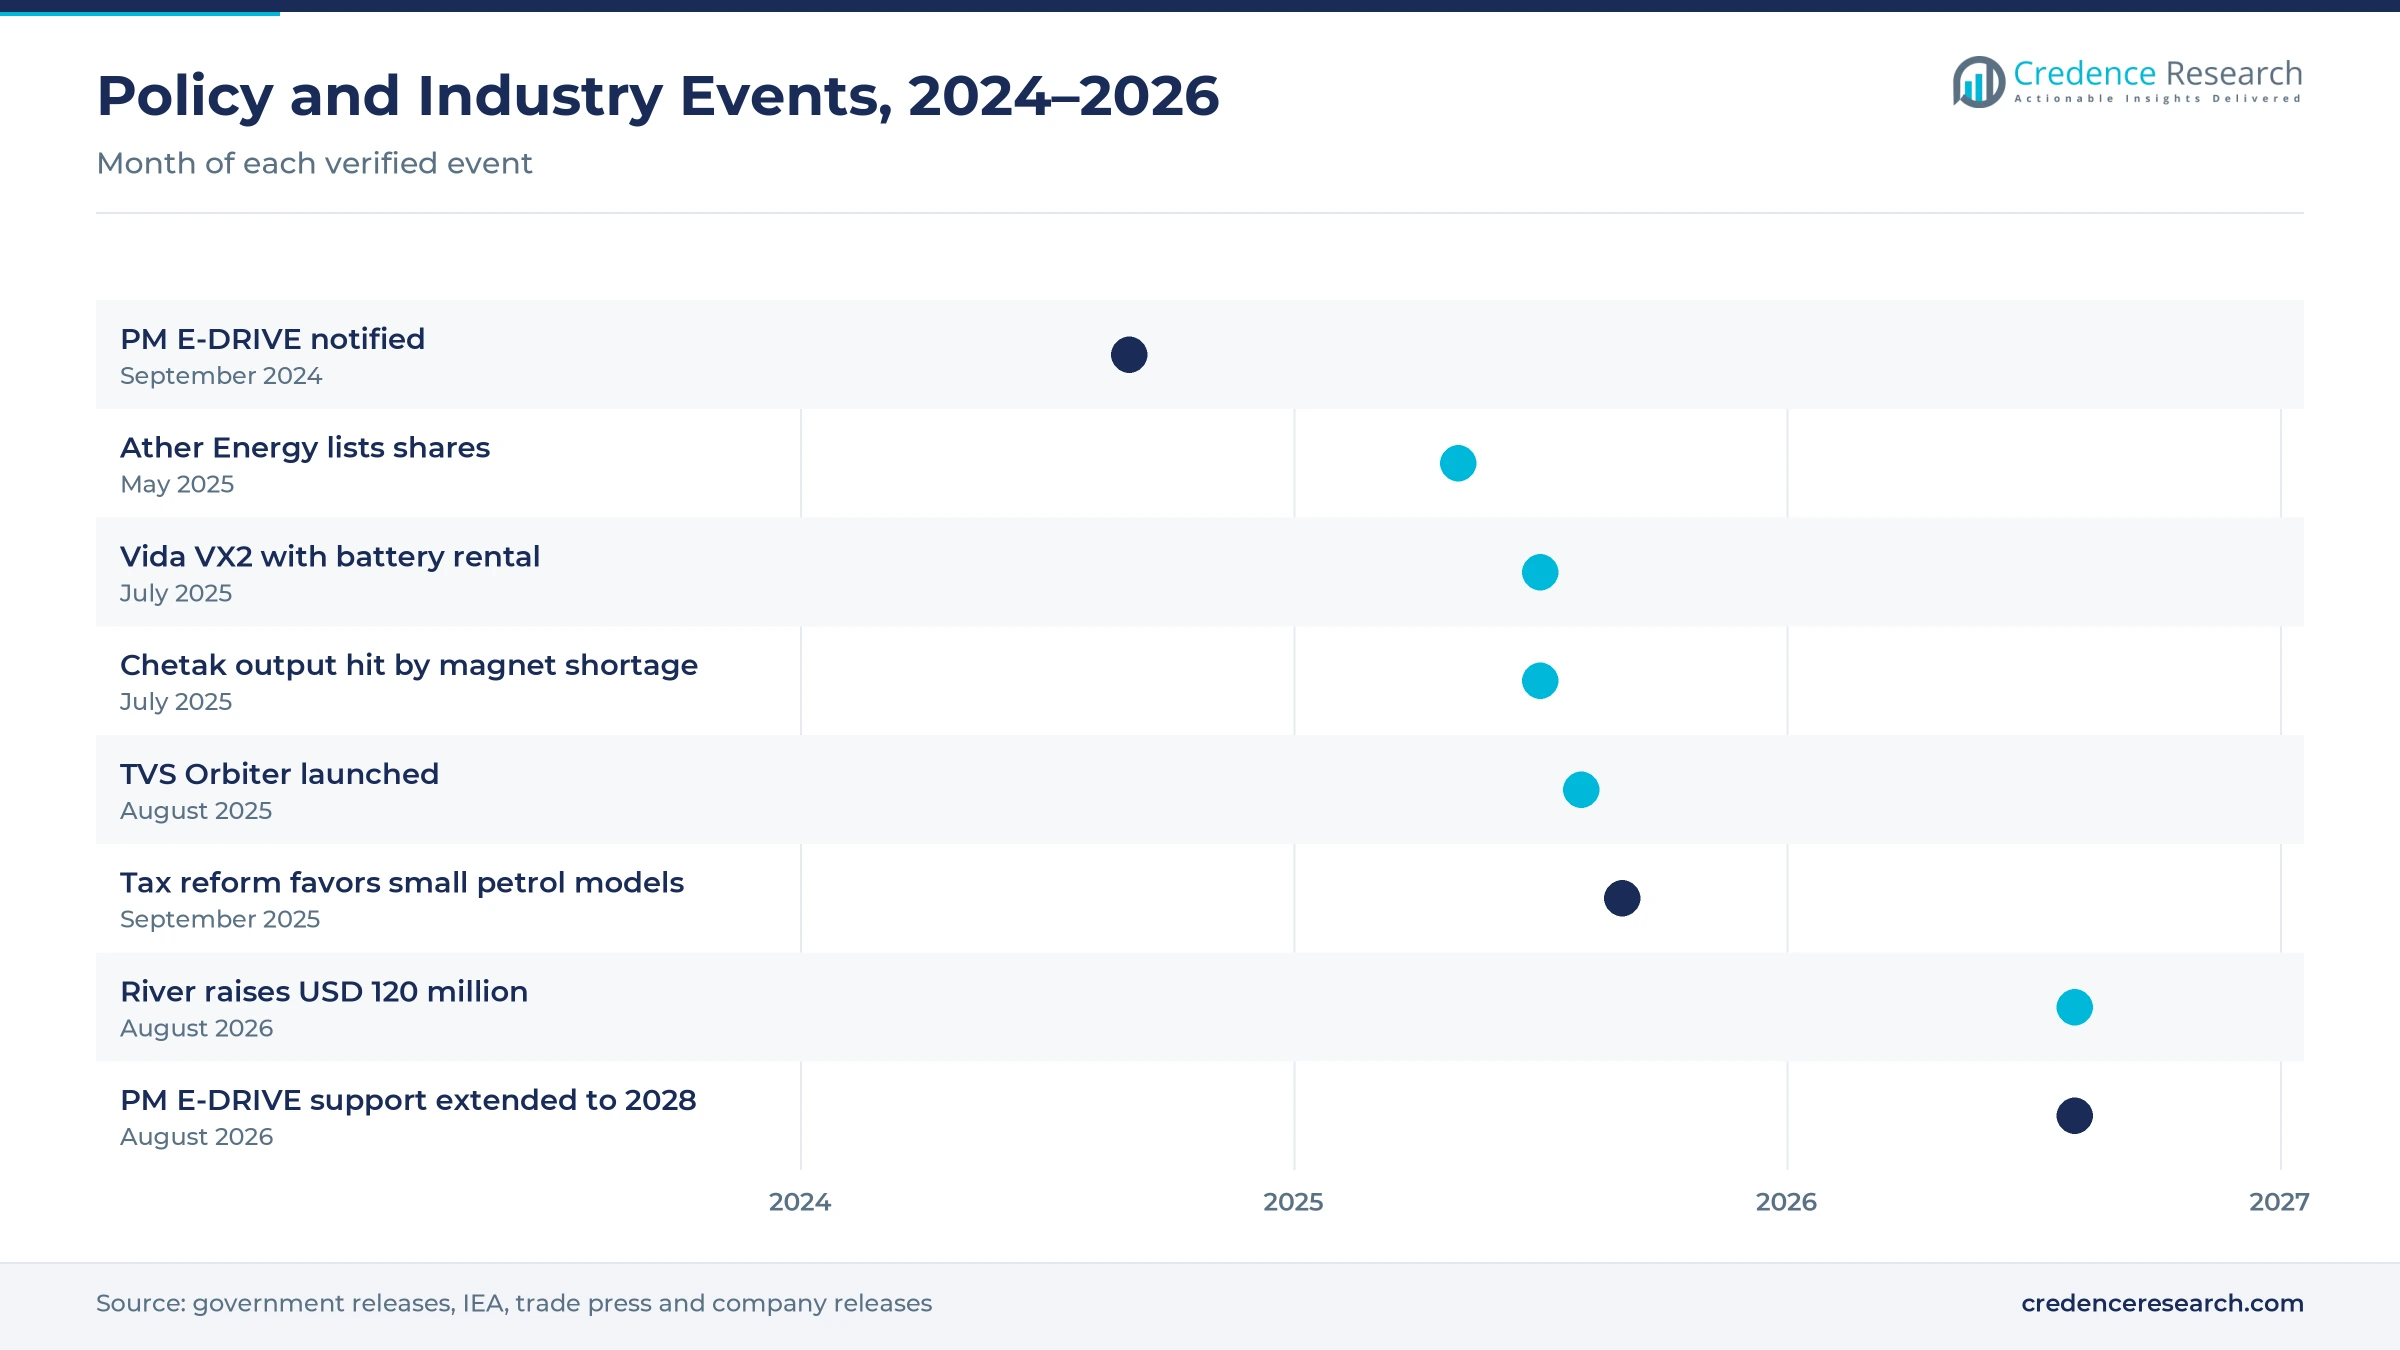
Established motorcycle makers now sell battery scooters through national dealer networks, which brings electric models to buyers who value familiar service. TVS Motor registered 298,881 units in 2025 and Bajaj Auto 269,847, while Hero MotoCorp more than doubled its Vida volumes. TVS launched the Orbiter in August 2025 at INR 99,900 ex-showroom in Bengaluru, with a 3.1 kWh pack and a claimed range of 158 km. Ather Energy listed on May 6, 2025, and set aside INR 927 crore of its offer for a plant in Chhatrapati Sambhajinagar, Maharashtra, planned at 1 million vehicles a year, according to Inc42. In turn, mid-market models led price tiers with 55.0% of 2025 value.
How do local cells and swap networks support adoption?
Local cell production and wider swapping networks cut both pack costs and range worries, which lowers the barrier for commuters. The national Advanced Chemistry Cell incentive scheme carries an outlay of INR 18,100 crore for 50 GWh of capacity, and 40 GWh had been awarded by March 2026, according to ESS News. Ola Electric began making its 4680-format Bharat Cell in 2025 with 1.4 GWh of capacity and targeted 5 GWh by the end of fiscal 2025-26, according to pv magazine India. Honda planned 500 swap stations across Bengaluru, Delhi and Mumbai by March 2026 for the Activa e. As a result, swappable battery systems grow fastest by battery type at 23.53% a year, and pack-level battery management systems gain importance.
Why does the extended PM E-DRIVE support matter for buyers?
Central government purchase support has fallen per vehicle but now runs longer, which keeps entry prices steady for budget buyers. PM E-DRIVE began with an outlay of INR 10,900 crore to support 24.79 lakh battery two-wheelers, according to the Prime Minister's Office. A revised notification in August 2026 raised the outlay to INR 11,900 crore and extended two-wheeler support to March 31, 2028, with INR 2,767 crore for up to 45.79 lakh vehicles, according to Inc42. The incentive stays at INR 2,500 per kWh, capped at INR 5,000 per vehicle, and only models with an ex-factory price up to INR 1.5 lakh qualify. In turn, value models grow fastest by price tier at 21.96% a year.
Legacy makers, battery rental and new states reshape sales
How is the shift toward established makers changing the market?
Market leadership has shifted from startup brands to established motorcycle makers, which changes how buyers weigh service, resale and finance. Ola Electric registered 407,700 units in 2024, about 35% of the market, but fell to 199,318 units in 2025, while TVS and Bajaj rose to about 23% and 21%. The gap widened in September 2026, when TVS held 26.3%, Bajaj 23.5%, Ather 14.7%, Vida 11.7% and Ola 6.5% of registrations, as reported by Angel One. Hero MotoCorp's Vida grew to 109,168 units in 2025 from 43,712 in 2024, as wider dealer reach brought the brand to more towns. As a result, buyers now favor brands with dense service networks, much as established makers have gained ground in battery scooter and motorcycle sales worldwide.
What do battery rental and removable packs change for buyers?
Battery rental plans and removable packs are emerging as a way to cut the upfront price, which matters most to first-time buyers. Hero MotoCorp launched the Vida VX2 in July 2025 at INR 59,490 with a battery rental plan of INR 0.96 per km, against INR 99,490 when the battery is bought outright, according to Rushlane. The VX2 carries two removable packs, of 2.2 kWh or 3.4 kWh, that owners can take indoors to charge at home. Honda's Activa e uses swappable batteries owned by its swap company, which lowers the scooter's purchase price. In turn, removable lithium-ion batteries gain ground among apartment dwellers without private parking or charging points.
Can eastern and central states open the next wave of demand?
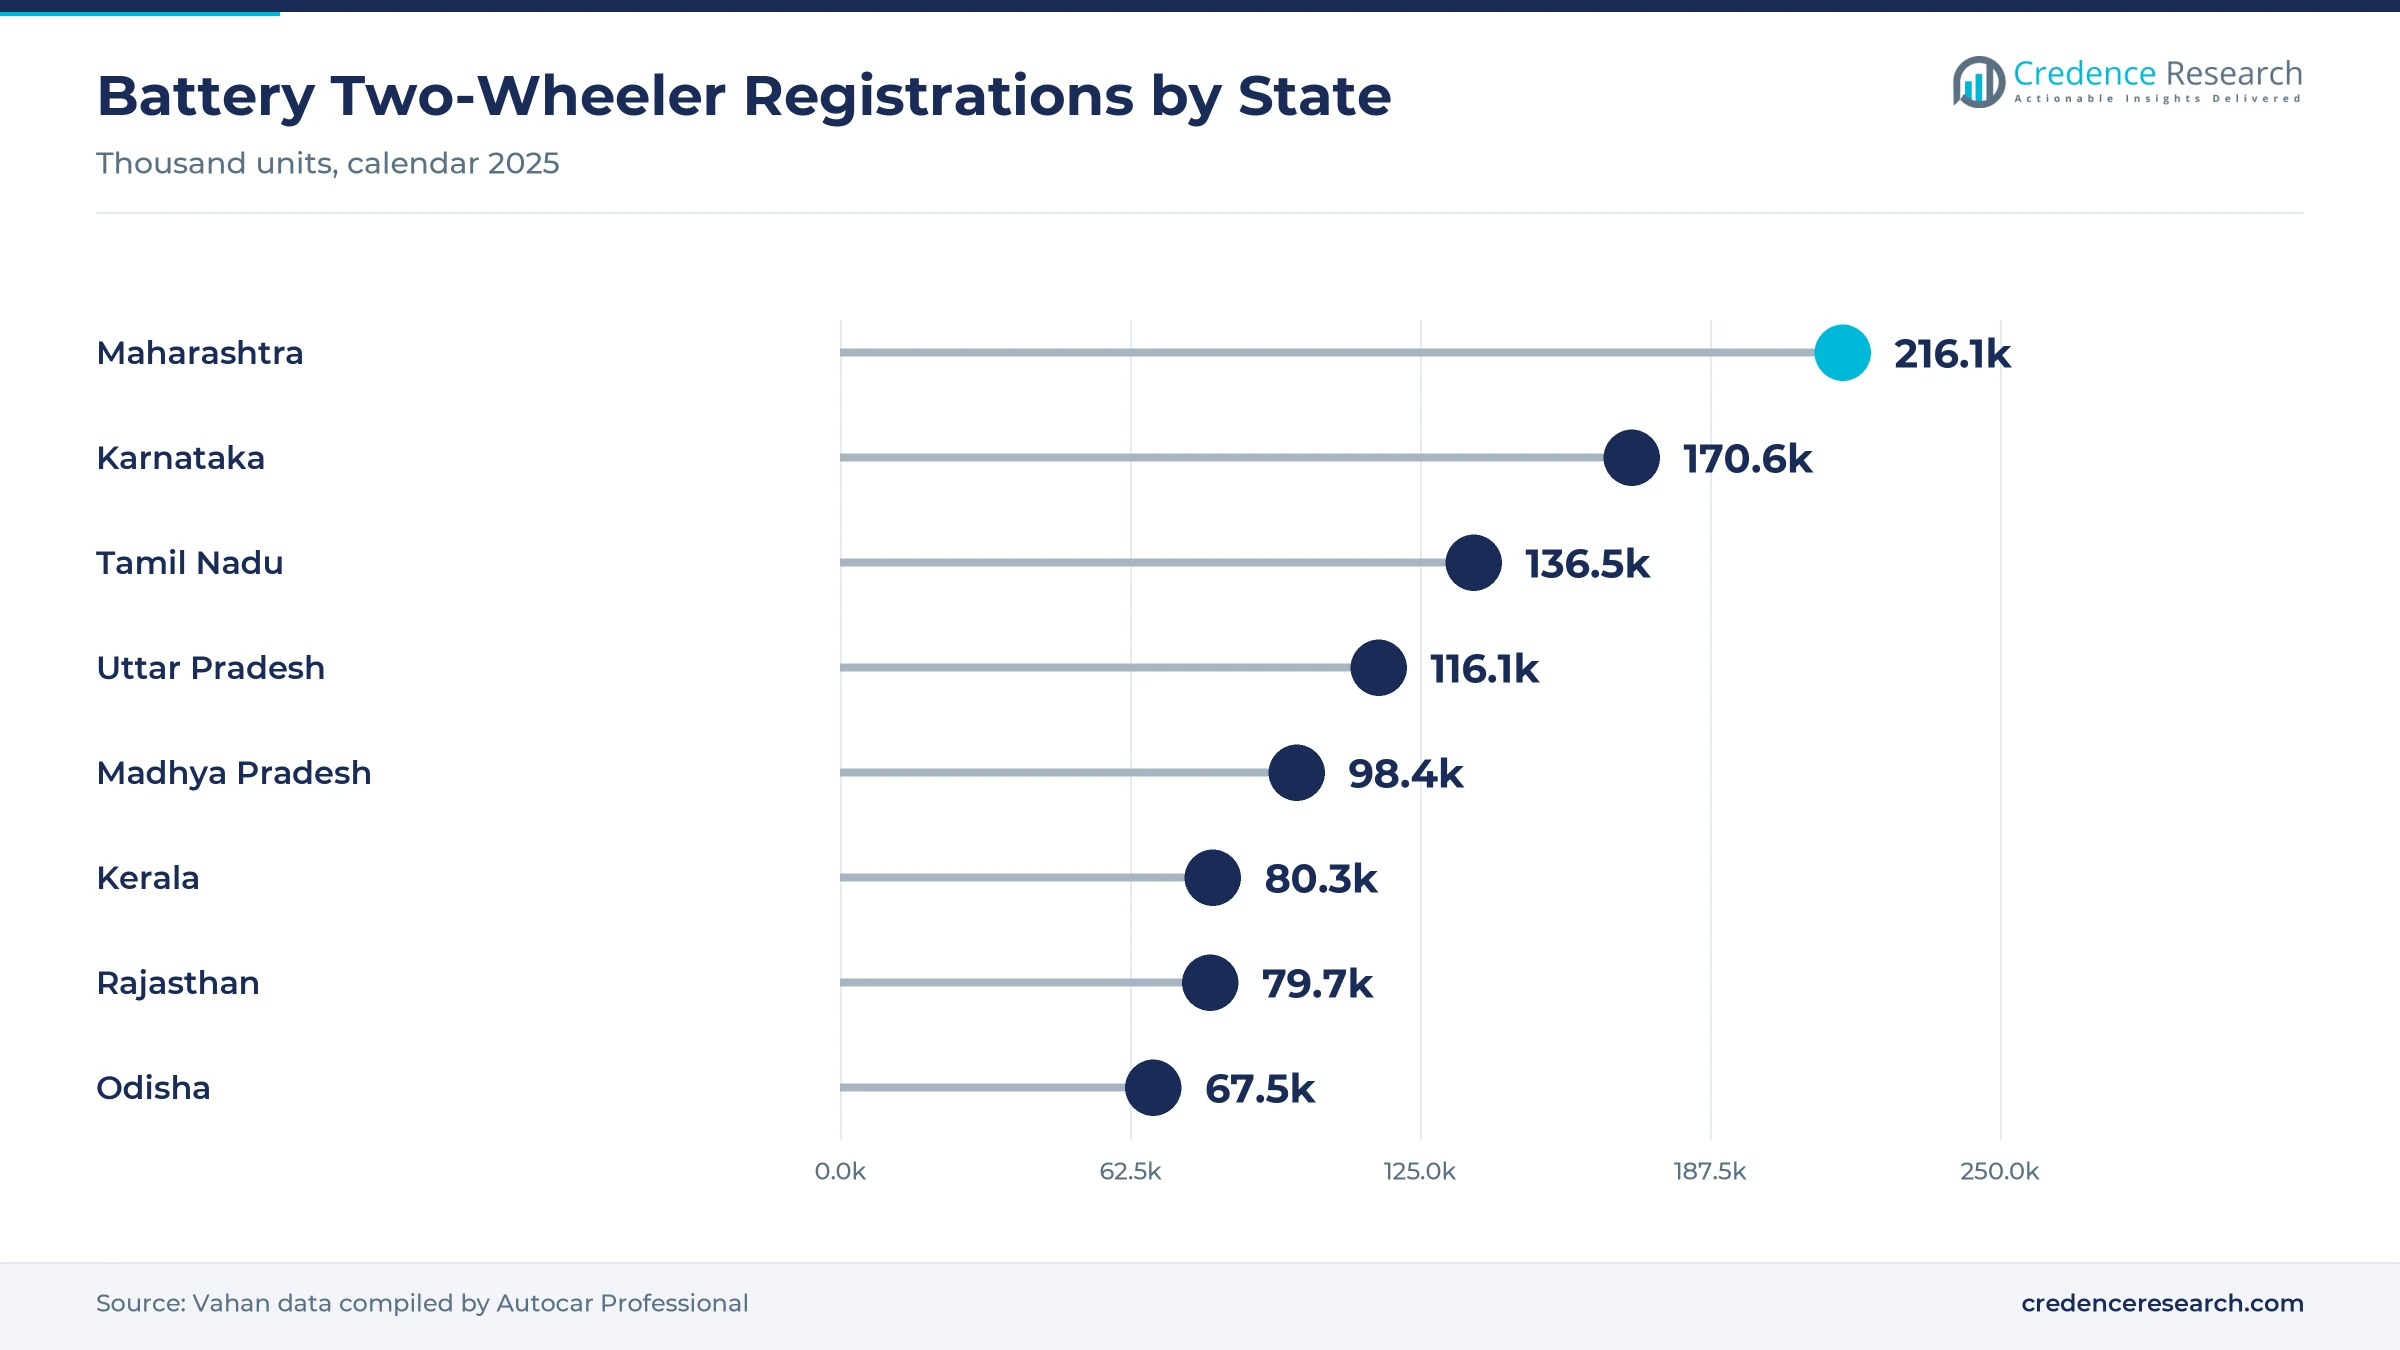
Demand outside the large metro states is an opening for brands that build dealer and service reach early. Registrations in the eastern zone rose 20% in 2025 to 133,819 units, while the central zone grew 31% to 129,326 units, according to Autocar Professional analysis of Vahan data. Madhya Pradesh rose 49% to 98,390 units, Bihar 27% to 28,084, and Odisha reached 67,544 units. By contrast, Maharashtra grew only 3% in 2025, which shows that the first wave of urban demand is maturing. As a result, Eastern and Northeastern India is the fastest-growing zone in this report, with demand rising from a smaller base.
Is store expansion an opening for focused challenger brands?
Smaller makers that pair a focused product with fast store expansion have room to gain share, because buyers in new cities still compare only a few brands. River Mobility raised USD 120 million in August 2026 and plans more than 350 stores by March 2028, up from over 75, according to Autocar India. River also builds the Yamaha EC-06 at its Hoskote plant, which has rolled out 50,000 units. PURE EV more than tripled registrations to 17,847 units in 2025 from 5,539, while Greaves Electric Mobility sold 38,430 units from Jan. 1 to June 17, 2026, up 58%. In turn, brand stores and online booking help newer makers reach buyers without large dealer networks.
Tax gaps, magnet supply and cell imports test margins
How do tax changes and smaller subsidies narrow the price gap?
Tax and subsidy changes have narrowed the price gap with petrol scooters, which slows the switch for cost-focused buyers. The September 2025 tax reform cut the rate on low-displacement petrol two-wheelers while leaving battery models unchanged, according to the International Energy Agency. Purchase support also fell from about USD 170 per kWh under FAME-II to less than USD 30 per kWh in fiscal 2025-26. As a result, makers now cut pack sizes and offer battery rental to hold entry prices.
Why does rare earth magnet supply threaten output?
Most traction motors use magnets made with heavy rare earths sourced from China, so export curbs can halt assembly lines. Bajaj Auto made 10,824 Chetak units in July 2025, down 47% from 20,384 a year earlier, because of a magnet shortage, according to Autocar India. In turn, buyers faced longer waits and rival brands gained sales. Wider sourcing and hub motors that use fewer rare earths would reduce this exposure over time.
How does reliance on imported cells raise cost risk?
Most cells used in Indian battery scooters are still imported, so currency swings and global cell prices feed into vehicle costs. The national cell incentive scheme targets 50 GWh of local capacity, yet Ola Electric's 1.4 GWh line was the main cell plant running by March 2026. As a result, makers carry inventory and price risk on long cell contracts. New local plants should lower this exposure in the second half of the forecast period.
How do after-sales gaps hold back first-time buyers?
First-time buyers worry about service waits, software faults and the value of a used scooter once its battery ages. These concerns weigh most on buyers in smaller towns, where authorized service points are farther apart. In turn, some buyers delay purchases or choose petrol models with known resale prices. Longer battery warranties, buyback offers and wider service networks are reducing these concerns for the larger brands.
Southern India leads as the eastern states grow fastest
| Region | Value, 2025 (USD billion) | Share, 2025 | CAGR, 2026–2035 |
|---|---|---|---|
| Southern India | 0.51 | 32.2% | 21.00% |
| Northern India | 0.45 | 28.4% | 21.40% |
| Western India | 0.36 | 23.1% | 20.40% |
| Eastern and Northeastern India | 0.26 | 16.3% | 22.00% |
How do Karnataka and Tamil Nadu put southern India first?
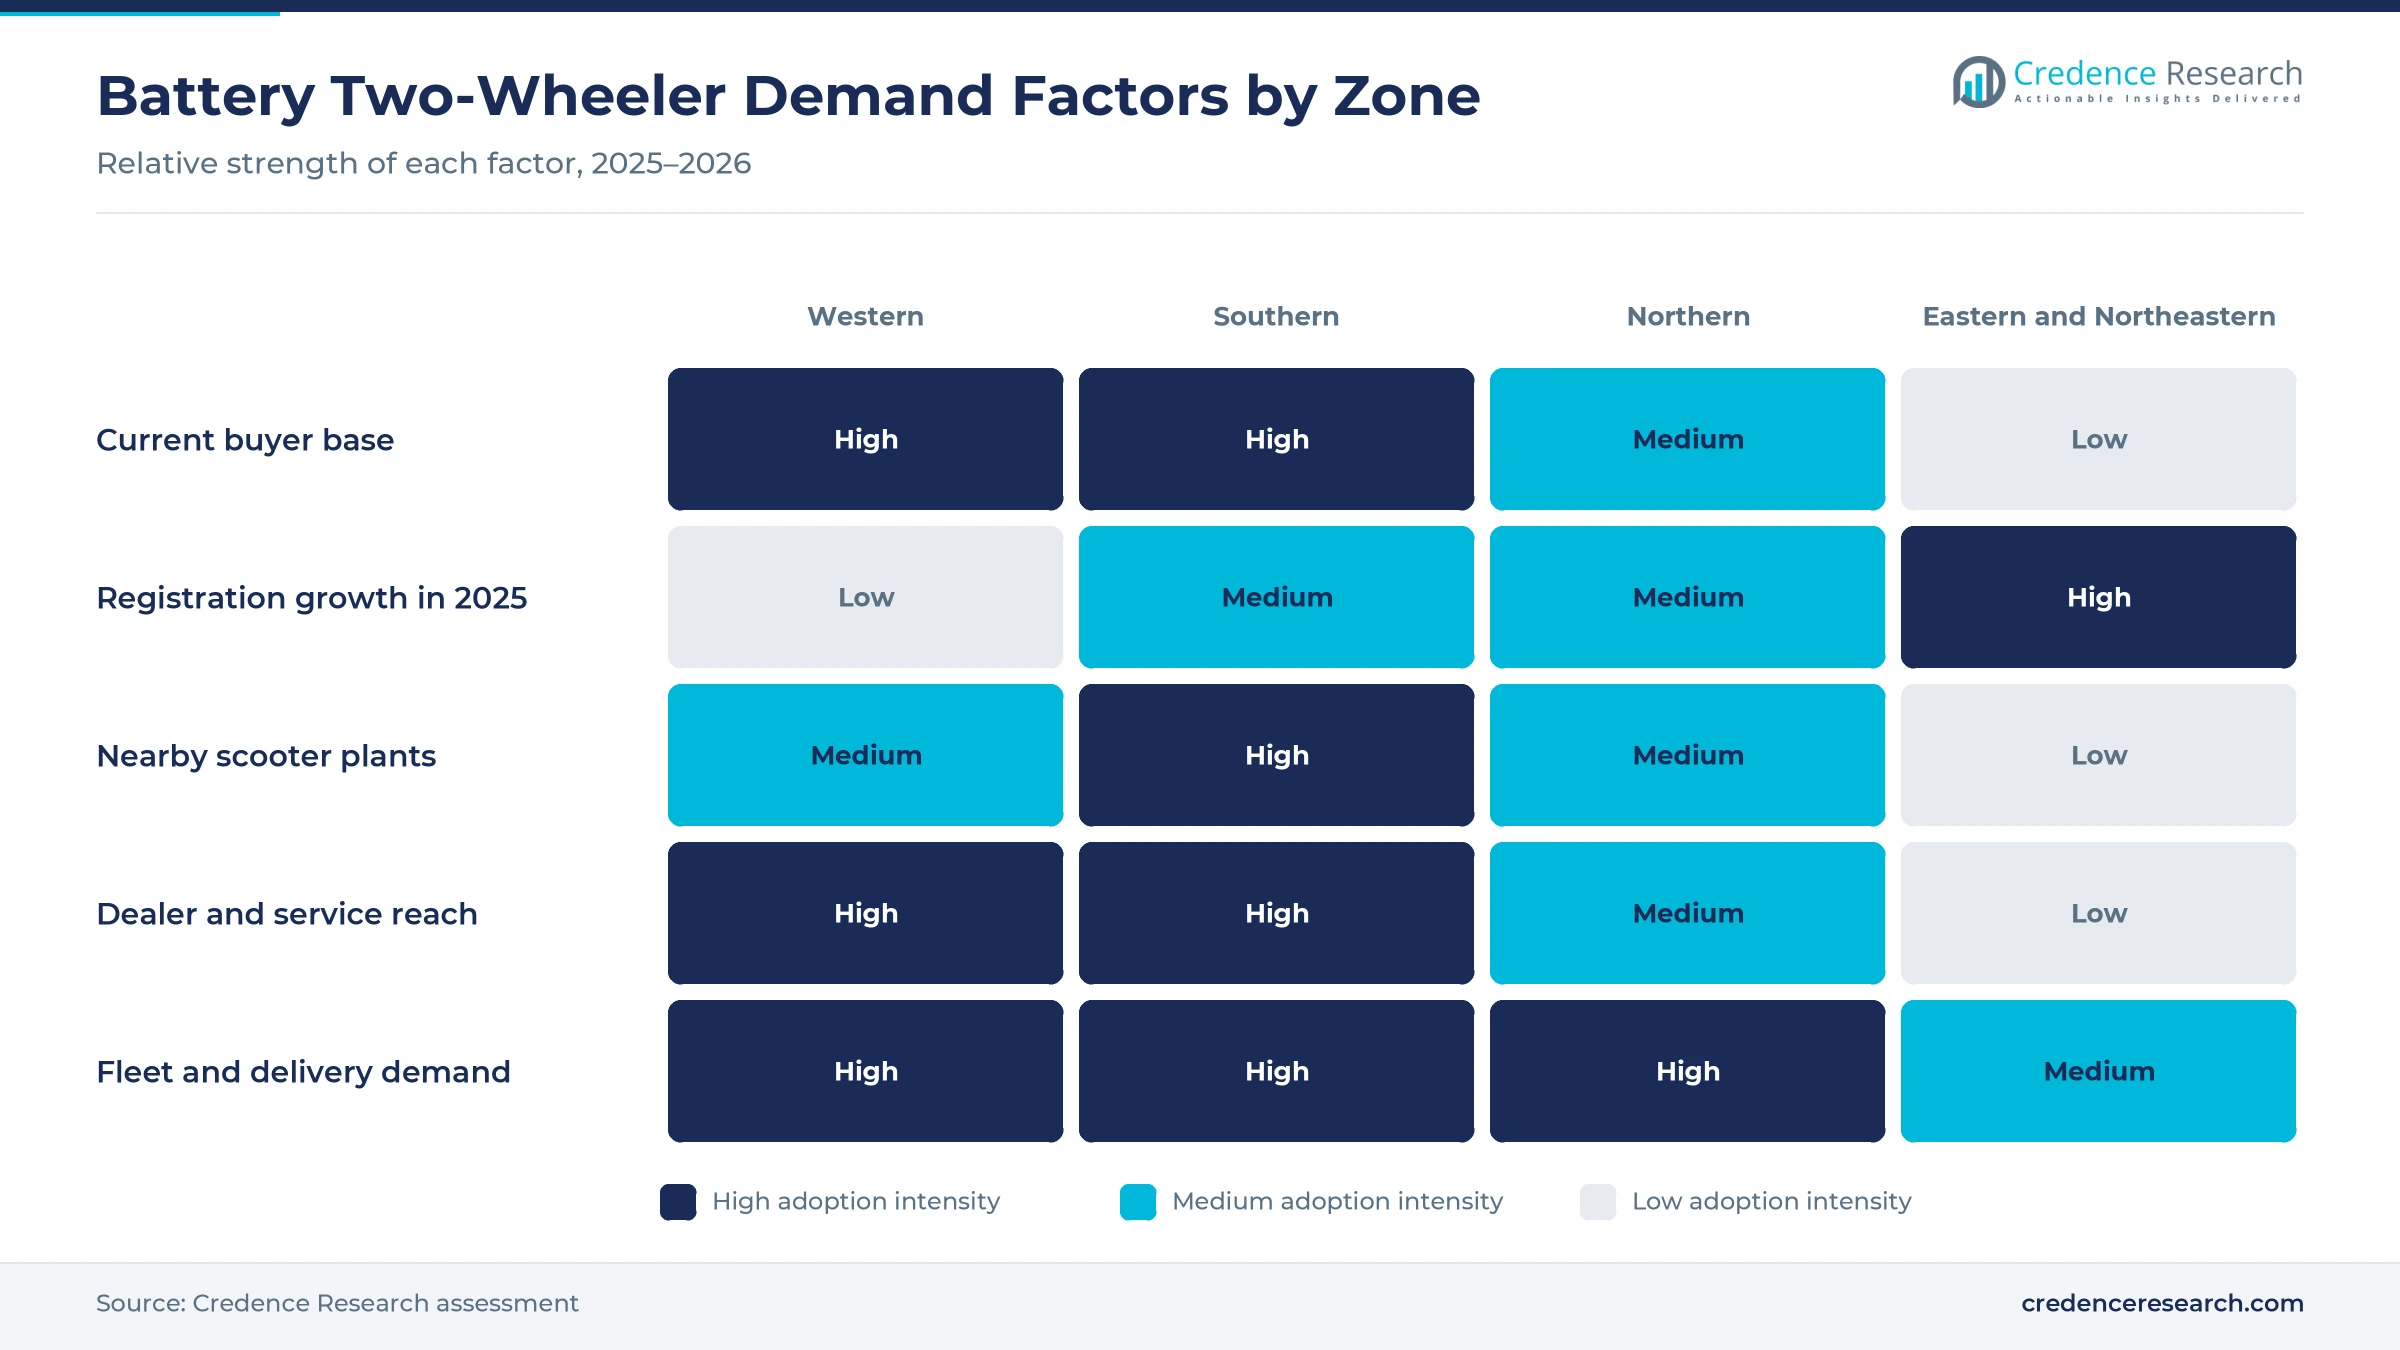
Southern India held 32.2% of 2025 value and grows at 21.00% a year, because Karnataka, Tamil Nadu and Kerala combine high adoption with nearby scooter plants. Karnataka registered 170,582 battery two-wheelers in 2025, while Tamil Nadu reached 136,470 units, up 19%, and Kerala 80,325 units, up 20%. River Mobility builds its own scooters and the Yamaha EC-06 at Hoskote near Bengaluru. As a result, the southern states combine the deepest buyer base with short supply lines from local plants.
Why does Delhi and Uttar Pradesh demand lift northern India?
Northern India held 28.4% of 2025 value and grows at 21.40% a year, because Uttar Pradesh and the capital region add buyers quickly. Uttar Pradesh registered 116,067 units in 2025, up 21%, while Delhi rose 17% to 36,961 and Punjab 37% to 27,263. However, Haryana registrations fell 27% to 13,990 units, which shows that demand growth remains uneven. In turn, northern demand tracks wider EV adoption across cars, three-wheelers and buses in the same cities.
How does Maharashtra shape demand in Western India?
Western India held 23.1% of 2025 value and grows at 20.40% a year, because Maharashtra is the largest state buyer but is maturing. Maharashtra registered 216,148 units in 2025, about 17% of the national total, yet grew only 3%. Gujarat fell 9% to 58,958 units, and Goa fell 24% to 7,663. However, the new Ather Energy plant in Chhatrapati Sambhajinagar is set to add local supply from 2026, which should support dealer stock in the zone.
Which eastern states drive the fastest regional growth?
Eastern and Northeastern India held 16.3% of 2025 value and grows fastest at 22.00% a year, because its states start from smaller bases. Odisha registered 67,544 units in 2025, while Bihar registered 28,084 units and West Bengal rose 15% to 27,376 units. However, the northeastern states registered only 5,630 units, down 1%, because dealer and service reach remains thin. As a result, growth is led by Odisha, Bihar and West Bengal rather than the hill states.
Listings, launches and subsidy moves from 2025 to 2026
| Development | Status and market relevance |
|---|---|
| In May 2025, Ather Energy listed its shares and set aside INR 927 crore for a plant in Chhatrapati Sambhajinagar, Maharashtra. | Plant planned at 1 million vehicles a year |
| In July 2025, Hero MotoCorp launched the Vida VX2 with removable batteries and a battery rental plan. | Entry price of INR 59,490 with rental |
| In August 2025, TVS Motor launched the Orbiter scooter at INR 99,900 with a 3.1 kWh pack. | Targets mass-market commuters |
| In August 2026, River Mobility raised USD 120 million to expand its Hoskote plant and store network. | Plans more than 350 stores by March 2028 |
| In August 2026, the Ministry of Heavy Industries extended PM E-DRIVE support for battery two-wheelers to March 2028. | Supports up to 45.79 lakh vehicles |
Battery format and motor design shape scooter choices
- Fixed packs sit under the floor and charge from a home socket, which suits buyers with parking near a power point.
- Removable packs lift out of the scooter for charging indoors, which suits apartment dwellers as the Vida VX2 shows.
- Swappable batteries are owned by a network operator and exchanged at stations, which cuts purchase price and charging time.
- 4680 cylindrical cells store more energy per cell than older 2170 formats, which Ola Electric now makes in-house.
- Hub and mid-drive motors trade cost against performance, which lets makers serve both value scooters and motorcycles.
Need a Custom Version of This Report?
Tailor the scope, geography, or segments to your exact requirements.
- Custom geography or segment scope
- Direct access to our analyst team
Service reach and product range separate the leaders
Competition centers on service reach, product range, financing and battery supply, because most buyers compare running cost and after-sales support before price. TVS Motor led 2025 registrations with the iQube and added the Orbiter, while Bajaj Auto sold the Chetak through its national dealer network. Ather Energy sells the Rizta family scooter and its sport models through experience centers. Ola Electric sells directly through company stores and makes its own cells, yet its share fell sharply in 2025. Hero MotoCorp gained share with the Vida range and battery rental. Greaves Electric Mobility, BGauss, PURE EV, River Mobility and Kinetic Green compete in value, regional and commuter niches. The five largest makers held more than 80% of 2025 registrations, so smaller brands depend on focused products and local dealer strength.
Companies profiled and their roles in this market
| Company | Type | Role in the market |
|---|---|---|
| TVS Motor Company Ltd | Two-wheeler maker | Led 2025 registrations with iQube; Orbiter launched August 2025 |
| Bajaj Auto Ltd | Two-wheeler maker | Chetak range; output hit by magnet shortage in July 2025 |
| Ather Energy Ltd | Battery scooter maker | Listed May 2025; Maharashtra plant planned at 1 million units |
| Ola Electric Mobility Ltd | Battery scooter and cell maker | Direct stores; 4680 Bharat Cell made in-house |
| Hero MotoCorp Ltd | Two-wheeler maker | Vida VX2 with removable packs and battery rental |
| Greaves Electric Mobility Pvt Ltd | Battery scooter maker | Ampere Nexus, Magnus and Reo models |
| BGauss Auto Pvt Ltd | Battery scooter maker | 22,883 registrations in 2025 |
| PURE EV | Battery scooter and motorcycle maker | Registrations more than tripled in 2025 |
| River Mobility Pvt Ltd | Battery scooter maker | Hoskote plant; builds Yamaha EC-06; USD 120 million raised |
| Kinetic Green Energy & Power Solutions Ltd | Battery moped and scooter maker | 12,610 registrations in 2025 |
Credence Research view on Indian battery scooter demand
Credence Research's view is that Indian battery two-wheeler demand will grow strongly, because established makers, lower entry prices and local cell supply now reach buyers beyond the large metro cities. Scooters keep most of the value, while motorcycles and swappable packs gain ground from small bases. Southern India should stay the largest zone, while Eastern and Northeastern India grows fastest as dealer networks spread. Makers that secure magnets and cells, keep service waits short and offer battery rental should gain the most share through the forecast period.
Vahan registrations and retail prices anchor the model
The report uses 2025 as the base year on a calendar basis, and market values come from the Credence Research model. That model combines Vahan registration data as compiled by trade press, ex-showroom prices of leading models, scheme documents and company announcements. Segment splits and zone growth rates are Credence Research estimates, and zone shares follow the client sheet. Sources used are government scheme releases, the International Energy Agency, trade press and company releases, and no interviews or surveys were used.
Mass-market scooters carry demand toward 2035
Electric two-wheeler sales in India are expected to reach USD 12.82 billion by 2035, a 21.15% CAGR during 2026–2035, as family scooters, commuter motorcycles and battery rental plans reach more buyers. Growth should stay strong through 2028 while PM E-DRIVE support continues and new plants from Ather and others add supply. After that, local cell output, lower pack prices and wider service networks will set the pace. Faster magnet and cell localization would lift volumes, while a wider tax gap with petrol models would slow the switch. Electric motorcycles are expected to gain the most share through 2035.
Frequently Asked Questions
How big is the India electric two-wheeler market?
Which vehicle type leads demand in India?
Which region leads the Indian market?
How many battery two-wheelers were registered in India in 2025?
What support does PM E-DRIVE give to battery scooters?
Why are swappable and removable batteries gaining ground?
Who are the leading battery two-wheeler makers in India?
What are the main challenges for the market?
Table of Content
Chapter 1 Market Segmentation
- 1.1 Segmentation Framework
- 1.1.1 Product and Service Classification
- 1.1.2 Application and End-Use Classification
- 1.1.3 Technology and Solution Classification
- 1.1.4 Customer and Distribution Channel Classification
- 1.1.5 Geographic Segmentation
- 1.1.6 Market Segment Definitions and Boundaries
- 1.2 By Vehicle Type
- 1.2.1 Electric Scooters
- 1.2.2 Electric Motorcycles
- 1.2.3 Electric Mopeds
- 1.3 By Battery Type
- 1.3.1 Fixed Lithium-ion Batteries
- 1.3.2 Removable Lithium-ion Batteries
- 1.3.3 Swappable Battery Systems
- 1.4 By Customer Type
- 1.4.1 Private Individual Buyers
- 1.4.2 Commercial Fleet Operators
- 1.4.3 Corporate and Institutional Buyers
- 1.5 By Price Tier
- 1.5.1 Value
- 1.5.2 Mid-Market
- 1.5.3 Premium
Chapter 2 Introduction
- 2.1 Report Objectives and Scope
- 2.2 Product Definition and Industry Terminology
- 2.3 Market Inclusions and Exclusions
- 2.4 Research Process
- 2.4.1 Primary Research and Expert Interviews
- 2.4.2 Secondary Research and Source Review
- 2.4.3 Top-Down and Bottom-Up Estimation
- 2.4.4 Data Triangulation and Verification
- 2.5 Market Size Measurement Basis
- 2.5.1 2025: USD 1.57 billion → 2035: USD 12.82 billion
- 2.6 Historical and Forecast Reference Periods
- 2.6.1 Historical Period: 2018-2025
- 2.6.2 Base Year: 2025
- 2.6.3 Forecast Period: 2025-2035
- 2.7 Research Assumptions and Limitations
Chapter 3 Executive Summary
- 3.1 Market Snapshot and Key Findings
- 3.2 Base-Year Market Size, 2025
- 3.3 Forecast Market Size, 2035
- 3.4 Revenue and Volume Growth Outlook
- 3.5 Key Demand and Supply Indicators
- 3.6 Leading Market Segments
- 3.7 Fastest-Growing Market Opportunities
- 3.8 Regional Performance Highlights
- 3.9 Technology and Industry Transformation
- 3.10 Competitive Landscape Summary
- 3.11 Analyst View and Strategic Implications
Chapter 4 India Electric Two-Wheeler Market Trends and Developments
- 4.1 Historical Industry Development, 2018-2025
- 4.2 Recent Market Trends and Developments
- 4.3 Demand and Customer Behavior Trends
- 4.4 Technology and Product Innovation
- 4.5 Artificial Intelligence, Automation and Digitalization
- 4.6 Local Manufacturing and Supply Chain Realignment
- 4.7 Industry Partnerships, Mergers and Acquisitions
- 4.8 Sustainability and Circular Economy Developments
- 4.9 Government and Private Sector Investment Trends
- 4.10 Emerging Business Models and Commercialization
- 4.11 Industry Developments and Announcements
Chapter 5 India Electric Two-Wheeler Market Production, Supply and Demand Analysis
- 5.1 Demand Trend and Consumption Analysis, 2018-2025
- 5.2 Demand Forecast, 2025-2035
- 5.3 Production and Output Trend, 2018-2025
- 5.4 Production and Output Forecast, 2025-2035
- 5.5 Installed Capacity and Capacity Utilization
- 5.6 Company-Wise Production Plants and Statistics
- 5.6.1 Installed Production Capacity
- 5.6.2 Actual Production
- 5.6.3 Planned Capacity and Expansion Targets
- 5.7 Supply Chain Structure and Procurement Trends
- 5.8 Supply-Demand Gap and Bottlenecks
- 5.9 Import Dependence and Sourcing Structure
- 5.10 Contract Manufacturing and Outsourcing
- 5.11 Regional Supply and Demand Concentration
Chapter 6 India Electric Two-Wheeler Market Pricing Analysis
- 6.1 Pricing Structure and Measurement
- 6.2 Historical Pricing Trends, 2018-2025
- 6.3 Pricing Outlook, 2025-2035
- 6.4 Average Selling Price and Unit Economics
- 6.5 Pricing by Product and Market Segment
- 6.6 Geographic Pricing Differences
- 6.7 Key Input, Energy, Labor and Logistics Costs
- 6.8 Contract Pricing and Purchasing Models
- 6.9 Pricing Sensitivity and Competitive Positioning
- 6.10 Price, Margin and Profitability Implications
Chapter 7 India Electric Two-Wheeler Market Dynamics
- 7.1 Market Growth Drivers
- 7.1.1 Demand-Side Drivers
- 7.1.2 Technology and Innovation Drivers
- 7.1.3 Infrastructure and Investment Drivers
- 7.1.4 Regulatory and Policy Drivers
- 7.2 Market Restraints
- 7.2.1 Cost and Affordability Constraints
- 7.2.2 Technology and Adoption Barriers
- 7.2.3 Supply Chain and Operational Constraints
- 7.3 Market Challenges
- 7.3.1 Competitive Pressure and Margin Erosion
- 7.3.2 Skills, Infrastructure and Implementation Gaps
- 7.4 Emerging Market Opportunities
- 7.5 Market Dynamics Impact and Time-Horizon Assessment
Chapter 8 India Electric Two-Wheeler Value Chain Analysis
- 8.1 Industry Value Chain Overview
- 8.2 Upstream Suppliers and Critical Inputs
- 8.3 Technology and Component Providers
- 8.4 Manufacturing or Service Delivery
- 8.5 Distribution, Channel Partners and Integrators
- 8.6 Downstream Applications and End Users
- 8.7 Value Addition and Profit Pools
- 8.8 Vertical Integration and Outsourcing
- 8.9 Supplier Concentration and Risk
- 8.10 Supply Chain Localization and Resilience
Chapter 9 India Electric Two-Wheeler Market Regulations and Policies
- 9.1 Relevant Laws, Standards and Compliance Frameworks
- 9.2 Product, Service, Safety and Quality Requirements
- 9.3 Government Policies, Incentives and Subsidies
- 9.4 Imports, Exports and Trade Barriers
- 9.5 Public Procurement and Local Content Requirements
- 9.6 Environmental and Sustainability Compliance
- 9.7 Upcoming Policy Changes and Market Implications
Chapter 10 India Electric Two-Wheeler Market Hotspots and Opportunities
- 10.1 Market Opportunity Mapping and Growth Hotspots
- 10.2 High-Growth Applications and Customer Groups
- 10.3 Underserved Markets and White-Space Opportunities
- 10.4 Emerging Technology and Product Opportunities
- 10.5 New Capacity and Investment Hotspots
- 10.6 Market Entry and Expansion Opportunities
- 10.7 Distribution and Partnership Opportunities
- 10.8 Near-Term and Long-Term Commercial Potential
- 10.9 Opportunity Attractiveness and Execution Risks
Chapter 11 India Electric Two-Wheeler Market Outlook, 2025-2035
- 11.1 Market Size and Analysis
- 11.1.1 Revenue (Market Measurement: 2025: USD 1.57 billion → 2035: USD 12.82 billion)
- 11.1.2 Market Volume and Quantity Sold
- 11.1.3 Historical Market Size, 2018-2025
- 11.1.4 Base-Year Market Size, 2025
- 11.2 Market Forecast, 2025-2035
- 11.2.1 Revenue Forecast to 2035
- 11.2.2 Volume Forecast to 2035
- 11.2.3 CAGR and Year-on-Year Growth
- 11.2.4 Incremental Revenue Opportunity
- 11.3 Forecast Assumptions and Scenario Analysis
- 11.3.1 Base-Case Forecast
- 11.3.2 Optimistic and Conservative Scenarios
- 11.3.3 Technology, Pricing and Policy Sensitivities
- 11.4 Market Attractiveness and Growth Outlook
Chapter 12 India Electric Two-Wheeler Market Segmentation and Outlook
- 12.1 Segmentation Summary and Market Shares, 2025
- 12.2 Largest and Fastest-Growing Segments
- 12.3 By Vehicle Type - Market Size and Forecast, 2025-2035
- 12.3.1 Segment Definition and Scope
- 12.3.2 Historical Market Size, 2018-2025
- 12.3.3 Revenue Forecast, 2025-2035
- 12.3.4 Volume Forecast, 2025-2035
- 12.3.5 Base-Year Market Share, 2025
- 12.3.6 Segment CAGR and Growth Drivers
- 12.3.7 Subsegment Market Size and Forecast
- 12.3.7.1 Electric Scooters
- 12.3.7.2 Electric Motorcycles
- 12.3.7.3 Electric Mopeds
- 12.3.8 Subsegment Pricing and Adoption Trends
- 12.3.9 Leading Suppliers and Competition
- 12.3.10 Regional Demand and Opportunities
- 12.4 By Battery Type - Market Size and Forecast, 2025-2035
- 12.4.1 Segment Definition and Scope
- 12.4.2 Historical Market Size, 2018-2025
- 12.4.3 Revenue Forecast, 2025-2035
- 12.4.4 Volume Forecast, 2025-2035
- 12.4.5 Base-Year Market Share, 2025
- 12.4.6 Segment CAGR and Growth Drivers
- 12.4.7 Subsegment Market Size and Forecast
- 12.4.7.1 Fixed Lithium-ion Batteries
- 12.4.7.2 Removable Lithium-ion Batteries
- 12.4.7.3 Swappable Battery Systems
- 12.4.8 Subsegment Pricing and Adoption Trends
- 12.4.9 Leading Suppliers and Competition
- 12.4.10 Regional Demand and Opportunities
- 12.5 By Customer Type - Market Size and Forecast, 2025-2035
- 12.5.1 Segment Definition and Scope
- 12.5.2 Historical Market Size, 2018-2025
- 12.5.3 Revenue Forecast, 2025-2035
- 12.5.4 Volume Forecast, 2025-2035
- 12.5.5 Base-Year Market Share, 2025
- 12.5.6 Segment CAGR and Growth Drivers
- 12.5.7 Subsegment Market Size and Forecast
- 12.5.7.1 Private Individual Buyers
- 12.5.7.2 Commercial Fleet Operators
- 12.5.7.3 Corporate and Institutional Buyers
- 12.5.8 Subsegment Pricing and Adoption Trends
- 12.5.9 Leading Suppliers and Competition
- 12.5.10 Regional Demand and Opportunities
- 12.6 By Price Tier - Market Size and Forecast, 2025-2035
- 12.6.1 Segment Definition and Scope
- 12.6.2 Historical Market Size, 2018-2025
- 12.6.3 Revenue Forecast, 2025-2035
- 12.6.4 Volume Forecast, 2025-2035
- 12.6.5 Base-Year Market Share, 2025
- 12.6.6 Segment CAGR and Growth Drivers
- 12.6.7 Subsegment Market Size and Forecast
- 12.6.7.1 Value
- 12.6.7.2 Mid-Market
- 12.6.7.3 Premium
- 12.6.8 Subsegment Pricing and Adoption Trends
- 12.6.9 Leading Suppliers and Competition
- 12.6.10 Regional Demand and Opportunities
- 12.7 Segment Growth Comparison
- 12.8 Segment Attractiveness and Priority Matrix
Chapter 13 India Electric Two-Wheeler End-Use and Application Market Outlook
- 13.1 End-Use Industry and Customer Demand Structure
- 13.2 Leading Applications and Customer Groups
- 13.3 End-Use Market Size, Share and Forecast
- 13.4 Major End-Use Industry Deep Dives
- 13.4.1 Customer Requirements and Use Cases
- 13.4.2 Demand and Replacement Cycles
- 13.4.3 Technical and Regulatory Considerations
- 13.4.4 Purchasing and Procurement Models
- 13.4.5 Leading Vendors and Distribution Channels
- 13.4.6 Forecast and Commercial Opportunities
- 13.5 Emerging Applications and Cross-Segment Demand
- 13.6 End-Use Industry Investment Priorities
Chapter 14 India Electric Two-Wheeler Geographic Market Outlook, 2025-2035
- 14.1 Domestic Market Distribution and Demand Clusters
- 14.2 State- or Province-Wise Market Size and Forecast, 2025-2035
- 14.3 City and Metropolitan Market Outlook
- 14.4 Industrial, Manufacturing and Commercial Clusters
- 14.5 Geographic Concentration of Key End Users
- 14.6 Local Pricing and Purchasing Differences
- 14.7 Domestic Production Facilities and Capacity Map
- 14.8 Local Infrastructure and Project Pipeline
- 14.9 State-Level Policy and Incentive Differences
- 14.10 Subnational Investment Hotspots and Opportunities
- 14.11 Distribution and Logistics Networks
- 14.12 Domestic Competitive Footprint
Chapter 15 India Electric Two-Wheeler Technology, Innovation and Sustainability Outlook
- 15.1 Technology Landscape and Maturity
- 15.2 Product, Process and Service Innovation
- 15.3 AI, Automation and Digital Tools in the Industry
- 15.4 Technology Adoption and Performance Benchmarking
- 15.5 Innovation Pipeline and R&D Investment
- 15.6 Patent and Intellectual Property Trends
- 15.7 Energy Efficiency and Resource Management
- 15.8 Sustainability, Recycling and Circularity
- 15.9 Technology Roadmap, 2025-2035
- 15.10 Risks of Obsolescence and Technology Substitution
Chapter 16 India Electric Two-Wheeler Market Key Strategic Imperatives
- 16.1 Growth and Market Entry Priorities
- 16.2 High-Return Products and Segments
- 16.3 Pricing, Profitability and Cost Optimization
- 16.4 Technology Investment and Product Differentiation
- 16.5 Supply Chain Localization and Resilience
- 16.6 Distribution and Customer Acquisition
- 16.7 Partnership, Acquisition and Capacity Strategy
- 16.8 Regional Expansion Priorities
- 16.9 Short-, Medium- and Long-Term Actions
Chapter 17 Competition Outlook
- 17.1 Industry Competition Characteristics
- 17.2 Market Structure and Concentration
- 17.3 Market Share and Competitive Positioning, 2025
- 17.4 Company-Wise Revenue and Product Benchmarking
- 17.5 Production and Service Capacity Benchmarking
- 17.6 Technology, Pricing and Differentiation
- 17.7 Regional Footprint and Distribution Strength
- 17.8 Mergers, Acquisitions and Strategic Alliances
- 17.9 New Entrants and Competitive Threats
- 17.10 Porter's Five Forces and Industry Attractiveness
- 17.11 Competitive Outlook, 2025-2035
Chapter 18 Company Profiles
- 18.1 Company Coverage and Selection Criteria
- 18.2 TVS Motor Company Ltd
- 18.2.1 Business Description
- 18.2.2 Company Ownership and Geographic Presence
- 18.2.3 Product and Service Portfolio
- 18.2.4 Manufacturing and Operating Footprint
- 18.2.5 Production Capacity and Expansion Plans
- 18.2.6 Financial Performance and Investment
- 18.2.7 Market Share and Competitive Position
- 18.2.8 Technology and Innovation Capabilities
- 18.2.9 Strategic Alliances or Partnerships
- 18.2.10 Recent Developments
- 18.2.11 Growth Strategy and Outlook
- 18.3 Bajaj Auto Ltd
- 18.4 Ather Energy Ltd
- 18.5 Ola Electric Mobility Ltd
- 18.6 Hero MotoCorp Ltd
- 18.7 Greaves Electric Mobility Pvt Ltd
- 18.8 BGauss Auto Pvt Ltd
- 18.9 PURE EV
- 18.10 River Mobility Pvt Ltd
- 18.11 Kinetic Green Energy & Power Solutions Ltd
- 18.12 Other Relevant Market Participants
Note: Every listed company is profiled on the structure shown under the first company. The company list is preliminary and may change based on research findings, market developments, data availability and client requirements.
Chapter 19 Disclaimer
- 19.1 Research and Forecast Disclaimer
- 19.2 Data Source and Estimation Limitations
Note: The depth of individual sections depends on data availability for this market. Volume, capacity, trade and other unit-based metrics are included where applicable.

