
New airports, hotel tax relief and SME programs lift trips
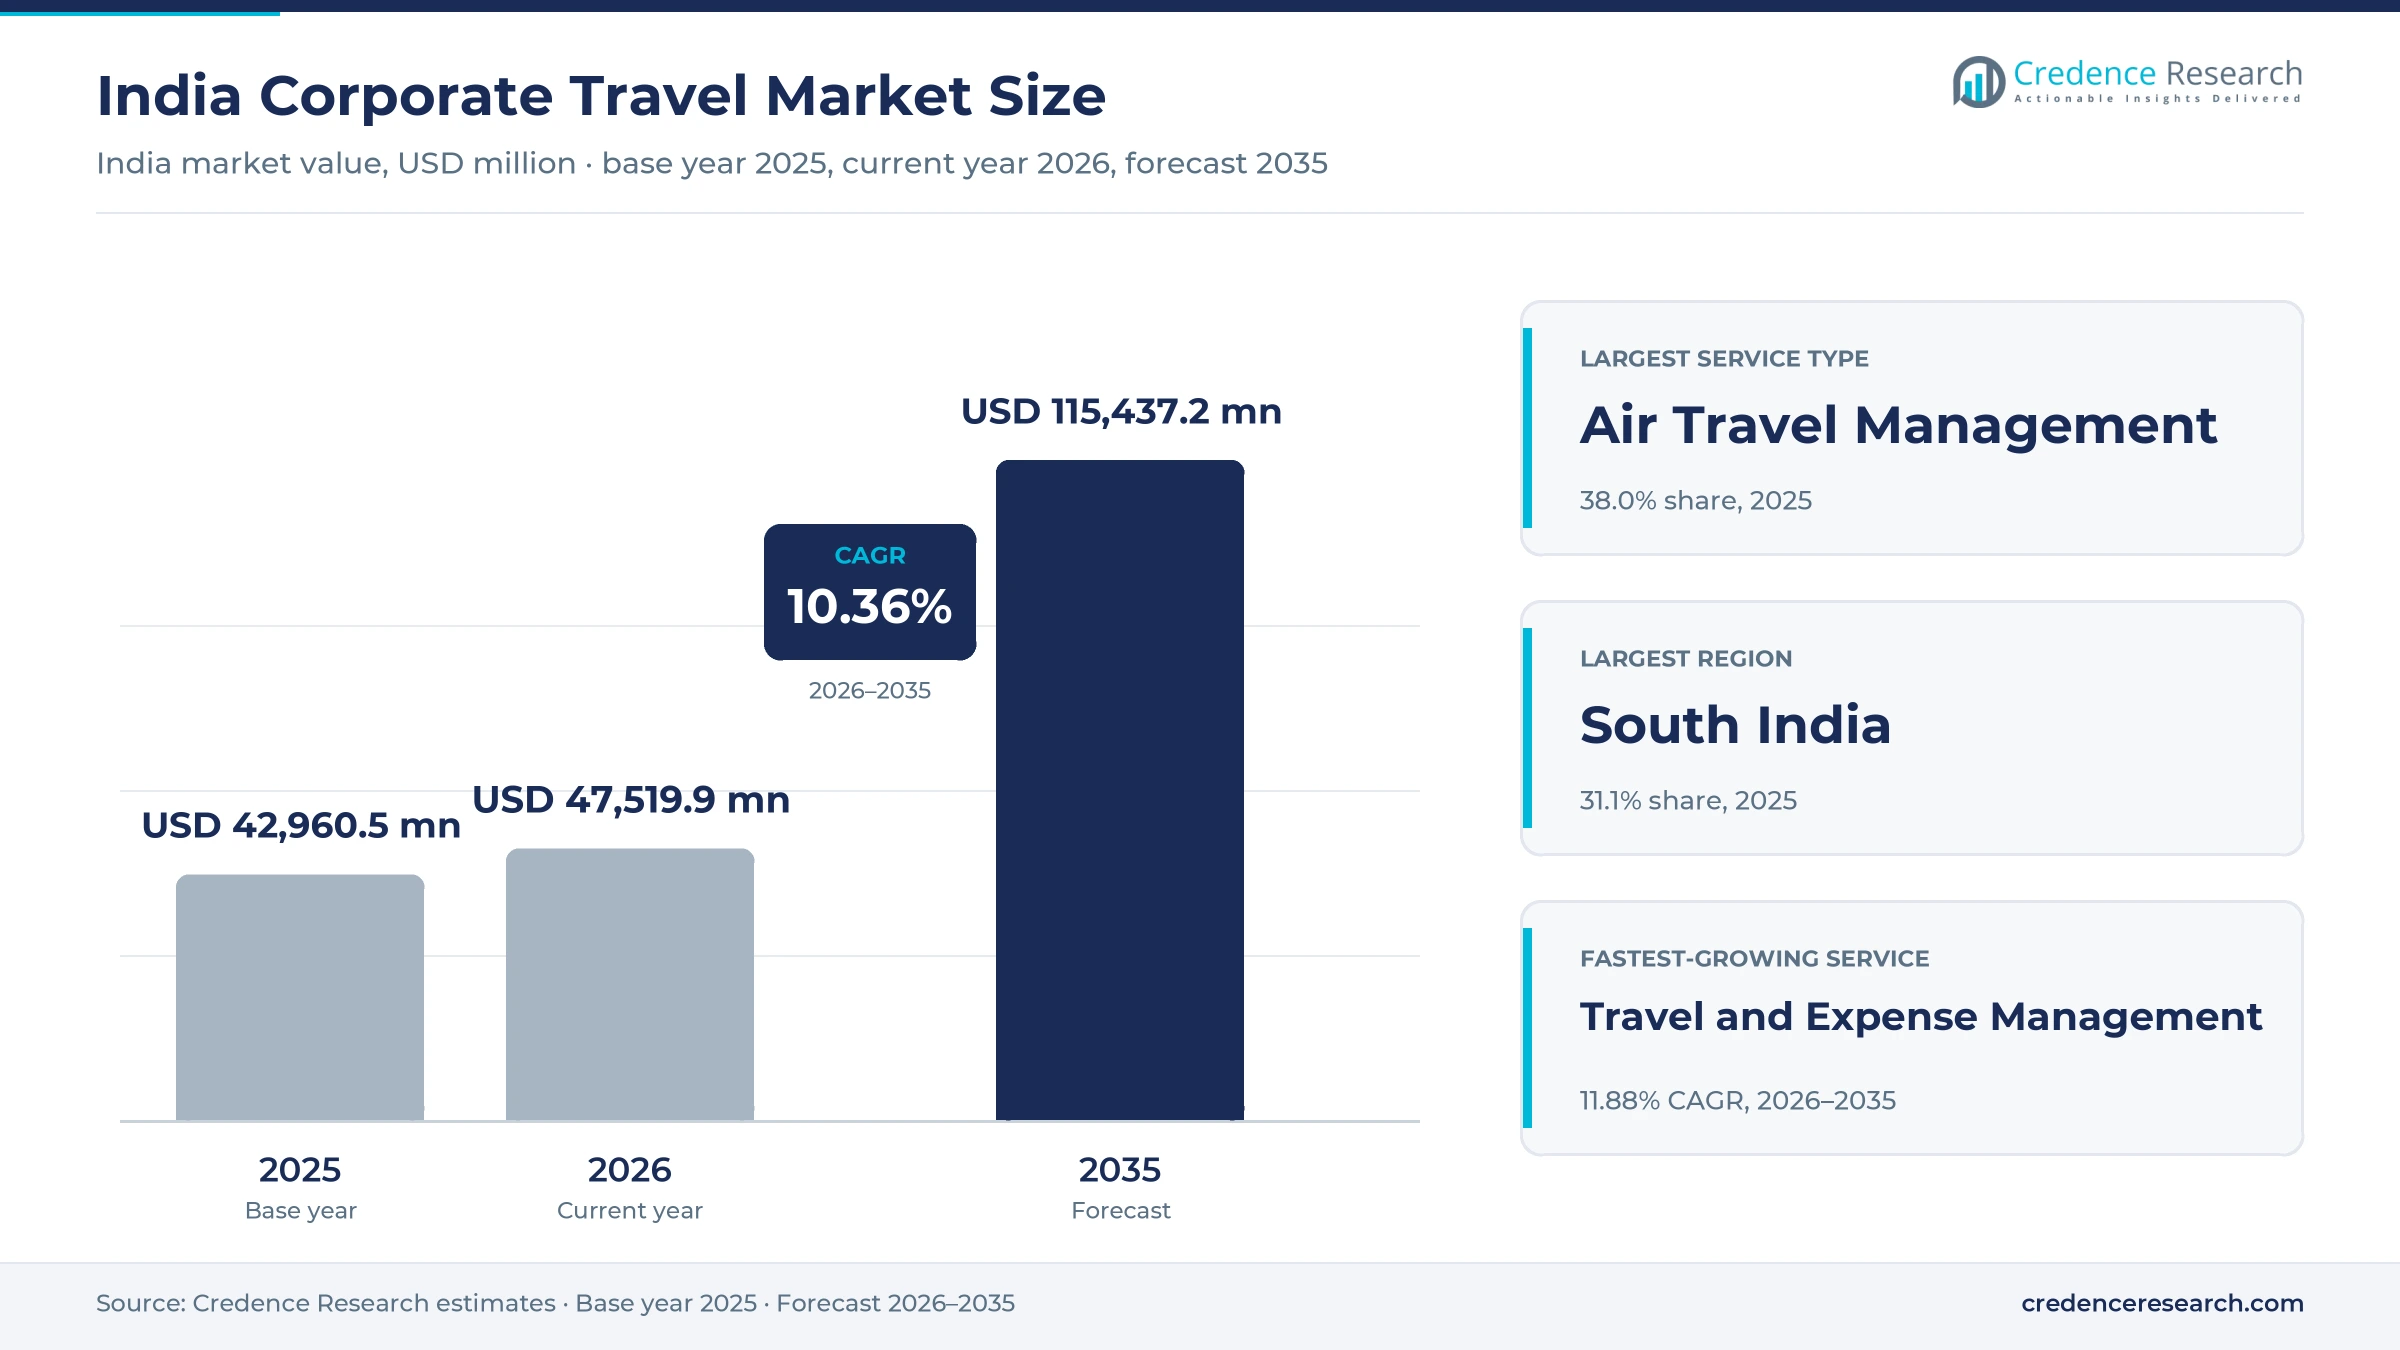
The India corporate travel market was valued at USD 42.96 billion in 2025 and is projected to increase from USD 47.52 billion in 2026 to USD 115.44 billion by 2035, registering a CAGR of 10.36% during 2026–2035. Demand comes from faster economic growth, more client visits by services and manufacturing firms, and a larger network of airports, hotels and rail links that makes short work trips easier to plan. South India held the largest regional share, 31.1% in 2025, because Bengaluru, Hyderabad and Chennai concentrate technology, banking operations and global capability centers. East and Central India grows fastest at 11.13% a year, as new airports and industrial projects pull more site visits into smaller cities. The GST rate on hotel rooms priced up to Rs 7,500 a night fell from 12% to 5% on Sept. 22, 2025, which lowers the cost of mid-priced stays for traveling staff. Expense platforms linked to booking tools are also helping finance teams control spending more closely.
Which business trip costs does this estimate count?
The estimate measures spending by companies and public bodies in India on employee trips taken for work, including air tickets, hotel stays, ground transport and rail, and meetings, incentives, conferences and exhibitions. It also counts transaction fees, subscription fees, management fees and the travel and expense software that companies pay for to book, approve and settle these trips. Values are stated in USD million at current prices, converted from Indian rupees at average annual exchange rates.
The estimate excludes leisure trips that employees pay for themselves, inbound trips paid by foreign firms, and visa and insurance fees charged by governments. It also excludes the internal cost of in-house travel desks that do not buy any outside service. The value chain runs from airlines, hotels, cab firms and rail operators through travel management companies and booking platforms to finance, human resources and procurement teams inside client companies.
India Corporate Travel Market Insights
- The India corporate travel market was valued at USD 42.96 billion in 2025 and is projected to reach USD 115.44 billion by 2035, registering a CAGR of 10.36% during 2026–2035.
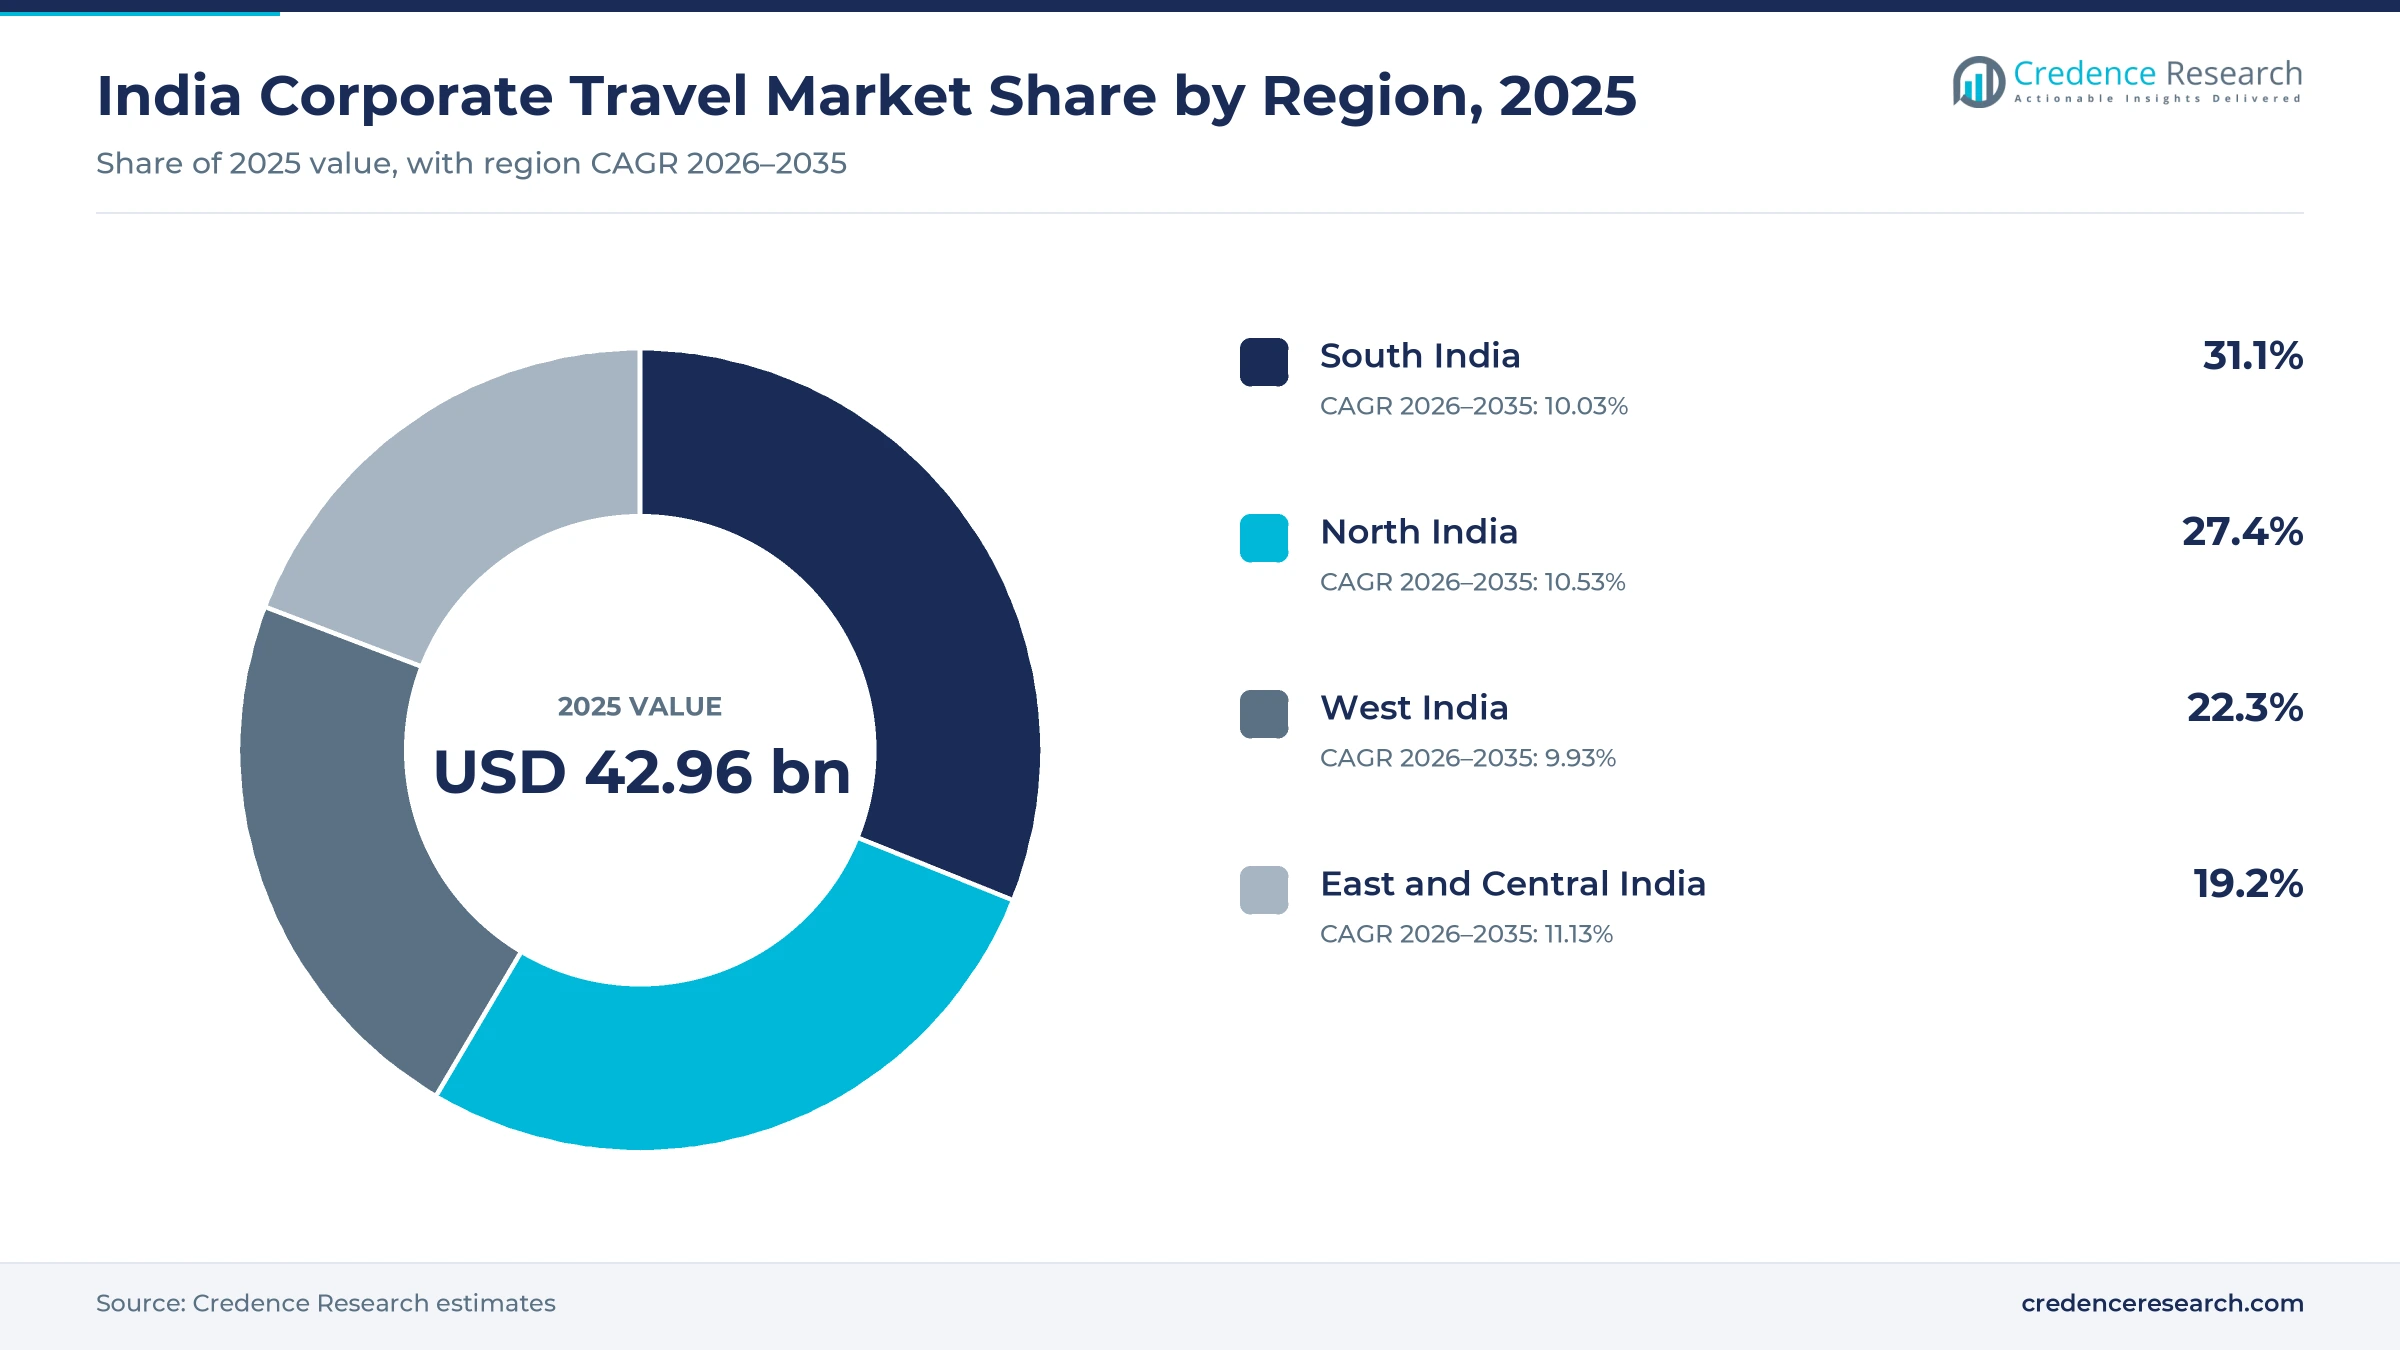
- South India held 31.1% of 2025 value, because technology hubs and global capability centers in three southern cities generate frequent client and team trips.
- Air travel management led with 38.0% of 2025 value, since domestic flights remain the default mode for trips between major business cities.
- India had 166 operational airports and an annual passenger handling capacity above 580 million, according to a government reply in August 2026.
- Small and medium businesses grow fastest among customer types at 11.49% a year, as booking platforms sign up tens of thousands of smaller firms during 2026–2035.
Air bookings and large companies hold most of the spend
Why does air ticketing still dominate business trip spending?
Based on service type, the market is categorized into air travel management, accommodation management, ground mobility and rail, meetings, incentives, conferences and exhibitions, and travel and expense management. Air Travel Management led with 38.0% of 2025 value, because long distances between business cities make flights the main cost of most trips. Travel and Expense Management grows fastest at 11.88% a year, as finance teams link booking, approval and reimbursement.
Why do large enterprises account for most managed travel spend?
Based on customer type, the market is categorized into large enterprises, mid-market enterprises, small and medium businesses, and government and public sector buyers. Large Enterprises led with 46.0% of 2025 value, because large firms run sales, audit and project teams that travel every week. Small and Medium Businesses grow fastest at 11.49% a year, as self-service platforms bring formal travel policies to smaller firms.
Which industries send employees on the most work trips?
Based on end-use industry, the market is categorized into IT and business services, banking, financial services and insurance, manufacturing and automotive, pharmaceuticals and healthcare, and energy, infrastructure and professional services. IT and Business Services led with 30.0% of 2025 value, because client delivery and global capability centers need constant travel. Manufacturing and Automotive grows fastest at 10.97% a year, as plant and supplier visits rise.
Why are self-booking platforms gaining on full-service programs?
Based on delivery model, the market is categorized into fully managed travel programs, hybrid managed travel, self-booking platforms and concierge and offline servicing. Fully Managed Travel Programs led with 41.0% of 2025 value, because large companies want a single partner for policy, duty of care and reporting. Self-Booking Platforms grow fastest at 11.67% a year, as employees book on mobile apps within preset limits.
| Segment Group | Leading Sub-segment | Share, 2025 | Fastest-growing Sub-segment | CAGR, 2026–2035 |
|---|---|---|---|---|
| By Service Type | Air Travel Management | 38.0% | Travel and Expense Management | 11.88% |
| By Customer Type | Large Enterprises | 46.0% | Small and Medium Businesses | 11.49% |
| By End-Use Industry | IT and Business Services | 30.0% | Manufacturing and Automotive | 10.97% |
| By Delivery Model | Fully Managed Travel Programs | 41.0% | Self-Booking Platforms | 11.67% |
Request a Free Sample
Fill in your details and we'll send you a free sample report.
- Sample data tables & charts
- Research methodology
Client visits, airport capacity and payments drive trips
How does enterprise expansion lift face-to-face selling trips?
Enterprise expansion lifts work travel, because new clients, plants and offices still require face-to-face meetings, audits and site visits. Real GDP grew by 7.7% in 2025-26, according to provisional estimates released on June 5, 2026, with double-digit growth reported in manufacturing, trade, hotels and transport. MakeMyTrip said in February 2026 that its business travel platforms served 500 large enterprises, including 150 of the BSE 500 companies, and about 75,000 small and medium businesses. The same platforms covered more than 40 lakh employees across these client companies. As a result, IT and business services lead end-use demand with 30.0% of 2025 value, while client-facing teams in banking and manufacturing add frequent short trips between major cities.
Why does aviation and hotel capacity expansion widen trip options?
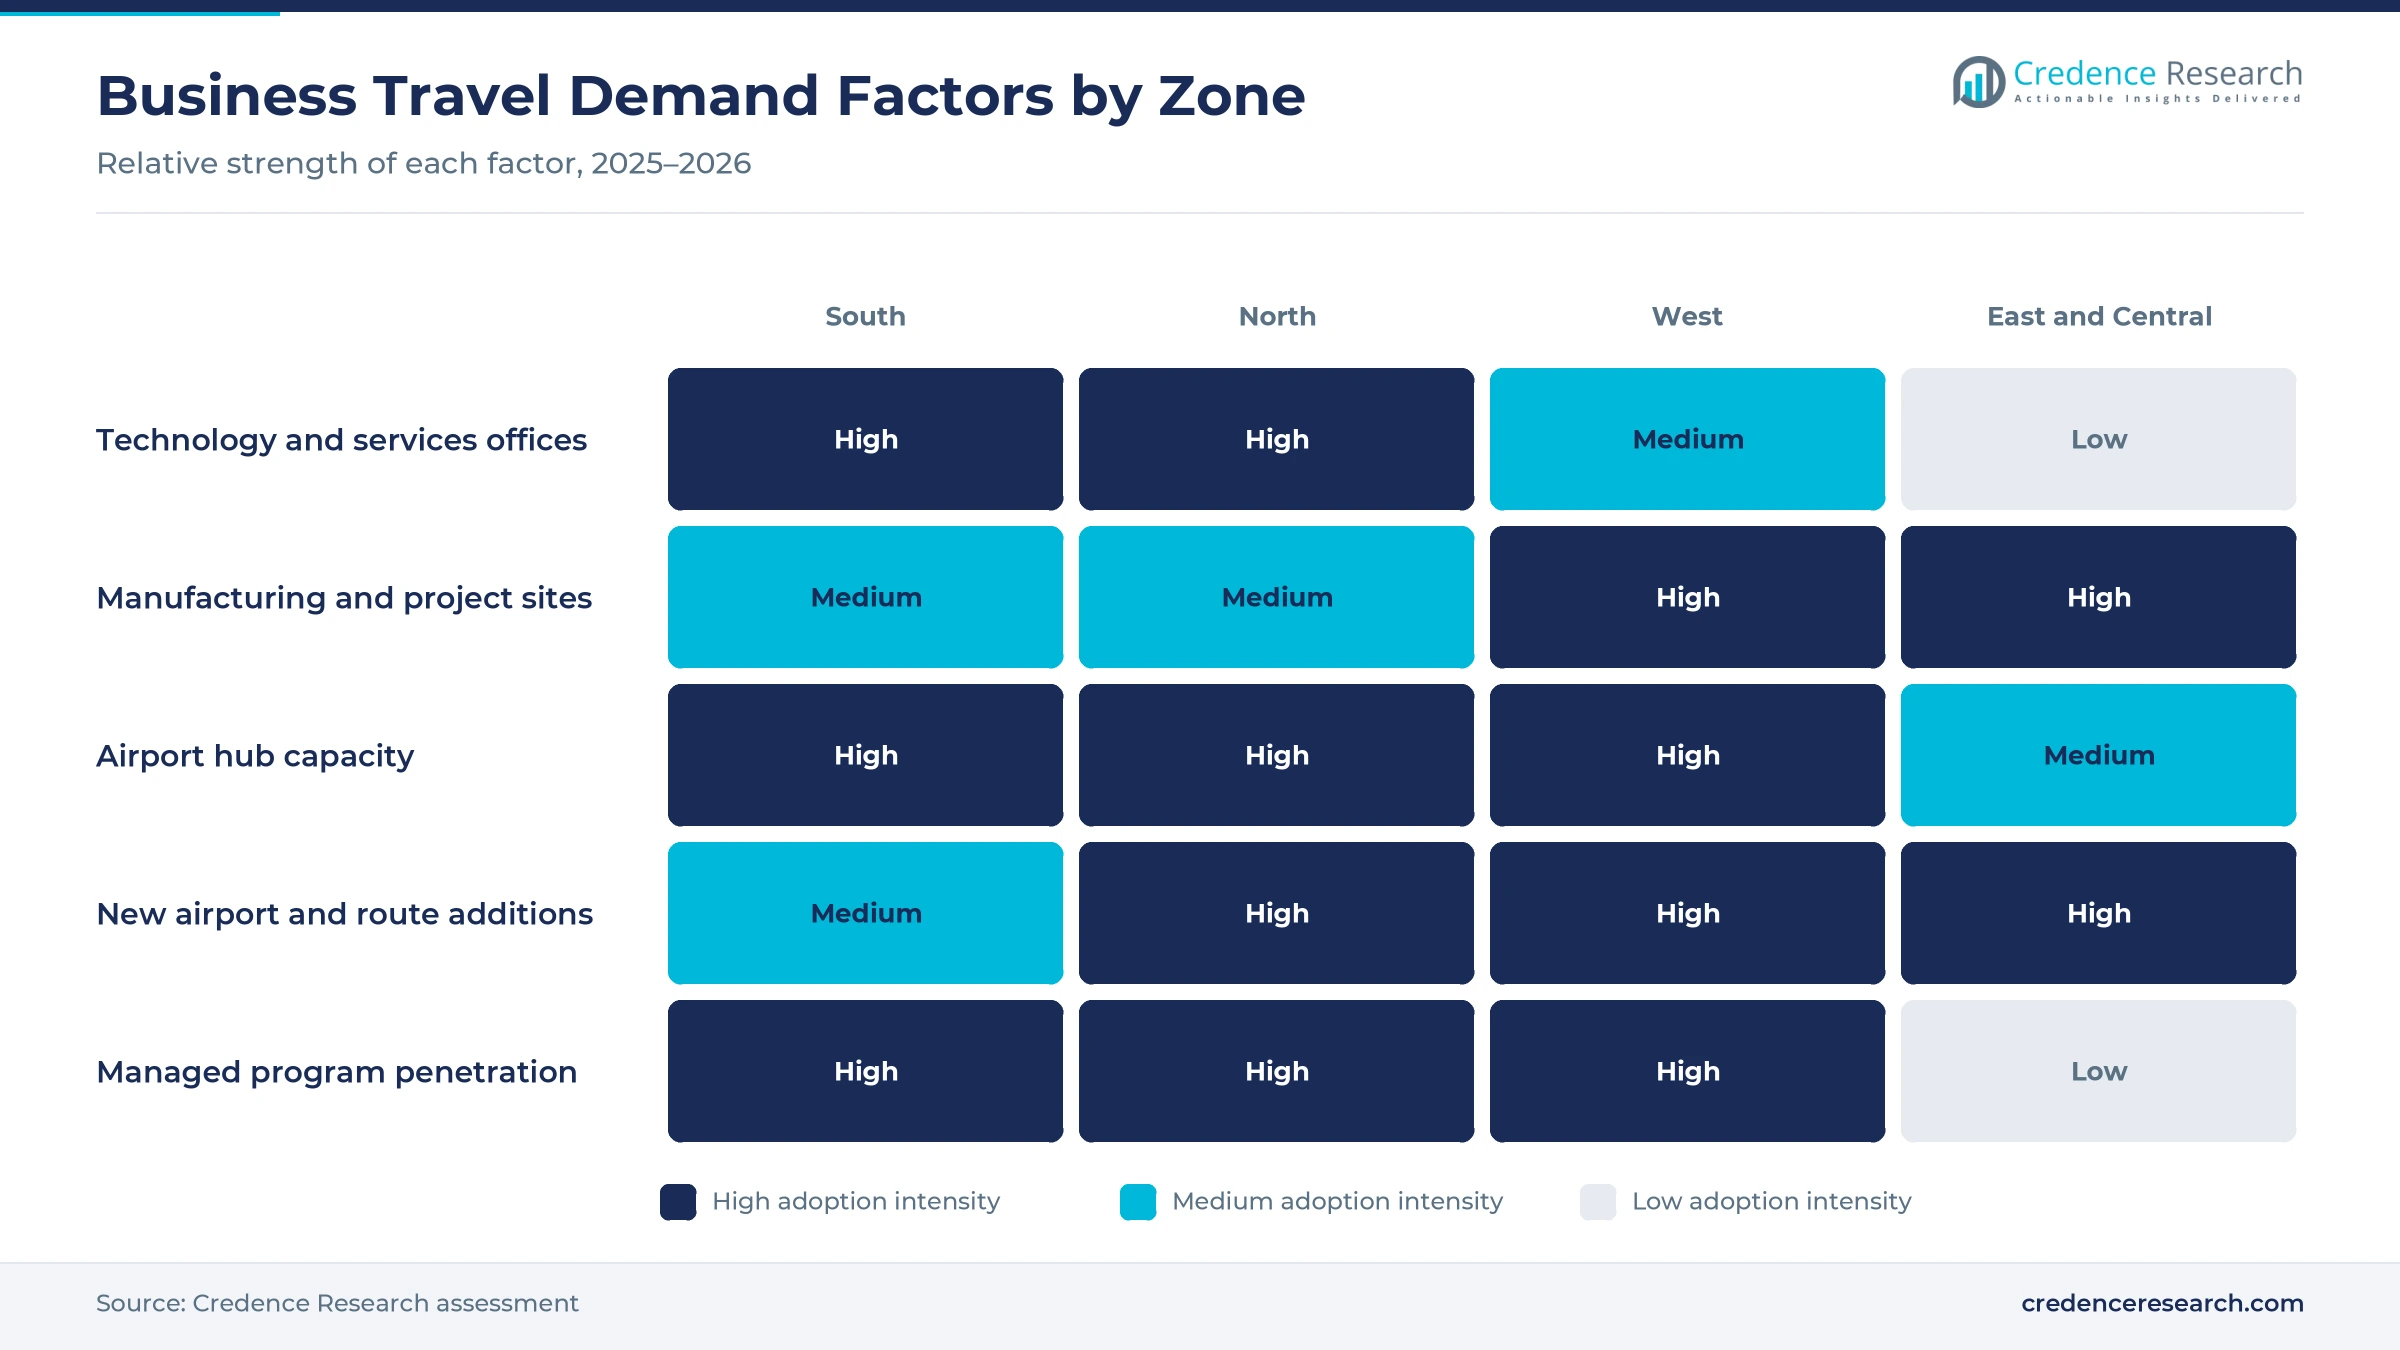
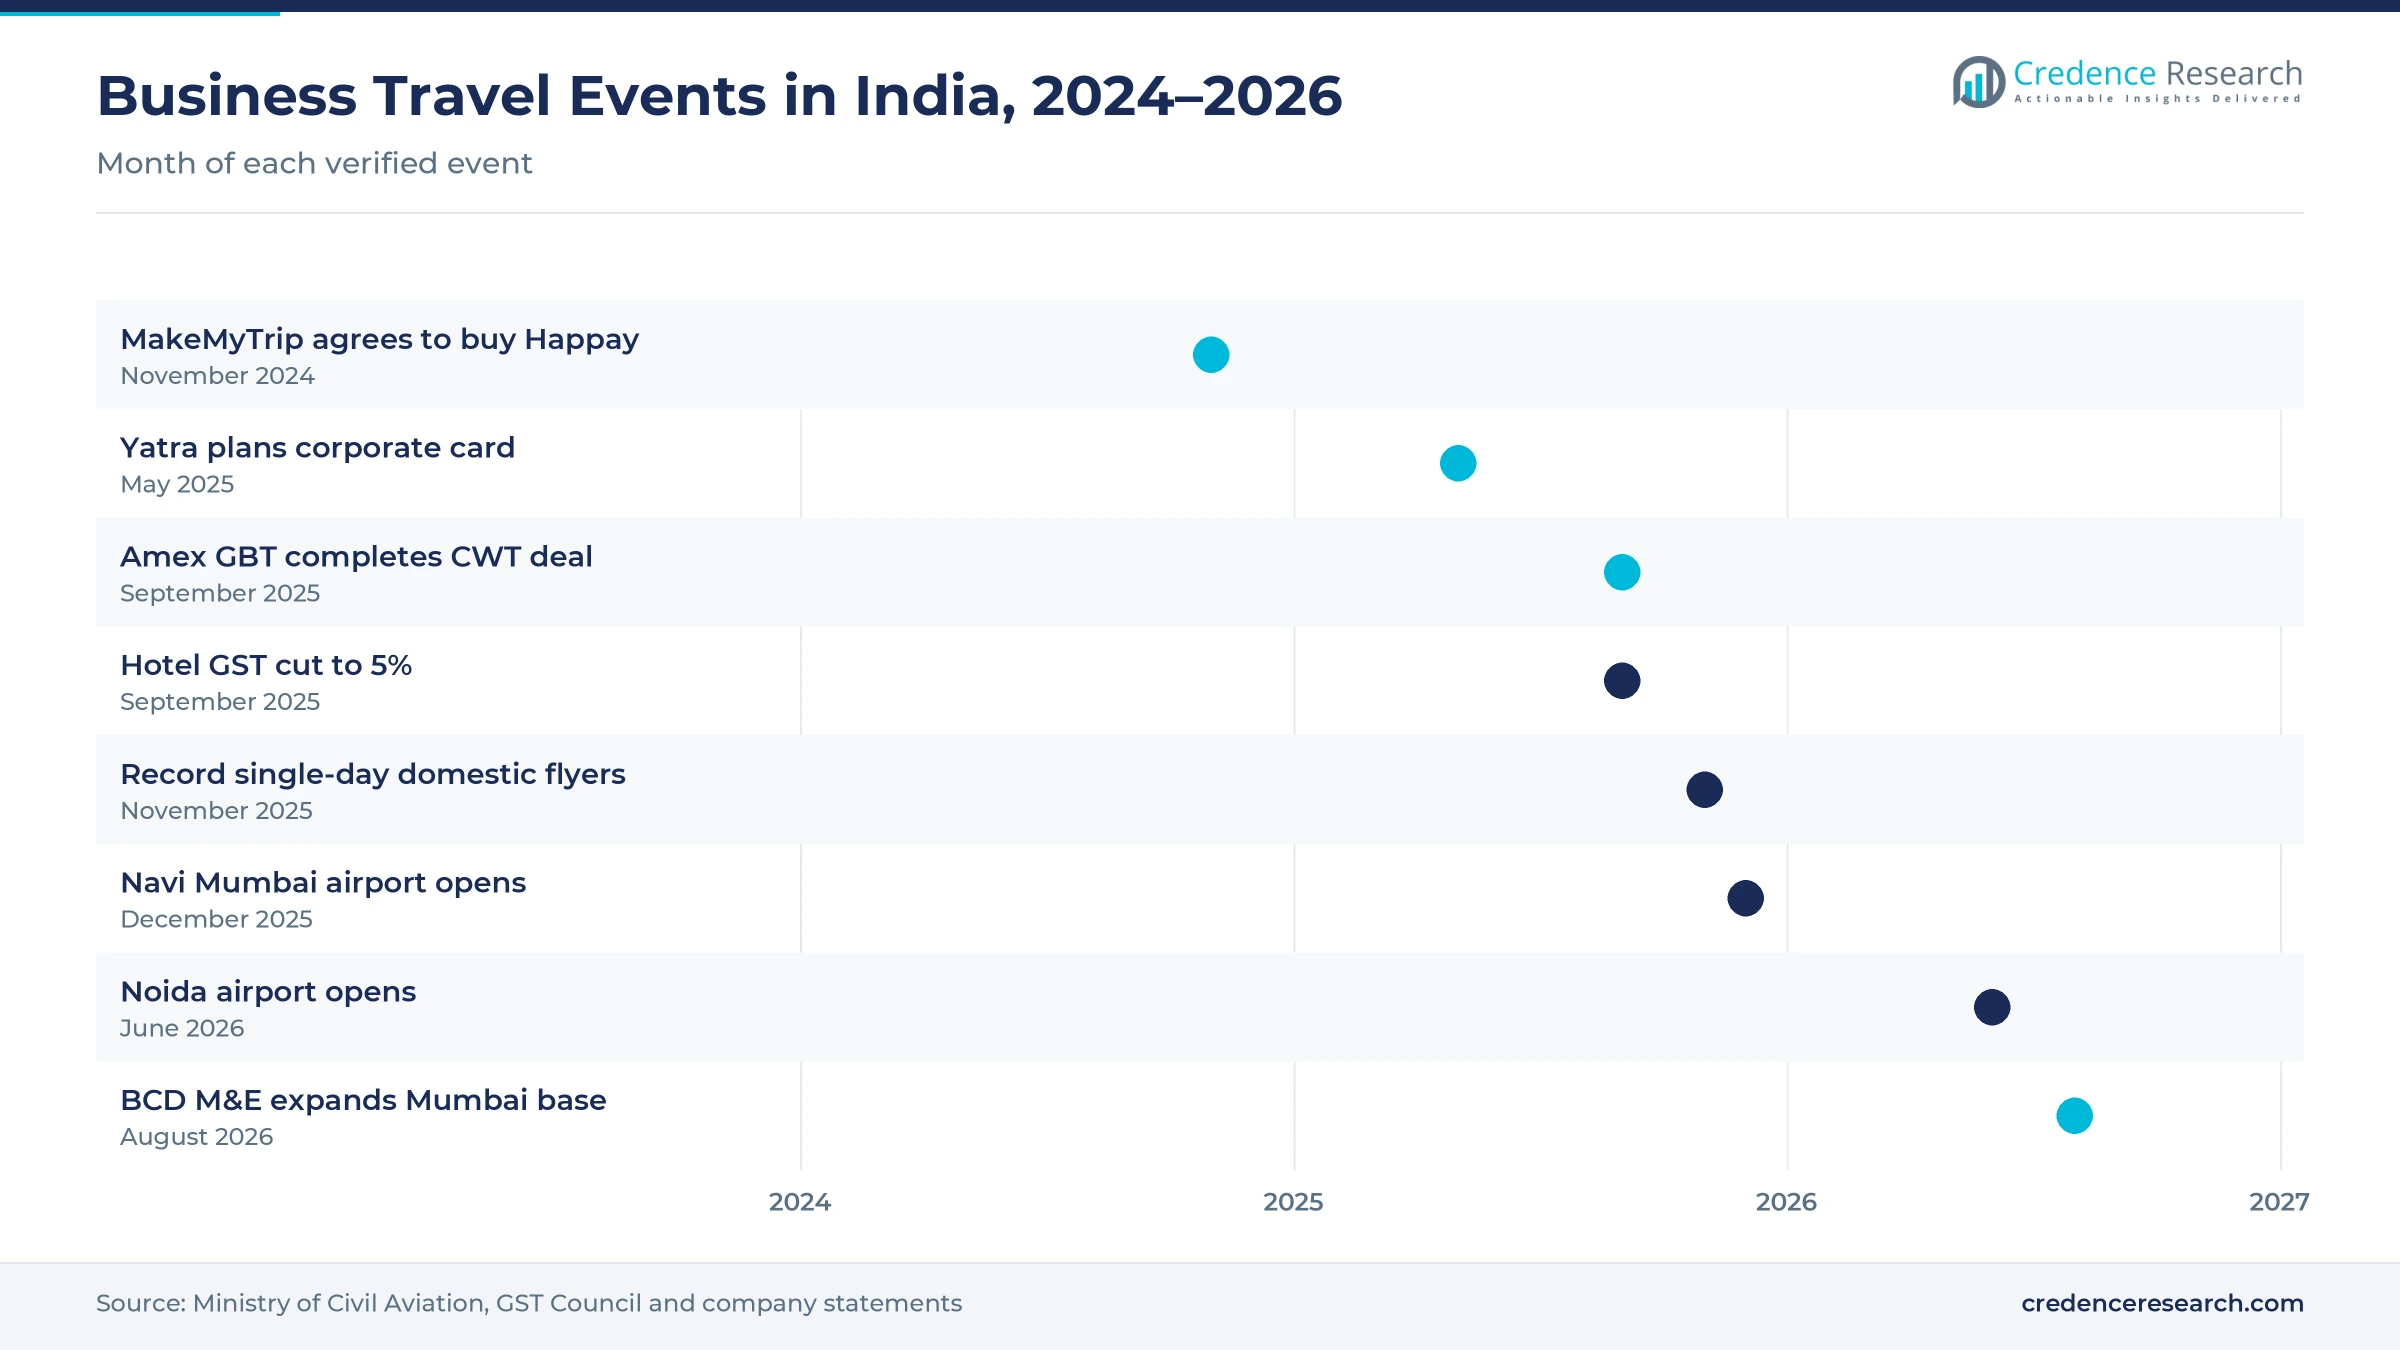
Aviation and hospitality capacity expansion widens trip options, because more airports, routes and rooms cut travel time and reduce price spikes on busy routes. India had 166 operational airports and annual passenger handling capacity above 580 million in 2026, according to a government reply reported in August 2026. Indian airlines operated about 860 aircraft and had placed orders for 2,056 more, of which 427 had been delivered. Navi Mumbai International Airport began commercial flights on Dec. 25, 2025, and Noida International Airport started commercial service on June 15, 2026. Consequently, air travel management keeps 38.0% of 2025 value, and more cities become reachable for one-day business trips.
How does digital travel and payment modernization change buying?
Digital travel and payment modernization changes how companies buy trips, because instant payments and app-based booking cut manual approvals and reconciliation work. UPI processed about 228 billion transactions worth nearly Rs 300 lakh crore in calendar 2025, according to NPCI data reported in January 2026. MakeMyTrip agreed on Nov. 18, 2024, to acquire the Happay expense management platform from CRED, which had more than 900 corporate clients. Yatra also said in May 2025 that it planned a co-branded corporate card for business customers. In turn, digital tools spread across company travel, although fully managed programs still hold 41.0% of 2025 value.
Why does lower hotel tax support mid-priced business stays?
Lower hotel tax supports demand for mid-priced business stays, because room cost is the second-largest item in most company travel budgets. The GST rate on hotel rooms priced up to Rs 7,500 a night fell from 12% to 5% without input tax credit from Sept. 22, 2025. This change lowered the bill for many business hotels in tier-two cities, where room rates usually sit below that threshold. Thomas Cook India also lists Sterling Holiday Resorts, with more than 55 resorts and hotels across 48 locations, among its meetings and conference venues. As a result, accommodation management holds a large share of spending, and companies can extend site visits without breaching per-night limits.
Expense platforms, SME accounts and MICE events gain ground
How is the shift to linked booking and expense platforms playing out?
Companies are shifting toward platforms that link booking, approval, payment and expense claims in one flow, because finance teams want cleaner data and faster closing. MakeMyTrip now groups Quest2Travel, myBiz and Happay as its business travel platforms, and these contributed more than 10% of its overall bookings, according to its February 2026 statement. The company also plans to add foreign exchange and visa support for staff traveling abroad. Yatra said it served about 1,150 to 1,200 clients in managed business travel in 2025. Consequently, travel and expense management grows fastest by service type at 11.88% a year, and hybrid programs gain share among mid-sized companies.
Why is the rise of SME and mid-market onboarding reshaping demand?
The rise of small and mid-market buyers is reshaping demand, because cloud tools let smaller firms set travel policies without a dedicated travel desk. MakeMyTrip reported about 75,000 small and medium business clients in February 2026, far more than its 500 large enterprise accounts. Yatra added 148 business travel clients during fiscal 2025, which shows steady growth in new account signings. FCM also named a new managing director for India and said the market is very important for its Asian business. As a result, small and medium businesses grow fastest by customer type at 11.49% a year, while self-booking platforms expand at 11.67% a year.
Can meetings, incentives and events open new revenue for travel managers?
Meetings, incentives and events offer a clear opening, because companies are bringing sales teams, dealers and partners together more often after years of virtual meetings. Yatra said its acquisition of Globe Travels placed it among the top three providers of conferences and incentive events in the country. BCD Meetings & Events expanded its Mumbai headquarters in August 2026 and now has teams in New Delhi, Bengaluru and Hyderabad. BCD Meetings & Events has about 2,200 staff across its global offices. Thomas Cook India also lists Sterling Holiday Resorts, with more than 55 resorts across 48 locations, among its conference venues. Therefore, meetings, incentives, conferences and exhibitions grow faster than the overall market.
Will new airports in second cities create an opening for managed programs?
New airports in second cities create an opening for managed programs, because companies can add direct flights to plants, branches and project sites that once needed long road trips. The UDAN regional scheme had put 657 routes into operation across 93 unserved and underserved airports by late 2025, carrying more than 1.59 crore passengers. Domestic airlines also carried a record 5,38,429 departing passengers in a single day on Nov. 23, 2025, according to the Ministry of Civil Aviation. World Bank data show air passengers carried in India rose to about 180.4 million in 2023 from 140.0 million in 2022. As a result, managed programs reach more plants and branches, while large enterprises still hold 46.0% of spending.
Fare swings, policy leakage and data rules weigh on buyers
How do fare swings and schedule disruption raise trip costs?
Fare swings and schedule disruption raise trip costs, because a few large airlines control most domestic seats and fares jump when capacity tightens. Late bookings, cancellations and crew shortages force travel managers to rebook staff at higher fares. As a result, finance teams face budget overruns that are hard to forecast. Companies respond by negotiating corporate fares, setting advance booking rules and using rail or road for shorter routes where possible.
Why does policy leakage weaken savings from managed programs?
Policy leakage weakens savings, because employees often book directly with airlines or hotels when they find a lower fare or want loyalty points. These bookings sit outside the travel program, so companies lose negotiated rates, safety tracking and clean data for audits. In turn, travel managers struggle to prove savings to finance leaders. Linked expense tools that flag out-of-policy bookings help reduce this leakage over time.
How do data protection rules add compliance work for travel firms?
Data protection rules add compliance work, because travel platforms hold passport details, phone numbers and travel histories of millions of employees. Firms must obtain clear consent, store data securely and respond to breaches quickly under India's new data protection framework. Consequently, smaller travel agencies face higher technology and legal costs. Larger travel management companies spread these costs across many accounts, which can widen the gap between large and small providers.
Why do thin margins limit service levels for smaller accounts?
Thin margins limit service levels for smaller accounts, because airlines pay little or no commission and clients resist higher transaction fees. Travel managers must cover round-the-clock support, duty of care and reporting from small fees per booking. As a result, many providers push small firms toward self-service tools with limited human support. Subscription pricing and bundled expense software help providers earn steadier income from these accounts.
South India leads while east and central zones grow fastest
| Region | Value, 2025 (USD billion) | Share, 2025 | CAGR, 2026–2035 |
|---|---|---|---|
| South India | 13.36 | 31.1% | 10.03% |
| North India | 11.77 | 27.4% | 10.53% |
| West India | 9.58 | 22.3% | 9.93% |
| East and Central India | 8.25 | 19.2% | 11.13% |
How do technology hubs keep the south ahead?
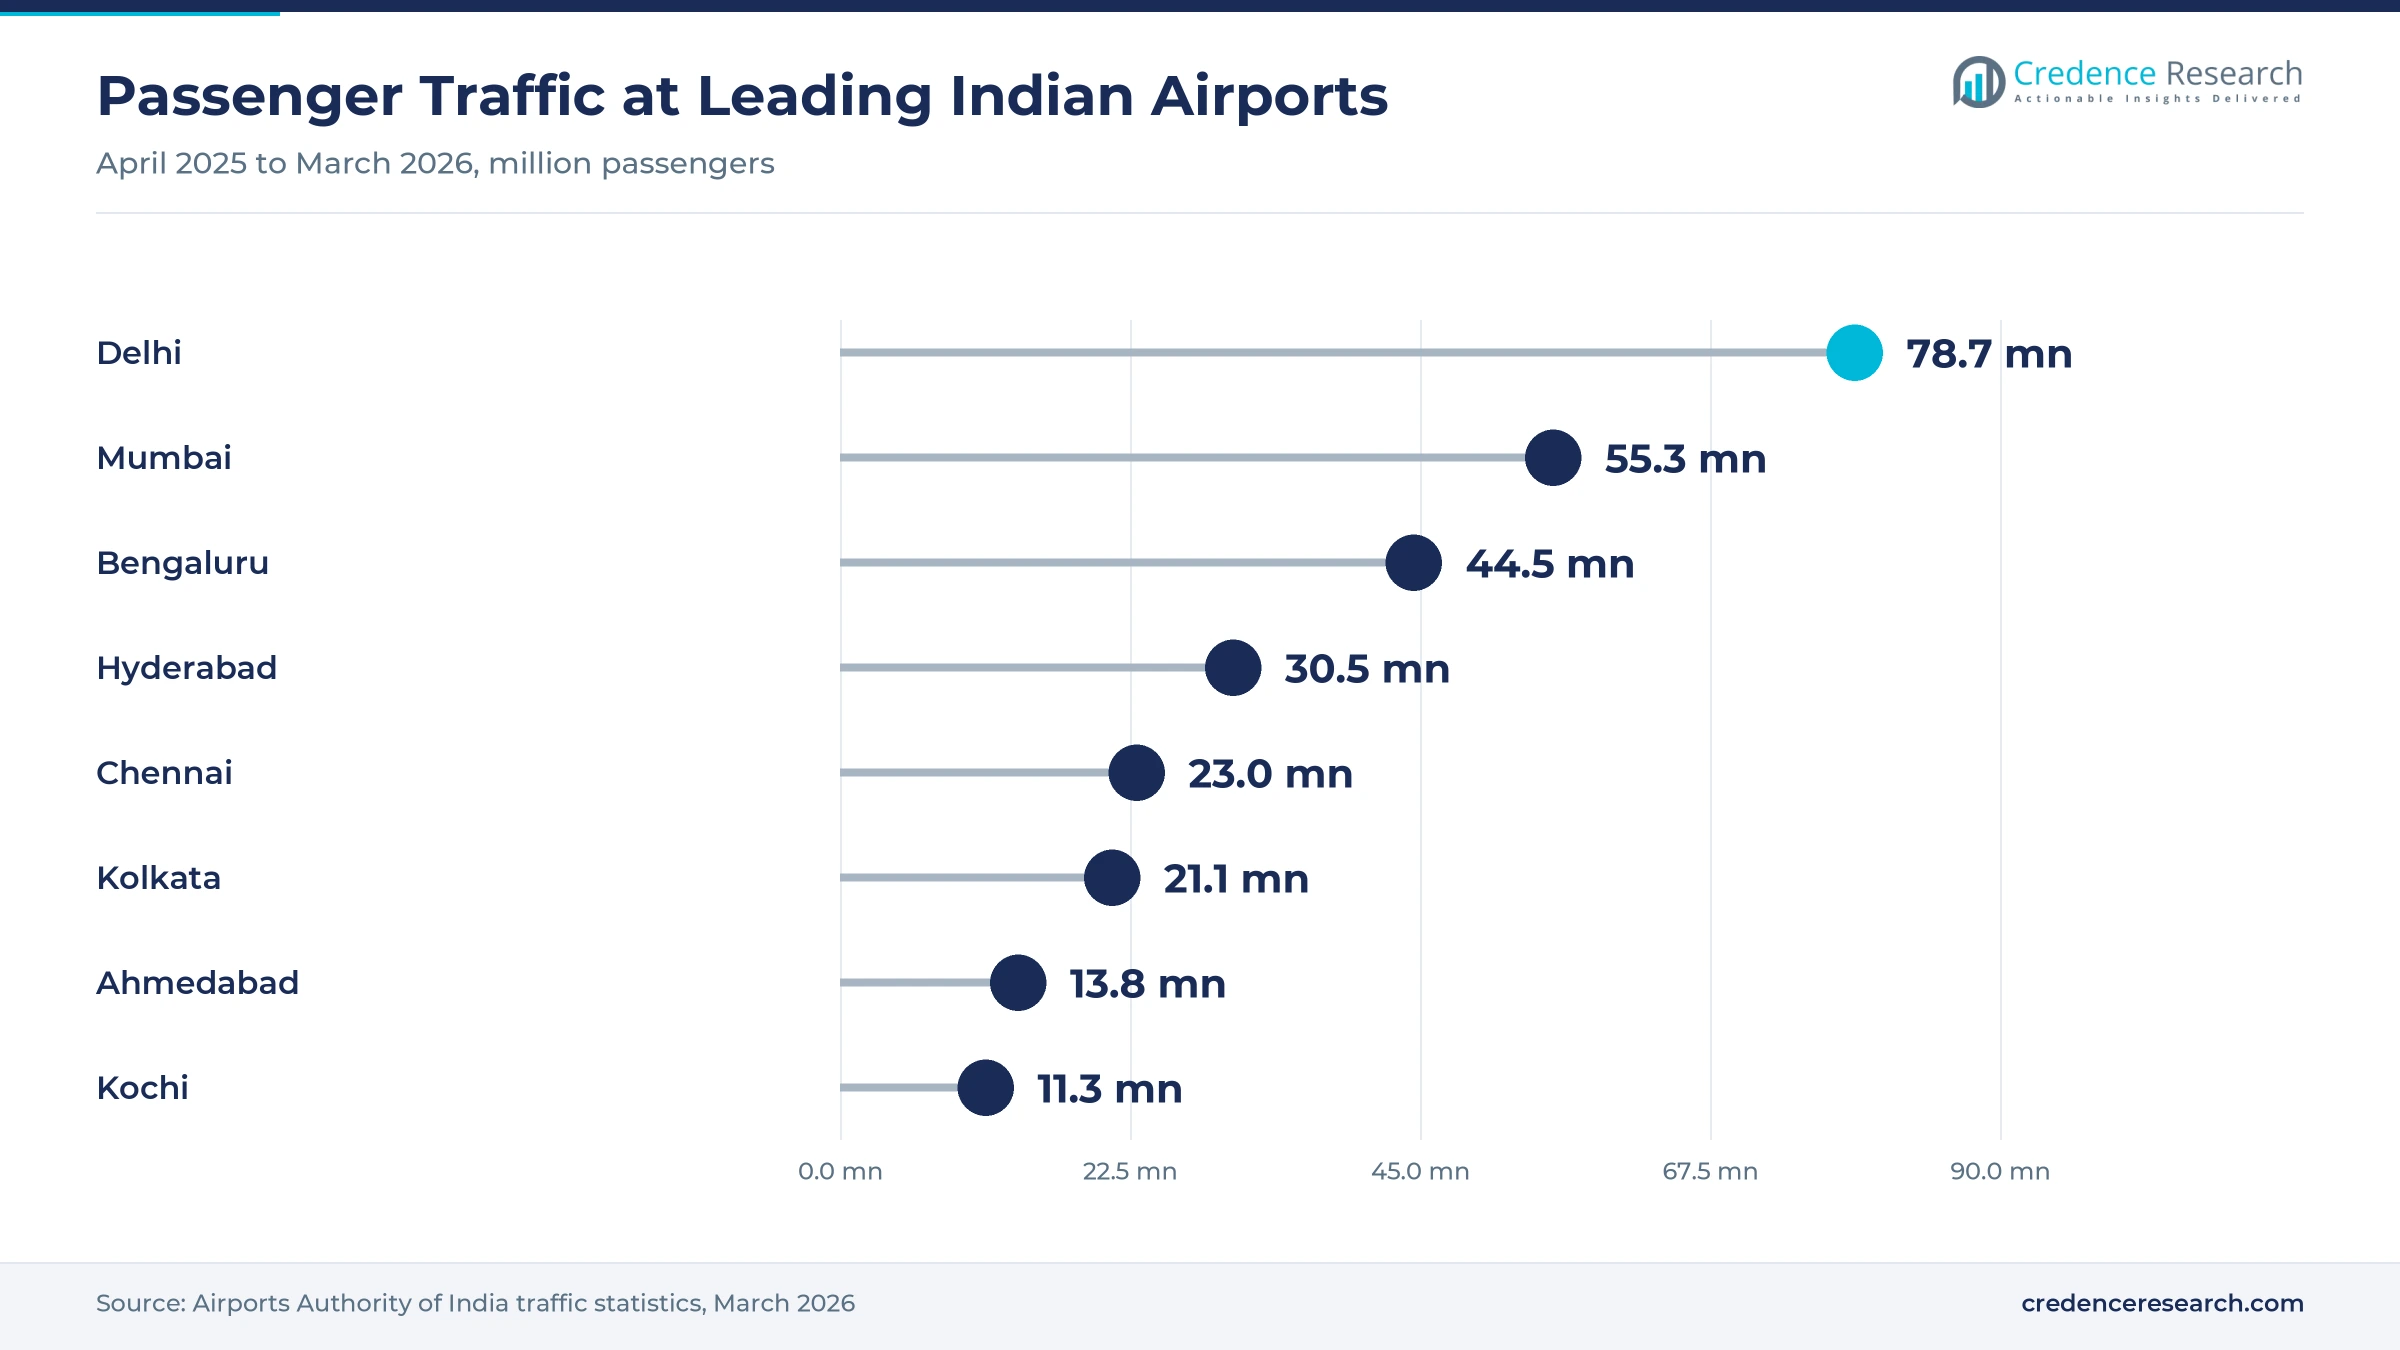
South India held 31.1% of 2025 value and grows at 10.03% a year, because Bengaluru, Hyderabad and Chennai host large technology firms, banks' operations centers and global capability centers. Bengaluru airport handled about 44.5 million passengers and Hyderabad about 30.5 million in 2025-26, according to Airports Authority of India data. BCD Travel lists offices in Bengaluru, Hyderabad and Chennai, which shows the depth of managed travel demand in the south.
Why does the national capital region anchor northern demand?
North India held 27.4% of 2025 value and grows at 10.53% a year, because Delhi, Gurugram and Noida host government buyers, corporate headquarters and many travel management companies. Delhi airport handled about 78.7 million passengers in 2025-26, the most of any Indian airport. Noida International Airport started commercial flights on June 15, 2026, with first-phase capacity of 12 million passengers a year, which adds a second gateway for the region.
How do finance and industry shape western business trips?
West India held 22.3% of 2025 value and grows at 9.93% a year, because Mumbai, Pune and Ahmedabad combine financial services, automotive plants and chemical clusters. Mumbai airport handled about 55.3 million passengers in 2025-26, and Navi Mumbai International Airport began commercial flights on Dec. 25, 2025. As a result, companies in the region gain more flight options and lower congestion during peak business hours.
Why are East and Central India growing fastest?
East and Central India held 19.2% of 2025 value and grows fastest at 11.13% a year, because new airports, steel and power projects and state industrial corridors pull more engineers and managers into the zone. Kolkata airport handled about 21.1 million passengers in 2025-26, the most in the zone. A new terminal at Patna is designed for up to one crore passengers a year, which improves access for project and sales teams.
Airport openings, tax changes and travel company deals
| Development | Status and market relevance |
|---|---|
| In November 2024, MakeMyTrip agreed to acquire the Happay expense management platform from CRED. | Adds a platform with more than 900 corporate clients |
| In September 2025, American Express Global Business Travel completed its acquisition of CWT. | Brings CWT clients onto Amex GBT booking tools |
| In September 2025, the GST rate on hotel rooms priced up to Rs 7,500 a night fell from 12% to 5%. | Lowers the cost of mid-priced business stays |
| In December 2025, Navi Mumbai International Airport began commercial flight operations. | Adds a second airport for the Mumbai region |
| In June 2026, Noida International Airport started commercial flights with first-phase capacity of 12 million passengers. | Adds a second gateway for the national capital region |
Booking engines, expense apps and UPI change trip handling
- Self-booking engines let employees choose flights and hotels within preset policy limits on mobile apps, which cuts approval times and agent workload.
- Linked expense platforms match bookings, card payments and receipts automatically, which helps finance teams close monthly accounts faster.
- UPI and virtual card payments allow instant settlement with hotels, cab firms and small vendors, which reduces cash advances to staff.
- Airline retailing tools show fare bundles, seat choice and seat and baggage add-ons in the booking flow, which lets travel managers compare total trip cost.
Need a Custom Version of This Report?
Tailor the scope, geography, or segments to your exact requirements.
- Custom geography or segment scope
- Direct access to our analyst team
Online agencies and global managers vie for company accounts
Competition is led by large online travel companies with business travel units and by global travel management companies with Indian operations. MakeMyTrip runs myBiz, Quest2Travel and Happay, and serves 500 large enterprises and about 75,000 smaller businesses. Yatra for Business served about 1,150 to 1,200 managed clients in 2025 and strengthened its events business through Globe Travels. Thomas Cook India and SOTC offer business travel, incentive trips and conference services. FCM Travel India, BCD Travel India and American Express Global Business Travel serve multinational accounts, and Amex GBT completed its acquisition of CWT in September 2025. Companies compete on negotiated fares, booking and expense software, round-the-clock support, duty of care and the depth of hotel and events networks across Indian cities.
Companies profiled and their roles in this market
| Company | Type | Role in the market |
|---|---|---|
| MakeMyTrip myBiz and Quest2Travel | Domestic online travel company | Serves 500 large enterprises and about 75,000 SMEs; owns Happay |
| Yatra for Business | Domestic online travel company | About 1,150 to 1,200 managed clients; Globe Travels events unit |
| Thomas Cook India Corporate Travel | Domestic travel group | Business travel and MICE; MICE Powerhouse award in 2025 |
| SOTC Travel Business Travel | Domestic travel group (Thomas Cook India group) | Incentive travel and business travel services |
| FCM Travel India | Global travel management company | Large corporate accounts; new India managing director |
| BCD Travel India | Global travel management company | Offices in Pune, Delhi NCR, Mumbai, Hyderabad, Chennai and Bengaluru |
| American Express Global Business Travel India | Global travel management company | Completed CWT acquisition in September 2025 |
Credence Research view on SME demand and expense control
Credence Research's view is that India corporate travel will grow faster than most service markets through 2035, because companies are expanding into more cities while airports and hotels add capacity. However, value will shift toward providers that combine booking, payment and expense control in one platform. Large enterprises should keep the biggest share, but small and medium businesses add the most new accounts. With 166 operational airports in 2026, India corporate travel demand can reach more plant and branch cities than before.
How the business travel spending estimate was built
The report uses 2025 as the base year, with values in USD million at current prices. Market values come from the Credence Research model, which combines business trip volumes, average air and hotel costs, ground transport spending and service fees. Regional zones and segment splits by service type, customer type, end-use industry and delivery model are Credence Research estimates. Sources used are government statistics and parliamentary replies, airport traffic data, World Bank data, company statements and news reports, and no interviews or surveys were used.
SME accounts and new airports set the path to 2035
The market is expected to reach USD 115.44 billion by 2035, a 10.36% CAGR during 2026–2035, as more companies send staff to clients, plants and events across a wider network of cities. Growth should be strongest in East and Central India, among small and medium businesses and in travel and expense management. More than 75,000 small business clients on one platform show how quickly demand from smaller firms is building. South India should keep the largest share because of its technology hubs. In contrast, sharp fare increases, airline capacity shortfalls or a slowdown in hiring would weaken trip volumes and push companies back toward virtual meetings.
Frequently Asked Questions
How big is the India corporate travel market?
Which region leads business travel spending in India?
Which region grows fastest?
Which service type holds the largest share?
Which customer type grows fastest?
How did the hotel GST change affect business travel?
Who are the leading companies in Indian business travel?
What are the main risks to growth?
Table of Content
Chapter 1 Market Segmentation
- 1.1 Segmentation Framework
- 1.1.1 Product and Service Classification
- 1.1.2 Application and End-Use Classification
- 1.1.3 Technology and Solution Classification
- 1.1.4 Customer and Distribution Channel Classification
- 1.1.5 Geographic Segmentation
- 1.1.6 Market Segment Definitions and Boundaries
- 1.2 By Service Type
- 1.2.1 Air Travel Management
- 1.2.2 Accommodation Management
- 1.2.3 Ground Mobility and Rail
- 1.2.4 Meetings, Incentives, Conferences and Exhibitions
- 1.2.5 Travel and Expense Management
- 1.3 By Customer Type
- 1.3.1 Large Enterprises
- 1.3.2 Mid-Market Enterprises
- 1.3.3 Small and Medium Businesses
- 1.3.4 Government and Public Sector
- 1.4 By End-Use Industry
- 1.4.1 IT and Business Services
- 1.4.2 Banking, Financial Services and Insurance
- 1.4.3 Manufacturing and Automotive
- 1.4.4 Pharmaceuticals and Healthcare
- 1.4.5 Energy, Infrastructure and Professional Services
- 1.5 By Delivery Model
- 1.5.1 Fully Managed Travel Programs
- 1.5.2 Hybrid Managed Travel
- 1.5.3 Self-Booking Platforms
- 1.5.4 Concierge and Offline Servicing
Chapter 2 Introduction
- 2.1 Report Objectives and Scope
- 2.2 Product Definition and Industry Terminology
- 2.3 Market Inclusions and Exclusions
- 2.4 Research Process
- 2.4.1 Primary Research and Expert Interviews
- 2.4.2 Secondary Research and Source Review
- 2.4.3 Top-Down and Bottom-Up Estimation
- 2.4.4 Data Triangulation and Verification
- 2.5 Market Size Measurement Basis
- 2.5.1 2025: USD 42.96 billion → 2035: USD 115.44 billion
- 2.6 Historical and Forecast Reference Periods
- 2.6.1 Historical Period: 2018-2025
- 2.6.2 Base Year: 2025
- 2.6.3 Forecast Period: 2025-2035
- 2.7 Research Assumptions and Limitations
Chapter 3 Executive Summary
- 3.1 Market Snapshot and Key Findings
- 3.2 Base-Year Market Size, 2025
- 3.3 Forecast Market Size, 2035
- 3.4 Revenue and Volume Growth Outlook
- 3.5 Key Demand and Supply Indicators
- 3.6 Leading Market Segments
- 3.7 Fastest-Growing Market Opportunities
- 3.8 Regional Performance Highlights
- 3.9 Technology and Industry Transformation
- 3.10 Competitive Landscape Summary
- 3.11 Analyst View and Strategic Implications
Chapter 4 India Corporate Travel Market Trends and Developments
- 4.1 Historical Industry Development, 2018-2025
- 4.2 Recent Market Trends and Developments
- 4.3 Demand and Customer Behavior Trends
- 4.4 Technology and Product Innovation
- 4.5 Artificial Intelligence, Automation and Digitalization
- 4.6 Local Manufacturing and Supply Chain Realignment
- 4.7 Industry Partnerships, Mergers and Acquisitions
- 4.8 Sustainability and Circular Economy Developments
- 4.9 Government and Private Sector Investment Trends
- 4.10 Emerging Business Models and Commercialization
- 4.11 Industry Developments and Announcements
Chapter 5 India Corporate Travel Market Supply and Demand Analysis
- 5.1 Demand Trend and Consumption Analysis, 2018-2025
- 5.2 Demand Forecast, 2025-2035
- 5.3 Supply Chain Structure and Procurement Trends
- 5.4 Supply-Demand Gap and Bottlenecks
- 5.5 Import Dependence and Sourcing Structure
- 5.6 Regional Supply and Demand Concentration
Chapter 6 India Corporate Travel Market Pricing Analysis
- 6.1 Pricing Structure and Measurement
- 6.2 Historical Pricing Trends, 2018-2025
- 6.3 Pricing Outlook, 2025-2035
- 6.4 Pricing by Product and Market Segment
- 6.5 Geographic Pricing Differences
- 6.6 Key Input, Energy, Labor and Logistics Costs
- 6.7 Contract Pricing and Purchasing Models
- 6.8 Pricing Sensitivity and Competitive Positioning
- 6.9 Price, Margin and Profitability Implications
Chapter 7 India Corporate Travel Market Dynamics
- 7.1 Market Growth Drivers
- 7.1.1 Demand-Side Drivers
- 7.1.2 Technology and Innovation Drivers
- 7.1.3 Infrastructure and Investment Drivers
- 7.1.4 Regulatory and Policy Drivers
- 7.2 Market Restraints
- 7.2.1 Cost and Affordability Constraints
- 7.2.2 Technology and Adoption Barriers
- 7.2.3 Supply Chain and Operational Constraints
- 7.3 Market Challenges
- 7.3.1 Competitive Pressure and Margin Erosion
- 7.3.2 Skills, Infrastructure and Implementation Gaps
- 7.4 Emerging Market Opportunities
- 7.5 Market Dynamics Impact and Time-Horizon Assessment
Chapter 8 India Corporate Travel Value Chain Analysis
- 8.1 Industry Value Chain Overview
- 8.2 Upstream Suppliers and Critical Inputs
- 8.3 Technology and Component Providers
- 8.4 Manufacturing or Service Delivery
- 8.5 Distribution, Channel Partners and Integrators
- 8.6 Downstream Applications and End Users
- 8.7 Value Addition and Profit Pools
- 8.8 Vertical Integration and Outsourcing
- 8.9 Supplier Concentration and Risk
- 8.10 Supply Chain Localization and Resilience
Chapter 9 India Corporate Travel Market Regulations and Policies
- 9.1 Relevant Laws, Standards and Compliance Frameworks
- 9.2 Product, Service, Safety and Quality Requirements
- 9.3 Government Policies, Incentives and Subsidies
- 9.4 Imports, Exports and Trade Barriers
- 9.5 Public Procurement and Local Content Requirements
- 9.6 Data Protection, AI and Cybersecurity Compliance
- 9.7 Upcoming Policy Changes and Market Implications
Chapter 10 India Corporate Travel Market Hotspots and Opportunities
- 10.1 Market Opportunity Mapping and Growth Hotspots
- 10.2 High-Growth Applications and Customer Groups
- 10.3 Underserved Markets and White-Space Opportunities
- 10.4 Emerging Technology and Product Opportunities
- 10.5 New Capacity and Investment Hotspots
- 10.6 Market Entry and Expansion Opportunities
- 10.7 Distribution and Partnership Opportunities
- 10.8 Near-Term and Long-Term Commercial Potential
- 10.9 Opportunity Attractiveness and Execution Risks
Chapter 11 India Corporate Travel Market Outlook, 2025-2035
- 11.1 Market Size and Analysis
- 11.1.1 Revenue (Market Measurement: 2025: USD 42.96 billion → 2035: USD 115.44 billion)
- 11.1.2 Historical Market Size, 2018-2025
- 11.1.3 Base-Year Market Size, 2025
- 11.2 Market Forecast, 2025-2035
- 11.2.1 Revenue Forecast to 2035
- 11.2.2 CAGR and Year-on-Year Growth
- 11.2.3 Incremental Revenue Opportunity
- 11.3 Forecast Assumptions and Scenario Analysis
- 11.3.1 Base-Case Forecast
- 11.3.2 Optimistic and Conservative Scenarios
- 11.3.3 Technology, Pricing and Policy Sensitivities
- 11.4 Market Attractiveness and Growth Outlook
Chapter 12 India Corporate Travel Market Segmentation and Outlook
- 12.1 Segmentation Summary and Market Shares, 2025
- 12.2 Largest and Fastest-Growing Segments
- 12.3 By Service Type - Market Size and Forecast, 2025-2035
- 12.3.1 Segment Definition and Scope
- 12.3.2 Historical Market Size, 2018-2025
- 12.3.3 Revenue Forecast, 2025-2035
- 12.3.4 Base-Year Market Share, 2025
- 12.3.5 Segment CAGR and Growth Drivers
- 12.3.6 Subsegment Market Size and Forecast
- 12.3.6.1 Air Travel Management
- 12.3.6.2 Accommodation Management
- 12.3.6.3 Ground Mobility and Rail
- 12.3.6.4 Meetings, Incentives, Conferences and Exhibitions
- 12.3.6.5 Travel and Expense Management
- 12.3.7 Subsegment Pricing and Adoption Trends
- 12.3.8 Leading Suppliers and Competition
- 12.3.9 Regional Demand and Opportunities
- 12.4 By Customer Type - Market Size and Forecast, 2025-2035
- 12.4.1 Segment Definition and Scope
- 12.4.2 Historical Market Size, 2018-2025
- 12.4.3 Revenue Forecast, 2025-2035
- 12.4.4 Base-Year Market Share, 2025
- 12.4.5 Segment CAGR and Growth Drivers
- 12.4.6 Subsegment Market Size and Forecast
- 12.4.6.1 Large Enterprises
- 12.4.6.2 Mid-Market Enterprises
- 12.4.6.3 Small and Medium Businesses
- 12.4.6.4 Government and Public Sector
- 12.4.7 Subsegment Pricing and Adoption Trends
- 12.4.8 Leading Suppliers and Competition
- 12.4.9 Regional Demand and Opportunities
- 12.5 By End-Use Industry - Market Size and Forecast, 2025-2035
- 12.5.1 Segment Definition and Scope
- 12.5.2 Historical Market Size, 2018-2025
- 12.5.3 Revenue Forecast, 2025-2035
- 12.5.4 Base-Year Market Share, 2025
- 12.5.5 Segment CAGR and Growth Drivers
- 12.5.6 Subsegment Market Size and Forecast
- 12.5.6.1 IT and Business Services
- 12.5.6.2 Banking, Financial Services and Insurance
- 12.5.6.3 Manufacturing and Automotive
- 12.5.6.4 Pharmaceuticals and Healthcare
- 12.5.6.5 Energy, Infrastructure and Professional Services
- 12.5.7 Subsegment Pricing and Adoption Trends
- 12.5.8 Leading Suppliers and Competition
- 12.5.9 Regional Demand and Opportunities
- 12.6 By Delivery Model - Market Size and Forecast, 2025-2035
- 12.6.1 Segment Definition and Scope
- 12.6.2 Historical Market Size, 2018-2025
- 12.6.3 Revenue Forecast, 2025-2035
- 12.6.4 Base-Year Market Share, 2025
- 12.6.5 Segment CAGR and Growth Drivers
- 12.6.6 Subsegment Market Size and Forecast
- 12.6.6.1 Fully Managed Travel Programs
- 12.6.6.2 Hybrid Managed Travel
- 12.6.6.3 Self-Booking Platforms
- 12.6.6.4 Concierge and Offline Servicing
- 12.6.7 Subsegment Pricing and Adoption Trends
- 12.6.8 Leading Suppliers and Competition
- 12.6.9 Regional Demand and Opportunities
- 12.7 Segment Growth Comparison
- 12.8 Segment Attractiveness and Priority Matrix
Chapter 13 India Corporate Travel End-Use and Application Market Outlook
- 13.1 End-Use Industry and Customer Demand Structure
- 13.2 Leading Applications and Customer Groups
- 13.3 End-Use Market Size, Share and Forecast
- 13.4 Major End-Use Industry Deep Dives
- 13.4.1 Customer Requirements and Use Cases
- 13.4.2 Demand and Replacement Cycles
- 13.4.3 Technical and Regulatory Considerations
- 13.4.4 Purchasing and Procurement Models
- 13.4.5 Leading Vendors and Distribution Channels
- 13.4.6 Forecast and Commercial Opportunities
- 13.5 Emerging Applications and Cross-Segment Demand
- 13.6 End-Use Industry Investment Priorities
Chapter 14 India Corporate Travel Geographic Market Outlook, 2025-2035
- 14.1 Domestic Market Distribution and Demand Clusters
- 14.2 State- or Province-Wise Market Size and Forecast, 2025-2035
- 14.3 City and Metropolitan Market Outlook
- 14.4 Industrial, Manufacturing and Commercial Clusters
- 14.5 Geographic Concentration of Key End Users
- 14.6 Local Pricing and Purchasing Differences
- 14.7 Domestic Production Facilities and Capacity Map
- 14.8 Local Infrastructure and Project Pipeline
- 14.9 State-Level Policy and Incentive Differences
- 14.10 Subnational Investment Hotspots and Opportunities
- 14.11 Distribution and Logistics Networks
- 14.12 Domestic Competitive Footprint
Chapter 15 India Corporate Travel Technology, Innovation and Sustainability Outlook
- 15.1 Technology Landscape and Maturity
- 15.2 Product, Process and Service Innovation
- 15.3 AI, Automation and Digital Tools in the Industry
- 15.4 Technology Adoption and Performance Benchmarking
- 15.5 Innovation Pipeline and R&D Investment
- 15.6 Energy Efficiency and Resource Management
- 15.7 Sustainability, Recycling and Circularity
- 15.8 Technology Roadmap, 2025-2035
- 15.9 Risks of Obsolescence and Technology Substitution
Chapter 16 India Corporate Travel Market Key Strategic Imperatives
- 16.1 Growth and Market Entry Priorities
- 16.2 High-Return Products and Segments
- 16.3 Pricing, Profitability and Cost Optimization
- 16.4 Technology Investment and Product Differentiation
- 16.5 Supply Chain Localization and Resilience
- 16.6 Distribution and Customer Acquisition
- 16.7 Partnership, Acquisition and Capacity Strategy
- 16.8 Regional Expansion Priorities
- 16.9 Short-, Medium- and Long-Term Actions
Chapter 17 Competition Outlook
- 17.1 Industry Competition Characteristics
- 17.2 Market Structure and Concentration
- 17.3 Market Share and Competitive Positioning, 2025
- 17.4 Company-Wise Revenue and Product Benchmarking
- 17.5 Production and Service Capacity Benchmarking
- 17.6 Technology, Pricing and Differentiation
- 17.7 Regional Footprint and Distribution Strength
- 17.8 Mergers, Acquisitions and Strategic Alliances
- 17.9 New Entrants and Competitive Threats
- 17.10 Porter's Five Forces and Industry Attractiveness
- 17.11 Competitive Outlook, 2025-2035
Chapter 18 Company Profiles
- 18.1 Company Coverage and Selection Criteria
- 18.2 MakeMyTrip myBiz and Quest2Travel
- 18.2.1 Business Description
- 18.2.2 Company Ownership and Geographic Presence
- 18.2.3 Product and Service Portfolio
- 18.2.4 Manufacturing and Operating Footprint
- 18.2.5 Financial Performance and Investment
- 18.2.6 Market Share and Competitive Position
- 18.2.7 Technology and Innovation Capabilities
- 18.2.8 Strategic Alliances or Partnerships
- 18.2.9 Recent Developments
- 18.2.10 Growth Strategy and Outlook
- 18.3 Yatra for Business
- 18.4 Thomas Cook India Corporate Travel
- 18.5 FCM Travel India
- 18.6 BCD Travel India
- 18.7 American Express Global Business Travel India
- 18.8 CWT India
- 18.9 ATPI India
- 18.10 EaseMyTrip Corporate Travel
- 18.11 SOTC Travel Business Travel
- 18.12 Other Relevant Market Participants
Note: Every listed company is profiled on the structure shown under the first company. The company list is preliminary and may change based on research findings, market developments, data availability and client requirements.
Chapter 19 Disclaimer
- 19.1 Research and Forecast Disclaimer
- 19.2 Data Source and Estimation Limitations
Note: The depth of individual sections depends on data availability for this market. Volume, capacity, trade and other unit-based metrics are included where applicable.

