
Textile mills and paint makers set colorant demand
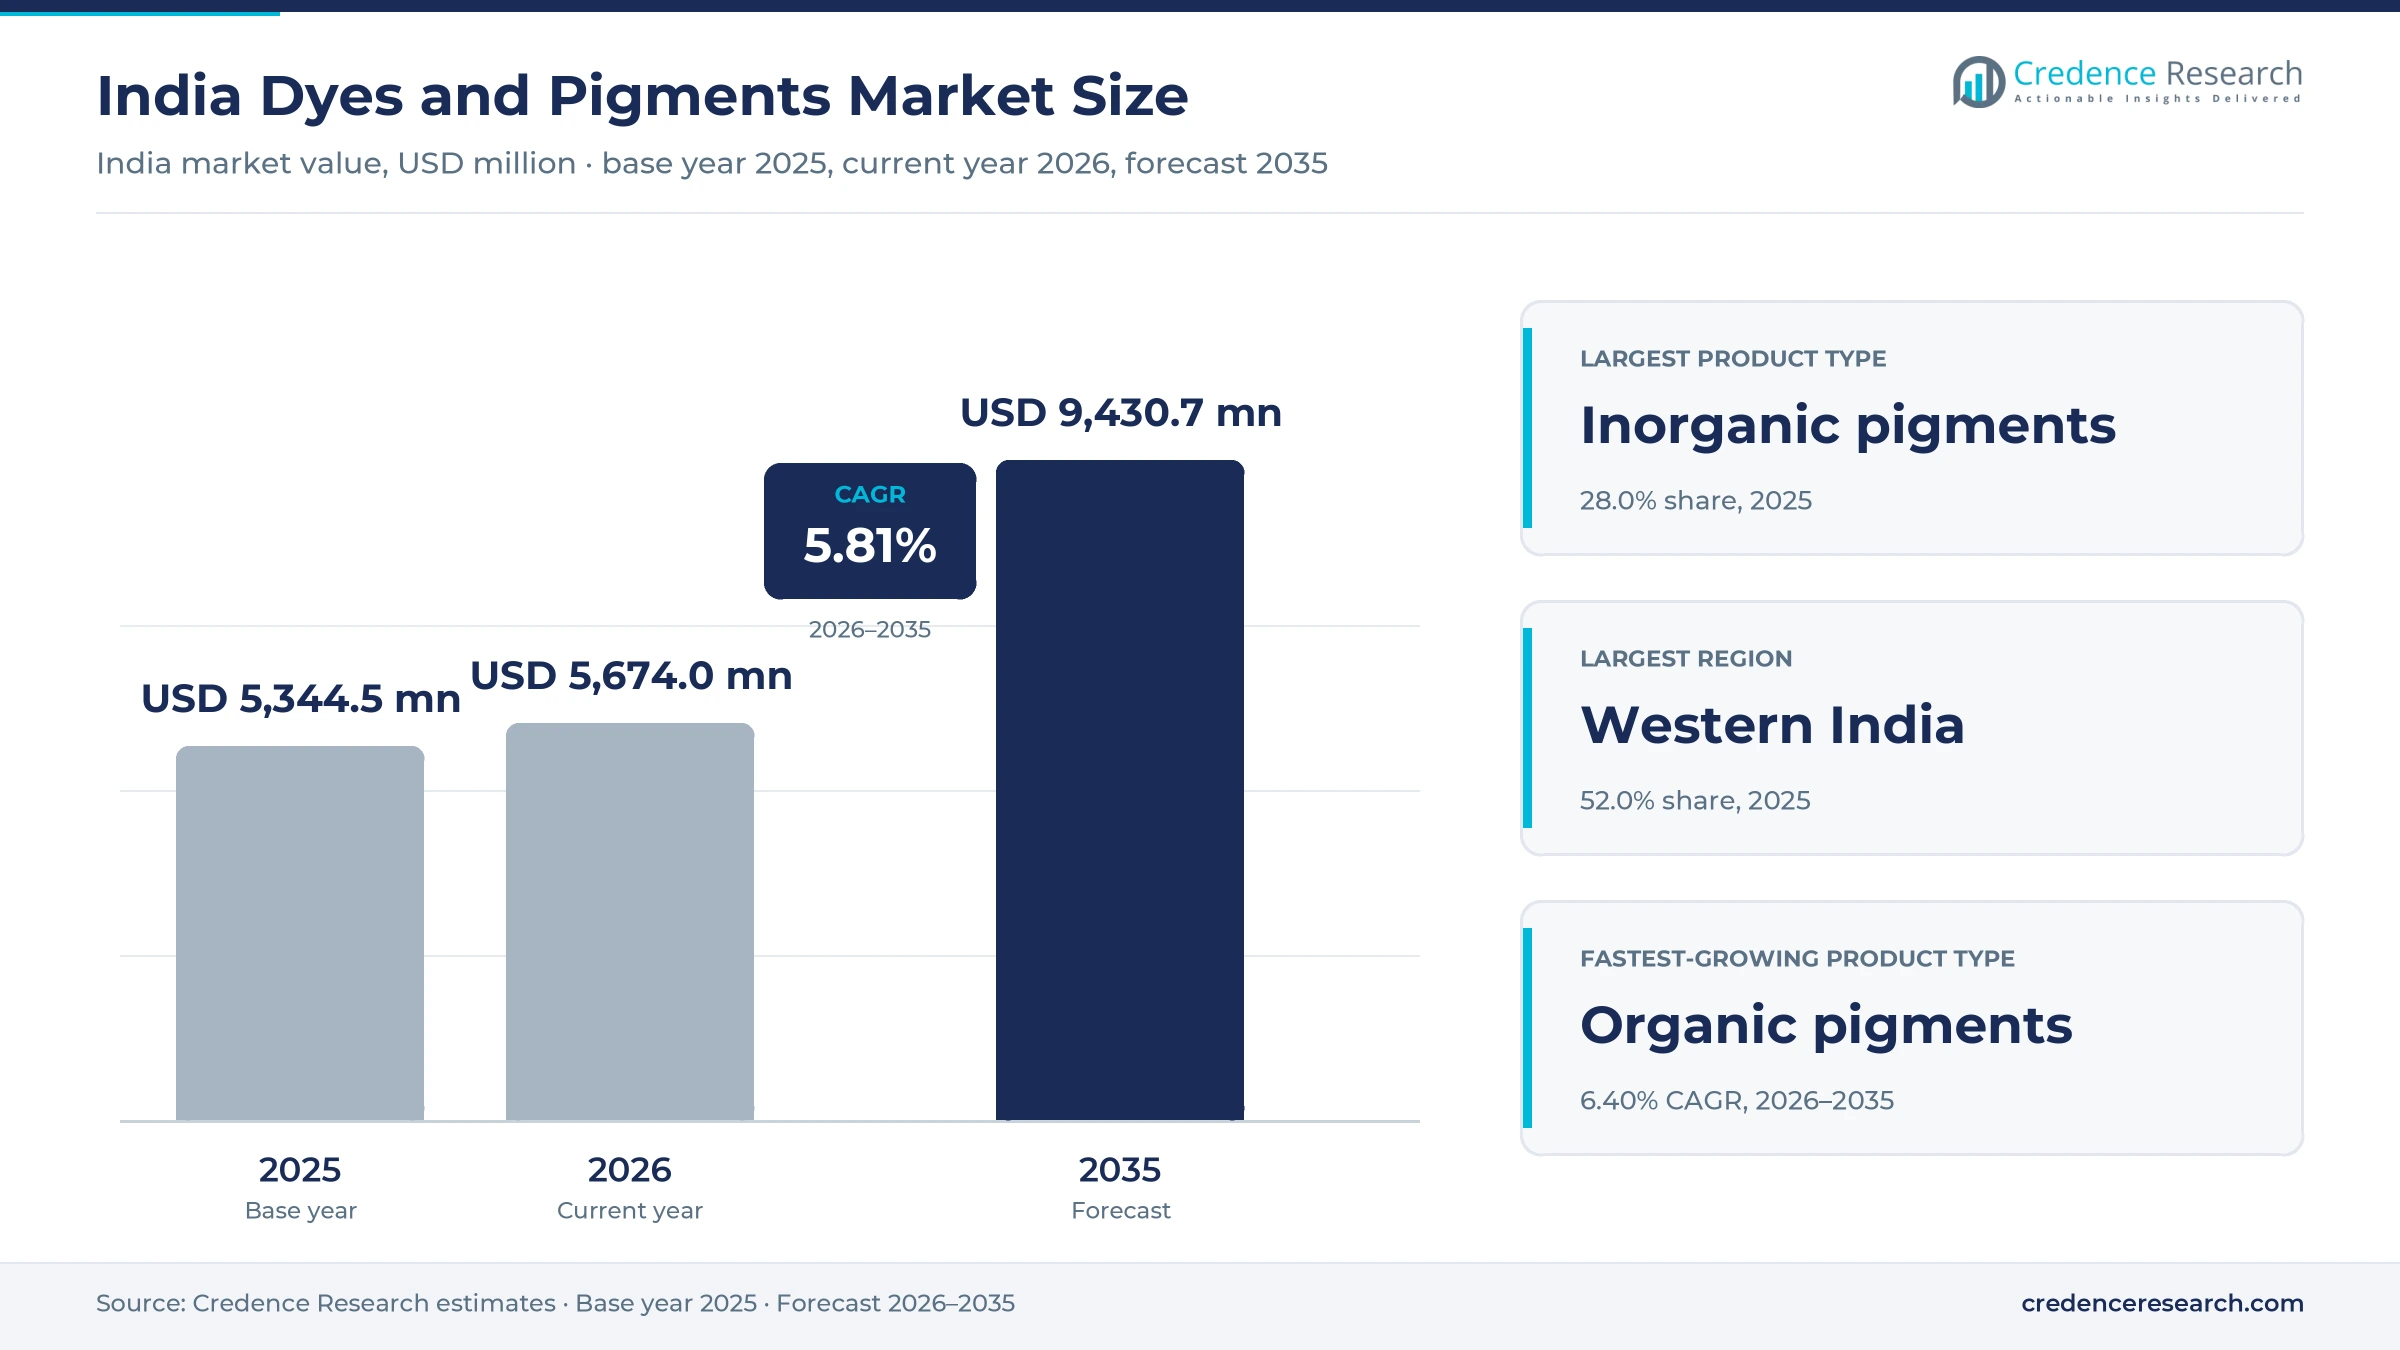
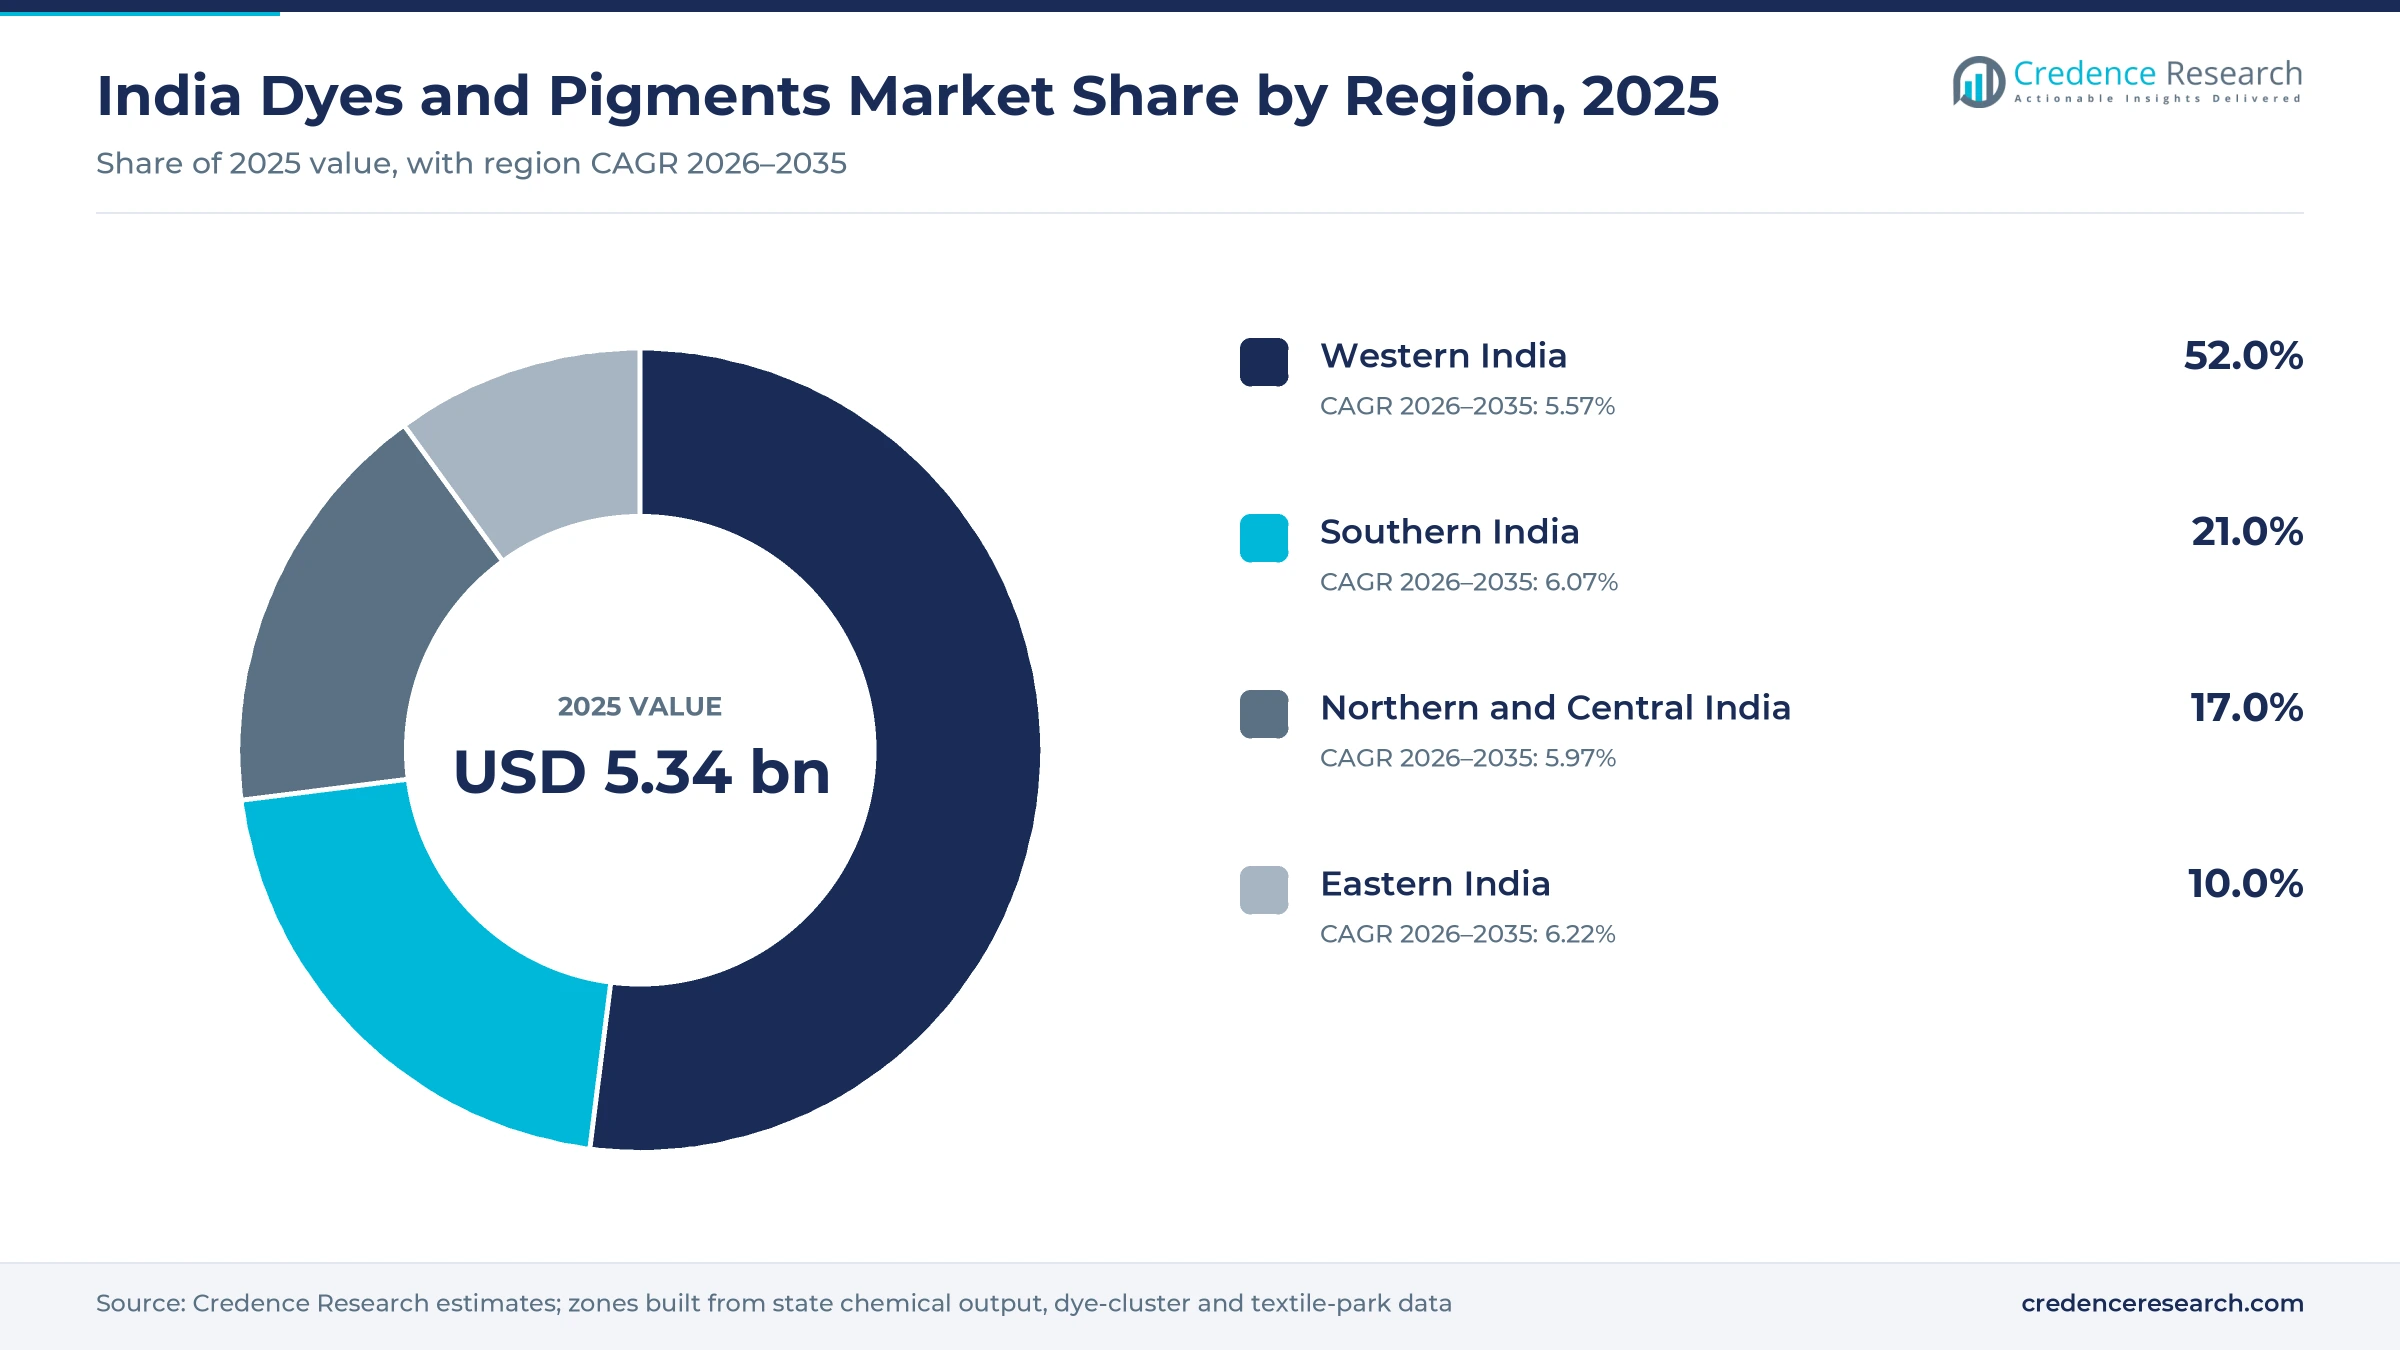
The India dyes and pigments market was valued at USD 5.34 billion in 2025 and is projected to increase from USD 5.67 billion in 2026 to USD 9.43 billion by 2035, registering a CAGR of 5.81% during 2026–2035. Demand comes from textile process houses that dye cotton and polyester, paint makers that buy titanium dioxide and organic pigments, and plastics, ink and leather processors. Western India held the largest regional share, 52.0% in 2025, because Gujarat and Maharashtra host most dye, pigment and intermediate plants. Eastern India is the fastest-growing region at 6.22% a year, as housing, paint and textile capacity spread to states with a lower base. Supply is also changing, because Sudarshan Chemical Industries completed its purchase of the Heubach Group pigment business in March 2025 and India imposed countervailing duties on Chinese pearlescent pigments in June 2025. As a result, domestic producers are gaining scale while buyers weigh local supply against imports.
Which colorants and buyers sit inside the scope?
The estimate measures the value of dyes and pigments consumed in India, covering reactive, disperse and other dyes such as acid, direct, vat and sulfur grades, along with organic and inorganic pigments. Values are stated at the prices that textile process houses, paint and coating makers, plastics converters, ink makers and other users pay to producers, importers and distributors.
The estimate excludes dye intermediates sold on their own, textile auxiliaries, finished paints and inks, and the part of domestic output that is exported. The value chain runs from benzene, naphthalene and other basic chemicals through intermediates such as H acid, vinyl sulphone and arylides to dye and pigment makers, and onward to process houses, paint plants and masterbatch producers.
India Dyes and Pigments Market Insights
- The India dyes and pigments market was valued at USD 5.34 billion in 2025 and is projected to reach USD 9.43 billion by 2035, registering a CAGR of 5.81% during 2026–2035.
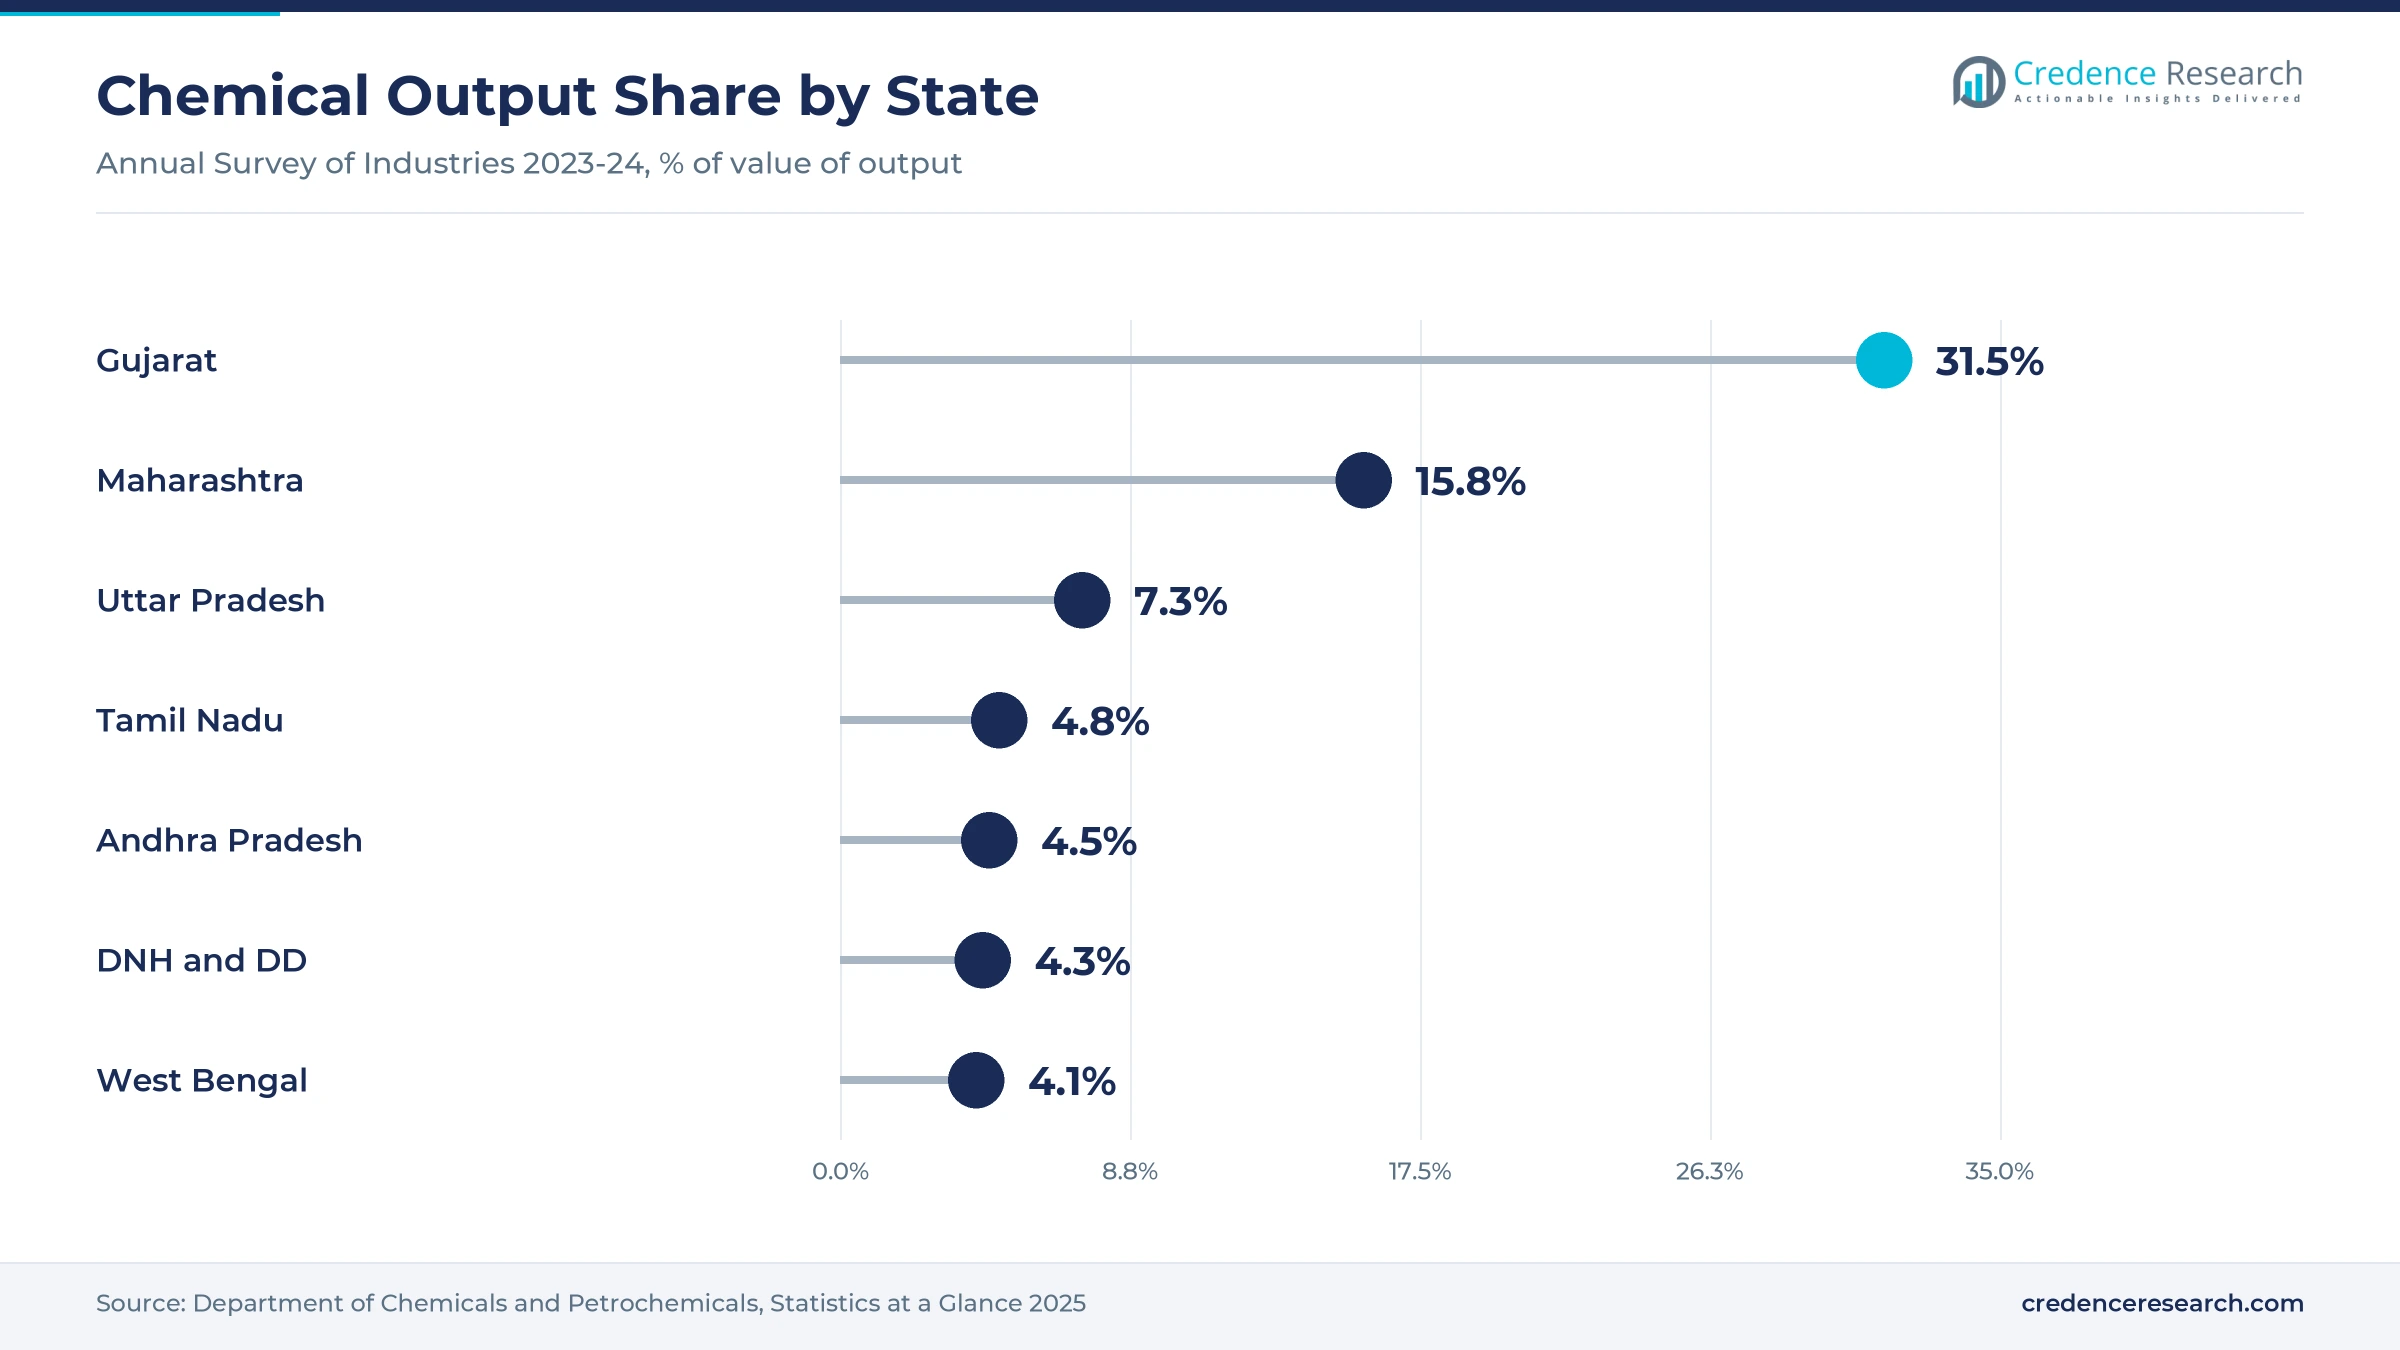
- Western India held a 52.0% share of 2025 value, because Gujarat and Maharashtra together produced 47.3% of chemical output in 2023-24.
- Inorganic pigments led with a 28.0% share of 2025 value, because paint, plastics and construction buyers use large volumes of white and colored oxides.
- Sudarshan Chemical Industries completed its acquisition of the Heubach Group global pigment business on March 3, 2025, adding 19 international sites.
- Pigment emulsion exports reached INR 7,277 crore in fiscal 2024-25, the largest colorant export line, according to the Department of Chemicals and Petrochemicals.
Inorganic pigments lead as organic grades grow fastest
Why do inorganic pigments hold the largest product share?
Based on product type, the market is categorized into inorganic pigments, reactive dyes, organic pigments, disperse dyes and other dyes. Inorganic Pigments led with a 28.0% share of 2025 value, because paint, plastics and construction buyers use large volumes of white and colored oxides. Organic Pigments grow fastest at 6.40% a year, as coating and ink makers move to brighter, more durable phthalocyanine and azo grades.
Why do textiles remain the largest application?
Based on application, the market is categorized into textiles, paints and coatings, plastics, printing inks and others. Textiles led with 42.0% of 2025 value, because cotton and polyester processing consumes most reactive and disperse dyes made in the country. Plastics grow fastest at 6.47% a year, as packaging, appliance and automotive parts makers color more polymer through masterbatches.
| Segment Group | Leading Sub-segment | Share, 2025 | Fastest-growing Sub-segment | CAGR, 2026–2035 |
|---|---|---|---|---|
| By Product Type | Inorganic Pigments | 28.0% | Organic Pigments | 6.40% |
| By Application | Textiles | 42.0% | Plastics | 6.47% |
Request a Free Sample
Fill in your details and we'll send you a free sample report.
- Sample data tables & charts
- Research methodology
Textiles, paints and export orders lift colorant use
How do textile processing and technical textiles lift demand?
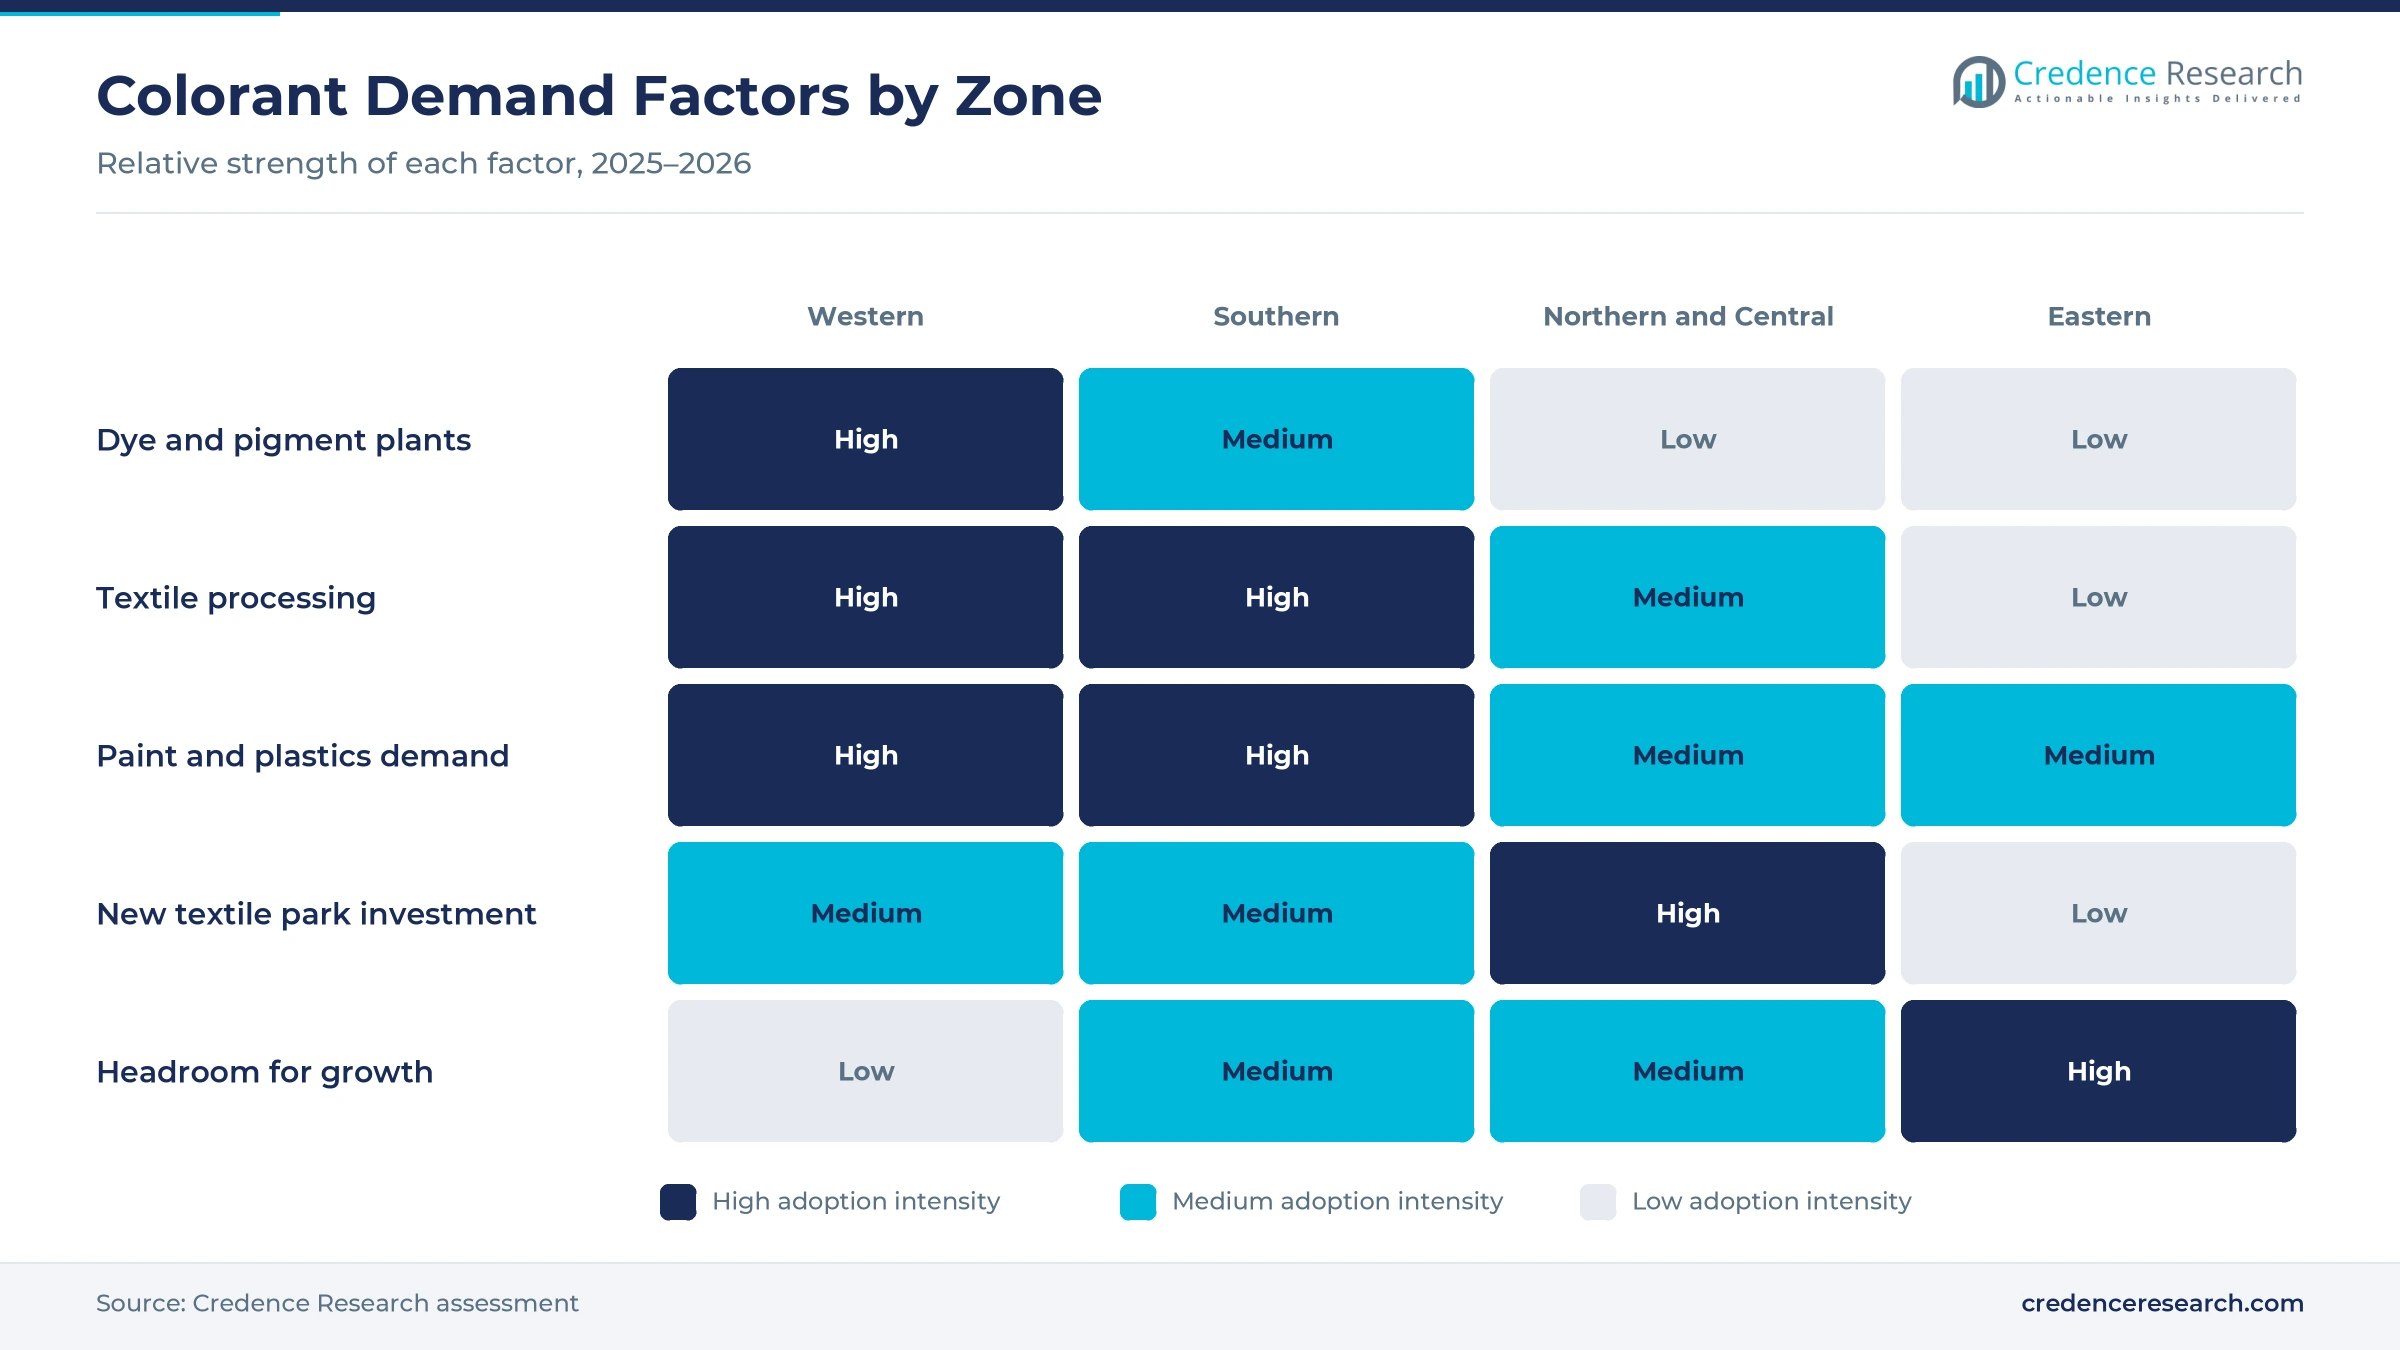
Textile process houses consume most of the dyes made in the country, so new spinning, weaving and processing capacity turns quickly into dye orders. The textile industry uses around 70% of domestic dye output, according to an August 2025 analysis in Indian Chemical News. The Ministry of Textiles is developing seven PM MITRA parks with an outlay of INR 4,445 crore, and investment MoUs and expressions of interest reached INR 42,491 crore, according to a Lok Sabha reply of Dec. 2, 2025. The National Technical Textiles Mission, extended to 2025-26 with an outlay of INR 1,480 crore, also targets USD 10 billion of technical textile exports. As a result, textiles held 42.0% of 2025 value, the largest application share.
Why do paints, coatings and infrastructure pull pigment volumes?
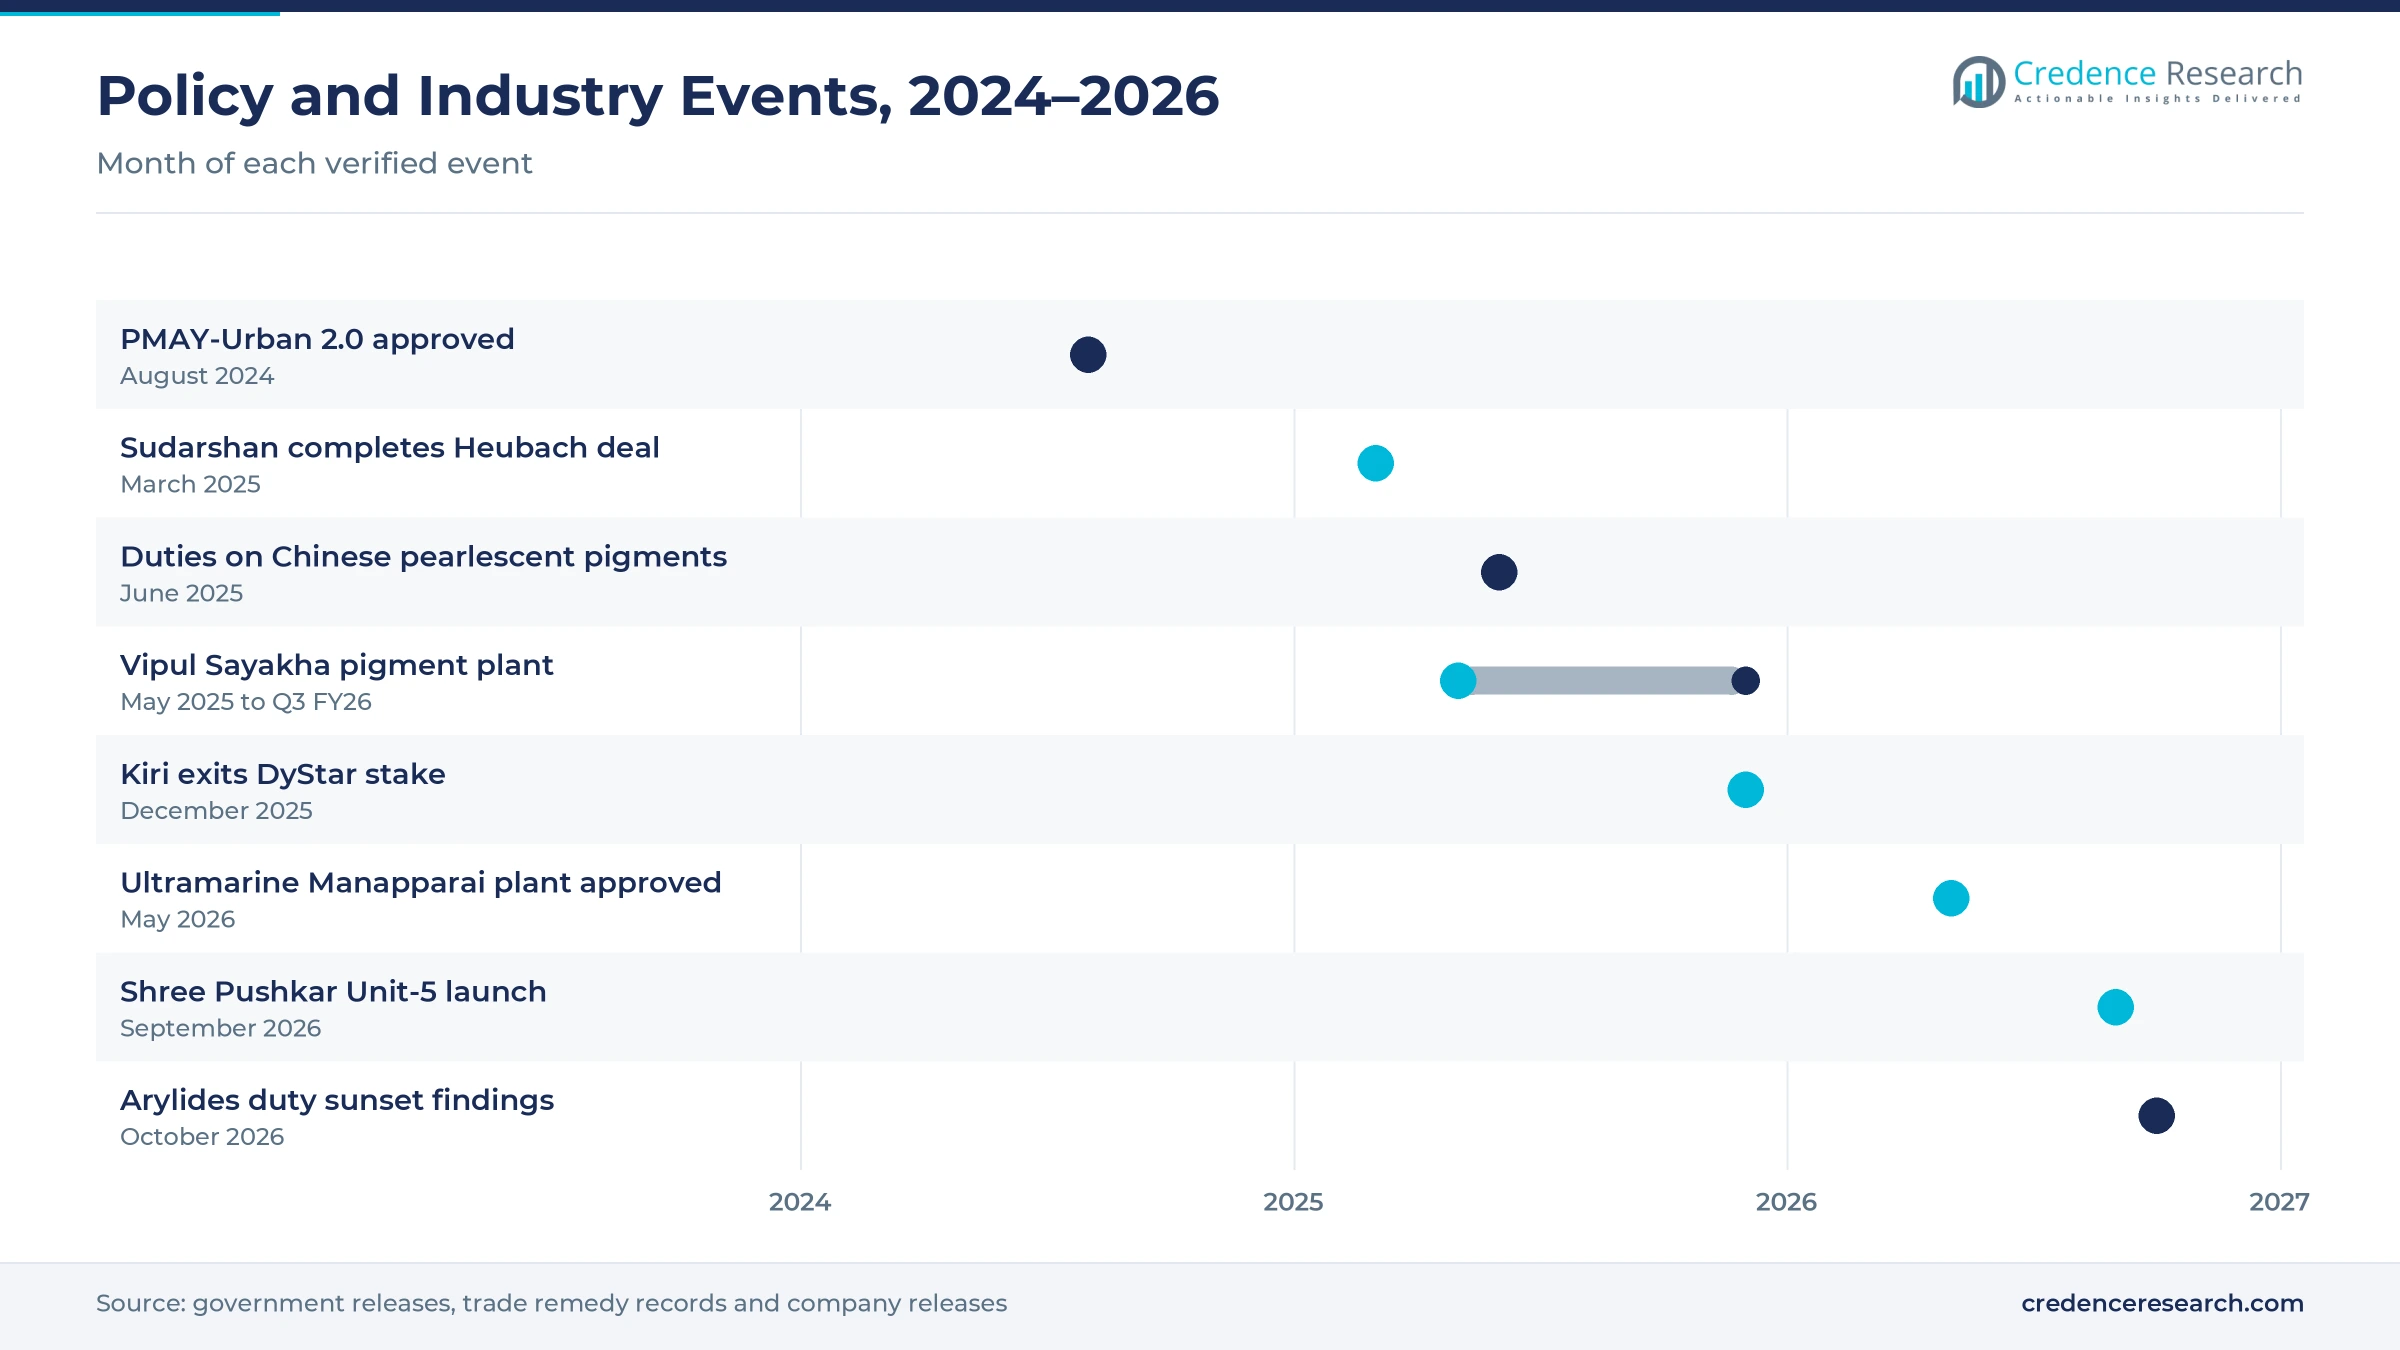
Paint makers are the largest buyers of pigments, so new decorative and industrial coating capacity feeds directly into demand for white, organic and inorganic grades. The Indian paints and coatings industry is worth about USD 8.5 billion and 6.3 million metric tons a year, according to Indian Paints Association data cited by Outlook Business in June 2025. Birla Opus reached 1,096 million liters a year of decorative capacity in May 2025, while per capita paint use is about 3.5 kg against a global average of about 10 kg, according to The Machine Maker. The Union Cabinet approved PMAY-Urban 2.0 in August 2024 to build one crore urban houses. In turn, titanium dioxide and organic grades gain volume, and organic pigments grow fastest at 6.40% a year.
How does China-plus-one sourcing shift orders to Indian plants?
Global textile brands and colorant buyers are spreading supply beyond China, and Indian producers with integrated intermediates are winning a larger share of those contracts. India holds about 16% of global dyestuff production and is the second-largest exporter of dyes, according to the Department of Chemicals and Petrochemicals. Exports of pigment emulsions reached INR 7,277 crore in fiscal 2024-25, ahead of reactive dyes at INR 5,156 crore and azo dyes at INR 2,104 crore. Asahi Songwon said in its fiscal 2024-25 annual report that tariffs on Chinese pigments in several countries have opened opportunities for Indian suppliers. As a result, Western India keeps the largest zone share, because most export-oriented plants sit in Gujarat and Maharashtra.
Why do new plants and acquisitions deepen domestic supply?
Indian colorant producers are building plants and buying overseas assets, which raises local capacity and brings high-performance grades into domestic supply. Sudarshan Chemical Industries completed its acquisition of the Heubach Group global pigment business on March 3, 2025, adding 19 international sites, according to the company. Vipul Organics announced in May 2025 that phase 1 pigment powder output at its greenfield Sayakha plant in Gujarat would start in the third quarter of fiscal 2025-26. Ultramarine & Pigments approved an INR 250 crore plant for 2,500 metric tons a year of inorganic pigments at SIPCOT Manapparai in Tamil Nadu in May 2026. In turn, Southern India grows at 6.07% a year as new plants and textile parks open.
Trade remedies and new ownership reshape supply
How is the rise of trade remedies reshaping colorant imports?
Domestic producers are increasingly using anti-dumping and countervailing cases to limit low-priced Chinese colorants and intermediates. India imposed countervailing duties of 11.18% to 25.76% of CIF value on mica pearlescent pigments from China from June 26, 2025, according to the World Trade Organization trade remedies database. In October 2026, the Directorate General of Trade Remedies recommended continuing a 44.90% anti-dumping duty on Chinese arylides, which are used to make yellow, orange and red pigments, according to World Trade Scanner. The same findings said Chinese imports still supply about 40% of Indian arylide demand. As a result, organic pigment makers with local intermediates gain cost certainty and can price new capacity with more confidence.
Why is ownership consolidation emerging among colorant suppliers?
Ownership of several large colorant assets changed hands in 2025, which concentrates technology and customer access among fewer groups. Zhejiang Longsheng completed its buyback of Kiri Industries' 37.5% stake in DyStar for USD 688.9 million on Dec. 30, 2025, ending years of litigation, according to Knitting Industry. Heubach Colorants India, which runs organic pigment plants at Roha, Cuddalore and Nagda, was renamed Sudarshan Colorants India on Dec. 12, 2025, after the Heubach deal. On the buyer side, JSW Paints agreed in June 2025 to acquire up to 74.76% of Akzo Nobel India for about INR 12,915 crore. In turn, large paint and textile customers now negotiate with fewer, better-capitalized suppliers.
Can technical textiles open demand for high-fastness dyes?
Technical textiles such as protective wear, geotextiles and automotive fabrics need dyes that hold color under heat, light and washing, which opens a premium niche for local suppliers. The National Technical Textiles Mission targets USD 10 billion of technical textile exports, against current exports of USD 2 billion to USD 3 billion, according to an ANI report of Feb. 9, 2025. Man-made textile exports reached USD 3,105 million in April to October of fiscal 2024-25, according to Business Standard. The Navsari PM MITRA park in Gujarat drew INR 13,084 crore of MoUs and expressions of interest. As a result, disperse dyes and textile auxiliaries used on polyester gain from each new processing line.
Is there room to grow in high-performance and specialty pigments?
Coating, ink and plastics customers are paying more for pigments with higher heat stability, brightness and weather resistance, which gives specialized producers room to grow. Asahi Songwon runs 13,800 metric tons a year of blue pigment capacity at Dahej and set up an azo pigment venture with U.K.-based Tennants for red, yellow and orange grades. Sudarshan Colorants India offers more than 500 organic pigment products and launched new Hostaperm and Novoperm grades in fiscal 2024-25. Meghmani Organics announced a 33,000 metric ton a year titanium dioxide plant at Dahej in 2021. In turn, functional masterbatch makers gain local access to heat-stable grades.
Export slowdown and effluent rules test producers
How do weaker exports and U.S. tariffs hurt producers?
Export markets absorb a large share of Indian dye output, so overseas weakness quickly cuts plant utilization. CareEdge Ratings projected that the dyes and pigments industry would contract by 5% to 7% in fiscal 2025-26, with export volume falling about 12%, as reported by ALCHEMPro in January 2026. U.S. tariffs on certain dye and pigment products add further pressure on exporters. As a result, exporters are diverting volume to domestic buyers, which tightens local prices and margins.
Why do effluent rules raise costs in dye clusters?
Dye and intermediate plants generate colored, high-salt effluent that must be treated before discharge, and the Gujarat and Maharashtra clusters face close scrutiny from pollution control boards. Smaller units often depend on common effluent treatment plants with limited capacity, so tighter norms can force output cuts or temporary closures. In turn, compliance spending weighs most on small producers, while larger groups invest in zero-liquid discharge and solvent recovery to protect licenses.
How does dependence on imported intermediates create risk?
Many pigment and dye makers still buy key intermediates from China, which exposes them to sudden price and supply swings. Chinese imports supplied about 40% of Indian arylide demand in the period ending September 2025, according to trade remedy findings. When Chinese prices fall, domestic intermediate makers lose orders, but when supply tightens, downstream producers face shortages. As a result, buyers are signing longer contracts and backing domestic intermediate capacity.
Why does price competition squeeze smaller producers?
The industry includes a large number of small and mid-sized dye units that sell similar reactive and acid grades on price. When export orders fall, these producers cut prices to keep plants running, which drags down realizations for commodity grades. In turn, smaller units with limited working capital struggle to fund compliance and new chemistry, while integrated producers use backward integration and specialty grades to defend margins.
Gujarat and Maharashtra anchor the western lead
| Region | Value, 2025 (USD billion) | Share, 2025 | CAGR, 2026–2035 |
|---|---|---|---|
| Western India | 2.78 | 52.0% | 5.57% |
| Southern India | 1.12 | 21.0% | 6.07% |
| Northern and Central India | 0.91 | 17.0% | 5.97% |
| Eastern India | 0.53 | 10.0% | 6.22% |
Why does Western India hold the largest share?
Western India held 52.0% of 2025 value and grows at 5.57% a year, because Gujarat and Maharashtra produced 31.5% and 15.8% of the value of chemical output in 2023-24, according to Annual Survey of Industries data. Gujarat accounts for roughly three-quarters of dye and dye intermediate production, according to Indian Chemical News. Bodal Chemicals runs dye plants at Padra and Saykha, while Shree Pushkar launched a 6,000 metric ton a year dyes unit at Lote Parshuram in Maharashtra in September 2026. As a result, the zone serves both export and domestic buyers.
How does Southern India add capacity and textile demand?
Southern India held 21.0% of 2025 value and grows at 6.07% a year, because Tamil Nadu, Andhra Pradesh, Telangana and Karnataka combine textile processing with growing chemical output. Tamil Nadu and Andhra Pradesh produced 4.8% and 4.5% of chemical output in 2023-24. PM MITRA parks at Virudhnagar, Warangal and Kalaburagi add processing capacity, while Ultramarine & Pigments plans an inorganic pigment plant at Manapparai. In turn, local supply is moving closer to southern textile and paint buyers.
Why are Northern and Central India gaining processing capacity?
Northern and Central India held 17.0% of 2025 value and grows at 5.97% a year, because Uttar Pradesh, Madhya Pradesh, Rajasthan and Punjab are adding textile and paint capacity. Uttar Pradesh produced 7.3% of the value of chemical output in 2023-24. The Dhar PM MITRA park in Madhya Pradesh drew INR 14,099 crore of MoUs and expressions of interest, the most of any park, and Lucknow drew INR 5,270 crore. As a result, dye demand from new process houses rises across the zone.
Why is eastern India the fastest-growing zone?
Eastern India held 10.0% of 2025 value and grows fastest at 6.22% a year, because demand starts from a lower base and new housing and paint capacity are arriving. West Bengal produced 4.1% of chemical output in 2023-24, the largest share in the zone. Birla Opus planned commercial production at its Kharagpur paint plant in West Bengal in the first half of fiscal 2025-26. In turn, pigment suppliers are extending distribution into eastern paint and plastics markets.
Acquisitions, duties and new plants marked 2025-2026
| Development | Status and market relevance |
|---|---|
| In March 2025, Sudarshan Chemical Industries completed its acquisition of the Heubach Group global pigment business. | Adds 19 international sites and high-performance pigment technology |
| In June 2025, India imposed countervailing duties of 11.18% to 25.76% on mica pearlescent pigments from China. | Protects domestic effect pigment makers for five years |
| In December 2025, Zhejiang Longsheng completed its USD 688.9 million buyback of Kiri Industries' 37.5% stake in DyStar. | Ends the shareholder dispute and leaves DyStar wholly owned by Longsheng |
| In May 2026, Ultramarine & Pigments approved an INR 250 crore inorganic pigment plant at Manapparai, Tamil Nadu. | Adds 2,500 metric tons a year in phases through fiscal 2028-29 |
| In September 2026, Shree Pushkar Chemicals launched its Unit-5 dyes plant at Lote Parshuram, Maharashtra. | Adds 6,000 metric tons a year of dyes capacity |
Reactive, disperse and phthalocyanine chemistry lead
- Reactive dyes bond chemically with cotton and viscose fibers, which gives strong wash fastness and keeps them central to Indian cotton processing.
- Disperse dyes dissolve into polyester under heat and pressure, which makes them essential for synthetic and technical textiles.
- Phthalocyanine and azo pigments supply blue, green, red and yellow shades to paints, inks and plastics, where brightness and light fastness matter.
- Inorganic pigments such as titanium dioxide, iron oxides and ultramarine blue give opacity and weather resistance to paints, plastics and building materials.
Need a Custom Version of This Report?
Tailor the scope, geography, or segments to your exact requirements.
- Custom geography or segment scope
- Direct access to our analyst team
Integrated Gujarat producers compete on intermediates
Competition centers on integration into intermediates, export approvals, shade range and plant location, and most large producers sit in Gujarat and Maharashtra. Sudarshan Chemical Industries became a global pigment supplier after buying the Heubach business in March 2025, and its Indian affiliate Sudarshan Colorants India runs plants at Roha, Cuddalore and Nagda. Asahi Songwon leads in phthalocyanine blues from Dahej, while Bodal Chemicals combines H acid and vinyl sulphone with 29,000 metric tons a year of dyestuff capacity. Atul supplies colorants and dye intermediates from its Valsad complex, and Vipul Organics, Ultramarine & Pigments and Shree Pushkar are adding plants. Demand from the domestic paint industry rewards suppliers with consistent quality, while textile buyers favor producers with broad reactive and disperse ranges.
Companies profiled and their roles in this market
| Company | Type | Role in the market |
|---|---|---|
| Sudarshan Chemical Industries Limited | Pigment maker | Completed the Heubach global pigment acquisition in March 2025 |
| Heubach Colorants India Limited | Organic pigment maker | Renamed Sudarshan Colorants India in December 2025; plants at Roha, Cuddalore, Nagda |
| Asahi Songwon Colors Limited | Phthalocyanine and azo pigment maker | 13,800 metric tons a year of blue pigment capacity at Dahej |
| Bodal Chemicals Limited | Dye and intermediate maker | 29,000 metric tons a year of dyestuff capacity at Padra and Saykha |
| Atul Limited | Integrated chemical and colorant maker | Colorants and dye intermediates from its Valsad complex |
| Kiri Industries Limited | Dye and intermediate maker | Exited its 37.5% DyStar stake in December 2025 |
| Vipul Organics Limited | Pigment and dye maker | Greenfield pigment powder plant at Sayakha, Gujarat |
| Ultramarine & Pigments Limited | Inorganic pigment maker | INR 250 crore plant approved at Manapparai, Tamil Nadu |
| Shree Pushkar Chemicals & Fertilisers Limited | Dye maker | Unit-5 adds 6,000 metric tons a year at Lote Parshuram |
| Meghmani Organics Limited | Pigment maker | Announced a 33,000 metric ton titanium dioxide plant at Dahej |
Credence Research view on Indian colorant demand
Credence Research's view is that Indian demand for dyes and pigments will grow faster than the domestic economy's chemical average, because textile parks, housing-led paint demand and plastics conversion all add volume. Inorganic pigments keep the largest share, while organic pigments grow fastest as coatings and inks move up in quality. Export weakness in fiscal 2025-26 is a near-term drag, yet trade remedies and new local capacity should support domestic supply. Western India keeps its lead, while eastern and southern zones gain share as plants and textile parks spread. Integrated producers with their own intermediates and export approvals should gain the most share.
Chemical statistics and filings anchor the model
The report uses 2025 as the base year on a calendar basis, and market values come from the Credence Research model. That model combines chemical production and trade statistics, Annual Survey of Industries state data, paint and textile industry indicators, and company plant capacities. Segment splits, zone shares and growth rates are Credence Research estimates built from state chemical output, dye-cluster locations and textile park data. Sources used are official statistics, parliamentary replies, government releases, trade remedy records, company filings and releases, and trade press, and no interviews or surveys were used.
Local capacity and textile parks carry growth to 2035
Sales of dyes and pigments in India are expected to reach USD 9.43 billion by 2035, a 5.81% CAGR during 2026–2035, as textile processing, paint output and plastics conversion keep demand rising. Growth may be softer in fiscal 2025-26 as exports slow, then pick up as PM MITRA parks and new paint plants come on stream. After 2030, specialty pigments and technical textile dyes should set the pace. Stronger export recovery would favor Gujarat producers, while faster housing completions would lift pigment demand. Organic pigments are expected to gain the most product share through 2035.
Frequently Asked Questions
How big is the India dyes and pigments market?
Which product type leads demand in India?
Which region leads the Indian market?
Why do textiles lead by application?
How do PM MITRA parks affect colorant demand?
How are trade remedies changing supply?
Who are the leading suppliers in India?
What are the main challenges for producers?
Table of Content
Chapter 1 Market Segmentation
- 1.1 Segmentation Framework
- 1.1.1 Product and Service Classification
- 1.1.2 Application and End-Use Classification
- 1.1.3 Technology and Solution Classification
- 1.1.4 Customer and Distribution Channel Classification
- 1.1.5 Geographic Segmentation
- 1.1.6 Market Segment Definitions and Boundaries
- 1.2 By Product Type
- 1.2.1 Inorganic Pigments
- 1.2.2 Reactive Dyes
- 1.2.3 Organic Pigments
- 1.2.4 Other Dyes
- 1.2.5 Disperse Dyes
- 1.3 By Application
- 1.3.1 Textiles
- 1.3.2 Paints and Coatings
- 1.3.3 Plastics
- 1.3.4 Printing Inks
- 1.3.5 Others
Chapter 2 Introduction
- 2.1 Report Objectives and Scope
- 2.2 Product Definition and Industry Terminology
- 2.3 Market Inclusions and Exclusions
- 2.4 Research Process
- 2.4.1 Primary Research and Expert Interviews
- 2.4.2 Secondary Research and Source Review
- 2.4.3 Top-Down and Bottom-Up Estimation
- 2.4.4 Data Triangulation and Verification
- 2.5 Market Size Measurement Basis
- 2.5.1 2025: USD 5.34 billion → 2035: USD 9.43 billion
- 2.6 Historical and Forecast Reference Periods
- 2.6.1 Historical Period: 2018-2025
- 2.6.2 Base Year: 2025
- 2.6.3 Forecast Period: 2025-2035
- 2.7 Research Assumptions and Limitations
Chapter 3 Executive Summary
- 3.1 Market Snapshot and Key Findings
- 3.2 Base-Year Market Size, 2025
- 3.3 Forecast Market Size, 2035
- 3.4 Revenue and Volume Growth Outlook
- 3.5 Key Demand and Supply Indicators
- 3.6 Leading Market Segments
- 3.7 Fastest-Growing Market Opportunities
- 3.8 Regional Performance Highlights
- 3.9 Technology and Industry Transformation
- 3.10 Competitive Landscape Summary
- 3.11 Analyst View and Strategic Implications
Chapter 4 India Dyes and Pigments Market Trends and Developments
- 4.1 Historical Industry Development, 2018-2025
- 4.2 Recent Market Trends and Developments
- 4.3 Demand and Customer Behavior Trends
- 4.4 Technology and Product Innovation
- 4.5 Artificial Intelligence, Automation and Digitalization
- 4.6 Local Manufacturing and Supply Chain Realignment
- 4.7 Industry Partnerships, Mergers and Acquisitions
- 4.8 Sustainability and Circular Economy Developments
- 4.9 Government and Private Sector Investment Trends
- 4.10 Emerging Business Models and Commercialization
- 4.11 Industry Developments and Announcements
Chapter 5 India Dyes and Pigments Market Production, Supply and Demand Analysis
- 5.1 Demand Trend and Consumption Analysis, 2018-2025
- 5.2 Demand Forecast, 2025-2035
- 5.3 Production and Output Trend, 2018-2025
- 5.4 Production and Output Forecast, 2025-2035
- 5.5 Installed Capacity and Capacity Utilization
- 5.6 Company-Wise Production Plants and Statistics
- 5.6.1 Installed Production Capacity
- 5.6.2 Actual Production
- 5.6.3 Planned Capacity and Expansion Targets
- 5.7 Supply Chain Structure and Procurement Trends
- 5.8 Supply-Demand Gap and Bottlenecks
- 5.9 Import Dependence and Sourcing Structure
- 5.10 Contract Manufacturing and Outsourcing
- 5.11 Regional Supply and Demand Concentration
Chapter 6 India Dyes and Pigments Market Pricing Analysis
- 6.1 Pricing Structure and Measurement
- 6.2 Historical Pricing Trends, 2018-2025
- 6.3 Pricing Outlook, 2025-2035
- 6.4 Average Selling Price and Unit Economics
- 6.5 Pricing by Product and Market Segment
- 6.6 Geographic Pricing Differences
- 6.7 Key Input, Energy, Labor and Logistics Costs
- 6.8 Contract Pricing and Purchasing Models
- 6.9 Pricing Sensitivity and Competitive Positioning
- 6.10 Price, Margin and Profitability Implications
Chapter 7 India Dyes and Pigments Market Dynamics
- 7.1 Market Growth Drivers
- 7.1.1 Demand-Side Drivers
- 7.1.2 Technology and Innovation Drivers
- 7.1.3 Infrastructure and Investment Drivers
- 7.1.4 Regulatory and Policy Drivers
- 7.2 Market Restraints
- 7.2.1 Cost and Affordability Constraints
- 7.2.2 Technology and Adoption Barriers
- 7.2.3 Supply Chain and Operational Constraints
- 7.3 Market Challenges
- 7.3.1 Competitive Pressure and Margin Erosion
- 7.3.2 Skills, Infrastructure and Implementation Gaps
- 7.4 Emerging Market Opportunities
- 7.5 Market Dynamics Impact and Time-Horizon Assessment
Chapter 8 India Dyes and Pigments Value Chain Analysis
- 8.1 Industry Value Chain Overview
- 8.2 Upstream Suppliers and Critical Inputs
- 8.3 Technology and Component Providers
- 8.4 Manufacturing or Service Delivery
- 8.5 Distribution, Channel Partners and Integrators
- 8.6 Downstream Applications and End Users
- 8.7 Value Addition and Profit Pools
- 8.8 Vertical Integration and Outsourcing
- 8.9 Supplier Concentration and Risk
- 8.10 Supply Chain Localization and Resilience
Chapter 9 India Dyes and Pigments Market Regulations and Policies
- 9.1 Relevant Laws, Standards and Compliance Frameworks
- 9.2 Product, Service, Safety and Quality Requirements
- 9.3 Government Policies, Incentives and Subsidies
- 9.4 Imports, Exports and Trade Barriers
- 9.5 Public Procurement and Local Content Requirements
- 9.6 Environmental and Sustainability Compliance
- 9.7 Upcoming Policy Changes and Market Implications
Chapter 10 India Dyes and Pigments Market Hotspots and Opportunities
- 10.1 Market Opportunity Mapping and Growth Hotspots
- 10.2 High-Growth Applications and Customer Groups
- 10.3 Underserved Markets and White-Space Opportunities
- 10.4 Emerging Technology and Product Opportunities
- 10.5 New Capacity and Investment Hotspots
- 10.6 Market Entry and Expansion Opportunities
- 10.7 Distribution and Partnership Opportunities
- 10.8 Near-Term and Long-Term Commercial Potential
- 10.9 Opportunity Attractiveness and Execution Risks
Chapter 11 India Dyes and Pigments Market Outlook, 2025-2035
- 11.1 Market Size and Analysis
- 11.1.1 Revenue (Market Measurement: 2025: USD 5.34 billion → 2035: USD 9.43 billion)
- 11.1.2 Market Volume and Quantity Sold
- 11.1.3 Historical Market Size, 2018-2025
- 11.1.4 Base-Year Market Size, 2025
- 11.2 Market Forecast, 2025-2035
- 11.2.1 Revenue Forecast to 2035
- 11.2.2 Volume Forecast to 2035
- 11.2.3 CAGR and Year-on-Year Growth
- 11.2.4 Incremental Revenue Opportunity
- 11.3 Forecast Assumptions and Scenario Analysis
- 11.3.1 Base-Case Forecast
- 11.3.2 Optimistic and Conservative Scenarios
- 11.3.3 Technology, Pricing and Policy Sensitivities
- 11.4 Market Attractiveness and Growth Outlook
Chapter 12 India Dyes and Pigments Market Segmentation and Outlook
- 12.1 Segmentation Summary and Market Shares, 2025
- 12.2 Largest and Fastest-Growing Segments
- 12.3 By Product Type - Market Size and Forecast, 2025-2035
- 12.3.1 Segment Definition and Scope
- 12.3.2 Historical Market Size, 2018-2025
- 12.3.3 Revenue Forecast, 2025-2035
- 12.3.4 Volume Forecast, 2025-2035
- 12.3.5 Base-Year Market Share, 2025
- 12.3.6 Segment CAGR and Growth Drivers
- 12.3.7 Subsegment Market Size and Forecast
- 12.3.7.1 Inorganic Pigments
- 12.3.7.2 Reactive Dyes
- 12.3.7.3 Organic Pigments
- 12.3.7.4 Other Dyes
- 12.3.7.5 Disperse Dyes
- 12.3.8 Subsegment Pricing and Adoption Trends
- 12.3.9 Leading Suppliers and Competition
- 12.3.10 Regional Demand and Opportunities
- 12.4 By Application - Market Size and Forecast, 2025-2035
- 12.4.1 Segment Definition and Scope
- 12.4.2 Historical Market Size, 2018-2025
- 12.4.3 Revenue Forecast, 2025-2035
- 12.4.4 Volume Forecast, 2025-2035
- 12.4.5 Base-Year Market Share, 2025
- 12.4.6 Segment CAGR and Growth Drivers
- 12.4.7 Subsegment Market Size and Forecast
- 12.4.7.1 Textiles
- 12.4.7.2 Paints and Coatings
- 12.4.7.3 Plastics
- 12.4.7.4 Printing Inks
- 12.4.7.5 Others
- 12.4.8 Subsegment Pricing and Adoption Trends
- 12.4.9 Leading Suppliers and Competition
- 12.4.10 Regional Demand and Opportunities
- 12.5 Segment Growth Comparison
- 12.6 Segment Attractiveness and Priority Matrix
Chapter 13 India Dyes and Pigments End-Use and Application Market Outlook
- 13.1 End-Use Industry and Customer Demand Structure
- 13.2 Leading Applications and Customer Groups
- 13.3 End-Use Market Size, Share and Forecast
- 13.4 Major End-Use Industry Deep Dives
- 13.4.1 Customer Requirements and Use Cases
- 13.4.2 Demand and Replacement Cycles
- 13.4.3 Technical and Regulatory Considerations
- 13.4.4 Purchasing and Procurement Models
- 13.4.5 Leading Vendors and Distribution Channels
- 13.4.6 Forecast and Commercial Opportunities
- 13.5 Emerging Applications and Cross-Segment Demand
- 13.6 End-Use Industry Investment Priorities
Chapter 14 India Dyes and Pigments Geographic Market Outlook, 2025-2035
- 14.1 Domestic Market Distribution and Demand Clusters
- 14.2 State- or Province-Wise Market Size and Forecast, 2025-2035
- 14.3 City and Metropolitan Market Outlook
- 14.4 Industrial, Manufacturing and Commercial Clusters
- 14.5 Geographic Concentration of Key End Users
- 14.6 Local Pricing and Purchasing Differences
- 14.7 Domestic Production Facilities and Capacity Map
- 14.8 Local Infrastructure and Project Pipeline
- 14.9 State-Level Policy and Incentive Differences
- 14.10 Subnational Investment Hotspots and Opportunities
- 14.11 Distribution and Logistics Networks
- 14.12 Domestic Competitive Footprint
Chapter 15 India Dyes and Pigments Technology, Innovation and Sustainability Outlook
- 15.1 Technology Landscape and Maturity
- 15.2 Product, Process and Service Innovation
- 15.3 AI, Automation and Digital Tools in the Industry
- 15.4 Technology Adoption and Performance Benchmarking
- 15.5 Innovation Pipeline and R&D Investment
- 15.6 Patent and Intellectual Property Trends
- 15.7 Energy Efficiency and Resource Management
- 15.8 Sustainability, Recycling and Circularity
- 15.9 Technology Roadmap, 2025-2035
- 15.10 Risks of Obsolescence and Technology Substitution
Chapter 16 India Dyes and Pigments Market Key Strategic Imperatives
- 16.1 Growth and Market Entry Priorities
- 16.2 High-Return Products and Segments
- 16.3 Pricing, Profitability and Cost Optimization
- 16.4 Technology Investment and Product Differentiation
- 16.5 Supply Chain Localization and Resilience
- 16.6 Distribution and Customer Acquisition
- 16.7 Partnership, Acquisition and Capacity Strategy
- 16.8 Regional Expansion Priorities
- 16.9 Short-, Medium- and Long-Term Actions
Chapter 17 Competition Outlook
- 17.1 Industry Competition Characteristics
- 17.2 Market Structure and Concentration
- 17.3 Market Share and Competitive Positioning, 2025
- 17.4 Company-Wise Revenue and Product Benchmarking
- 17.5 Production and Service Capacity Benchmarking
- 17.6 Technology, Pricing and Differentiation
- 17.7 Regional Footprint and Distribution Strength
- 17.8 Mergers, Acquisitions and Strategic Alliances
- 17.9 New Entrants and Competitive Threats
- 17.10 Porter's Five Forces and Industry Attractiveness
- 17.11 Competitive Outlook, 2025-2035
Chapter 18 Company Profiles
- 18.1 Company Coverage and Selection Criteria
- 18.2 Sudarshan Chemical Industries Limited
- 18.2.1 Business Description
- 18.2.2 Company Ownership and Geographic Presence
- 18.2.3 Product and Service Portfolio
- 18.2.4 Manufacturing and Operating Footprint
- 18.2.5 Production Capacity and Expansion Plans
- 18.2.6 Financial Performance and Investment
- 18.2.7 Market Share and Competitive Position
- 18.2.8 Technology and Innovation Capabilities
- 18.2.9 Strategic Alliances or Partnerships
- 18.2.10 Recent Developments
- 18.2.11 Growth Strategy and Outlook
- 18.3 Atul Limited
- 18.4 Kiri Industries Limited
- 18.5 Bodal Chemicals Limited
- 18.6 Vipul Organics Limited
- 18.7 Ultramarine & Pigments Limited
- 18.8 Heubach Colorants India Limited
- 18.9 Meghmani Organics Limited
- 18.10 Shree Pushkar Chemicals & Fertilisers Limited
- 18.11 Asahi Songwon Colors Limited
- 18.12 Other Relevant Market Participants
Note: Every listed company is profiled on the structure shown under the first company. The company list is preliminary and may change based on research findings, market developments, data availability and client requirements.
Chapter 19 Disclaimer
- 19.1 Research and Forecast Disclaimer
- 19.2 Data Source and Estimation Limitations
Note: The depth of individual sections depends on data availability for this market. Volume, capacity, trade and other unit-based metrics are included where applicable.

