
Refining, petrochemicals and steel anchor Saudi gas demand
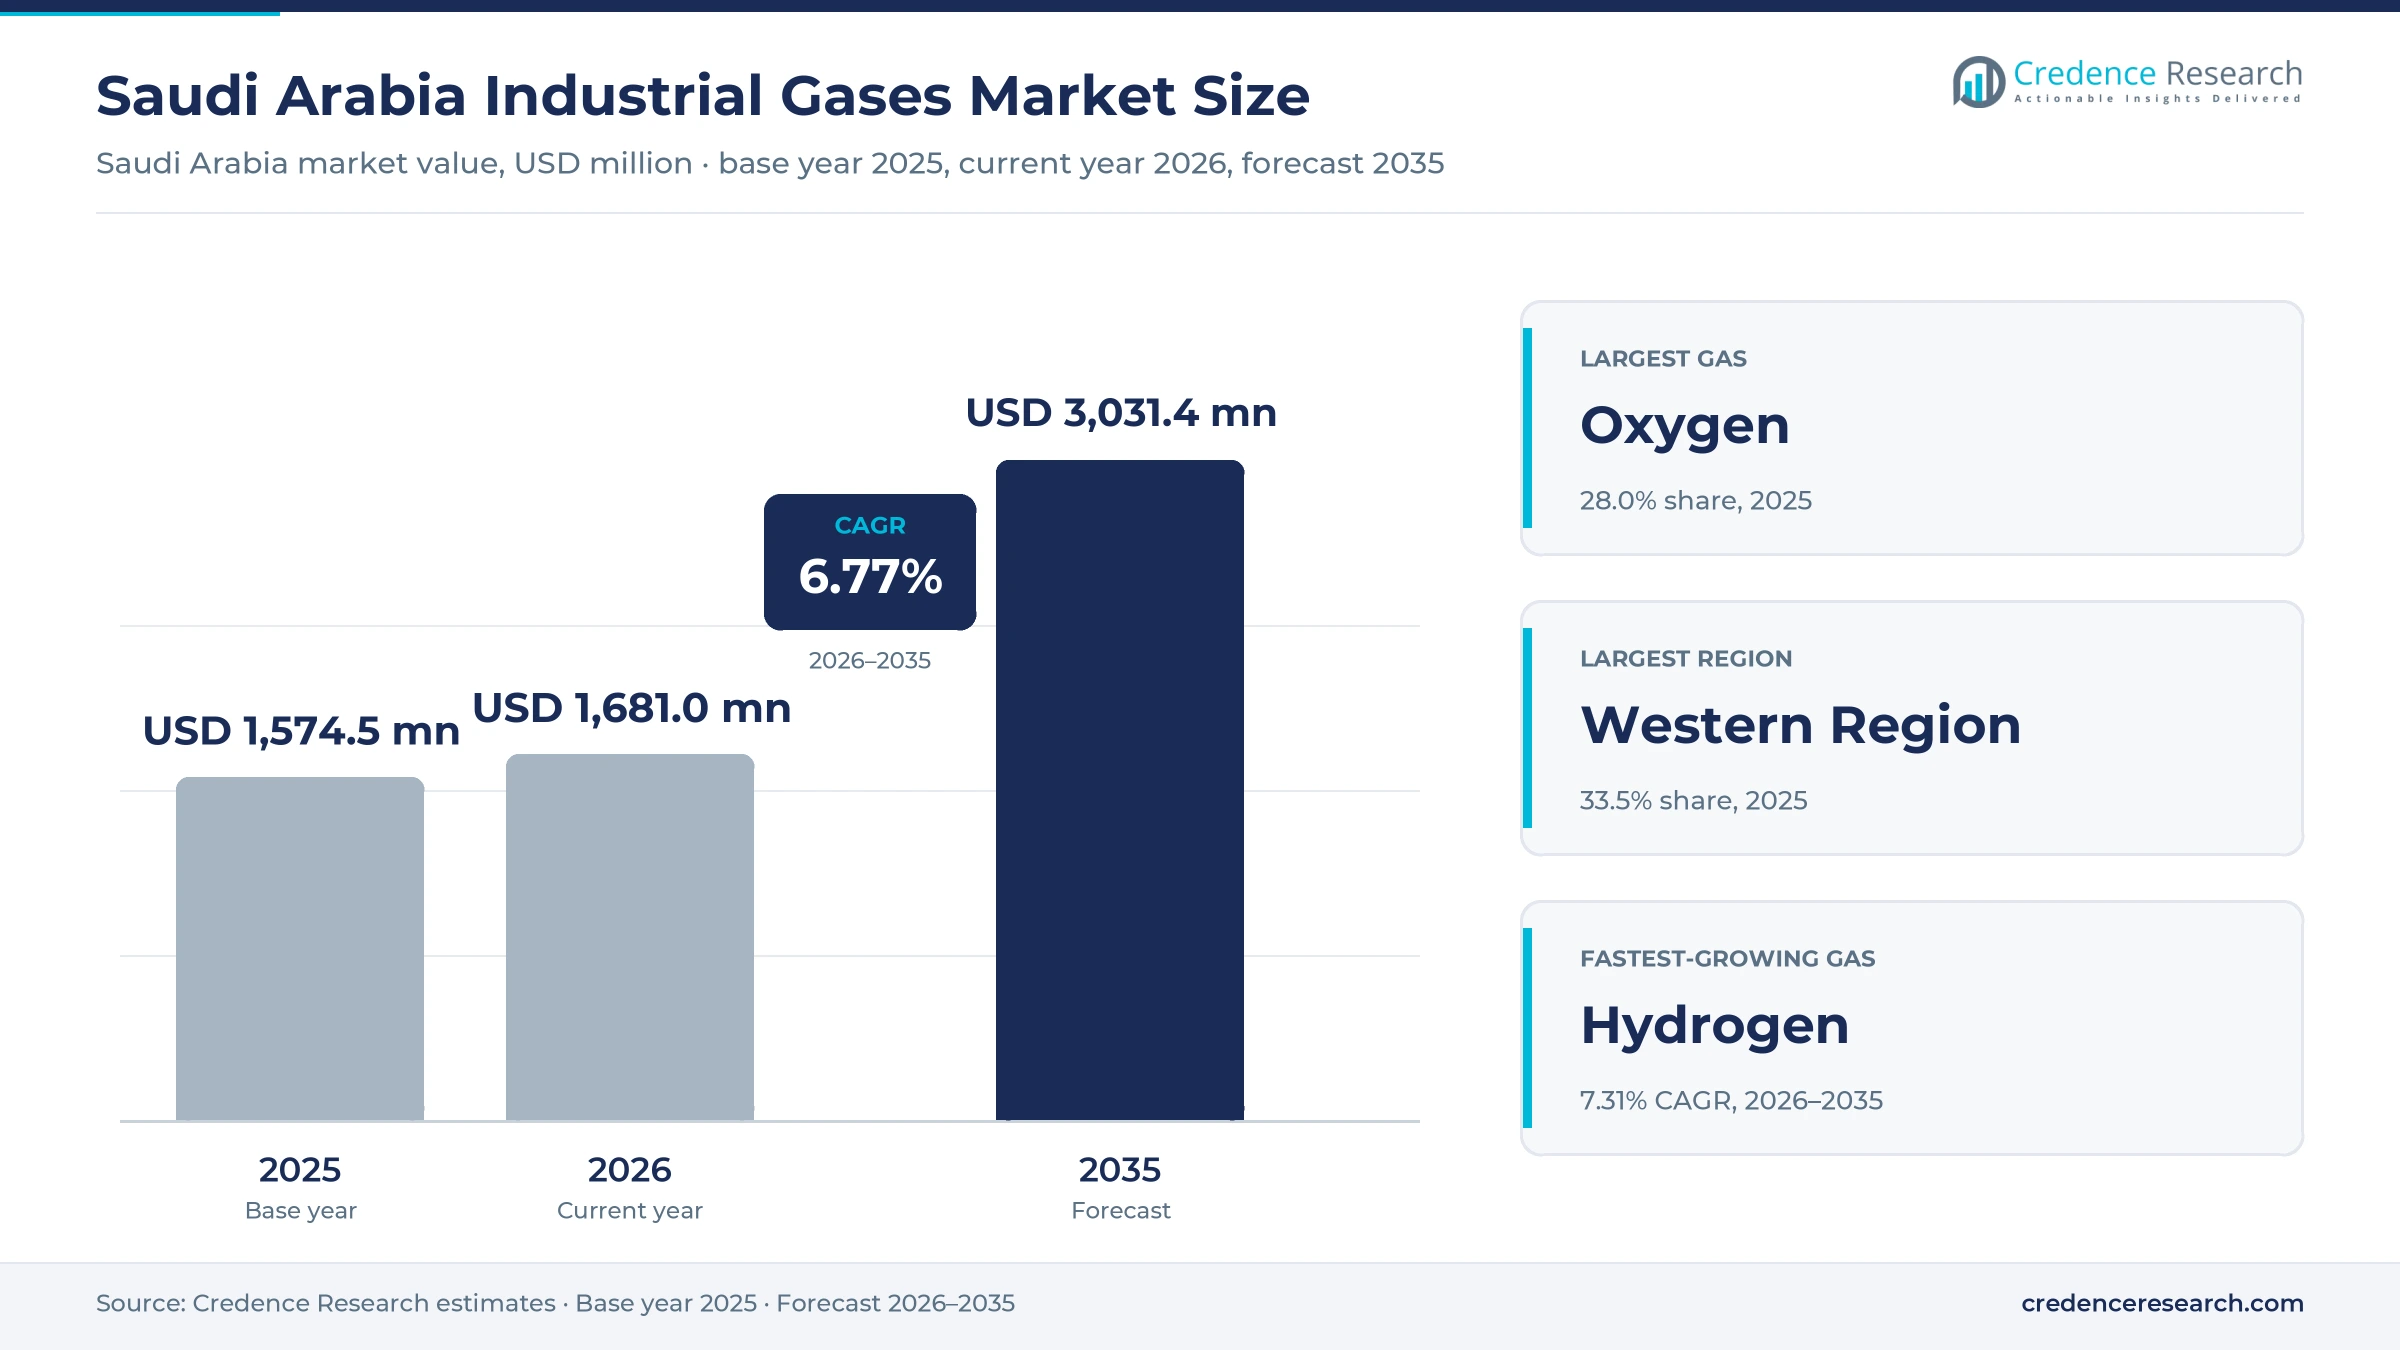
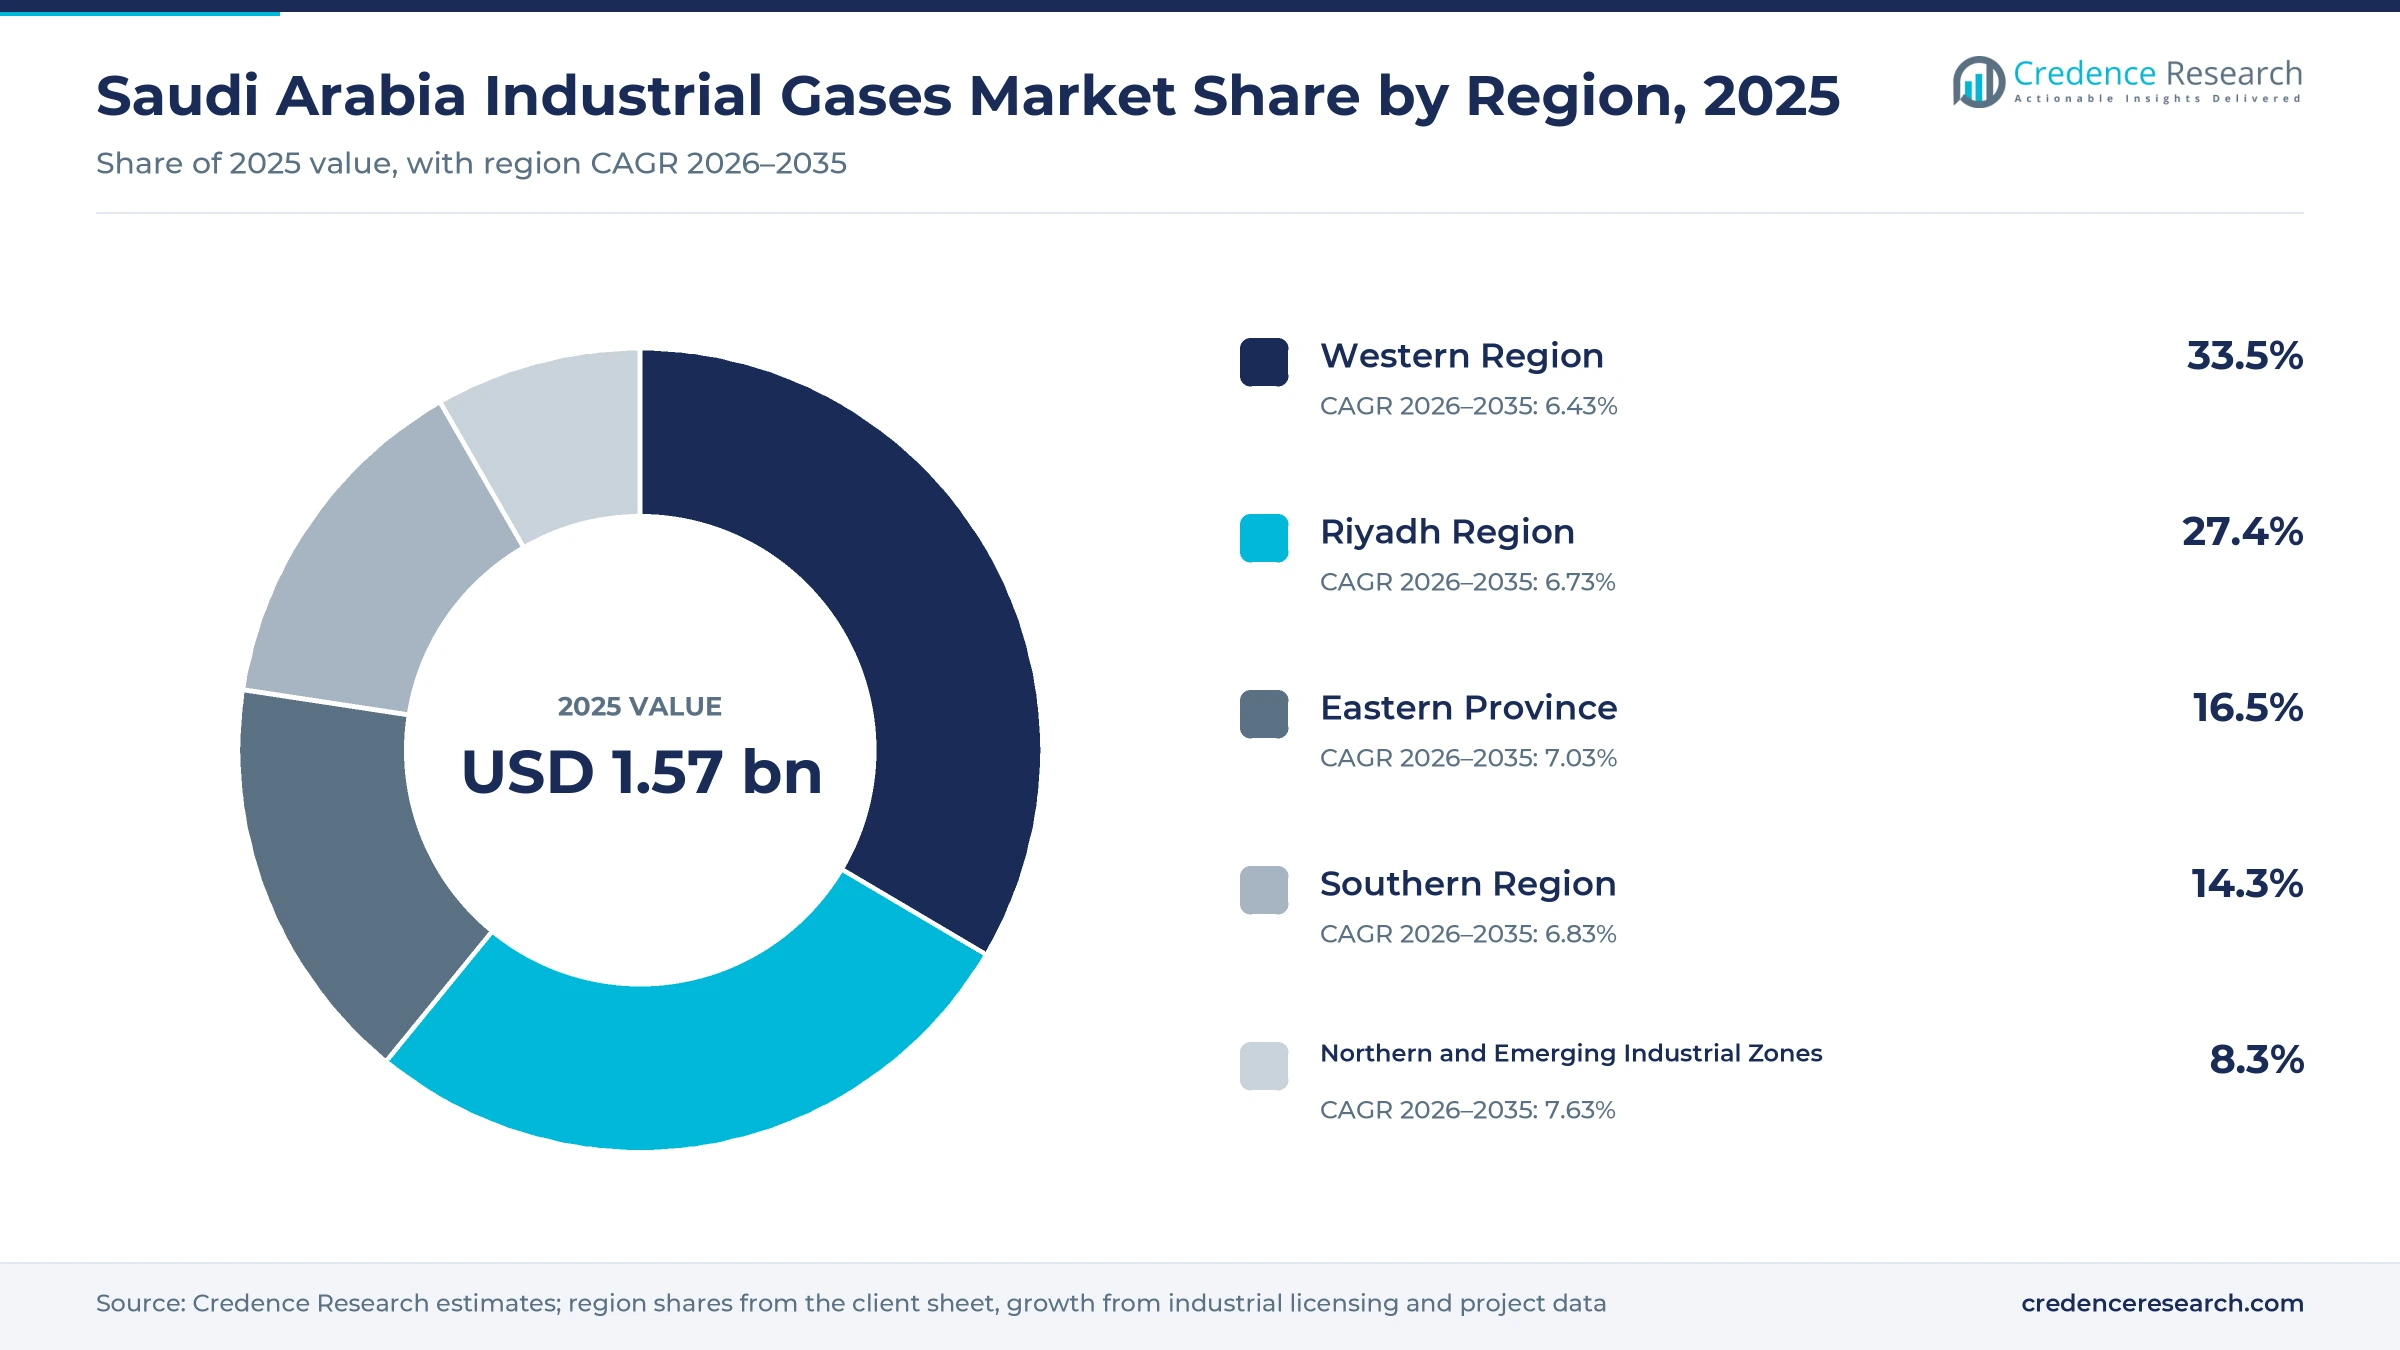
The Saudi Arabia industrial gases market was valued at USD 1.57 billion in 2025 and is projected to increase from USD 1.68 billion in 2026 to USD 3.03 billion by 2035, registering a CAGR of 6.77% during 2026–2035. Demand comes from refineries and petrochemical complexes that buy hydrogen, oxygen and nitrogen under long pipeline contracts, from steel mills and fabricators that use oxygen and argon, and from hospitals and food plants that need medical oxygen and carbon dioxide. The Western Region held the largest regional share, 33.5% in 2025, because the Yanbu and Rabigh refining complexes and the factories around Jeddah consume large volumes. The Northern and Emerging Industrial Zones are the fastest-growing region at 7.63% a year, as the NEOM green hydrogen plant moves toward first production. Supply is also changing, because Aramco agreed in July 2024 to take a 50% stake in a Jubail company that will make low-carbon hydrogen with carbon capture.
Which gases, buyers and supply modes does the estimate cover?
The estimate measures the value of oxygen, nitrogen, hydrogen, carbon dioxide, argon, acetylene and specialty gases sold in Saudi Arabia by gas companies. Values cover onsite and pipeline supply contracts, bulk liquid deliveries, packaged cylinders, distributor sales and public tenders for hospitals and institutions.
The estimate excludes captive production, such as hydrogen, nitrogen and ammonia that producers make and use inside their own plants without a gas supplier, natural gas and liquefied petroleum gas sold as fuel, and the equipment used to store gases. The value chain runs from air separation, reforming and recovery plants through pipelines, tankers and cylinder filling stations to refineries, chemical plants, mills, hospitals and food producers.
Saudi Arabia Industrial Gases Market Insights
- The Saudi Arabia industrial gases market was valued at USD 1.57 billion in 2025 and is projected to reach USD 3.03 billion by 2035, registering a CAGR of 6.77% during 2026–2035.
- The Western Region held a 33.5% share of 2025 value, because the Yanbu and Rabigh complexes and Jeddah factories draw large tonnage volumes.
- Petrochemicals and chemicals led end uses with a 31.0% share of 2025 value, because Jubail and Yanbu plants run on nitrogen, oxygen and hydrogen.
- The NEOM green hydrogen plant is designed to make 600 metric tons of hydrogen a day, with first product expected in 2027.
- Linde raised its stake in the Gulf gas supplier Airtec from 49% to more than 90% in September 2025.
Petrochemical users lead as hydrogen grows fastest
Why do oxygen and hydrogen carry the most value?
Based on product type, the market is categorized into oxygen, nitrogen, hydrogen, carbon dioxide, argon and acetylene and specialty gases. Oxygen led with a 28.0% share of 2025 value, because steel mills, refineries and gasification units buy it in very large tonnage. Hydrogen grows fastest at 7.31% a year, as refineries and new low-carbon projects in Jubail and NEOM add supply contracts.
How do petrochemical complexes dominate end-use demand?
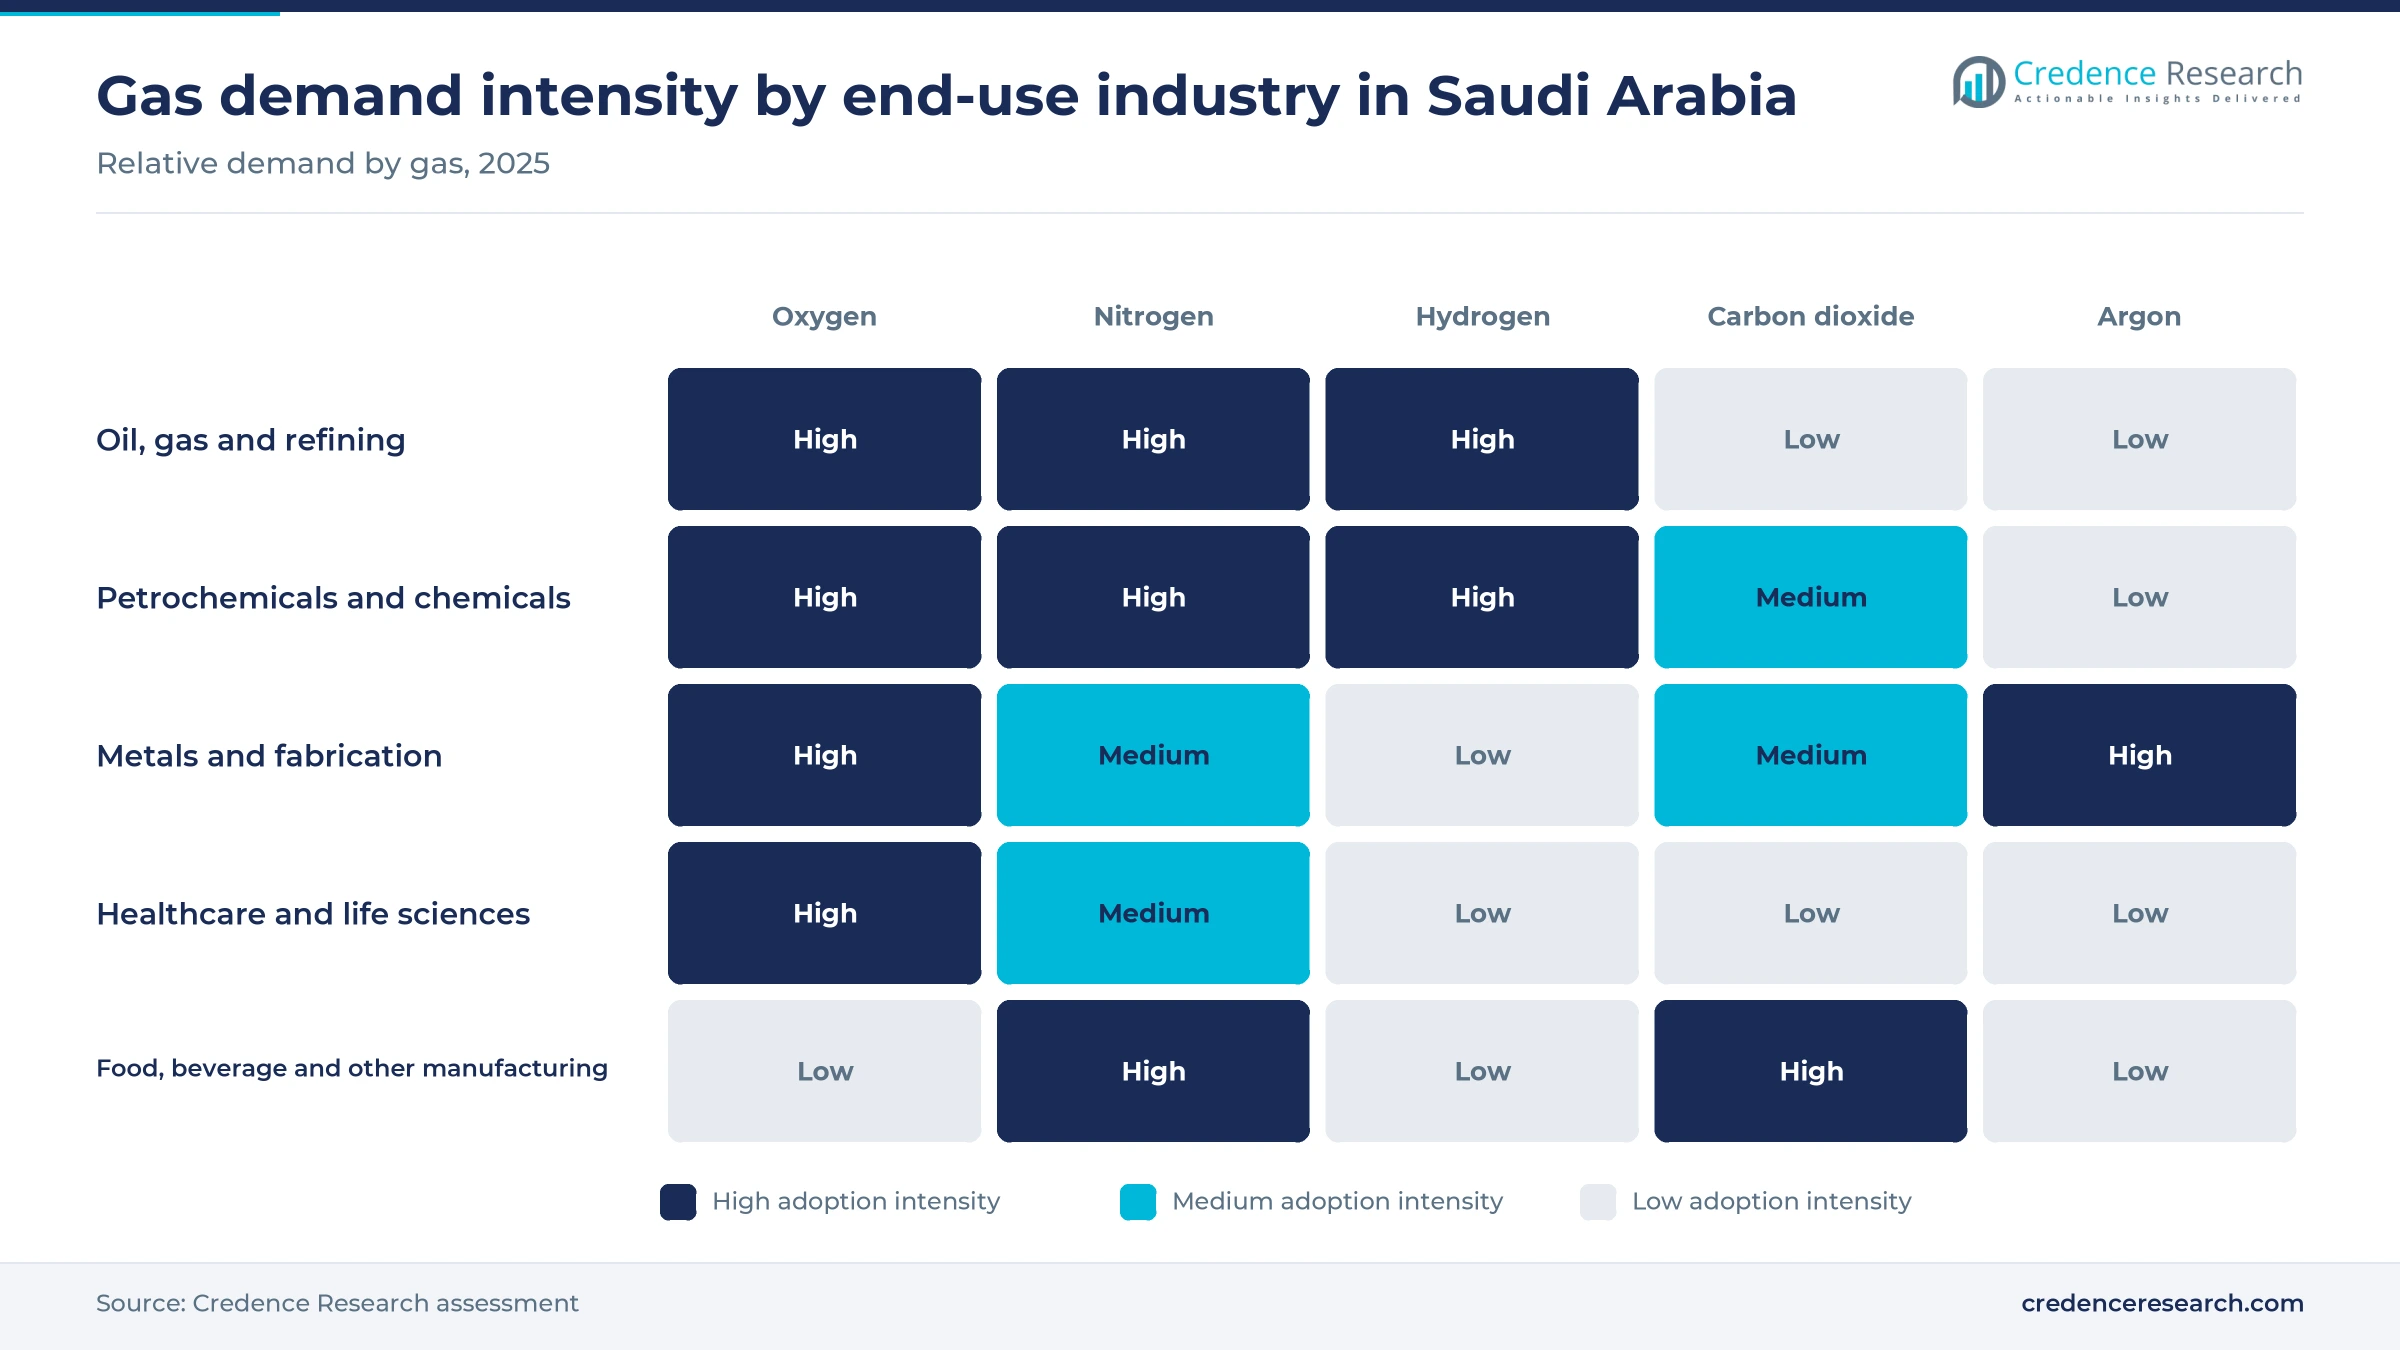
Based on end-use industry, the market is categorized into oil, gas and refining, petrochemicals and chemicals, metals and fabrication, healthcare and life sciences, and food, beverage and other manufacturing. Petrochemicals and Chemicals led with 31.0% of 2025 value, because Jubail and Yanbu plants need nitrogen blanketing and oxygen feed. Oil, Gas and Refining grows fastest at 7.12% a year, as refiners buy more hydrogen for cleaner fuels.
Why do onsite pipeline contracts hold the largest value?
Based on sales channel, the market is categorized into onsite pipeline contracts, bulk liquid direct sales, packaged cylinder direct sales, authorized distributors and government and institutional tenders. Onsite Pipeline Contracts led with 48.0% of 2025 value, because large refineries and chemical plants sign supply deals of 15 to 25 years. Onsite Pipeline Contracts grow fastest at 6.95% a year, as new hydrogen and carbon capture hubs come with dedicated pipelines.
Which production technologies supply Saudi buyers?
Based on technology, the market is categorized into cryogenic air separation, pressure swing adsorption, steam methane reforming with CCUS, electrolysis and carbon dioxide recovery and purification. Cryogenic Air Separation led with 52.0% of 2025 value, because it supplies most oxygen, nitrogen and argon. Electrolysis grows fastest at 10.62% a year from a small base, as the NEOM plant brings large electrolyzers into service.
| Segment Group | Leading Sub-segment | Share, 2025 | Fastest-growing Sub-segment | CAGR, 2026–2035 |
|---|---|---|---|---|
| By Product Type | Oxygen | 28.0% | Hydrogen | 7.31% |
| By End-Use Industry | Petrochemicals and Chemicals | 31.0% | Oil, Gas and Refining | 7.12% |
| By Sales Channel | Onsite Pipeline Contracts | 48.0% | Onsite Pipeline Contracts | 6.95% |
| By Technology | Cryogenic Air Separation | 52.0% | Electrolysis | 10.62% |
Request a Free Sample
Fill in your details and we'll send you a free sample report.
- Sample data tables & charts
- Research methodology
New factories, steel output and hydrogen projects lift sales
How does industrial localization expand the customer base?
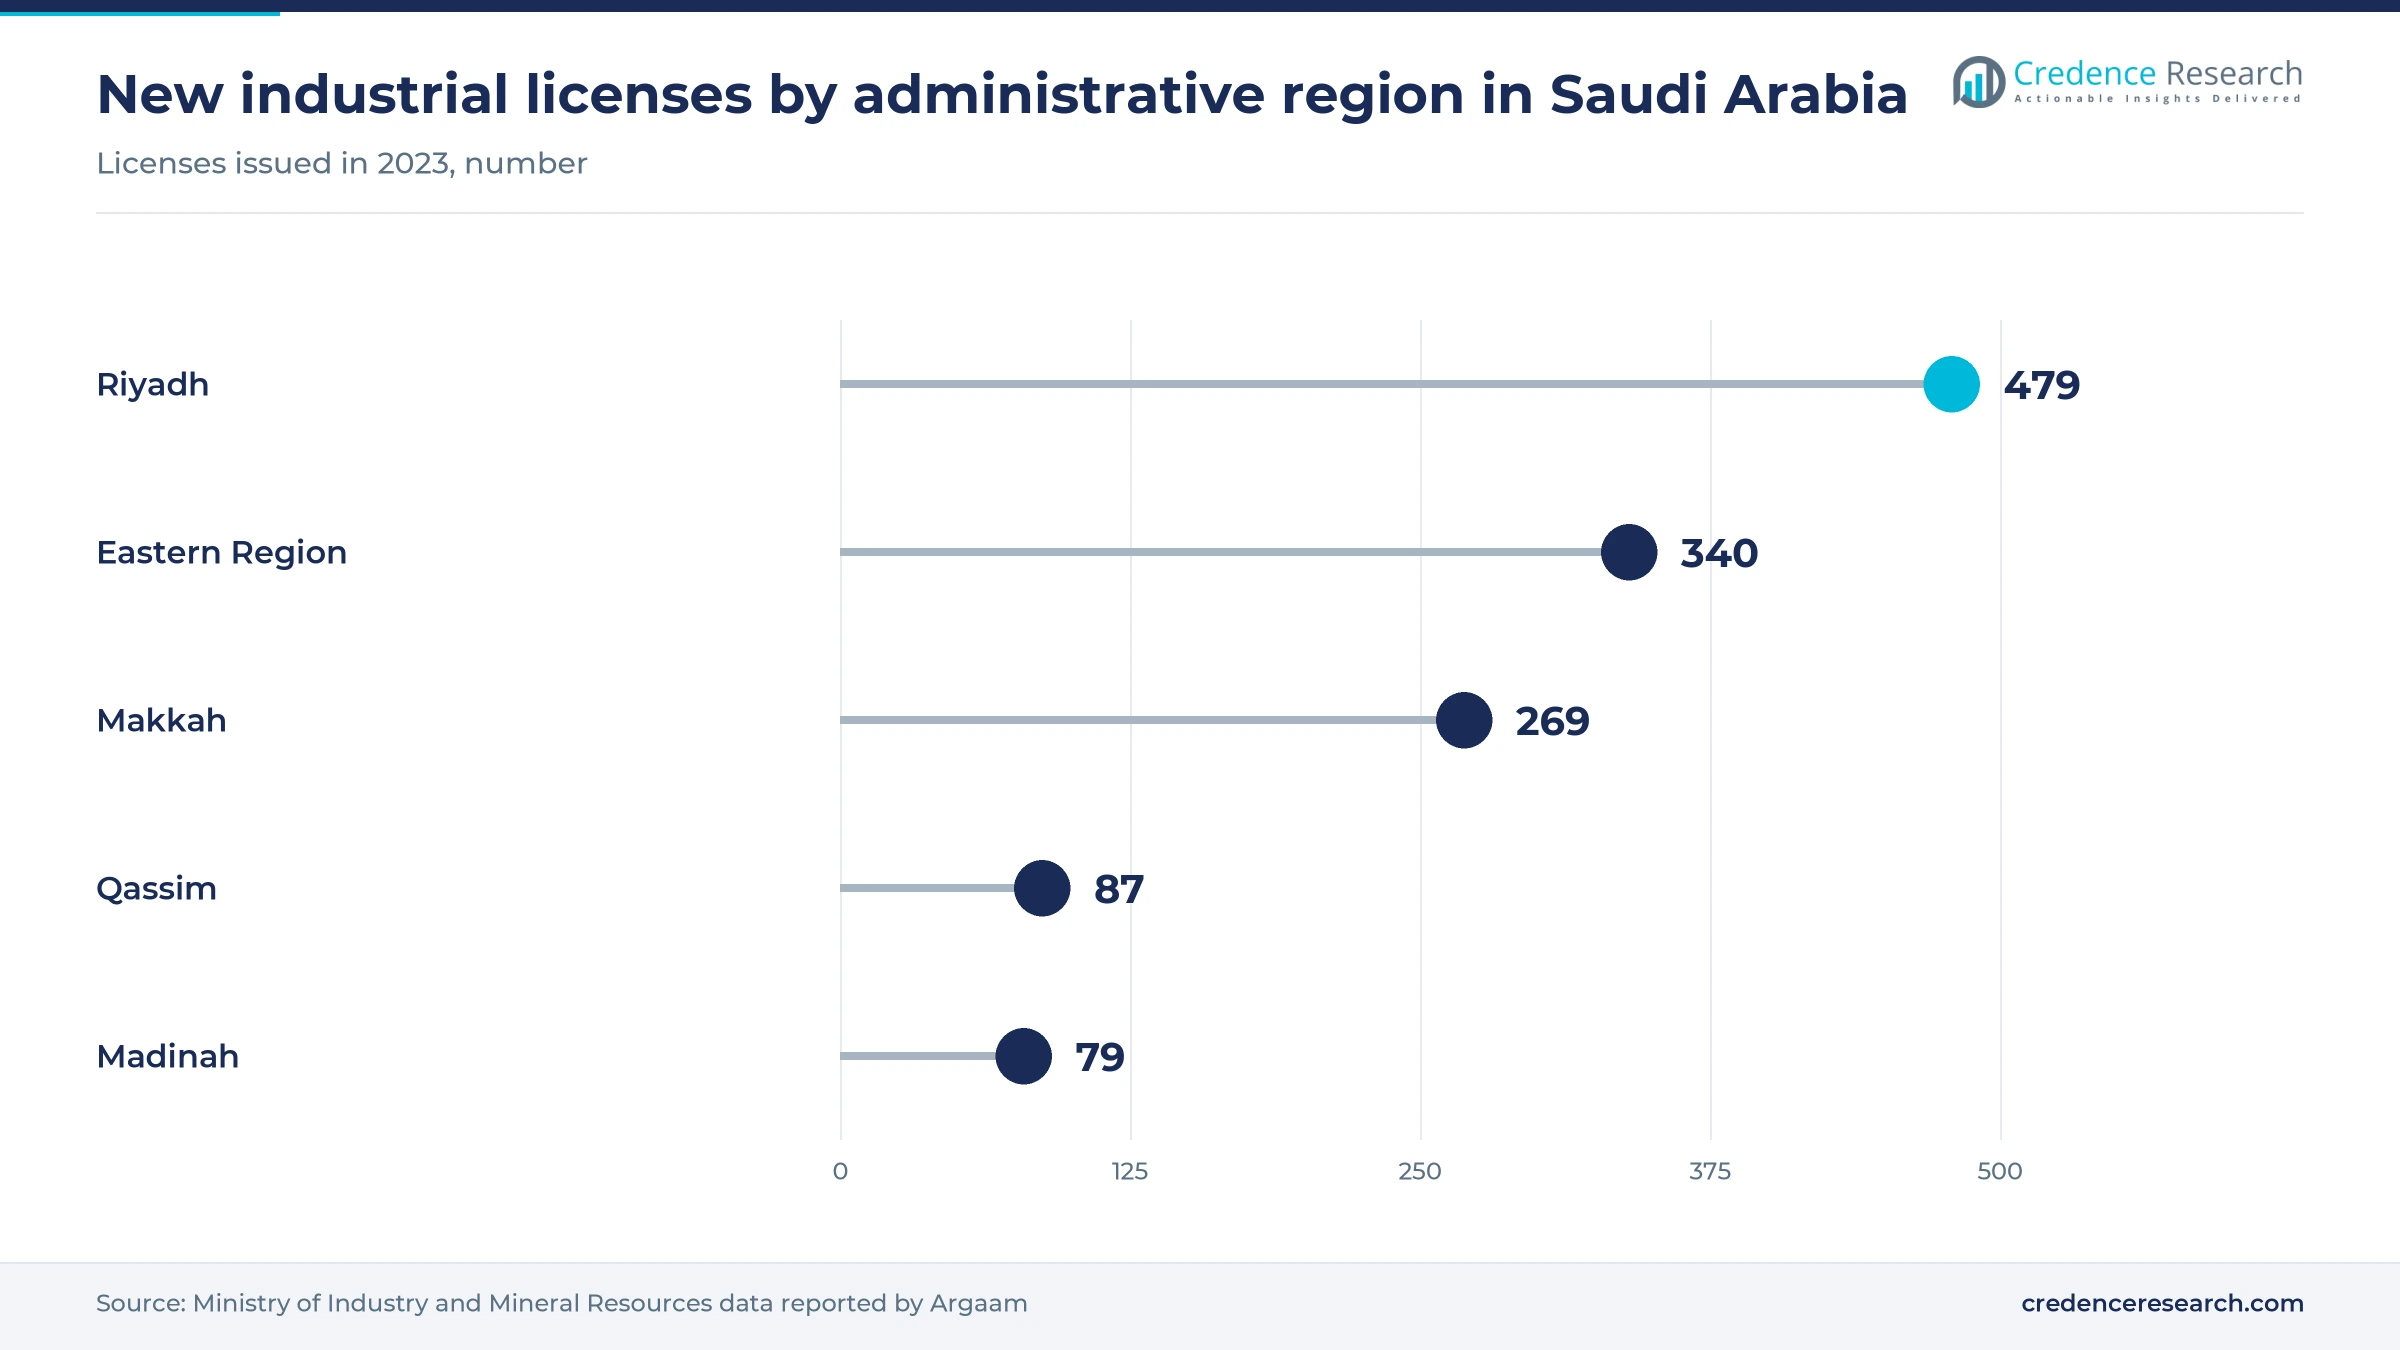
Saudi Arabia is adding factories quickly, which widens the base of plants that buy oxygen, nitrogen, argon and carbon dioxide. The Kingdom had about 11,549 factories at the end of 2023, up 10% in a year, and it issued 1,379 new industrial licenses worth more than SAR 82 billion that year, according to Argaam. Inside the 36 MODON industrial cities alone, the General Authority for Statistics counted 4,938 factories at the end of 2025, up 18.9%, according to Arab News. The National Industrial Strategy, launched in October 2022, targets 36,000 factories by 2035. As a result, bulk liquid and packaged cylinder sales gain new accounts each year across the main industrial cities.
Why do metals, refining and petrochemicals drive volume?
Heavy industry uses tonnage oxygen, nitrogen and hydrogen, so output growth in steel, refining and chemicals lifts gas volumes directly. Saudi mills produced 6.928 million tons of crude steel from January to August 2025, up 11.9% from a year earlier, according to Amlak, citing World Steel Association data. Manufacturing value added reached about $202 billion in 2025, near 15.8% of GDP, according to the World Bank. Aramco's Jazan refinery, built to process 400,000 barrels a day, receives oxygen from a joint venture led by Air Products under a 25-year contract. In turn, petrochemicals and chemicals led end uses with 31.0% of 2025 value.
How do hydrogen and carbon management projects add demand?
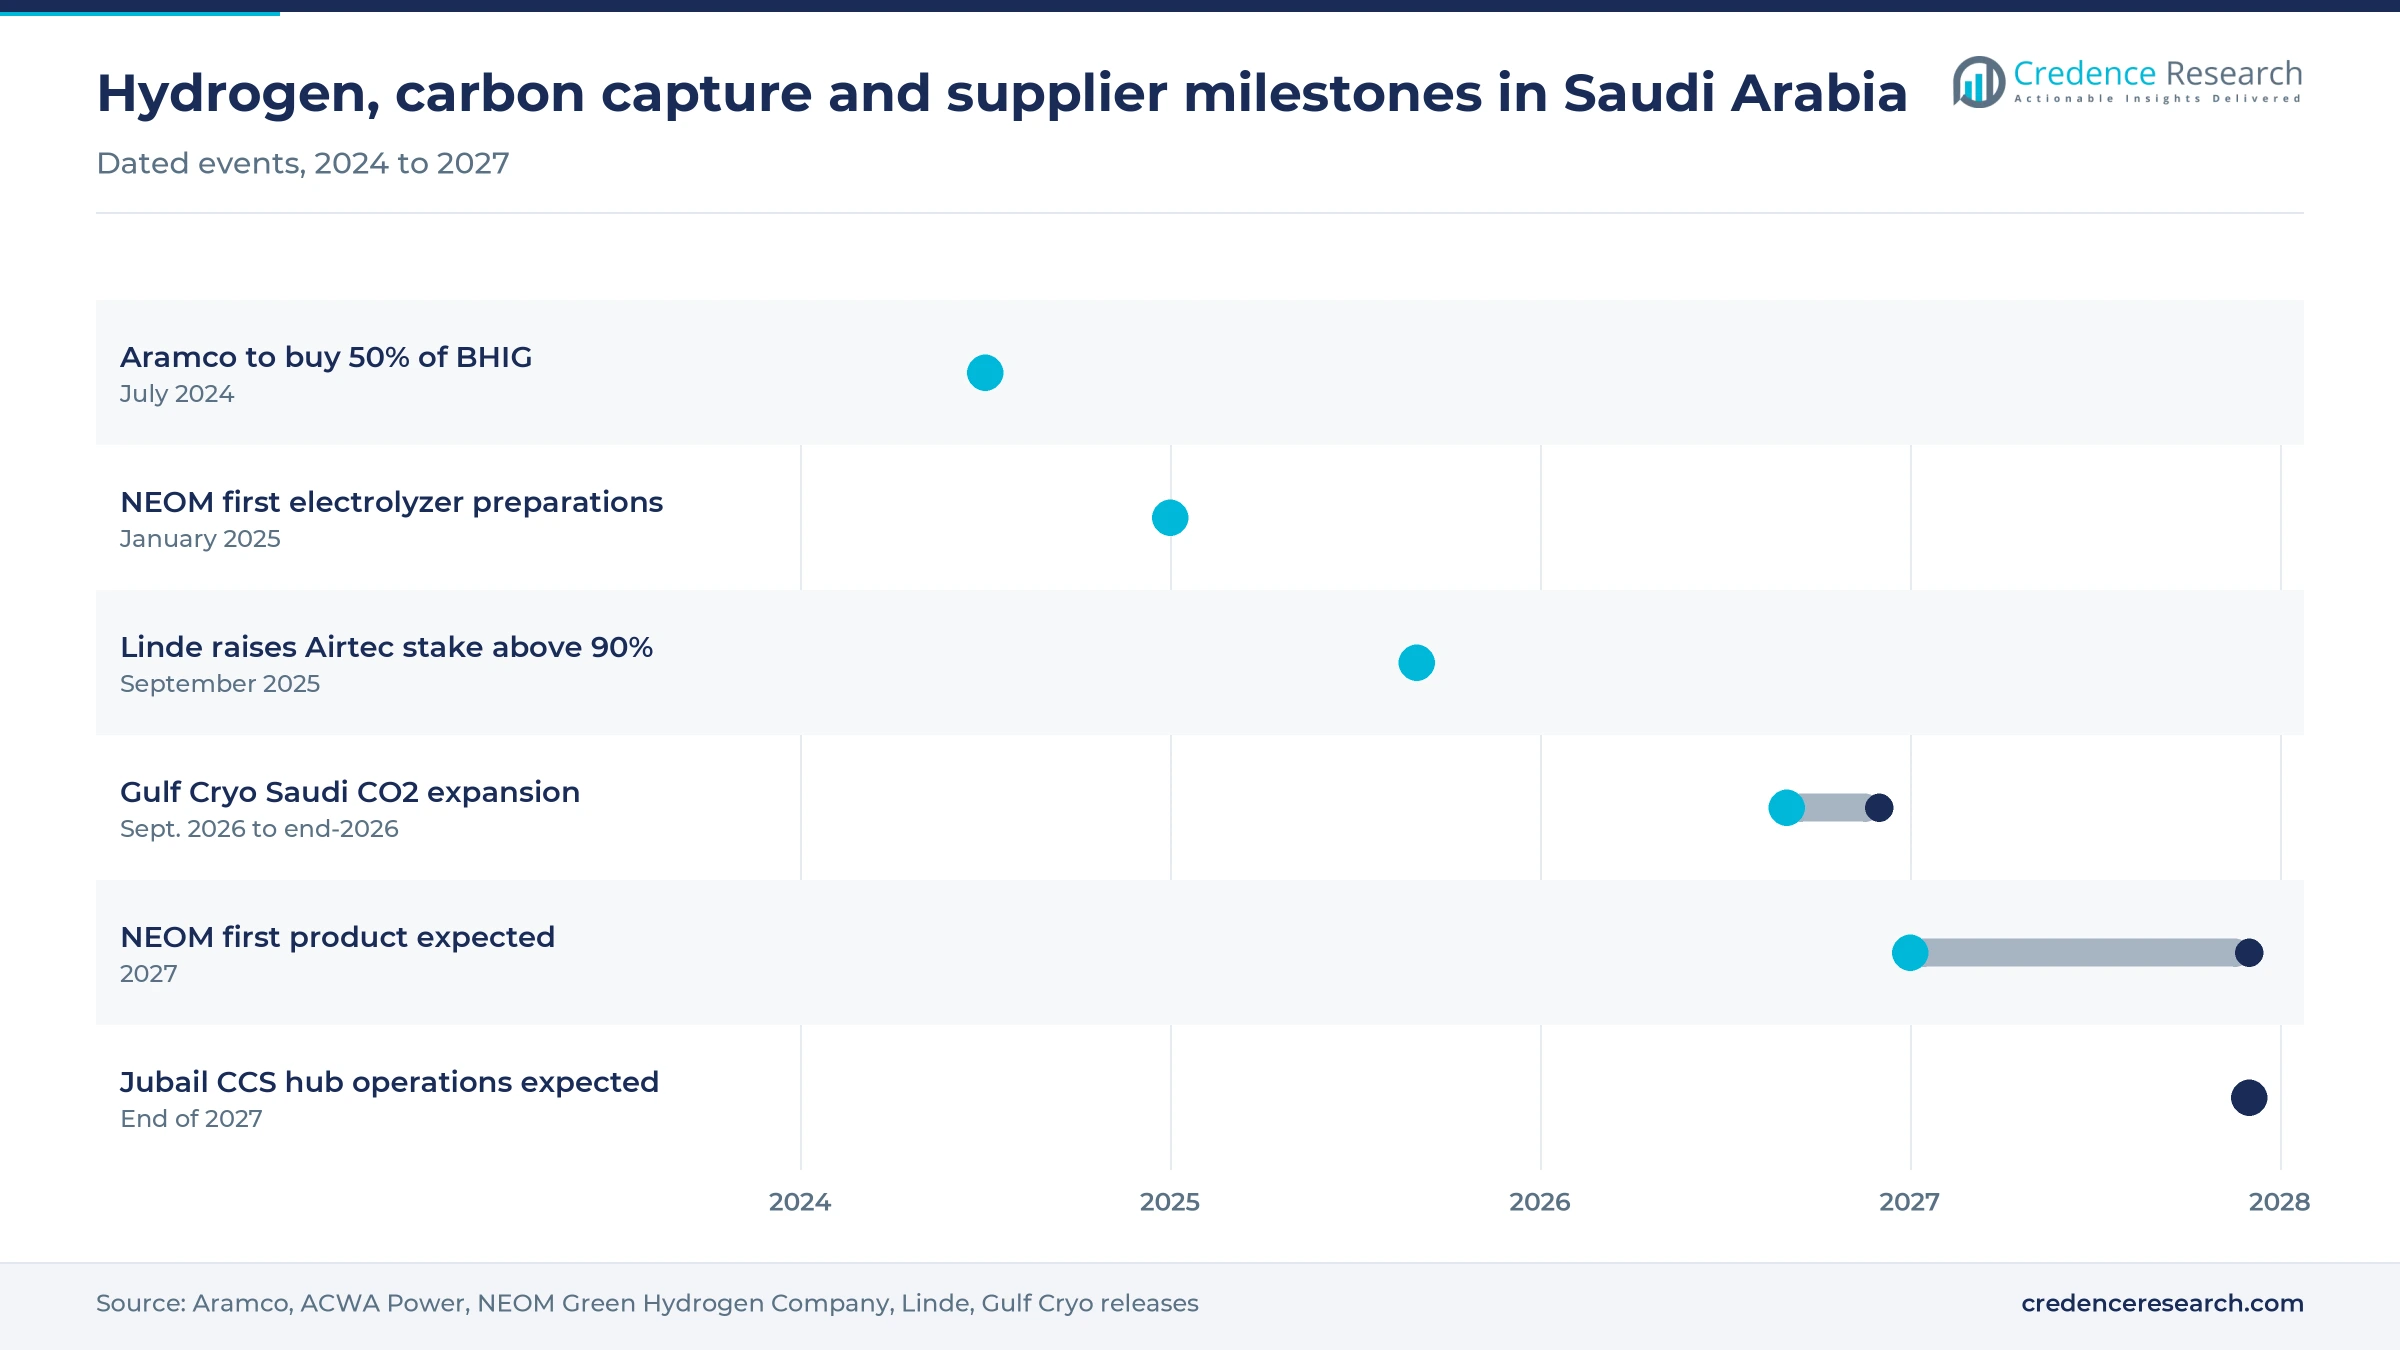
Hydrogen and carbon capture investment creates new gas supply contracts, because each project needs hydrogen, oxygen, nitrogen and carbon dioxide handling. The NEOM green hydrogen project is designed to make 600 metric tons of hydrogen a day and up to 1.2 million metric tons of green ammonia a year, at a cost of $8.5 billion. Aramco agreed on July 16, 2024, to buy 50% of Blue Hydrogen Industrial Gases Company, which will build a low-carbon hydrogen network from Jubail. Saudi plans target about 2.9 million metric tons a year of clean hydrogen by 2030, according to CSIS. As a result, hydrogen grows fastest by product at 7.31% a year.
Why do food, healthcare and fabrication add merchant demand?
Food plants, hospitals and fabricators buy smaller volumes at higher prices, which supports merchant sales outside the tonnage complexes. The Saudi Food and Drug Authority licensed 624 food factories and 25 medical device factories in 2025, and total licensed facilities rose 18% to 9,155. These plants use carbon dioxide for drinks, nitrogen for packaging and medical oxygen for patient care. Gulf Cryo plans to raise its Saudi carbon dioxide capacity to 750 metric tons a day by the end of 2026, according to Zawya. In turn, food, beverage and other manufacturing held a steady share of 2025 value.
Hydrogen networks, carbon capture and merchant consolidation
How is the rise of low-carbon hydrogen networks reshaping supply?
Hydrogen supply is shifting from single-plant units toward shared pipeline networks, which changes how refiners and chemical plants buy the gas. Air Liquide runs two hydrogen pipeline networks in Jubail and Yanbu that total 35 kilometers, according to its Saudi website, and it operates seven sites for oxygen, nitrogen and hydrogen. Aramco and Air Products Qudra plan a low-carbon hydrogen network from Jubail for refining, chemical and petrochemical customers through their Blue Hydrogen Industrial Gases venture. Aramco also shipped 25,000 tons of blue ammonia to South Korea in 2022 with SABIC Agri-Nutrients. As a result, onsite pipeline contracts grow fastest by channel at 6.95% a year.
Why is the shift to carbon capture changing gas supply?
Carbon capture is emerging as a source of both supply and demand, because captured carbon dioxide can be stored or sold to food and chemical users. Linde, SLB and Aramco are building a carbon capture and storage hub in Jubail designed to capture up to 9 million metric tons of carbon dioxide a year at first, with operations expected at the end of 2027, according to The Energy Year. Aramco's Hawiyah project can already sequester 800,000 tons of carbon dioxide a year, according to Aramco. Gulf Cryo has also announced a modular recovery plant with 300 metric tons a day of capacity, according to its website. In turn, carbon dioxide recovery and purification grows at a steady pace by technology.
Can new air separation capacity open supply opportunities?
Large new oxygen and nitrogen users need dedicated air separation plants, which opens long contracts for gas companies that can finance and run them. The Jazan joint venture of Air Products, Aramco, ACWA Power and Air Products Qudra bought the refinery's air separation units and gasification assets in a deal worth about $12 billion in October 2021. National Industrial Gases Company, in which SABIC holds 70%, supplies Jubail and Yanbu plants from its own units. NEOM will also need oxygen handling and nitrogen for ammonia synthesis. As a result, cryogenic air separation keeps the largest share at 52.0% of 2025 value.
Is merchant market consolidation an opening for larger suppliers?
Merchant cylinder and bulk sales are consolidating into fewer, larger suppliers, which opens room for networks with national delivery reach. Air Liquide sold its Saudi industrial merchant business, including its share of Air Liquide Khafra Industrial Gases, to Abdullah Hashim Industrial Gases & Equipment in September 2022, and 228 staff moved with it. Abdullah Hashim runs main production sites in Dammam, Jeddah and Riyadh. Linde raised its stake in Airtec from 49% to more than 90% in September 2025, which widened its Gulf merchant network. In turn, buyers of welding consumables and cylinders can source from fewer, broader suppliers.
Power costs, long contracts and logistics test suppliers
How do power prices affect air separation costs?
Air separation plants use large amounts of electricity, because they compress and cool air to very low temperatures. Any rise in industrial power or fuel prices therefore raises the cost of every metric ton of oxygen and nitrogen. As a result, suppliers on fixed-fee contracts carry part of the risk until prices are reset. Gas companies respond by building larger, more efficient units and by linking prices to energy indexes in new contracts.
Why do long contracts limit entry for new suppliers?
Most tonnage supply in Saudi Arabia runs under contracts of 15 to 25 years, such as the 25-year Jazan agreement with a fixed monthly fee. Because these contracts tie customers to one supplier, new entrants can win business only when new plants are built. In turn, competition for each new complex is intense and margins on bids are thin. Suppliers answer with partnerships with Saudi investors and state companies.
How do distance and heat complicate merchant delivery?
Saudi Arabia is large, and many buyers sit hundreds of kilometers from the nearest air separation plant or filling station. Liquid deliveries therefore need long tanker trips, and summer heat raises boil-off losses from cryogenic tanks. As a result, delivered costs for small buyers in remote zones are higher than near Jubail or Yanbu. Suppliers reduce this by adding regional filling stations and small onsite generators.
Why do project delays create demand uncertainty?
Large hydrogen and carbon capture projects depend on export demand, financing and technology that can shift timelines. The NEOM plant was earlier expected to start in 2025 and now plans first product in 2027, according to ACWA Power. In turn, gas companies that build supply capacity for these projects may wait longer for revenue. Suppliers manage this risk with take-or-pay terms and phased plant construction.
Western Region leads as northern zones grow fastest
| Region | Value, 2025 (USD billion) | Share, 2025 | CAGR, 2026–2035 |
|---|---|---|---|
| Western Region | 0.53 | 33.5% | 6.43% |
| Riyadh Region | 0.43 | 27.4% | 6.73% |
| Eastern Province | 0.26 | 16.5% | 7.03% |
| Southern Region | 0.23 | 14.3% | 6.83% |
| Northern and Emerging Industrial Zones | 0.13 | 8.3% | 7.63% |
How do Yanbu, Rabigh and Jeddah make the Western Region first?
The Western Region held 33.5% of 2025 value and grows at 6.43% a year, because Yanbu and Rabigh host large refineries and petrochemical plants that buy hydrogen, oxygen and nitrogen by pipeline. Air Liquide runs a hydrogen pipeline network in Yanbu, and National Industrial Gases Company supplies the city from its own air separation plant. Jeddah adds hospitals, food plants and fabricators that buy cylinders and bulk liquid. As a result, the zone combines tonnage and merchant demand.
Why does the Riyadh Region hold the second-largest share?
The Riyadh Region held 27.4% of 2025 value and grows at 6.73% a year, because the capital has the largest number of factories and hospitals in the Kingdom. Riyadh received 479 new industrial licenses in 2023, more than any other region, according to Argaam. Abdullah Hashim Industrial Gases & Equipment runs one of its main production sites in the city. These buyers mostly use bulk liquid and packaged gases rather than pipeline supply.
How does Jubail shape the Eastern Province market?
The Eastern Province held 16.5% of 2025 value and grows at 7.03% a year, because Jubail and Dammam host many large chemical plants that buy gases under long pipeline contracts. Much of Jubail's hydrogen and nitrogen is made by producers inside their own plants, which the estimate excludes, so the zone's merchant and contract value is smaller than its industrial weight suggests. However, the Jubail carbon capture hub and the Blue Hydrogen Industrial Gases network should lift growth above the national rate.
Why does Jazan lift the Southern Region?
The Southern Region held 14.3% of 2025 value and grows at 6.83% a year, because the Jazan refinery and its gasification complex draw large oxygen volumes from dedicated air separation units. The refinery is built to process 400,000 barrels of crude oil a day, according to Air Products. Hospitals and workshops in Abha and Najran add steady cylinder demand. In turn, the zone mixes one very large customer with many small accounts.
How do NEOM projects make northern zones the fastest growers?
The Northern and Emerging Industrial Zones held 8.3% of 2025 value and grow fastest at 7.63% a year, because NEOM is building the largest green hydrogen plant in the region. The project had reached 80% overall completion at the start of 2025, according to ACWA Power. Mining and processing sites in the north also use oxygen and nitrogen. As a result, new projects lift this small zone faster than older industrial cities.
Hydrogen, carbon capture and supplier deals, 2024 to 2026
| Development | Status and market relevance |
|---|---|
| In July 2024, Aramco agreed to acquire 50% of Blue Hydrogen Industrial Gases Company from Air Products Qudra. | Plans a low-carbon hydrogen network from Jubail |
| In January 2025, NEOM Green Hydrogen Company reported preparations to launch its first electrolyzer. | Plant designed for 600 metric tons of hydrogen a day |
| In September 2025, Linde raised its stake in the Gulf gas supplier Airtec from 49% to more than 90%. | Expands Linde merchant reach across the GCC |
| In September 2025, Saudi crude steel output reached 6.928 million tons for January to August, up 11.9%. | Higher mill output lifts oxygen and argon demand |
| In September 2026, Gulf Cryo said it would raise Saudi carbon dioxide capacity to 750 metric tons a day by the end of 2026. | Supports food, beverage and industrial users |
Air separation, reforming with capture and electrolysis
- Cryogenic air separation cools air until oxygen, nitrogen and argon separate, which suits large refinery, steel and chemical customers.
- Pressure swing adsorption separates nitrogen or oxygen at the customer site, which suits smaller plants that want to avoid tanker deliveries.
- Steam methane reforming with CCUS makes hydrogen from natural gas and captures the carbon dioxide, which is the route planned for the Jubail network.
- Electrolysis splits water with renewable power, which is the route chosen for the NEOM plant with thyssenkrupp technology.
- Carbon dioxide recovery and purification cleans waste carbon dioxide from industrial plants to food grade, which supports drink makers and cooling users.
Need a Custom Version of This Report?
Tailor the scope, geography, or segments to your exact requirements.
- Custom geography or segment scope
- Direct access to our analyst team
Pipeline networks and merchant reach separate suppliers
Competition centers on pipeline networks, long supply contracts, delivery reach and partnerships with Saudi state companies, because large buyers sign contracts for decades. Air Liquide runs hydrogen pipelines in Jubail and Yanbu and seven Saudi production sites. Air Products leads the Jazan air separation and gasification joint venture, and Air Products Qudra shares the Blue Hydrogen Industrial Gases venture with Aramco. National Industrial Gases Company, majority owned by SABIC, supplies Jubail and Yanbu plants. Abdullah Hashim Industrial Gases & Equipment leads merchant sales from Dammam, Jeddah and Riyadh, while Gulf Cryo describes itself as the region's largest provider of liquid carbon dioxide. Linde strengthened its Gulf merchant business through Airtec in 2025. As a result, suppliers with local partners and pipeline assets hold the strongest positions.
Companies profiled and their roles in this market
| Company | Type | Role in the market |
|---|---|---|
| Air Products Qudra | Joint venture supplier | Shares Blue Hydrogen Industrial Gases Company with Aramco; Jazan venture partner |
| National Industrial Gases Company (GAS) | Tonnage supplier | SABIC majority-owned air separation supplier in Jubail and Yanbu |
| Abdullah Hashim Industrial Gases & Equipment | Merchant supplier | Production sites in Dammam, Jeddah and Riyadh; bought Air Liquide merchant business |
| Air Liquide Arabia | Tonnage supplier | Hydrogen pipelines in Jubail and Yanbu; seven production sites |
| Gulf Cryo Saudi Arabia | Merchant supplier | Carbon dioxide capacity planned at 750 metric tons a day by end-2026 |
| Blue Hydrogen Industrial Gases Company | Hydrogen producer | Low-carbon hydrogen network planned from Jubail |
Credence Research view on Saudi gas supply
Credence Research's view is that Saudi demand for industrial gases will grow faster than in mature markets, because new factories, steel output and refinery hydrogen needs keep adding volume. Petrochemicals and chemicals keep the largest share of value, while hydrogen gains the most ground as Jubail and NEOM projects start up. The Western Region stays the largest zone, while northern zones grow fastest around NEOM. Suppliers that pair pipeline assets with national merchant reach and Saudi partners should win the most new contracts.
Trade, industrial and company data anchor the model
The report uses 2025 as the base year on a calendar basis, and market values come from the Credence Research model. That model combines industrial licensing and factory counts, steel output, manufacturing value added, published plant capacities and company announcements. Segment splits, zone shares and zone growth rates are Credence Research estimates built from industrial licensing, plant capacity and project data. Sources used are government and regulator releases, World Bank data, company releases and trade press, and no interviews or surveys were used.
Hydrogen and carbon capture shape demand to 2035
Sales of industrial gases in Saudi Arabia are expected to reach USD 3.03 billion by 2035, a 6.77% CAGR during 2026–2035, as new plants, refinery upgrades and hydrogen projects add volume. Growth should stay firm through 2028 as the NEOM plant and the Jubail carbon capture hub start up. After that, factory growth under the National Industrial Strategy and merchant demand will set the pace. Faster export demand for clean ammonia would lift hydrogen volumes, while project delays would slow them. Hydrogen is expected to gain the most share through 2035.
Frequently Asked Questions
How big is the Saudi Arabia industrial gases market?
Which gas leads demand in Saudi Arabia?
Which region leads the Saudi market?
Which region grows fastest in Saudi Arabia?
Which end-use industry buys the most gases?
How do most large Saudi buyers receive their gases?
How does carbon capture affect the Saudi market?
Who are the main suppliers in Saudi Arabia?
Table of Content
Chapter 1 Market Segmentation
- 1.1 Segmentation Framework
- 1.1.1 Product and Service Classification
- 1.1.2 Application and End-Use Classification
- 1.1.3 Technology and Solution Classification
- 1.1.4 Customer and Distribution Channel Classification
- 1.1.5 Geographic Segmentation
- 1.1.6 Market Segment Definitions and Boundaries
- 1.2 By Product Type
- 1.2.1 Oxygen
- 1.2.2 Nitrogen
- 1.2.3 Hydrogen
- 1.2.4 Carbon Dioxide
- 1.2.5 Argon
- 1.2.6 Acetylene and Specialty Gases
- 1.3 By End-Use Industry
- 1.3.1 Oil, Gas and Refining
- 1.3.2 Petrochemicals and Chemicals
- 1.3.3 Metals and Fabrication
- 1.3.4 Healthcare and Life Sciences
- 1.3.5 Food, Beverage and Other Manufacturing
- 1.4 By Sales Channel
- 1.4.1 Onsite Pipeline Contracts
- 1.4.2 Bulk Liquid Direct Sales
- 1.4.3 Packaged Cylinder Direct Sales
- 1.4.4 Authorized Distributors
- 1.4.5 Government and Institutional Tenders
- 1.5 By Technology
- 1.5.1 Cryogenic Air Separation
- 1.5.2 Pressure Swing Adsorption
- 1.5.3 Steam Methane Reforming with CCUS
- 1.5.4 Electrolysis
- 1.5.5 Carbon Dioxide Recovery and Purification
Chapter 2 Introduction
- 2.1 Report Objectives and Scope
- 2.2 Product Definition and Industry Terminology
- 2.3 Market Inclusions and Exclusions
- 2.4 Research Process
- 2.4.1 Primary Research and Expert Interviews
- 2.4.2 Secondary Research and Source Review
- 2.4.3 Top-Down and Bottom-Up Estimation
- 2.4.4 Data Triangulation and Verification
- 2.5 Market Size Measurement Basis
- 2.5.1 2025: USD 1.57 billion → 2035: USD 3.03 billion
- 2.6 Historical and Forecast Reference Periods
- 2.6.1 Historical Period: 2018-2025
- 2.6.2 Base Year: 2025
- 2.6.3 Forecast Period: 2025-2035
- 2.7 Research Assumptions and Limitations
Chapter 3 Executive Summary
- 3.1 Market Snapshot and Key Findings
- 3.2 Base-Year Market Size, 2025
- 3.3 Forecast Market Size, 2035
- 3.4 Revenue and Volume Growth Outlook
- 3.5 Key Demand and Supply Indicators
- 3.6 Leading Market Segments
- 3.7 Fastest-Growing Market Opportunities
- 3.8 Regional Performance Highlights
- 3.9 Technology and Industry Transformation
- 3.10 Competitive Landscape Summary
- 3.11 Analyst View and Strategic Implications
Chapter 4 Saudi Arabia Industrial Gases Market Trends and Developments
- 4.1 Historical Industry Development, 2018-2025
- 4.2 Recent Market Trends and Developments
- 4.3 Demand and Customer Behavior Trends
- 4.4 Technology and Product Innovation
- 4.5 Artificial Intelligence, Automation and Digitalization
- 4.6 Local Manufacturing and Supply Chain Realignment
- 4.7 Industry Partnerships, Mergers and Acquisitions
- 4.8 Sustainability and Circular Economy Developments
- 4.9 Government and Private Sector Investment Trends
- 4.10 Emerging Business Models and Commercialization
- 4.11 Industry Developments and Announcements
Chapter 5 Saudi Arabia Industrial Gases Market Production, Supply and Demand Analysis
- 5.1 Demand Trend and Consumption Analysis, 2018-2025
- 5.2 Demand Forecast, 2025-2035
- 5.3 Production and Output Trend, 2018-2025
- 5.4 Production and Output Forecast, 2025-2035
- 5.5 Installed Capacity and Capacity Utilization
- 5.6 Company-Wise Production Plants and Statistics
- 5.6.1 Installed Production Capacity
- 5.6.2 Actual Production
- 5.6.3 Planned Capacity and Expansion Targets
- 5.7 Supply Chain Structure and Procurement Trends
- 5.8 Supply-Demand Gap and Bottlenecks
- 5.9 Import Dependence and Sourcing Structure
- 5.10 Contract Manufacturing and Outsourcing
- 5.11 Regional Supply and Demand Concentration
Chapter 6 Saudi Arabia Industrial Gases Market Pricing Analysis
- 6.1 Pricing Structure and Measurement
- 6.2 Historical Pricing Trends, 2018-2025
- 6.3 Pricing Outlook, 2025-2035
- 6.4 Average Selling Price and Unit Economics
- 6.5 Pricing by Product and Market Segment
- 6.6 Geographic Pricing Differences
- 6.7 Key Input, Energy, Labor and Logistics Costs
- 6.8 Contract Pricing and Purchasing Models
- 6.9 Pricing Sensitivity and Competitive Positioning
- 6.10 Price, Margin and Profitability Implications
Chapter 7 Saudi Arabia Industrial Gases Market Dynamics
- 7.1 Market Growth Drivers
- 7.1.1 Demand-Side Drivers
- 7.1.2 Technology and Innovation Drivers
- 7.1.3 Infrastructure and Investment Drivers
- 7.1.4 Regulatory and Policy Drivers
- 7.2 Market Restraints
- 7.2.1 Cost and Affordability Constraints
- 7.2.2 Technology and Adoption Barriers
- 7.2.3 Supply Chain and Operational Constraints
- 7.3 Market Challenges
- 7.3.1 Competitive Pressure and Margin Erosion
- 7.3.2 Skills, Infrastructure and Implementation Gaps
- 7.4 Emerging Market Opportunities
- 7.5 Market Dynamics Impact and Time-Horizon Assessment
Chapter 8 Saudi Arabia Industrial Gases Value Chain Analysis
- 8.1 Industry Value Chain Overview
- 8.2 Upstream Suppliers and Critical Inputs
- 8.3 Technology and Component Providers
- 8.4 Manufacturing or Service Delivery
- 8.5 Distribution, Channel Partners and Integrators
- 8.6 Downstream Applications and End Users
- 8.7 Value Addition and Profit Pools
- 8.8 Vertical Integration and Outsourcing
- 8.9 Supplier Concentration and Risk
- 8.10 Supply Chain Localization and Resilience
Chapter 9 Saudi Arabia Industrial Gases Market Regulations and Policies
- 9.1 Relevant Laws, Standards and Compliance Frameworks
- 9.2 Product, Service, Safety and Quality Requirements
- 9.3 Government Policies, Incentives and Subsidies
- 9.4 Imports, Exports and Trade Barriers
- 9.5 Public Procurement and Local Content Requirements
- 9.6 Environmental and Sustainability Compliance
- 9.7 Upcoming Policy Changes and Market Implications
Chapter 10 Saudi Arabia Industrial Gases Market Hotspots and Opportunities
- 10.1 Market Opportunity Mapping and Growth Hotspots
- 10.2 High-Growth Applications and Customer Groups
- 10.3 Underserved Markets and White-Space Opportunities
- 10.4 Emerging Technology and Product Opportunities
- 10.5 New Capacity and Investment Hotspots
- 10.6 Market Entry and Expansion Opportunities
- 10.7 Distribution and Partnership Opportunities
- 10.8 Near-Term and Long-Term Commercial Potential
- 10.9 Opportunity Attractiveness and Execution Risks
Chapter 11 Saudi Arabia Industrial Gases Market Outlook, 2025-2035
- 11.1 Market Size and Analysis
- 11.1.1 Revenue (Market Measurement: 2025: USD 1.57 billion → 2035: USD 3.03 billion)
- 11.1.2 Market Volume and Quantity Sold
- 11.1.3 Historical Market Size, 2018-2025
- 11.1.4 Base-Year Market Size, 2025
- 11.2 Market Forecast, 2025-2035
- 11.2.1 Revenue Forecast to 2035
- 11.2.2 Volume Forecast to 2035
- 11.2.3 CAGR and Year-on-Year Growth
- 11.2.4 Incremental Revenue Opportunity
- 11.3 Forecast Assumptions and Scenario Analysis
- 11.3.1 Base-Case Forecast
- 11.3.2 Optimistic and Conservative Scenarios
- 11.3.3 Technology, Pricing and Policy Sensitivities
- 11.4 Market Attractiveness and Growth Outlook
Chapter 12 Saudi Arabia Industrial Gases Market Segmentation and Outlook
- 12.1 Segmentation Summary and Market Shares, 2025
- 12.2 Largest and Fastest-Growing Segments
- 12.3 By Product Type - Market Size and Forecast, 2025-2035
- 12.3.1 Segment Definition and Scope
- 12.3.2 Historical Market Size, 2018-2025
- 12.3.3 Revenue Forecast, 2025-2035
- 12.3.4 Volume Forecast, 2025-2035
- 12.3.5 Base-Year Market Share, 2025
- 12.3.6 Segment CAGR and Growth Drivers
- 12.3.7 Subsegment Market Size and Forecast
- 12.3.7.1 Oxygen
- 12.3.7.2 Nitrogen
- 12.3.7.3 Hydrogen
- 12.3.7.4 Carbon Dioxide
- 12.3.7.5 Argon
- 12.3.7.6 Acetylene and Specialty Gases
- 12.3.8 Subsegment Pricing and Adoption Trends
- 12.3.9 Leading Suppliers and Competition
- 12.3.10 Regional Demand and Opportunities
- 12.4 By End-Use Industry - Market Size and Forecast, 2025-2035
- 12.4.1 Segment Definition and Scope
- 12.4.2 Historical Market Size, 2018-2025
- 12.4.3 Revenue Forecast, 2025-2035
- 12.4.4 Volume Forecast, 2025-2035
- 12.4.5 Base-Year Market Share, 2025
- 12.4.6 Segment CAGR and Growth Drivers
- 12.4.7 Subsegment Market Size and Forecast
- 12.4.7.1 Oil, Gas and Refining
- 12.4.7.2 Petrochemicals and Chemicals
- 12.4.7.3 Metals and Fabrication
- 12.4.7.4 Healthcare and Life Sciences
- 12.4.7.5 Food, Beverage and Other Manufacturing
- 12.4.8 Subsegment Pricing and Adoption Trends
- 12.4.9 Leading Suppliers and Competition
- 12.4.10 Regional Demand and Opportunities
- 12.5 By Sales Channel - Market Size and Forecast, 2025-2035
- 12.5.1 Segment Definition and Scope
- 12.5.2 Historical Market Size, 2018-2025
- 12.5.3 Revenue Forecast, 2025-2035
- 12.5.4 Volume Forecast, 2025-2035
- 12.5.5 Base-Year Market Share, 2025
- 12.5.6 Segment CAGR and Growth Drivers
- 12.5.7 Subsegment Market Size and Forecast
- 12.5.7.1 Onsite Pipeline Contracts
- 12.5.7.2 Bulk Liquid Direct Sales
- 12.5.7.3 Packaged Cylinder Direct Sales
- 12.5.7.4 Authorized Distributors
- 12.5.7.5 Government and Institutional Tenders
- 12.5.8 Subsegment Pricing and Adoption Trends
- 12.5.9 Leading Suppliers and Competition
- 12.5.10 Regional Demand and Opportunities
- 12.6 By Technology - Market Size and Forecast, 2025-2035
- 12.6.1 Segment Definition and Scope
- 12.6.2 Historical Market Size, 2018-2025
- 12.6.3 Revenue Forecast, 2025-2035
- 12.6.4 Volume Forecast, 2025-2035
- 12.6.5 Base-Year Market Share, 2025
- 12.6.6 Segment CAGR and Growth Drivers
- 12.6.7 Subsegment Market Size and Forecast
- 12.6.7.1 Cryogenic Air Separation
- 12.6.7.2 Pressure Swing Adsorption
- 12.6.7.3 Steam Methane Reforming with CCUS
- 12.6.7.4 Electrolysis
- 12.6.7.5 Carbon Dioxide Recovery and Purification
- 12.6.8 Subsegment Pricing and Adoption Trends
- 12.6.9 Leading Suppliers and Competition
- 12.6.10 Regional Demand and Opportunities
- 12.7 Segment Growth Comparison
- 12.8 Segment Attractiveness and Priority Matrix
Chapter 13 Saudi Arabia Industrial Gases End-Use and Application Market Outlook
- 13.1 End-Use Industry and Customer Demand Structure
- 13.2 Leading Applications and Customer Groups
- 13.3 End-Use Market Size, Share and Forecast
- 13.4 Major End-Use Industry Deep Dives
- 13.4.1 Customer Requirements and Use Cases
- 13.4.2 Demand and Replacement Cycles
- 13.4.3 Technical and Regulatory Considerations
- 13.4.4 Purchasing and Procurement Models
- 13.4.5 Leading Vendors and Distribution Channels
- 13.4.6 Forecast and Commercial Opportunities
- 13.5 Emerging Applications and Cross-Segment Demand
- 13.6 End-Use Industry Investment Priorities
Chapter 14 Saudi Arabia Industrial Gases Geographic Market Outlook, 2025-2035
- 14.1 Domestic Market Distribution and Demand Clusters
- 14.2 State- or Province-Wise Market Size and Forecast, 2025-2035
- 14.3 City and Metropolitan Market Outlook
- 14.4 Industrial, Manufacturing and Commercial Clusters
- 14.5 Geographic Concentration of Key End Users
- 14.6 Local Pricing and Purchasing Differences
- 14.7 Domestic Production Facilities and Capacity Map
- 14.8 Local Infrastructure and Project Pipeline
- 14.9 State-Level Policy and Incentive Differences
- 14.10 Subnational Investment Hotspots and Opportunities
- 14.11 Distribution and Logistics Networks
- 14.12 Domestic Competitive Footprint
Chapter 15 Saudi Arabia Industrial Gases Technology, Innovation and Sustainability Outlook
- 15.1 Technology Landscape and Maturity
- 15.2 Product, Process and Service Innovation
- 15.3 AI, Automation and Digital Tools in the Industry
- 15.4 Technology Adoption and Performance Benchmarking
- 15.5 Innovation Pipeline and R&D Investment
- 15.6 Patent and Intellectual Property Trends
- 15.7 Energy Efficiency and Resource Management
- 15.8 Sustainability, Recycling and Circularity
- 15.9 Technology Roadmap, 2025-2035
- 15.10 Risks of Obsolescence and Technology Substitution
Chapter 16 Saudi Arabia Industrial Gases Market Key Strategic Imperatives
- 16.1 Growth and Market Entry Priorities
- 16.2 High-Return Products and Segments
- 16.3 Pricing, Profitability and Cost Optimization
- 16.4 Technology Investment and Product Differentiation
- 16.5 Supply Chain Localization and Resilience
- 16.6 Distribution and Customer Acquisition
- 16.7 Partnership, Acquisition and Capacity Strategy
- 16.8 Regional Expansion Priorities
- 16.9 Short-, Medium- and Long-Term Actions
Chapter 17 Competition Outlook
- 17.1 Industry Competition Characteristics
- 17.2 Market Structure and Concentration
- 17.3 Market Share and Competitive Positioning, 2025
- 17.4 Company-Wise Revenue and Product Benchmarking
- 17.5 Production and Service Capacity Benchmarking
- 17.6 Technology, Pricing and Differentiation
- 17.7 Regional Footprint and Distribution Strength
- 17.8 Mergers, Acquisitions and Strategic Alliances
- 17.9 New Entrants and Competitive Threats
- 17.10 Porter's Five Forces and Industry Attractiveness
- 17.11 Competitive Outlook, 2025-2035
Chapter 18 Company Profiles
- 18.1 Company Coverage and Selection Criteria
- 18.2 Linde SIGAS
- 18.2.1 Business Description
- 18.2.2 Company Ownership and Geographic Presence
- 18.2.3 Product and Service Portfolio
- 18.2.4 Manufacturing and Operating Footprint
- 18.2.5 Production Capacity and Expansion Plans
- 18.2.6 Financial Performance and Investment
- 18.2.7 Market Share and Competitive Position
- 18.2.8 Technology and Innovation Capabilities
- 18.2.9 Strategic Alliances or Partnerships
- 18.2.10 Recent Developments
- 18.2.11 Growth Strategy and Outlook
- 18.3 National Industrial Gases Company (GAS)
- 18.4 Abdullah Hashim Industrial Gases & Equipment
- 18.5 Air Products Qudra
- 18.6 Blue Hydrogen Industrial Gases Company
- 18.7 Gulf Cryo Saudi Arabia
- 18.8 Air Liquide Arabia
- 18.9 Jubail Gas Plant Company
- 18.10 Southern Gas Limited
- 18.11 Saudi Acetylene Company
- 18.12 Other Relevant Market Participants
Note: Every listed company is profiled on the structure shown under the first company. The company list is preliminary and may change based on research findings, market developments, data availability and client requirements.
Chapter 19 Disclaimer
- 19.1 Research and Forecast Disclaimer
- 19.2 Data Source and Estimation Limitations
Note: The depth of individual sections depends on data availability for this market. Volume, capacity, trade and other unit-based metrics are included where applicable.

