
Housing repaint cycles anchor Indian paint demand
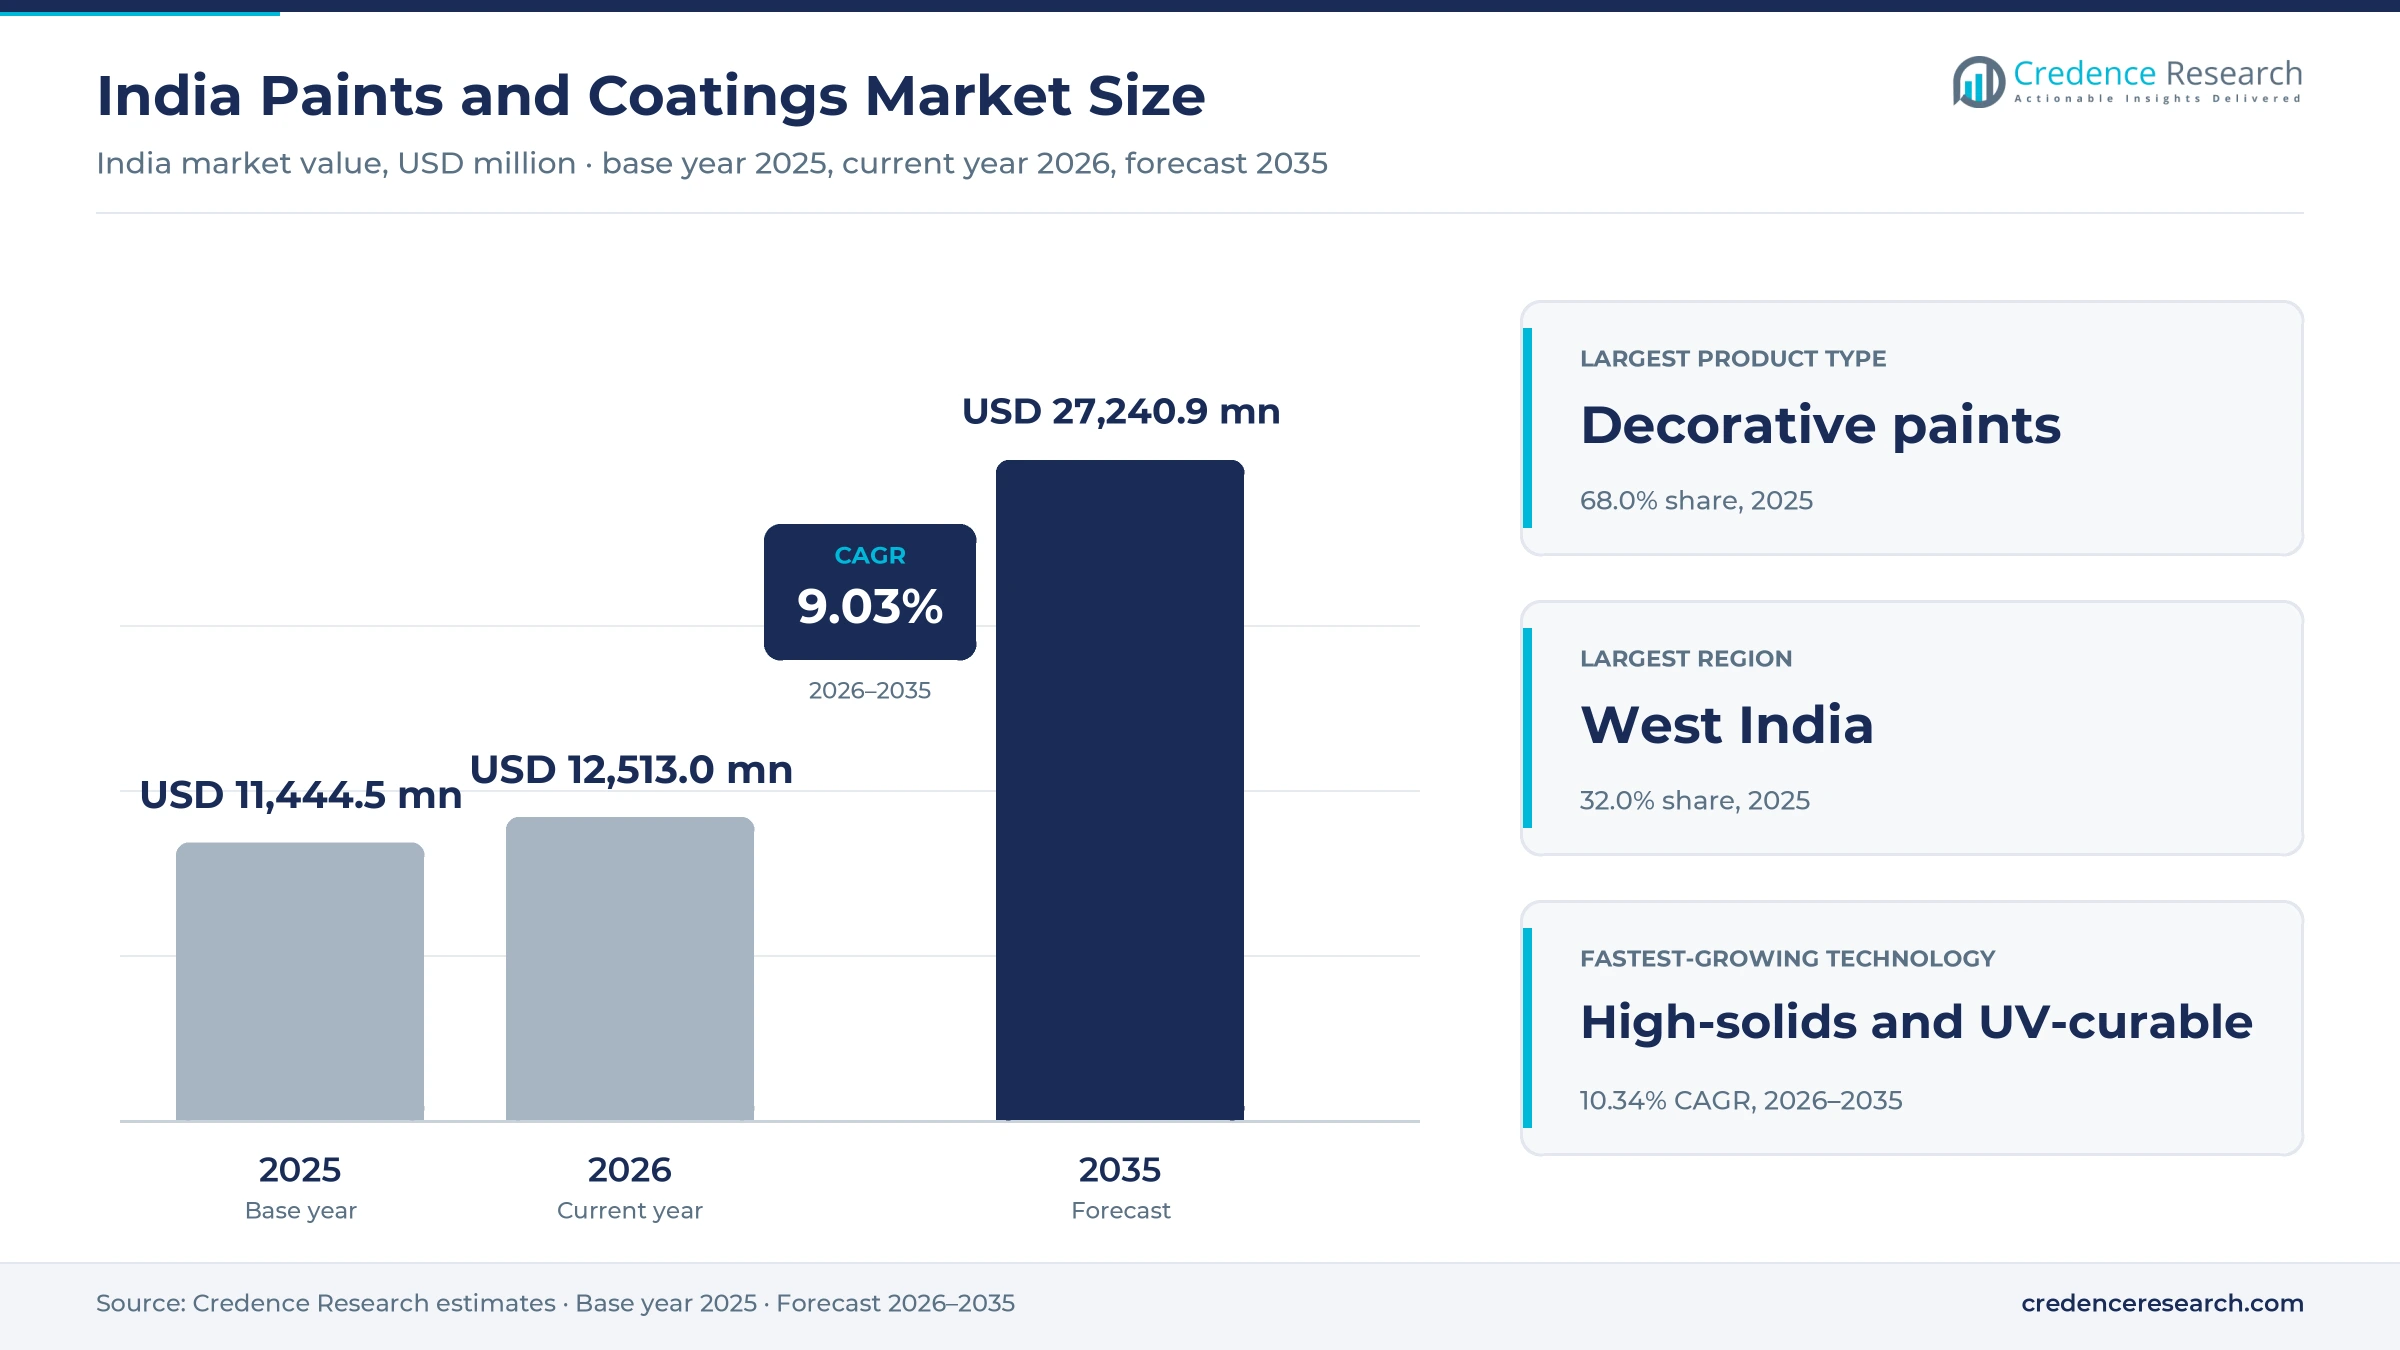
The India paints and coatings market was valued at USD 11.44 billion in 2025 and is projected to increase from USD 12.51 billion in 2026 to USD 27.24 billion by 2035, registering a CAGR of 9.03% during 2026–2035. Demand comes from households repainting homes every few years, builders finishing new housing, and factories that coat vehicles, machinery, steel structures and furniture. West India held the largest regional share, 32.0% in 2025, because Maharashtra and Gujarat combine dense urban housing with the largest industrial clusters. East and Northeast India is the fastest-growing region at 9.34% a year, as housing schemes and new plants extend supply eastward. Competition is also changing, because Grasim launched Birla Opus with six greenfield plants and JSW Paints took control of Akzo Nobel India in December 2025. As a result, dealers and buyers now see more brands, wider tinting choice and sharper pricing in the decorative segment.
What sits inside the scope, from wall emulsions to factory finishes?
The estimate measures the value of decorative paints, industrial coatings, protective coatings and specialty coatings sold in India across water-borne, solvent-borne, powder, high-solids and UV-curable technologies. Values are stated at the prices that homeowners, contractors, builders, automakers and other factories pay through dealers, distributors and direct supply contracts.
The estimate excludes construction chemicals and waterproofing sold on their own, wall putty, adhesives, printing inks and exports of finished paint. The value chain runs from titanium dioxide, resin, solvent and additive suppliers through national and regional paint makers to more than a hundred thousand dealers with tinting machines, and onward to painters, contractors and plant maintenance teams.
India Paints and Coatings Market Insights
- The India paints and coatings market was valued at USD 11.44 billion in 2025 and is projected to reach USD 27.24 billion by 2035, registering a CAGR of 9.03% during 2026–2035.
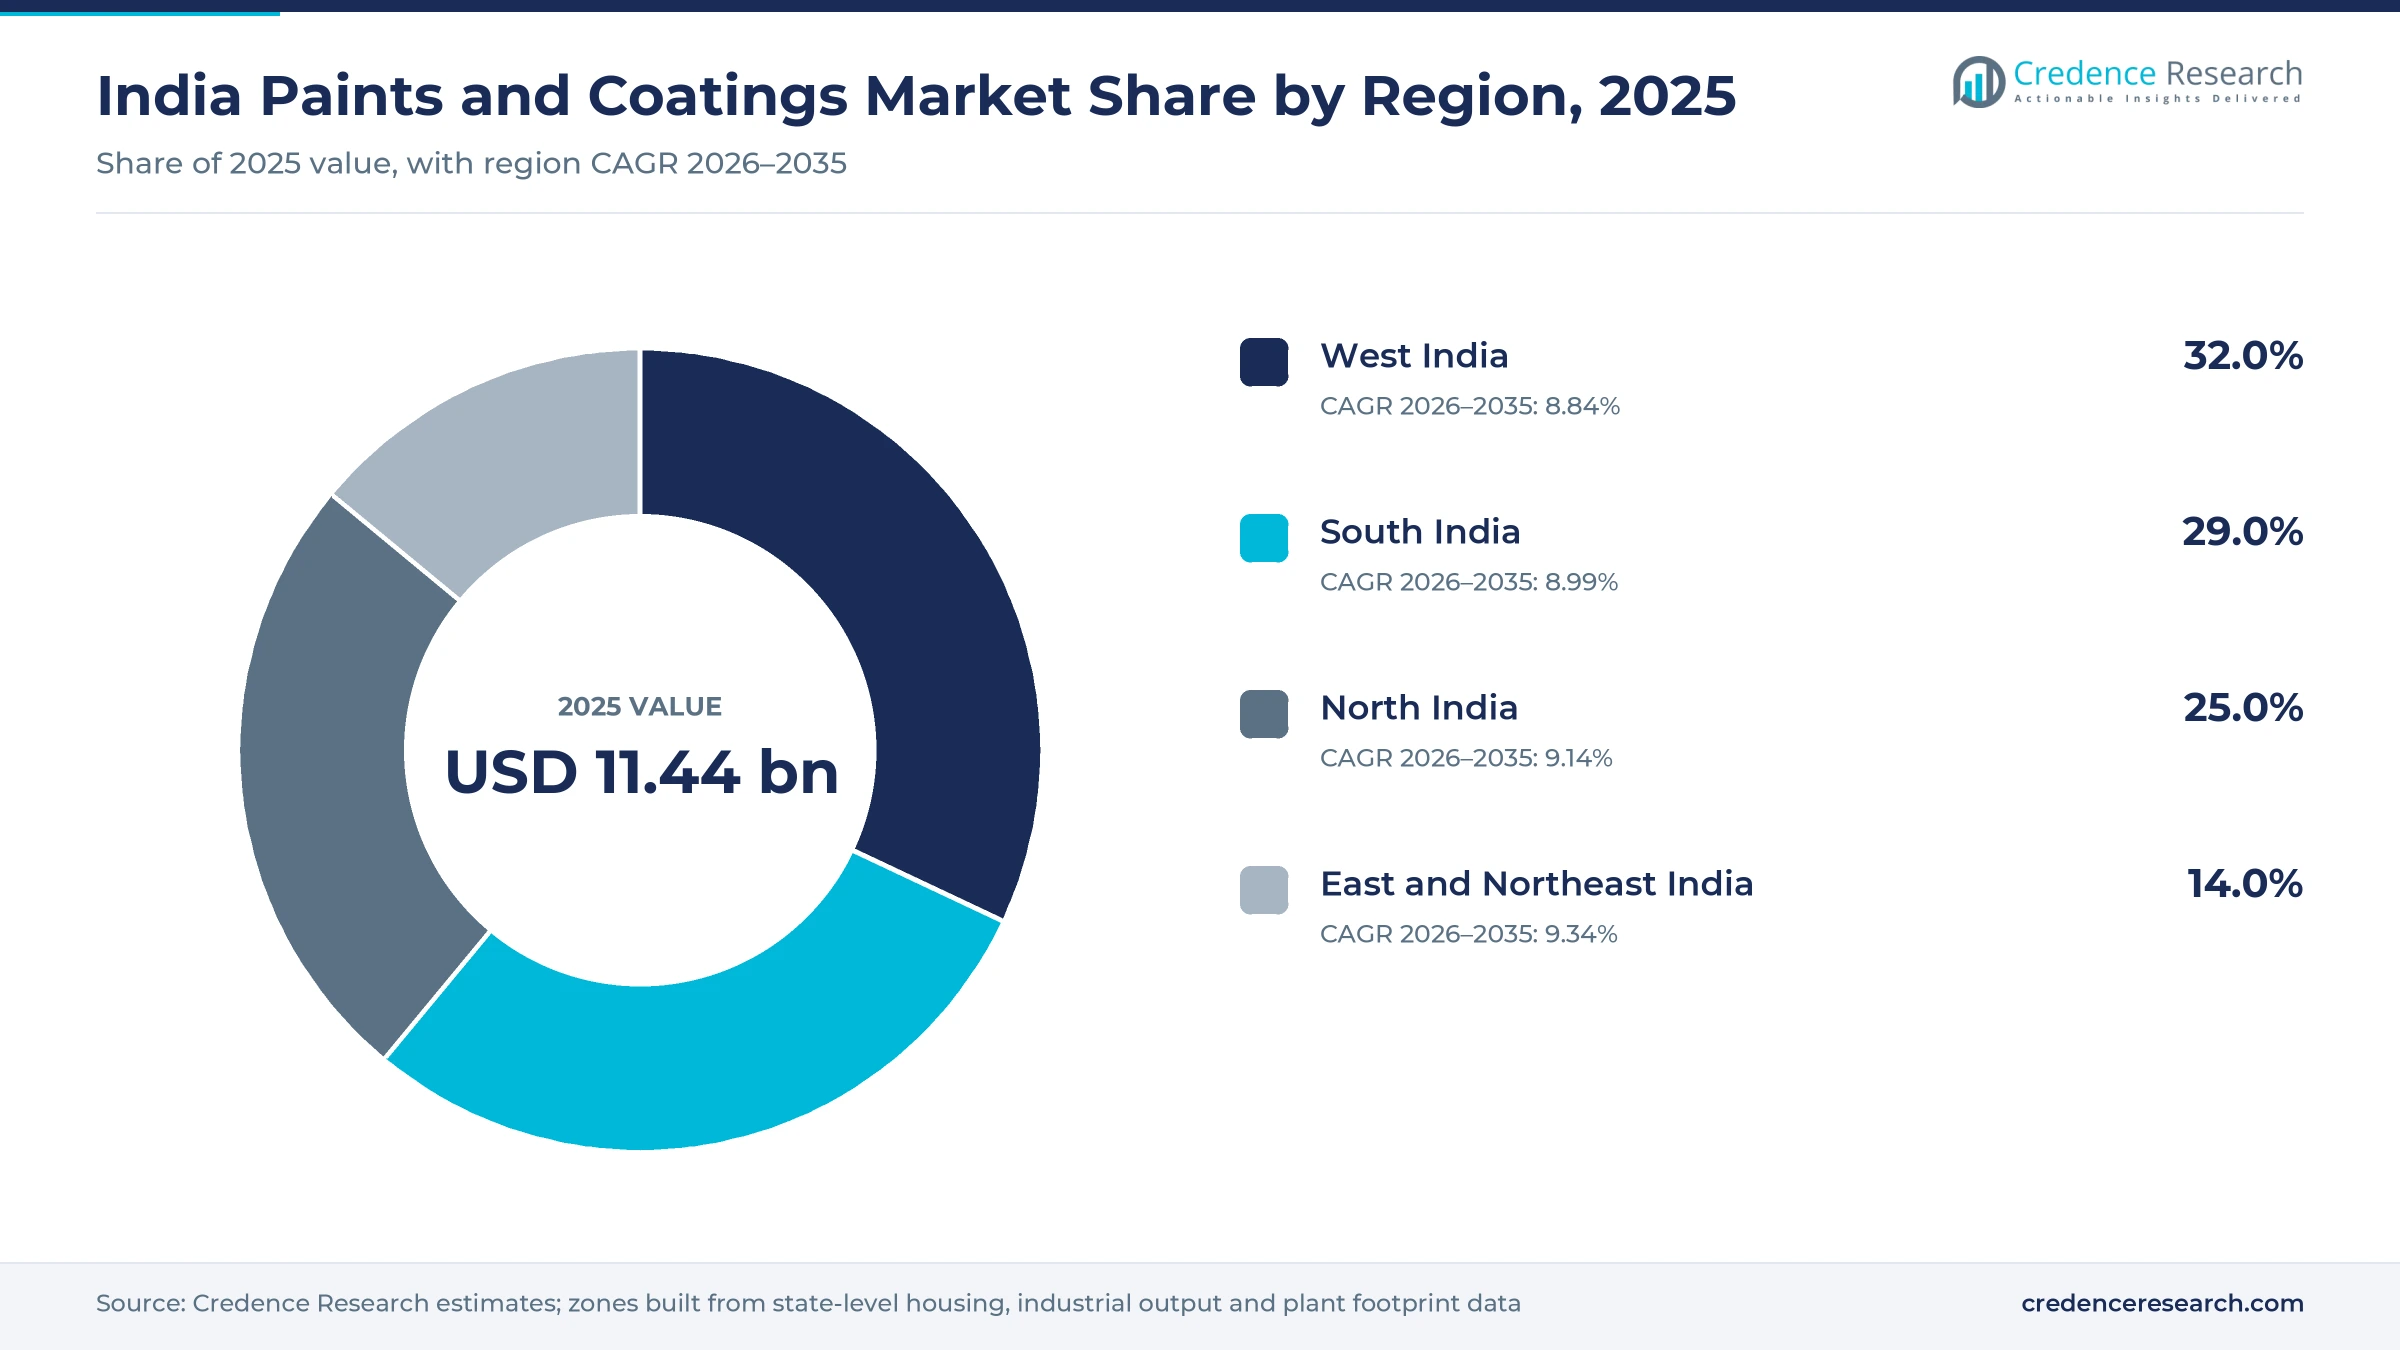
- West India held a 32.0% share of 2025 value, because Maharashtra and Gujarat combine dense urban housing with the largest industrial clusters.
- Decorative paints led with a 68.0% share of 2025 value, because households repaint homes every few years and new housing keeps adding walls.
- JSW Paints completed its purchase of a 60.76% stake in Akzo Nobel India in December 2025, one of the largest takeovers in the Indian paint sector.
- Birla Opus reached 1,096 million liters a year of installed capacity in May 2025, which made it the second-largest decorative player by capacity.
Decorative paints lead while specialty finishes grow fastest
Why do decorative paints dominate product demand?
Based on product type, the market is categorized into decorative paints, industrial coatings, protective coatings and specialty coatings. Decorative Paints led with a 68.0% share of 2025 value, because households repaint interiors and exteriors every few years and new housing keeps adding walls. Specialty Coatings grow fastest at 9.60% a year, as buyers add heat-reflective, anti-microbial and fire-retardant finishes.
How far have water-borne systems moved ahead?
Based on technology, the market is categorized into water-borne coatings, solvent-borne coatings, powder coatings and high-solids and UV-curable coatings. Water-Borne Coatings led with 58.0% of 2025 value, because emulsions now dominate wall painting and new plants are built mainly for water-based lines. High-Solids and UV-Curable Coatings grow fastest at 10.34% a year, as furniture and packaging lines adopt low-solvent curing.
Why does architectural work take most of the value?
Based on end-use industry, the market is categorized into architectural and construction, automotive and transportation, general industrial and machinery, and wood, packaging and consumer durables. Architectural and Construction led with 70.0% of 2025 value, because homes, offices and public buildings use the most liters. Automotive and Transportation grows fastest at 9.30% a year, as vehicle output and rail fleets expand.
Which price tier holds the largest share of spending?
Based on price tier, the market is categorized into economy, mid-tier, premium and performance-specialty products. Mid-Tier led with 34.0% of 2025 value, because many urban and semi-urban households trade up from distemper to branded emulsions. Performance-Specialty grows fastest at 9.92% a year, as industrial buyers and premium homeowners pay more for durability and warranty-backed systems.
| Segment Group | Leading Sub-segment | Share, 2025 | Fastest-growing Sub-segment | CAGR, 2026–2035 |
|---|---|---|---|---|
| By Product Type | Decorative Paints | 68.0% | Specialty Coatings | 9.60% |
| By Technology | Water-Borne Coatings | 58.0% | High-Solids and UV-Curable Coatings | 10.34% |
| By End-Use Industry | Architectural and Construction | 70.0% | Automotive and Transportation | 9.30% |
| By Price Tier | Mid-Tier | 34.0% | Performance-Specialty | 9.92% |
Request a Free Sample
Fill in your details and we'll send you a free sample report.
- Sample data tables & charts
- Research methodology
Housing, vehicles and steel lift Indian paint volumes
How do housing construction and repainting lift demand?
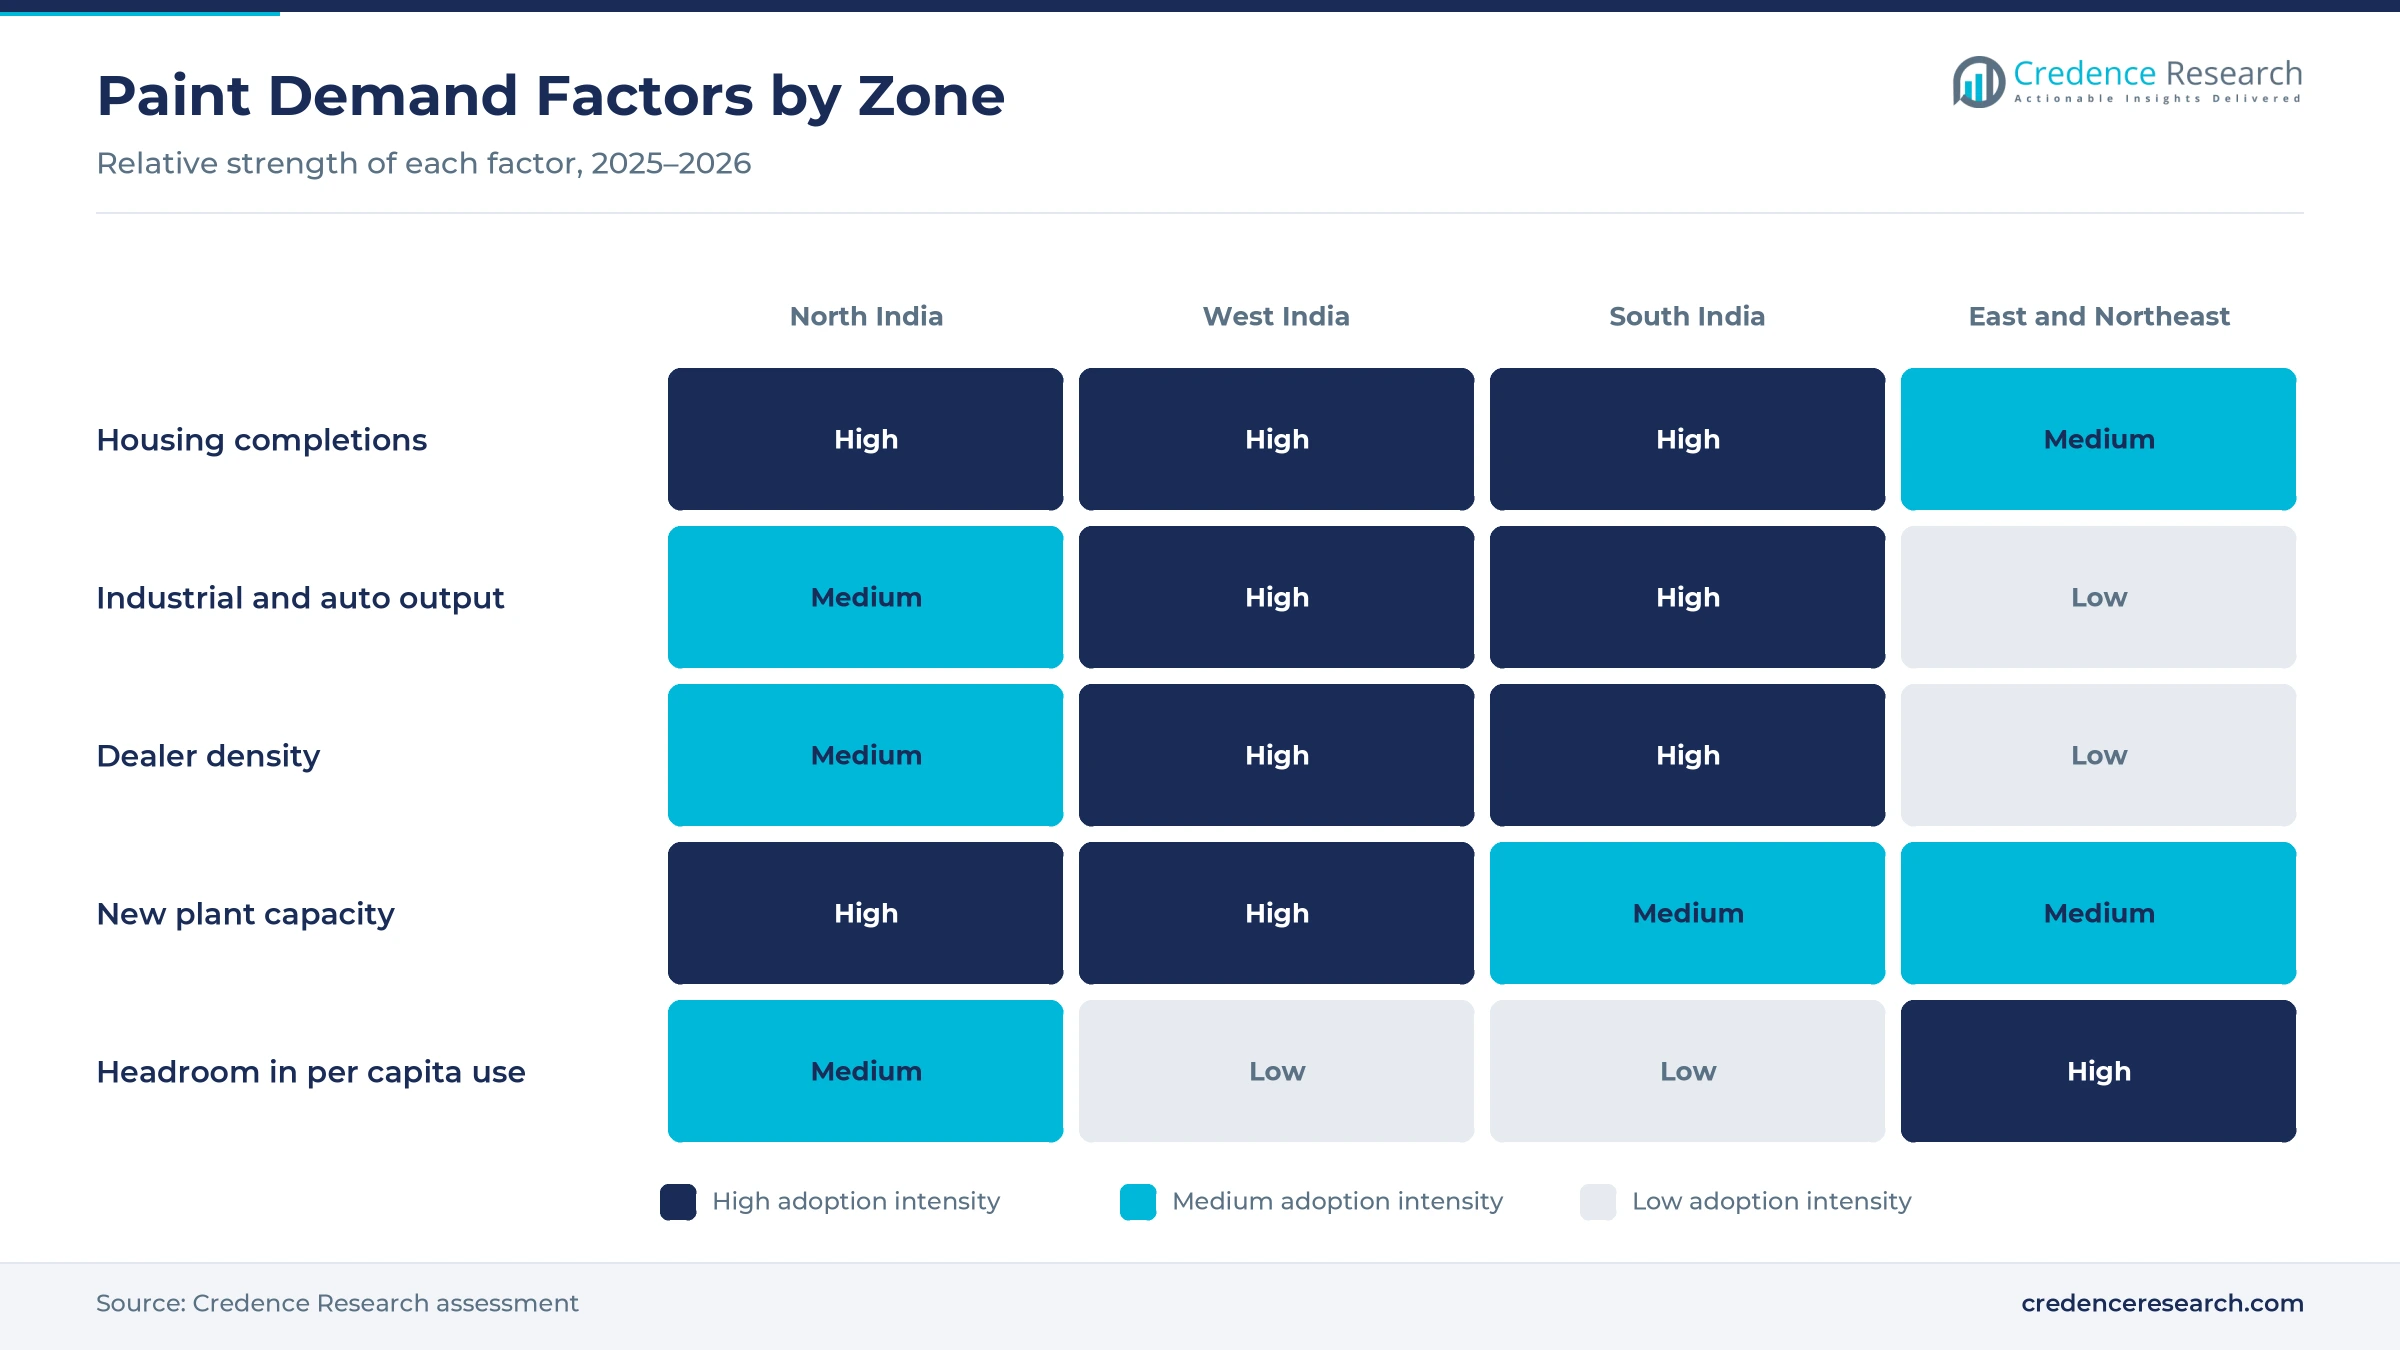
New homes and the repainting of existing ones generate the largest share of Indian paint volumes. The Union Cabinet approved PMAY-Urban 2.0 in August 2024 to build one crore houses for urban poor and middle-class families over five years, with an investment of INR 10 lakh crore, according to the Press Information Bureau. The first phase of the scheme had sanctioned 116.97 lakh houses and completed 93.01 lakh by June 2, 2025, according to the housing ministry. Each completed unit needs primers, putty-compatible emulsions and exterior coats, and then enters a repainting cycle. As a result, architectural and construction work held 70.0% of 2025 value, supported by wider building construction activity.
Why do automotive and industrial output expand coating use?
Factories coat every vehicle, appliance, machine and steel component they make, so rising output adds steady volume. Real gross value added in construction grew 9.4% in fiscal 2024-25 and manufacturing grew 4.5%, according to the Ministry of Statistics and Programme Implementation. Passenger vehicle sales reached a record 4.3 million units in fiscal 2024-25, while two-wheeler sales rose 9.1% to 19.6 million, according to the Society of Indian Automobile Manufacturers. Kansai Nerolac, which leads automotive coatings, approved INR 98 crore in January 2025 to expand its Hosur plant. In turn, automotive and transportation grows fastest at 9.30% a year, with vehicle refinish work adding aftermarket demand.
How does the shift to water-borne compliant formulas raise value?
Regulation and buyer preference are moving Indian paint toward water-based, lead-safe and low-odor formulas, which sell at higher prices per liter. The Regulation of Lead Contents in Household and Decorative Paints Rules, 2016, in force since Nov. 1, 2017, cap lead at 90 ppm of the dried film, and state pollution boards still issue compliance orders. Indigo Paints plans a 90,000 kiloliter a year water-based plant at Jodhpur, expected to start in June 2026, according to its stock exchange filing. Asian Paints also plans a four lakh kiloliter water-based plant at Indore. As a result, water-borne coatings held 58.0% of 2025 value, while formulation additives for dispersion and film formation gain importance.
Why does steel and infrastructure growth support protective work?
Bridges, rail assets, pipelines, plants and pre-engineered buildings need anti-corrosion systems that are recoated over their service life. Finished steel consumption reached 136.29 million metric tons in fiscal 2023-24, according to the Ministry of Steel, and the National Steel Policy targets 300 million metric tons of crude capacity by 2030-31. Nippon Paint India says it became the largest paint supplier to Indian Railways after acquiring Chennai-based Vibgyor Paints. Shalimar Paints also sells zinc silicate primers and coal tar epoxy for marine and industrial assets. In turn, protective coatings grow faster than the total, with epoxy resin systems specified for steel and concrete.
Water-based capacity and new entrants reshape supply
How is the rise of new entrants reshaping decorative supply?
Large conglomerates have entered decorative paint with greenfield plants and aggressive dealer offers, which is resetting competition. Birla Opus reached 1,096 million liters a year of installed capacity in May 2025 and plans 1,332 million, according to a PTI report carried by The Week. The same report said Grasim had spent INR 9,352 crore, about 94% of its paint project cost, by March 31, 2025, while Asian Paints runs more than 1,850 million liters a year of capacity. JSW Paints then completed its purchase of 60.76% of Akzo Nobel India in December 2025, bringing the Dulux brand under JSW control. As a result, mid-tier products held 34.0% of 2025 value, as new brands compete hardest there.
Why is the shift of capacity toward central and eastern India notable?
Paint makers are building plants closer to fast-growing markets to cut freight costs on heavy cans and reach new dealers. Asian Paints plans its Indore plant to serve central India and says it adds 4,000 to 5,000 dealers to its 1.65 lakh network each year. Birla Opus scheduled commercial production at Kharagpur in West Bengal for the first half of fiscal 2025-26, its sixth plant. Nippon Paint India announced INR 200 crore of investment in January 2026 and named northern and eastern regions as expansion targets. In turn, East and Northeast India becomes the fastest-growing zone, as local supply shortens delivery times.
Can powder and electrodeposition coatings open new demand?
Appliance, auto component and furniture makers are moving to powder and electrodeposition systems that cut solvent use and waste, which opens room for new capacity. Nippon Paint India said in January 2026 that it will add capacity in powder coatings and automotive electrodeposition, segments where it had minimal capacity, across seven Indian plants with about 2 lakh metric tons of yearly capacity. Kansai Nerolac, which leads powder coatings, said in January 2025 that infrastructure spending and consumer durables growth should lift its powder demand, and industrial paints make up 45% of its business. AkzoNobel kept its India powder coatings division when it sold Akzo Nobel India to JSW in December 2025. As a result, high-solids and UV-curable coatings grow fastest at 10.34% a year, while powder coatings also outpace solvent-borne products.
Is there room to grow in waterproofing and premium finishes?
Household spending is moving from basic wall color toward complete systems that combine waterproofing, primers and premium emulsions, which raises value per job. Per capita paint consumption in India is about 3.5 kg a year against a global average of about 10 kg, according to the same PTI report, which leaves room for trading up. Shalimar Paints launched ten products in fiscal 2024-25, including water-based Hero emulsions and Zero Damp waterproofing lines. Nippon Paint India entered dry mix, repair and waterproofing products to sit alongside its paint range. In turn, premium products gain share, as brands bundle paint with construction chemicals for one job.
Price wars and crude-linked inputs squeeze paint margins
How do price wars weaken decorative margins?
New entrants have offered higher dealer discounts, extra credit and free tinting machines to win counters quickly, which pushes incumbents to match. Dealers gain in the short run, but manufacturers lose margin on every liter of mid-tier and economy emulsion. As a result, smaller regional brands with thin balance sheets face the greatest pressure on share. Suppliers respond with premium launches, painting services and cost cuts in logistics to protect profitability.
Why do crude-linked raw materials raise cost risk?
Solvents, monomers, resins and titanium dioxide make up most of the cost of a liter of paint, and many are imported or priced against crude oil. Currency swings and freight changes can move input costs within a single quarter, while price increases to dealers lag behind. In turn, gross margins narrow when crude and rupee pressure coincide. Paint makers hedge through backward integration into resins, longer contracts and gradual price revisions.
How does the unorganized segment hold back value growth?
Small local makers still sell distemper, enamels and primers at low prices in semi-urban and rural markets, often outside brand standards. These products compete on price rather than durability, which holds down the average realization per liter in economy tiers. As a result, branded suppliers must offer smaller packs and entry products to convert first-time buyers. Stronger enforcement of lead and labeling rules would favor compliant brands over time.
Why do painter skills and application quality matter?
Most Indian homes are painted by contractors and independent painters, and poor surface preparation shortens coating life. Premium and waterproofing systems need correct primers, moisture checks and drying times that many painters skip under time pressure. In turn, homeowners blame the product for peeling or dampness and may trade down on the next job. Brands respond with painter training, mechanized application and warranty-backed painting services.
West India leads as the east and northeast grow fastest
| Region | Value, 2025 (USD billion) | Share, 2025 | CAGR, 2026–2035 |
|---|---|---|---|
| West India | 3.66 | 32.0% | 8.84% |
| South India | 3.32 | 29.0% | 8.99% |
| North India | 2.86 | 25.0% | 9.14% |
| East and Northeast India | 1.60 | 14.0% | 9.34% |
Why does West India hold the largest share?
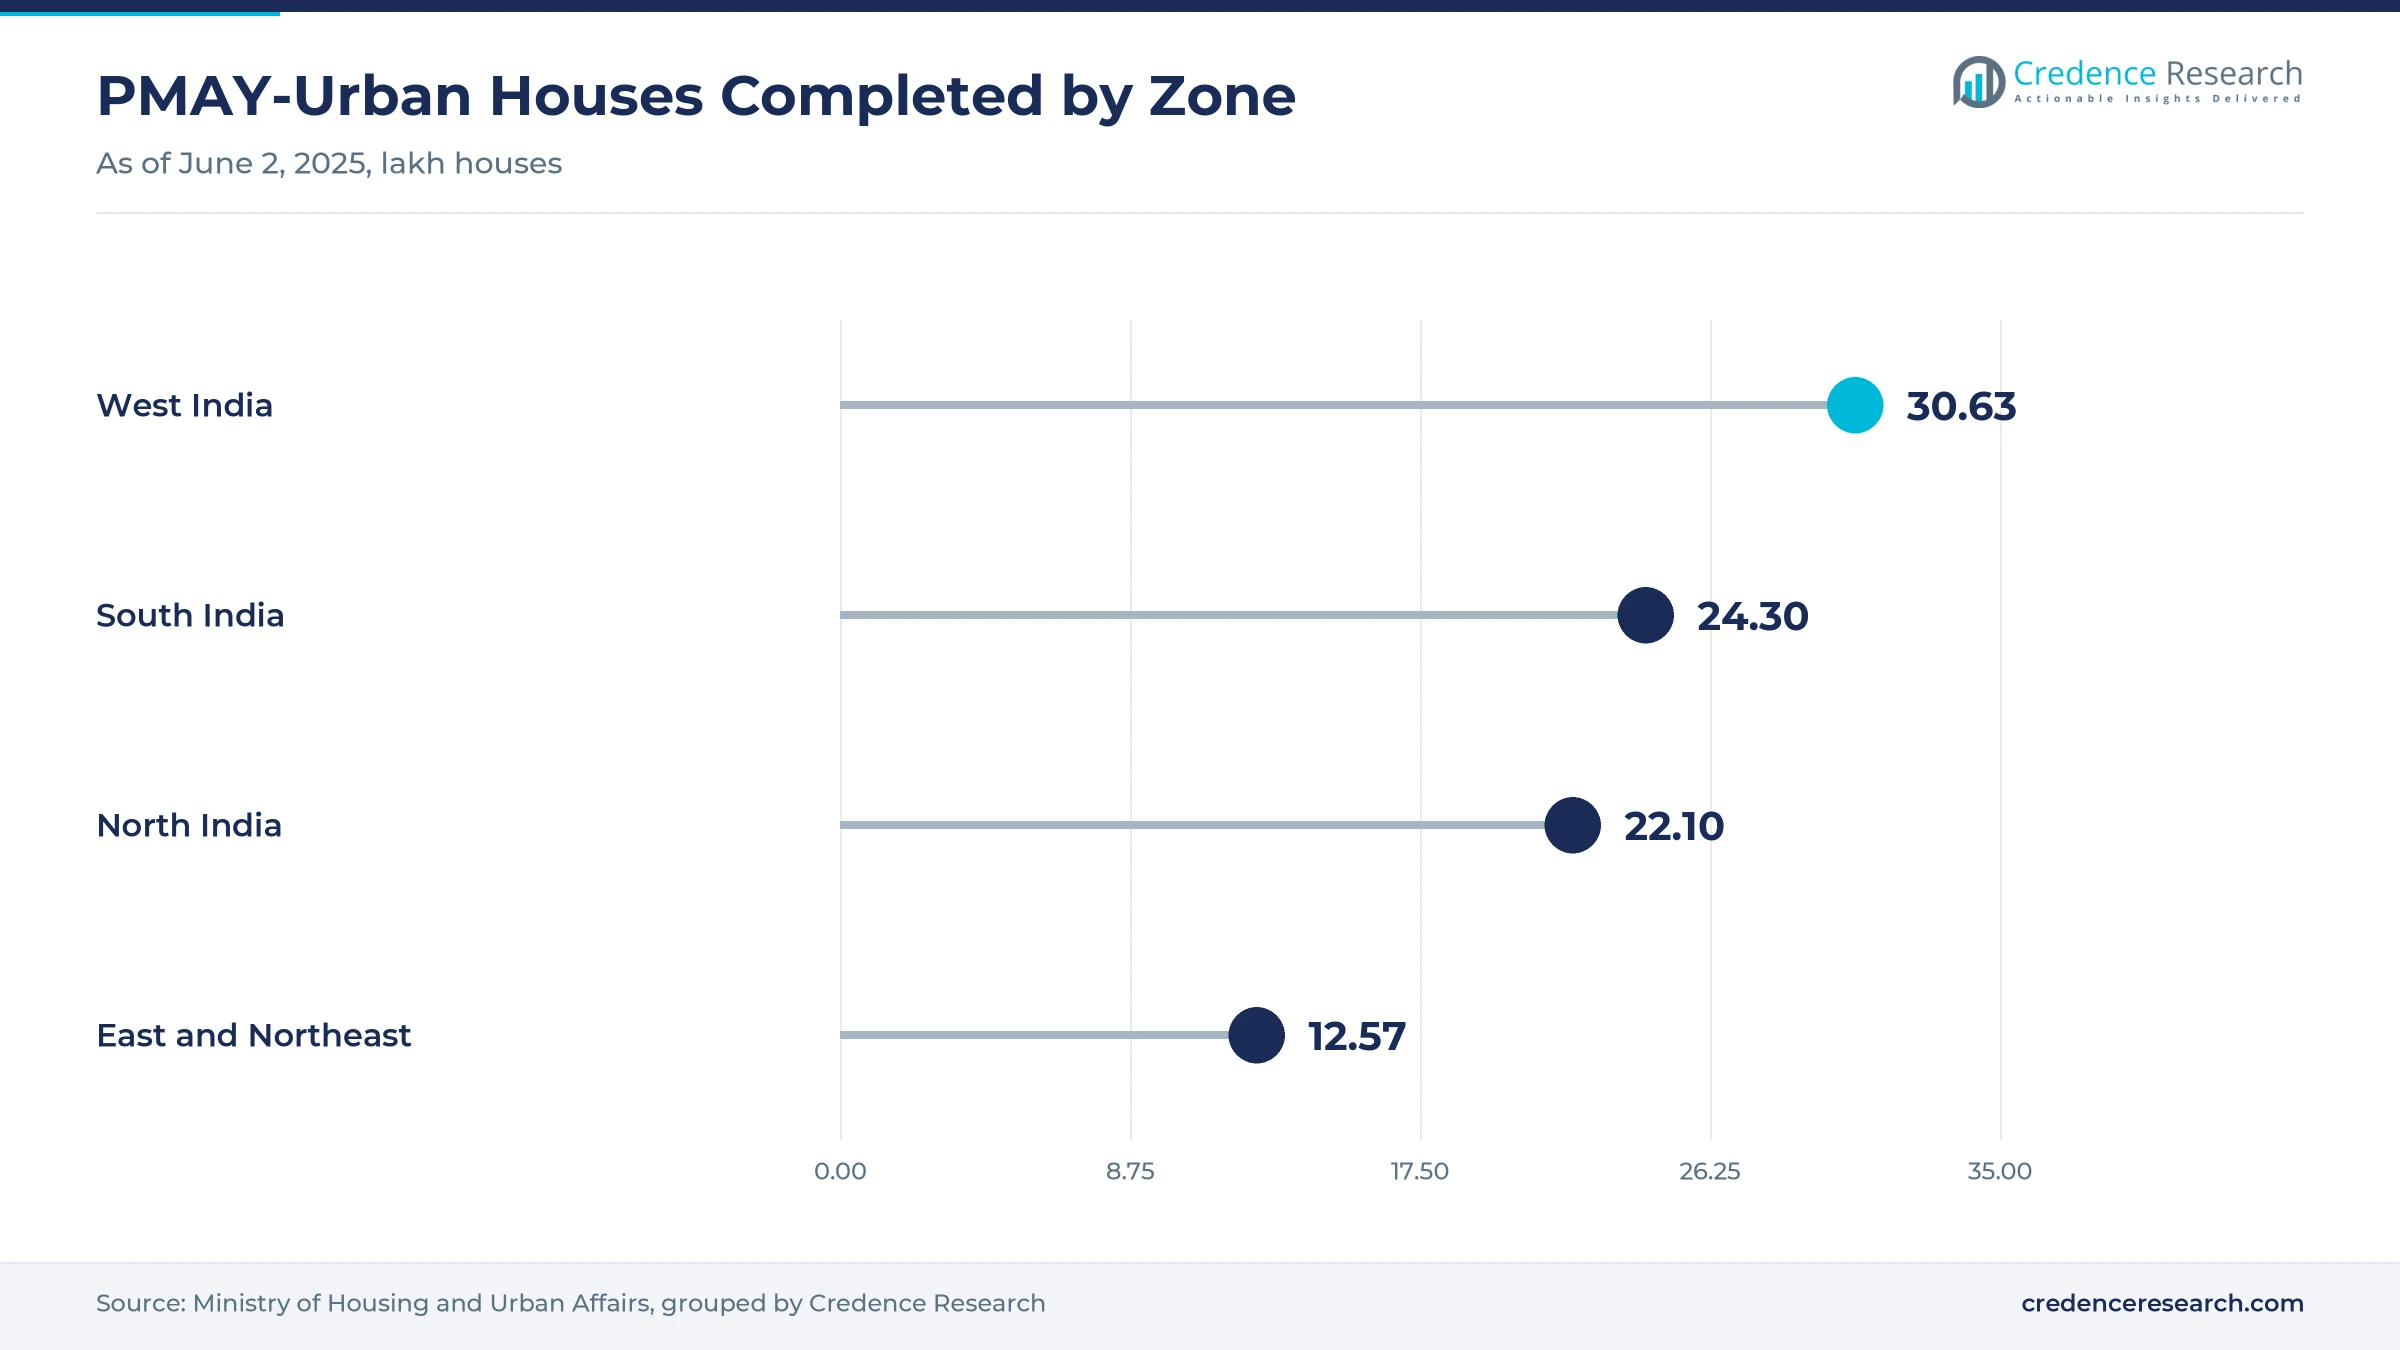
West India held 32.0% of 2025 value and grows at 8.84% a year, because Maharashtra, Gujarat, Madhya Pradesh and Goa combine large cities with automotive, chemical and engineering clusters. Maharashtra, Gujarat, Madhya Pradesh, Goa and Chhattisgarh completed about 30.63 lakh houses under PMAY-Urban by June 2, 2025, the most of any zone. Birla Opus added its Mahad plant in Maharashtra, while Asian Paints plans a water-based plant at Indore. As a result, the zone draws both decorative and industrial volume from a dense base of dealers and factories.
How does South India sustain strong demand?
South India held 29.0% of 2025 value and grows at 8.99% a year, because Tamil Nadu, Karnataka, Andhra Pradesh, Telangana and Kerala combine high housing completion rates with auto and electronics manufacturing. The zone completed about 24.3 lakh PMAY-Urban houses by June 2, 2025, led by Andhra Pradesh at 10.63 lakh. Kansai Nerolac is expanding its Hosur plant, while Birla Opus runs plants at Cheyyar, Chamarajnagar and Mysore. In turn, the zone supports steady decorative and automotive coating demand.
Why is North India gaining capacity and share?
North India held 25.0% of 2025 value and grows at 9.14% a year, because Uttar Pradesh, Rajasthan, Haryana, Punjab and Delhi add housing and new plants at a fast pace. Uttar Pradesh alone completed about 16.97 lakh PMAY-Urban houses by June 2, 2025, the highest of any state. Berger Paints runs its Sandila plant in Uttar Pradesh, Birla Opus operates at Panipat and Ludhiana, and Indigo Paints is expanding at Jodhpur. As a result, local supply now serves the zone faster and at lower freight cost.
Why are the east and northeast growing fastest?
East and Northeast India held 14.0% of 2025 value and grows fastest at 9.34% a year, because per capita paint use remains low and new supply is arriving. West Bengal, Bihar, Odisha, Jharkhand and the northeastern states completed about 12.57 lakh PMAY-Urban houses by June 2, 2025. Birla Opus planned commercial production at Kharagpur in West Bengal, and Nippon Paint India named eastern markets as a target. In turn, dealer networks are spreading into smaller towns across the zone.
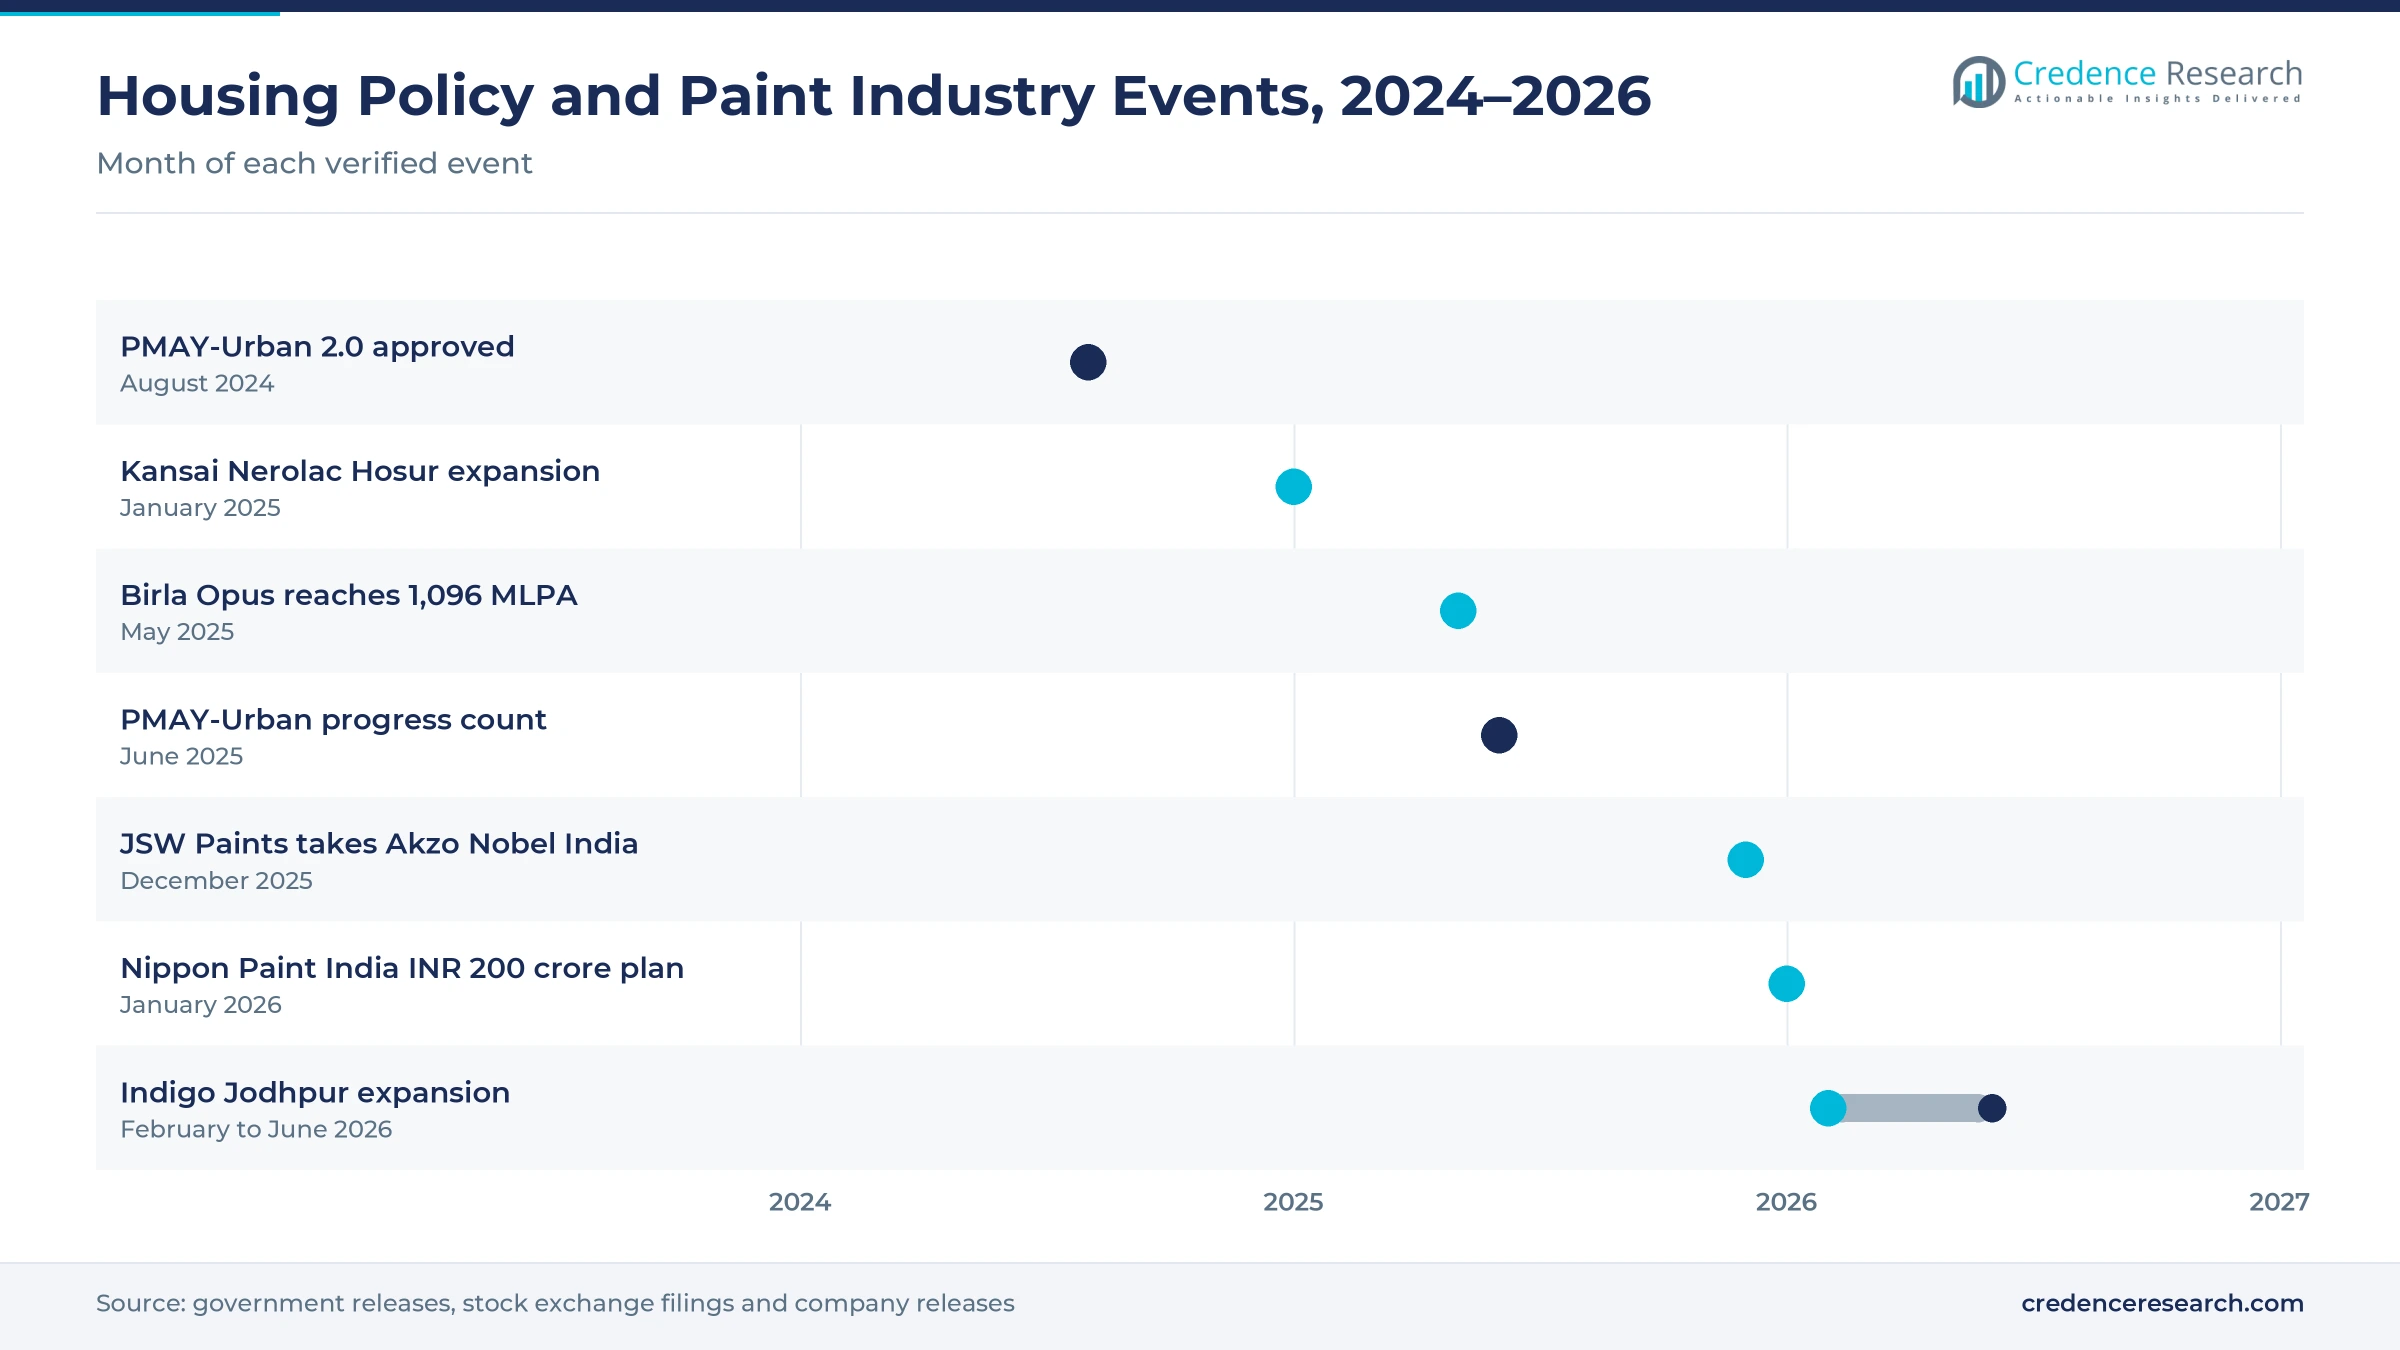
Plant openings and a takeover marked 2025 and 2026
| Development | Status and market relevance |
|---|---|
| In August 2024, the Union Cabinet approved PMAY-Urban 2.0 to build one crore urban houses over five years. | Sustains new-home painting and first repaint demand |
| In January 2025, Kansai Nerolac Paints approved INR 98 crore to expand capacity at its Hosur plant in Tamil Nadu. | Adds supply for automotive, industrial and decorative demand in South India |
| In May 2025, Birla Opus reached 1,096 million liters a year of installed capacity after its Mahad plant began operating. | Makes it the second-largest decorative player by capacity |
| In December 2025, JSW Paints completed its purchase of a 60.76% stake in Akzo Nobel India from AkzoNobel. | Brings the Dulux brand under JSW control, while AkzoNobel keeps powder coatings |
| In February 2026, Indigo Paints approved Jodhpur expansions, including a 90,000 kiloliter a year water-based plant. | Raises water-based and solvent-based capacity in North India |
Water-borne, powder and UV curing shape product choice
- Water-borne emulsions carry acrylic binders in water, which lowers odor and solvent emissions and suits interior and exterior walls.
- Solvent-borne enamels use alkyd and polyurethane binders in organic solvents, which keeps them common for metal, wood and harsh-weather work.
- Powder coatings apply dry resin and pigment that melt in an oven, which cuts waste on appliances, auto parts and furniture.
- UV and high-solids curing harden coatings with light or low solvent content, which speeds wood, packaging and plastic finishing lines.
Need a Custom Version of This Report?
Tailor the scope, geography, or segments to your exact requirements.
- Custom geography or segment scope
- Direct access to our analyst team
Capacity race tests incumbent dealer networks
Competition centers on dealer reach, tinting networks, brand trust and plant proximity, and it has intensified since 2024. Asian Paints leads with more than 1,850 million liters a year of decorative capacity and over 1.65 lakh dealers. Birla Opus, launched by Grasim, reached 1,096 million liters a year by May 2025 and became the second-largest player by capacity. Berger Paints runs a large Sandila plant in Uttar Pradesh, while Kansai Nerolac leads automotive and powder coatings and is expanding at Hosur. JSW Paints took control of Akzo Nobel India and its Dulux brand in December 2025. Nippon Paint India, Indigo Paints and Shalimar Paints compete through railway, regional and value segments. Decorative paints held 68.0% of 2025 value, so suppliers with the widest dealer and tinting networks hold an advantage.
Companies profiled and their roles in this market
| Company | Type | Role in the market |
|---|---|---|
| Asian Paints Limited | Decorative and industrial paint maker | Over 1,850 million liters of capacity and 1.65 lakh dealers |
| Grasim Industries Limited (Birla Opus) | Decorative paint entrant | Six greenfield plants, 1,096 million liters installed by May 2025 |
| Berger Paints India Limited | Decorative and industrial paint maker | Runs a large water- and solvent-based plant at Sandila, Uttar Pradesh |
| Kansai Nerolac Paints Limited | Decorative and automotive coatings maker | Leads automotive and powder coatings; expanding Hosur |
| JSW Paints Private Limited | Decorative paint maker | Took control of Akzo Nobel India in December 2025 |
| Akzo Nobel India Limited | Decorative and industrial paint maker | Sells Dulux paints in India, now controlled by JSW Paints |
| Nippon Paint (India) Private Limited | Decorative, refinish and industrial supplier | Largest paint supplier to Indian Railways; INR 200 crore plan |
| Indigo Paints Limited | Decorative paint maker | Adding water-based and solvent-based capacity at Jodhpur |
| Shalimar Paints Limited | Decorative and industrial paint maker | Plants at Chennai, Nashik and Sikandrabad |
Credence Research view on Indian paint demand
Credence Research's view is that Indian paint demand will grow faster than most large markets, because low per capita use, steady housing completions and rising factory output keep volumes climbing. Decorative paints keep the largest share, while specialty and protective coatings grow fastest. The capacity race between incumbents and new entrants will keep prices competitive through the late 2020s and push brands toward premium systems and services. East and Northeast India should grow fastest as plants and dealers move closer to those buyers. Suppliers that combine dealer reach, water-based capacity and industrial approvals should gain the most share.
Housing, output and company data anchor the model
The report uses 2025 as the base year on a calendar basis, and market values come from the Credence Research model. That model combines housing scheme data, national accounts, vehicle sales, steel consumption, company plant capacities and stock exchange filings. Segment splits, zone shares and growth rates are Credence Research estimates built from state-level housing, industrial output and plant data. Sources used are official statistics, government releases, stock exchange filings, industry association data, wire reports and company releases, and no interviews or surveys were used.
Repainting and industrial demand carry growth to 2035
Sales of paints and coatings in India are expected to reach USD 27.24 billion by 2035, a 9.03% CAGR during 2026–2035, as repainting, new housing and industrial output keep demand rising. Growth should stay firm through 2030 as PMAY-Urban 2.0 completions add homes and new plants come on stream. After that, premiumization and protective work on infrastructure will set the pace. Faster housing completions would favor decorative volumes, while stronger factory output would lift industrial and powder coatings. High-solids and UV-curable products are expected to gain the most technology share through 2035.
Frequently Asked Questions
How big is the India paints and coatings market?
Which product type leads demand in India?
Which region leads the Indian market?
Why do water-borne coatings lead by technology?
How does housing policy affect paint demand?
Which end-use industry grows fastest?
Who are the leading suppliers in India?
What are the main challenges for paint makers?
Table of Content
Chapter 1 Market Segmentation
- 1.1 Segmentation Framework
- 1.1.1 Product and Service Classification
- 1.1.2 Application and End-Use Classification
- 1.1.3 Technology and Solution Classification
- 1.1.4 Customer and Distribution Channel Classification
- 1.1.5 Geographic Segmentation
- 1.1.6 Market Segment Definitions and Boundaries
- 1.2 By Product Type
- 1.2.1 Decorative Paints
- 1.2.2 Industrial Coatings
- 1.2.3 Protective Coatings
- 1.2.4 Specialty Coatings
- 1.3 By Technology
- 1.3.1 Water-Borne Coatings
- 1.3.2 Solvent-Borne Coatings
- 1.3.3 Powder Coatings
- 1.3.4 High-Solids and UV-Curable Coatings
- 1.4 By End-Use Industry
- 1.4.1 Architectural and Construction
- 1.4.2 Automotive and Transportation
- 1.4.3 General Industrial and Machinery
- 1.4.4 Wood, Packaging and Consumer Durables
- 1.5 By Price Tier
- 1.5.1 Economy
- 1.5.2 Mid-Tier
- 1.5.3 Premium
- 1.5.4 Performance-Specialty
Chapter 2 Introduction
- 2.1 Report Objectives and Scope
- 2.2 Product Definition and Industry Terminology
- 2.3 Market Inclusions and Exclusions
- 2.4 Research Process
- 2.4.1 Primary Research and Expert Interviews
- 2.4.2 Secondary Research and Source Review
- 2.4.3 Top-Down and Bottom-Up Estimation
- 2.4.4 Data Triangulation and Verification
- 2.5 Market Size Measurement Basis
- 2.5.1 2025: USD 11.44 billion → 2035: USD 27.24 billion
- 2.6 Historical and Forecast Reference Periods
- 2.6.1 Historical Period: 2018-2025
- 2.6.2 Base Year: 2025
- 2.6.3 Forecast Period: 2025-2035
- 2.7 Research Assumptions and Limitations
Chapter 3 Executive Summary
- 3.1 Market Snapshot and Key Findings
- 3.2 Base-Year Market Size, 2025
- 3.3 Forecast Market Size, 2035
- 3.4 Revenue and Volume Growth Outlook
- 3.5 Key Demand and Supply Indicators
- 3.6 Leading Market Segments
- 3.7 Fastest-Growing Market Opportunities
- 3.8 Regional Performance Highlights
- 3.9 Technology and Industry Transformation
- 3.10 Competitive Landscape Summary
- 3.11 Analyst View and Strategic Implications
Chapter 4 India Paints and Coatings Market Trends and Developments
- 4.1 Historical Industry Development, 2018-2025
- 4.2 Recent Market Trends and Developments
- 4.3 Demand and Customer Behavior Trends
- 4.4 Technology and Product Innovation
- 4.5 Artificial Intelligence, Automation and Digitalization
- 4.6 Local Manufacturing and Supply Chain Realignment
- 4.7 Industry Partnerships, Mergers and Acquisitions
- 4.8 Sustainability and Circular Economy Developments
- 4.9 Government and Private Sector Investment Trends
- 4.10 Emerging Business Models and Commercialization
- 4.11 Industry Developments and Announcements
Chapter 5 India Paints and Coatings Market Production, Supply and Demand Analysis
- 5.1 Demand Trend and Consumption Analysis, 2018-2025
- 5.2 Demand Forecast, 2025-2035
- 5.3 Production and Output Trend, 2018-2025
- 5.4 Production and Output Forecast, 2025-2035
- 5.5 Installed Capacity and Capacity Utilization
- 5.6 Company-Wise Production Plants and Statistics
- 5.6.1 Installed Production Capacity
- 5.6.2 Actual Production
- 5.6.3 Planned Capacity and Expansion Targets
- 5.7 Supply Chain Structure and Procurement Trends
- 5.8 Supply-Demand Gap and Bottlenecks
- 5.9 Import Dependence and Sourcing Structure
- 5.10 Contract Manufacturing and Outsourcing
- 5.11 Regional Supply and Demand Concentration
Chapter 6 India Paints and Coatings Market Pricing Analysis
- 6.1 Pricing Structure and Measurement
- 6.2 Historical Pricing Trends, 2018-2025
- 6.3 Pricing Outlook, 2025-2035
- 6.4 Average Selling Price and Unit Economics
- 6.5 Pricing by Product and Market Segment
- 6.6 Geographic Pricing Differences
- 6.7 Key Input, Energy, Labor and Logistics Costs
- 6.8 Contract Pricing and Purchasing Models
- 6.9 Pricing Sensitivity and Competitive Positioning
- 6.10 Price, Margin and Profitability Implications
Chapter 7 India Paints and Coatings Market Dynamics
- 7.1 Market Growth Drivers
- 7.1.1 Demand-Side Drivers
- 7.1.2 Technology and Innovation Drivers
- 7.1.3 Infrastructure and Investment Drivers
- 7.1.4 Regulatory and Policy Drivers
- 7.2 Market Restraints
- 7.2.1 Cost and Affordability Constraints
- 7.2.2 Technology and Adoption Barriers
- 7.2.3 Supply Chain and Operational Constraints
- 7.3 Market Challenges
- 7.3.1 Competitive Pressure and Margin Erosion
- 7.3.2 Skills, Infrastructure and Implementation Gaps
- 7.4 Emerging Market Opportunities
- 7.5 Market Dynamics Impact and Time-Horizon Assessment
Chapter 8 India Paints and Coatings Value Chain Analysis
- 8.1 Industry Value Chain Overview
- 8.2 Upstream Suppliers and Critical Inputs
- 8.3 Technology and Component Providers
- 8.4 Manufacturing or Service Delivery
- 8.5 Distribution, Channel Partners and Integrators
- 8.6 Downstream Applications and End Users
- 8.7 Value Addition and Profit Pools
- 8.8 Vertical Integration and Outsourcing
- 8.9 Supplier Concentration and Risk
- 8.10 Supply Chain Localization and Resilience
Chapter 9 India Paints and Coatings Market Regulations and Policies
- 9.1 Relevant Laws, Standards and Compliance Frameworks
- 9.2 Product, Service, Safety and Quality Requirements
- 9.3 Government Policies, Incentives and Subsidies
- 9.4 Imports, Exports and Trade Barriers
- 9.5 Public Procurement and Local Content Requirements
- 9.6 Environmental and Sustainability Compliance
- 9.7 Upcoming Policy Changes and Market Implications
Chapter 10 India Paints and Coatings Market Hotspots and Opportunities
- 10.1 Market Opportunity Mapping and Growth Hotspots
- 10.2 High-Growth Applications and Customer Groups
- 10.3 Underserved Markets and White-Space Opportunities
- 10.4 Emerging Technology and Product Opportunities
- 10.5 New Capacity and Investment Hotspots
- 10.6 Market Entry and Expansion Opportunities
- 10.7 Distribution and Partnership Opportunities
- 10.8 Near-Term and Long-Term Commercial Potential
- 10.9 Opportunity Attractiveness and Execution Risks
Chapter 11 India Paints and Coatings Market Outlook, 2025-2035
- 11.1 Market Size and Analysis
- 11.1.1 Revenue (Market Measurement: 2025: USD 11.44 billion → 2035: USD 27.24 billion)
- 11.1.2 Market Volume and Quantity Sold
- 11.1.3 Historical Market Size, 2018-2025
- 11.1.4 Base-Year Market Size, 2025
- 11.2 Market Forecast, 2025-2035
- 11.2.1 Revenue Forecast to 2035
- 11.2.2 Volume Forecast to 2035
- 11.2.3 CAGR and Year-on-Year Growth
- 11.2.4 Incremental Revenue Opportunity
- 11.3 Forecast Assumptions and Scenario Analysis
- 11.3.1 Base-Case Forecast
- 11.3.2 Optimistic and Conservative Scenarios
- 11.3.3 Technology, Pricing and Policy Sensitivities
- 11.4 Market Attractiveness and Growth Outlook
Chapter 12 India Paints and Coatings Market Segmentation and Outlook
- 12.1 Segmentation Summary and Market Shares, 2025
- 12.2 Largest and Fastest-Growing Segments
- 12.3 By Product Type - Market Size and Forecast, 2025-2035
- 12.3.1 Segment Definition and Scope
- 12.3.2 Historical Market Size, 2018-2025
- 12.3.3 Revenue Forecast, 2025-2035
- 12.3.4 Volume Forecast, 2025-2035
- 12.3.5 Base-Year Market Share, 2025
- 12.3.6 Segment CAGR and Growth Drivers
- 12.3.7 Subsegment Market Size and Forecast
- 12.3.7.1 Decorative Paints
- 12.3.7.2 Industrial Coatings
- 12.3.7.3 Protective Coatings
- 12.3.7.4 Specialty Coatings
- 12.3.8 Subsegment Pricing and Adoption Trends
- 12.3.9 Leading Suppliers and Competition
- 12.3.10 Regional Demand and Opportunities
- 12.4 By Technology - Market Size and Forecast, 2025-2035
- 12.4.1 Segment Definition and Scope
- 12.4.2 Historical Market Size, 2018-2025
- 12.4.3 Revenue Forecast, 2025-2035
- 12.4.4 Volume Forecast, 2025-2035
- 12.4.5 Base-Year Market Share, 2025
- 12.4.6 Segment CAGR and Growth Drivers
- 12.4.7 Subsegment Market Size and Forecast
- 12.4.7.1 Water-Borne Coatings
- 12.4.7.2 Solvent-Borne Coatings
- 12.4.7.3 Powder Coatings
- 12.4.7.4 High-Solids and UV-Curable Coatings
- 12.4.8 Subsegment Pricing and Adoption Trends
- 12.4.9 Leading Suppliers and Competition
- 12.4.10 Regional Demand and Opportunities
- 12.5 By End-Use Industry - Market Size and Forecast, 2025-2035
- 12.5.1 Segment Definition and Scope
- 12.5.2 Historical Market Size, 2018-2025
- 12.5.3 Revenue Forecast, 2025-2035
- 12.5.4 Volume Forecast, 2025-2035
- 12.5.5 Base-Year Market Share, 2025
- 12.5.6 Segment CAGR and Growth Drivers
- 12.5.7 Subsegment Market Size and Forecast
- 12.5.7.1 Architectural and Construction
- 12.5.7.2 Automotive and Transportation
- 12.5.7.3 General Industrial and Machinery
- 12.5.7.4 Wood, Packaging and Consumer Durables
- 12.5.8 Subsegment Pricing and Adoption Trends
- 12.5.9 Leading Suppliers and Competition
- 12.5.10 Regional Demand and Opportunities
- 12.6 By Price Tier - Market Size and Forecast, 2025-2035
- 12.6.1 Segment Definition and Scope
- 12.6.2 Historical Market Size, 2018-2025
- 12.6.3 Revenue Forecast, 2025-2035
- 12.6.4 Volume Forecast, 2025-2035
- 12.6.5 Base-Year Market Share, 2025
- 12.6.6 Segment CAGR and Growth Drivers
- 12.6.7 Subsegment Market Size and Forecast
- 12.6.7.1 Economy
- 12.6.7.2 Mid-Tier
- 12.6.7.3 Premium
- 12.6.7.4 Performance-Specialty
- 12.6.8 Subsegment Pricing and Adoption Trends
- 12.6.9 Leading Suppliers and Competition
- 12.6.10 Regional Demand and Opportunities
- 12.7 Segment Growth Comparison
- 12.8 Segment Attractiveness and Priority Matrix
Chapter 13 India Paints and Coatings End-Use and Application Market Outlook
- 13.1 End-Use Industry and Customer Demand Structure
- 13.2 Leading Applications and Customer Groups
- 13.3 End-Use Market Size, Share and Forecast
- 13.4 Major End-Use Industry Deep Dives
- 13.4.1 Customer Requirements and Use Cases
- 13.4.2 Demand and Replacement Cycles
- 13.4.3 Technical and Regulatory Considerations
- 13.4.4 Purchasing and Procurement Models
- 13.4.5 Leading Vendors and Distribution Channels
- 13.4.6 Forecast and Commercial Opportunities
- 13.5 Emerging Applications and Cross-Segment Demand
- 13.6 End-Use Industry Investment Priorities
Chapter 14 India Paints and Coatings Geographic Market Outlook, 2025-2035
- 14.1 Domestic Market Distribution and Demand Clusters
- 14.2 State- or Province-Wise Market Size and Forecast, 2025-2035
- 14.3 City and Metropolitan Market Outlook
- 14.4 Industrial, Manufacturing and Commercial Clusters
- 14.5 Geographic Concentration of Key End Users
- 14.6 Local Pricing and Purchasing Differences
- 14.7 Domestic Production Facilities and Capacity Map
- 14.8 Local Infrastructure and Project Pipeline
- 14.9 State-Level Policy and Incentive Differences
- 14.10 Subnational Investment Hotspots and Opportunities
- 14.11 Distribution and Logistics Networks
- 14.12 Domestic Competitive Footprint
Chapter 15 India Paints and Coatings Technology, Innovation and Sustainability Outlook
- 15.1 Technology Landscape and Maturity
- 15.2 Product, Process and Service Innovation
- 15.3 AI, Automation and Digital Tools in the Industry
- 15.4 Technology Adoption and Performance Benchmarking
- 15.5 Innovation Pipeline and R&D Investment
- 15.6 Patent and Intellectual Property Trends
- 15.7 Energy Efficiency and Resource Management
- 15.8 Sustainability, Recycling and Circularity
- 15.9 Technology Roadmap, 2025-2035
- 15.10 Risks of Obsolescence and Technology Substitution
Chapter 16 India Paints and Coatings Market Key Strategic Imperatives
- 16.1 Growth and Market Entry Priorities
- 16.2 High-Return Products and Segments
- 16.3 Pricing, Profitability and Cost Optimization
- 16.4 Technology Investment and Product Differentiation
- 16.5 Supply Chain Localization and Resilience
- 16.6 Distribution and Customer Acquisition
- 16.7 Partnership, Acquisition and Capacity Strategy
- 16.8 Regional Expansion Priorities
- 16.9 Short-, Medium- and Long-Term Actions
Chapter 17 Competition Outlook
- 17.1 Industry Competition Characteristics
- 17.2 Market Structure and Concentration
- 17.3 Market Share and Competitive Positioning, 2025
- 17.4 Company-Wise Revenue and Product Benchmarking
- 17.5 Production and Service Capacity Benchmarking
- 17.6 Technology, Pricing and Differentiation
- 17.7 Regional Footprint and Distribution Strength
- 17.8 Mergers, Acquisitions and Strategic Alliances
- 17.9 New Entrants and Competitive Threats
- 17.10 Porter's Five Forces and Industry Attractiveness
- 17.11 Competitive Outlook, 2025-2035
Chapter 18 Company Profiles
- 18.1 Company Coverage and Selection Criteria
- 18.2 Asian Paints Limited
- 18.2.1 Business Description
- 18.2.2 Company Ownership and Geographic Presence
- 18.2.3 Product and Service Portfolio
- 18.2.4 Manufacturing and Operating Footprint
- 18.2.5 Production Capacity and Expansion Plans
- 18.2.6 Financial Performance and Investment
- 18.2.7 Market Share and Competitive Position
- 18.2.8 Technology and Innovation Capabilities
- 18.2.9 Strategic Alliances or Partnerships
- 18.2.10 Recent Developments
- 18.2.11 Growth Strategy and Outlook
- 18.3 Berger Paints India Limited
- 18.4 Kansai Nerolac Paints Limited
- 18.5 Akzo Nobel India Limited
- 18.6 Grasim Industries Limited (Birla Opus)
- 18.7 Indigo Paints Limited
- 18.8 JSW Paints Private Limited
- 18.9 Nippon Paint (India) Private Limited
- 18.10 Shalimar Paints Limited
- 18.11 Sheenlac Paints Limited
- 18.12 Other Relevant Market Participants
Note: Every listed company is profiled on the structure shown under the first company. The company list is preliminary and may change based on research findings, market developments, data availability and client requirements.
Chapter 19 Disclaimer
- 19.1 Research and Forecast Disclaimer
- 19.2 Data Source and Estimation Limitations
Note: The depth of individual sections depends on data availability for this market. Volume, capacity, trade and other unit-based metrics are included where applicable.

