
Market overview
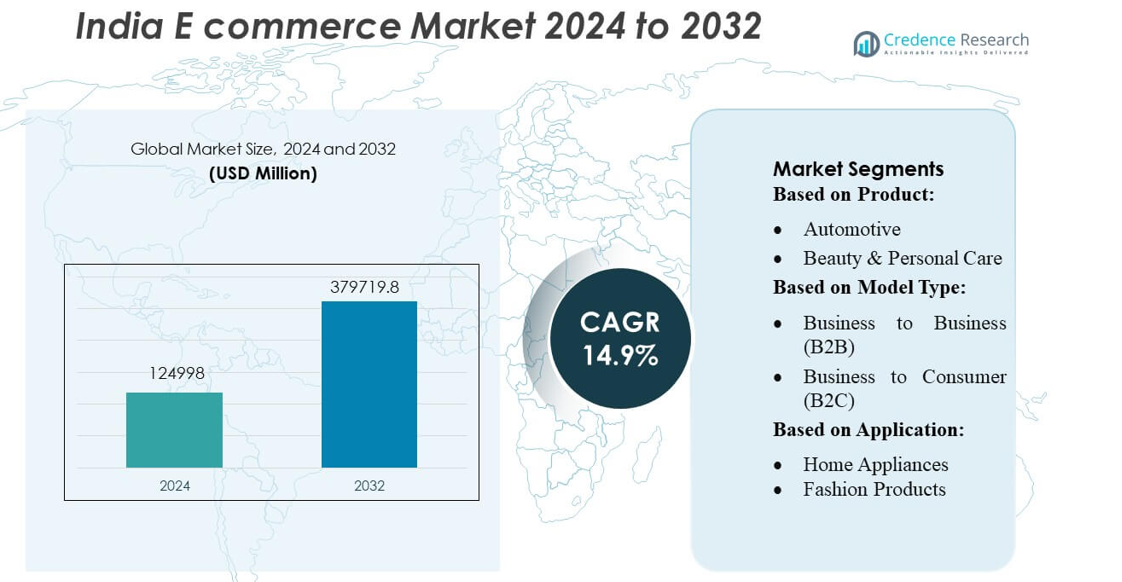
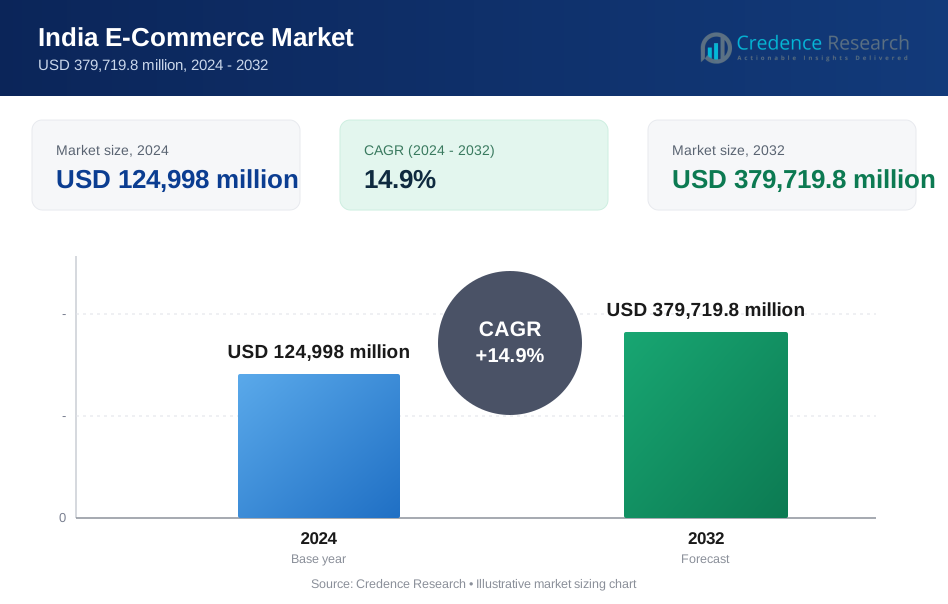
India E commerce Market size was valued USD 124998 million in 2024 and is anticipated to reach USD 379719.8 million by 2032, at a CAGR of 14.9% during the forecast period.
| REPORT ATTRIBUTE | DETAILS |
|---|---|
| Historical Period | 2020-2023 |
| Base Year | 2024 |
| Forecast Period | 2025-2032 |
| India E-Commerce Market Size 2024 | USD 124998 million |
| India E-Commerce Market, CAGR | 14.9% |
| India E-Commerce Market Size 2032 | USD 379719.8 million |
The India e-commerce market is led by major players such as Amazon, Flipkart, Reliance Retail (JioMart), Meesho, and Tata Cliq, each strengthening their presence through deep discounting, extensive seller ecosystems, and strong logistics capabilities. These companies increasingly invest in AI-driven personalization, rapid delivery infrastructure, and localized interfaces to capture a wider consumer base. North India emerges as the leading regional market with an exact share of 31%, supported by high urbanization, strong purchasing power, and dense fulfillment networks across Delhi NCR, Punjab, Haryana, and Uttar Pradesh, making it the most commercially significant e-commerce hub in the country.
Market Insights
- The India E-commerce Market reached USD 124,998 million in 2024 and is projected to hit USD 379,719.8 million by 2032, expanding at a 14.9% CAGR, supported by rapid digital adoption, wider smartphone usage, and increasing online spending.
- Strong market drivers include rising digital payments, improved logistics networks, and expanding product categories, with consumer electronics holding the largest segment share at around 35–40%.
- Key trends include growth in quick-commerce, AI-powered personalization, and deeper penetration into Tier II and Tier III cities as platforms invest in localized content and hyperlocal delivery.
- Competitive intensity remains high as Amazon, Flipkart, Reliance Retail, Meesho, and Tata Cliq enhance supply chains, strengthen seller ecosystems, and leverage technology to improve conversion rates and customer retention.
- Regional insights show North India leading with 31% market share, driven by strong purchasing power and dense fulfillment networks, while South and West India follow with rising adoption across fashion, grocery, and electronics categories.
Market Segmentation Analysis:
By Product
Consumer Electronics dominates India’s e-commerce market, contributing an estimated 35–40% share, driven by strong online penetration of smartphones, wearables, and large appliances. The segment benefits from aggressive discounting, EMI financing, and rapid product refresh cycles that encourage frequent purchases. Beauty & Personal Care follows due to rising digital-first brands and personalized product discovery tools, while Books & Stationery and Automotive components maintain steady niche demand. The overall product landscape continues to shift as consumers increasingly prioritize convenience, price transparency, and rapid delivery through integrated e-commerce ecosystems.
- For instance, Bilibili’s value-added services business and is largely driven by live broadcasting. The figure of RMB 2.6 billion is close to the RMB 2.53 billion reported for Q1 2024 (and RMB 2.81 billion for Q1 2025).
By Model Type
The Business-to-Consumer (B2C) model leads the Indian e-commerce market with an estimated 80–85% market share, supported by the dominance of large marketplaces and their extensive last-mile logistics networks. B2C platforms drive consumer adoption through cashback programs, fast delivery, omnichannel integration, and expanding seller bases across Tier II and III cities. In contrast, the B2B segment, though smaller, experiences rapid growth owing to digitization of procurement, onboarding of MSMEs, and bulk-buying efficiencies. The B2C model remains dominant as rising disposable income and increasing smartphone usage boost online retail consumption.
- For instance, JD.com operates a vast logistics network with over 3,600 warehouses as of mid-2025, and leverages highly automated facilities. The Kunshan park is a key example of this automation. While a 2020 report specified a daily processing capacity of 1.6 million orders per day, other sources and general descriptions of the facilities and peak operations.
By Application
Fashion Products represent the largest application segment, accounting for roughly 30–35% of market share, propelled by high purchase frequency, wide product assortments, and deep discount-driven campaigns. Groceries emerge as a fast-growing category with increasing adoption of quick-commerce platforms, while Home Appliances and Books maintain stable demand. The “Others” category, including digital entertainment and lifestyle accessories, expands as platforms diversify offerings. Fashion retains dominance because of strong influencer-driven marketing, rapid trend cycles, and improved return logistics that build consumer confidence in online apparel and accessory purchases.
Key Growth Drivers
Rising Internet Penetration and Smartphone Adoption
India’s expanding digital infrastructure significantly accelerates e-commerce growth. Affordable smartphones, declining data costs, and wider 4G/5G availability increase online engagement across urban and rural regions. This connectivity boosts customer acquisition, payment digitization, and browsing frequency on retail platforms. As more consumers integrate digital services into daily routines, e-commerce platforms gain higher traffic volume and transaction frequency. The widespread digital shift strengthens online retail accessibility, expands market coverage, and enables e-commerce players to scale faster through targeted advertising and personalized product recommendations.
- For instance, ASOS ran a "Data Fluency Pilot Programme" broader effort to develop internal talent and leadership, aiming to upskill a significant number of employees in data-related fields. The figure of "over 60 employees" is consistent with the scale of their initiatives.
Logistics Optimization and Last-Mile Innovation
Advanced logistics networks and technology-driven fulfillment models strengthen India’s e-commerce ecosystem. Companies invest in hyperlocal delivery, AI-enabled route planning, and warehouse automation to reduce delivery times and enhance reliability. Expansion of dark stores, micro-fulfillment centers, and regional hubs further increases service reach across Tier II and III cities. Faster delivery options, including same-day and next-day services, boost customer satisfaction and order conversion rates. These improvements create a more efficient supply chain, enabling platforms to handle high-volume sales events and support rapid category diversification.
- For instance, Checkout.com’s platform leverages AI and real-time network data to improve transaction acceptance rates—Pinterest supports more than 570 million users globally, and the payments integration is primarily used by its advertisers.
Growth of Digital Payments and Financial Inclusion
E-commerce expansion aligns closely with the surge in digital payment adoption through UPI, mobile wallets, and BNPL solutions. Easy and secure payment options reduce friction during checkout and enhance consumer trust. Financial inclusion initiatives broaden access to formal banking and credit systems, enabling more users to transact online. BNPL and low-cost EMIs attract value-sensitive customers and support high-ticket purchases. This financial transformation strengthens transaction volumes, encourages repeat purchases, and supports deeper penetration of online retail across diverse income groups.
Key Trends & Opportunities
Quick-Commerce Expansion and On-Demand Retail
Quick-commerce platforms reshape consumer expectations by offering delivery windows of 10–30 minutes for groceries and essentials. This model creates new opportunities in ultra-fast fulfillment, demand forecasting, and neighborhood-based inventory management. As convenience-driven consumption grows, e-commerce companies increasingly integrate micro-warehousing and hyperlocal partnerships. Quick-commerce also opens cross-selling opportunities in categories such as personal care, beverages, and ready-to-eat foods. Its rapid scalability and high-order frequency position it as one of the most influential emerging trends in India’s digital retail landscape.
- For instance, Flipkart has deployed 83 fulfilment centres nationwide. It has also committed to establishing 800 dark stores.These reports indicated that the expansion was to scale up from approximately 300 to 400 dark stores that were operational earlier in 2025.
Tier II & III Market Penetration and Regional Commerce
The next growth wave stems from rising digital awareness, increasing purchasing power, and improved logistics connectivity in smaller cities. E-commerce platforms localize interfaces, expand vernacular content, and offer region-specific assortments to attract new users. Growth in regional D2C brands, influencer-driven commerce, and flexible payment methods strengthens adoption in these markets. As first-time online shoppers expand significantly, companies witness higher order volumes from non-metro locations. This shift creates a large opportunity for category expansion, vendor onboarding, and scalable, culturally tailored marketing strategies.
- For instance, Android app to understand and process voice commands in Hindi and Hinglish, with Alexa in Hindi had increased by over 52% in the preceding year. The Amazon Lex V2 service, a core part of the AWS platform, officially supports conversational interfaces in "English (India)" (en-IN).
Omnichannel Retail and Technology-Driven Personalization
Brands increasingly merge online and offline channels to deliver a seamless shopping experience through click-and-collect, endless aisles, and unified inventory visibility. AI-based personalization, visual search, and AR-driven try-ons enhance product discovery and customer engagement. Retailers adopt data-driven insights to optimize pricing, promotions, and assortment planning. This integration helps reduce return rates and improves conversion efficiency. As consumers demand flexible, intuitive shopping journeys, omnichannel retail emerges as a strategic growth path, enabling e-commerce players to differentiate through superior experience and convenience.
Key Challenges
High Logistics Costs and Operational Complexity
Despite improvements, logistics remains one of the most significant cost burdens for e-commerce companies. Last-mile delivery, reverse logistics, and servicing remote regions increase operational expenses. Seasonal surges during festive sales strain fulfillment capacity and elevate handling costs. Managing COD orders, fragile products, and high return rates further complicates operations. These inefficiencies impact margins, particularly for low-value, high-frequency categories. Overcoming this challenge requires investments in automation, network optimization, and localized distribution to ensure a financially sustainable delivery ecosystem.
Regulatory Uncertainty and Data Protection Constraints
E-commerce growth faces challenges from evolving regulatory frameworks governing data privacy, platform accountability, and consumer protection. Policies related to marketplace neutrality, FDI compliance, and data storage create operational uncertainties for major players. Stricter guidelines on flash sales, deep discounting, and cross-selling influence pricing strategies and platform competitiveness. Additionally, compliance with emerging data protection norms requires significant investment in cybersecurity and governance. These regulatory pressures demand robust internal controls and transparent practices to maintain business continuity and consumer trust.
Regional Analysis
North America
North America accounts for approximately 25–27% of the global e-commerce market, driven by high internet penetration, mature digital payments, and strong consumer trust in online retail platforms. The U.S. leads regional growth with advanced logistics networks, widespread adoption of same-day delivery, and strong demand for electronics, fashion, and subscription-based services. Major players invest heavily in warehouse automation and AI-powered personalization to increase conversion rates. Canada contributes steadily through rising mobile commerce and expanding omnichannel adoption. Overall, North America retains a dominant position due to strong digital ecosystems and high purchasing power.
Europe
Europe holds around 20–22% of global e-commerce market share, supported by a well-regulated digital economy, robust consumer protection frameworks, and high cross-border e-commerce activity. Western European markets such as Germany, the U.K., and France lead adoption with strong digital payments, seamless logistics connectivity, and a preference for premium brands. Eastern Europe shows steady growth as smartphone penetration rises and marketplaces expand regional delivery networks. The shift toward sustainable consumption and eco-friendly packaging influences retailer strategies across the region. Europe’s structured regulatory environment and strong digital trust enhance long-term market stability.
Asia-Pacific
Asia-Pacific dominates the global e-commerce market with an estimated 55–57% market share, driven by massive population size, rapid urbanization, and high mobile-first commerce adoption. China and India remain the strongest growth engines, supported by expansive digital payment ecosystems and large marketplace platforms. Southeast Asia accelerates quickly through young demographics, improving logistics, and rising digital literacy. Cross-border trade, social commerce, and live-commerce formats fuel high engagement rates across APAC. The region’s dynamic innovation cycle, diverse consumer base, and strong government support for digital transformation make it the fastest-growing global e-commerce hub.
Latin America
Latin America represents 6–7% of the global e-commerce market, showing rapid growth driven by expanding digital payments, improving logistics infrastructure, and rising mobile internet adoption. Brazil and Mexico lead regional activity due to large consumer bases and strong marketplace penetration. The widespread shift from cash to digital wallets and BNPL solutions encourages broader online participation. Regional platforms focus on strengthening last-mile delivery, especially in underserved urban and semi-urban areas. Despite economic volatility, Latin America offers significant growth potential as consumer trust in online platforms increases and retail digitization accelerates across sectors.
Middle East & Africa
The Middle East & Africa region holds approximately 3–4% of global e-commerce share but displays strong future potential due to rising smartphone penetration and expanding digital infrastructure. Gulf countries such as the UAE and Saudi Arabia drive regional growth with high purchasing power, robust logistics networks, and strong demand for luxury goods. Africa’s e-commerce landscape grows steadily as mobile money adoption increases and marketplaces invest in localized delivery models. Cross-border shopping and social commerce adoption continue to rise. MEA’s young demographic and improving regulatory frameworks position the region for sustained expansion.
Market Segmentations:
By Product:
- Automotive
- Beauty & Personal Care
By Model Type:
- Business to Business (B2B)
- Business to Consumer (B2C)
By Application:
- Home Appliances
- Fashion Products
By Geography
- North America
- U.S.
- Canada
- Mexico
- Europe
- Germany
- France
- U.K.
- Italy
- Spain
- Rest of Europe
- Asia Pacific
- China
- Japan
- India
- South Korea
- South-east Asia
- Rest of Asia Pacific
- Latin America
- Brazil
- Argentina
- Rest of Latin America
- Middle East & Africa
- GCC Countries
- South Africa
- Rest of the Middle East and Africa
Competitive Landscape
The competitive landscape of the India e-commerce market features a diverse mix of global and regional players, including Lazada, Costco Wholesale Corporation, JD.com, ASOS, MercadoLibre S.R.L., Amazon.com, Inc., Flipkart.com, Alibaba.com, eBay Inc., and Dangdang. The India e-commerce market continues to evolve rapidly, driven by the expansion of large marketplaces, rising digital-first brands, and increasing category specialization. Companies invest aggressively in strengthening logistics, optimizing delivery speed, and deploying AI-driven personalization to enhance customer engagement. Growing smartphone adoption and the shift toward digital payments enable platforms to expand deeper into Tier II and Tier III cities, where localized interfaces and regional fulfillment centers improve reach. Competition intensifies as players diversify into groceries, fashion, and electronics, while quick-commerce and omnichannel strategies further redefine market positioning. Continuous innovation in pricing, product assortment, and customer experience remains central to sustaining competitive advantage.
Key Player Analysis
- Lazada
- Costco Wholesale Corporation
- com
- ASOS
- MercadoLibre S.R.L.
- com, Inc.
- com
- com
- eBay Inc.
- Dangdang
Recent Developments
- In May 2025, Davalindia, India's largest private retail chain specializing in generic medicines, launched its e-commerce platform in Varanasi, providing accessibility and affordable healthcare through digital channels.
- In November 2024, Amazon expanded its cross-border logistics program, SEND, by adding new carriers and integrating it with Amazon Warehousing and Distribution to make it easier for Indian exporters to ship goods internationally.
- In February 2024, Wix partnered with Global-e Online to integrate cross-border eCommerce tools for its merchants, allowing them to sell products to international customers more easily. This collaboration provides Wix merchants with localized checkout experiences, support for multiple currencies, and the ability to customize pricing and shipping options for different markets.
- In February 2023, MikMak, an e-commerce acceleration platform, acquired Swaven, an e-commerce enablement and analytics software company with a presence in EMEA, APAC, and LATAM. The acquisition expanded MikMak's global reach, integrated Swaven's international network with its North American retailer marketplace, and paved the way for the launch of the enhanced MikMak 3.0 platform
Report Coverage
The research report offers an in-depth analysis based on Product, Model Type, Application and Geography. It details leading market players, providing an overview of their business, product offerings, investments, revenue streams, and key applications. Additionally, the report includes insights into the competitive environment, SWOT analysis, current market trends, as well as the primary drivers and constraints. Furthermore, it discusses various factors that have driven market expansion in recent years. The report also explores market dynamics, regulatory scenarios, and technological advancements that are shaping the industry. It assesses the impact of external factors and global economic changes on market growth. Lastly, it provides strategic recommendations for new entrants and established companies to navigate the complexities of the market.
Future Outlook
- The market will continue expanding as digital adoption deepens across urban and rural regions.
- E-commerce companies will strengthen last-mile delivery capabilities through automation and micro-fulfillment centers.
- Quick-commerce growth will accelerate, increasing demand for hyperlocal inventory and faster delivery commitments.
- AI-driven personalization will enhance product discovery, conversion rates, and customer retention.
- Regional language interfaces will play a larger role in attracting first-time online shoppers.
- Omnichannel integration will intensify as retailers unify online and offline inventory systems.
- Digital payments adoption will rise further, reducing checkout friction and boosting repeat purchases.
- Tier II and Tier III cities will emerge as the strongest future demand centers.
- Regulatory reforms will shape platform governance, consumer protection, and retail compliance structures.
- Competition will increase as D2C brands, niche vertical platforms, and global players expand their presence.
Request a Free Sample
Fill in your details and we'll send you a free sample report.
- Sample data tables & charts
- Research methodology
Need a Custom Version of This Report?
Tailor the scope, geography, or segments to your exact requirements.
- Custom geography or segment scope
- Direct access to our analyst team
Frequently Asked Questions
What is the current market size for the India E-Commerce Market, and what is its projected size in 2032?
At what Compound Annual Growth Rate is the India E-Commerce Market projected to grow between 2025 and 2032?
Which India E-Commerce Market segment held the largest share in 2024?
What are the primary factors fueling the growth of the India E-Commerce Market?
Who are the leading companies in the India E-Commerce Market?
Which region commanded the largest share of the India E-Commerce Market in 2024?
Table of Content
Chapter 1. Report Introduction
- 1.1 Report Description & Purpose
- 1.1.1 Report Title & Market Definition
- 1.1.2 Unique Selling Propositions (USP) & Key Differentiators
- 1.1.3 Value Proposition for Stakeholders
- 1.2 Research Objectives
- 1.2.1 Market Sizing Objectives (Volume & Revenue)
- 1.2.2 Segmentation Objectives
- 1.2.3 Competitive Intelligence Objectives
- 1.2.4 Forecast & Scenario Objectives
- 1.3 Report Scope
- 1.3.1 India E-Commerce Scope – Types & Subtypes Covered
- 1.3.2 Geographic Scope – Regions & Countries Covered
- 1.3.3 Historical Period, Base Year & Forecast Period (2024; forecast to 2032)
- 1.3.4 Inclusions & Exclusions
- 1.4 HS Code & Classification Framework
- 1.5 Currency, Units & Pricing Basis
- 1.6 Target Stakeholders
- 1.7 Limitations & Assumptions
Chapter 2. Executive Summary
- 2.1 Global India E-Commerce Market Snapshot
- 2.1.1 Market Size – Historical (2024) & Forecast (2024-2032) (2024: USD 124,998 million → 2032: USD 379,719.8 million)
- 2.1.2 Volume & Revenue – Global Totals
- 2.1.3 Key Market Highlights – Top Five Facts
- 2.2 India E-Commerce Market Segmentation Snapshot
- 2.2.1 Market Split by Region – 2024 vs. 2032
- 2.3 Competitive Snapshot
- 2.3.1 Top 10 Players by Revenue Share – 2024
- 2.3.2 Top 10 Players by Volume Share – 2024
- 2.3.3 Recent Strategic Developments (18-Month Summary)
- 2.4 Key Investment Highlights & Strategic Conclusions
Chapter 3. India E-Commerce Market Dynamics & Industry Analysis
- 3.1 Market Overview & Context
- 3.1.1 India E-Commerce Market Position in the Broader Automotive Value Chain
- 3.1.2 OEM vs. Replacement Market Dynamics
- 3.1.3 Market Maturity & Development Stage by Region
- 3.2 India E-Commerce Market Drivers
- 3.3 India E-Commerce Market Restraints & Challenges
- 3.4 India E-Commerce Market Opportunities
- 3.5 Porter's Five Forces Analysis
- 3.5.1 Threat of New Entrants
- 3.5.2 Bargaining Power of Suppliers
- 3.5.3 Bargaining Power of Buyers
- 3.5.4 Threat of Substitutes
- 3.5.5 Competitive Rivalry – Intensity Assessment
- 3.6 India E-Commerce Value Chain Analysis
- 3.6.1 Upstream – Raw Material/Input Suppliers
- 3.6.1.1 Raw Material/Input 1
- 3.6.1.2 Raw Material/Input 2
- 3.6.1.3 Raw Material/Input 3
- 3.6.2 Midstream – Production/Manufacturing/Service Delivery
- 3.6.2.1 Production/Process Overview
- 3.6.2.2 Key Facility Locations & Capacity by Manufacturer
- 3.6.3 Downstream – Distribution & End Consumer
- 3.6.3.1 Primary Channel – B2B/OEM
- 3.6.3.2 Secondary Channels – Dealer, Retail, Online, Direct
- 3.6.4 Value Chain Profitability Analysis
- 3.6.1 Upstream – Raw Material/Input Suppliers
- 3.7 PESTEL Analysis
- 3.7.1 Political Factors
- 3.7.2 Economic Factors
- 3.7.3 Social Factors
- 3.7.4 Technological Factors
- 3.7.5 Environmental Factors
- 3.7.6 Legal Factors
- 3.8 India E-Commerce Supply Chain Analysis
- 3.8.1 Raw Material/Input Supply Risk Assessment
- 3.8.2 Manufacturing Concentration Risk (Geographic Exposure)
- 3.8.3 Trade Disruption Impact Analysis
- 3.9 Regulatory & Policy Landscape
Note: The regulatory and policy landscape section covers regulations based on their applicability to the market, India E-Commerce category, geography, and scope of the study. Only regulatory frameworks with a material impact on operations, compliance, trade, sustainability, or market access are analyzed in detail.
Chapter 4. Key Investment Pockets & Opportunity Analysis
- 4.1 India E-Commerce Market Attractiveness Analysis
- 4.1.1 By Region – Investment Attractiveness Matrix (Volume × CAGR)
- 4.2 Absolute Revenue Growth Opportunity
- 4.2.1 By Region – Absolute USD Growth Through 2032
- 4.3 Incremental Volume Opportunity
- 4.3.1 By Region – Incremental Volume Through 2032
- 4.3.2 Segment – Incremental Volume
- 4.4 Emerging Submarket Opportunity Deep Dive (Subject to Applicability)
- 4.5 Emerging Market Opportunity Scorecards
- 4.5.1 United States
- 4.5.2 Europe
- 4.5.3 Asia
- 4.5.4 Middle East & Africa
Note: Emerging Market Opportunity Scorecards will be included based on relevance and strategic importance. Regions listed are indicative and may vary depending on data availability and market dynamics.
Chapter 5. India E-Commerce Import-Export Analysis & Trade Flows
- 5.1 Global Trade Overview
- 5.1.1 Global Export Value by Country (2024)
- 5.1.2 Global Export Volume by Country (2024)
- 5.1.3 Global Import Value by Country (2024)
- 5.1.4 Global Import Volume by Country (2024)
- 5.1.5 Net Trade Balance by Country (2024)
- 5.2 Export Analysis – Segment
- 5.2.1 Type 1 (HS Code)
- 5.2.2 Type 2 (HS Code)
- 5.2.3 Type 3 (HS Code)
- 5.2.4 Type 4 (HS Code)
- 5.2.5 Type 5 (HS Code)
- 5.3 Import Analysis – Segment
- 5.3.1 Type 1 (HS Code)
- 5.3.2 Type 2 (HS Code)
- 5.3.3 Type 3 (HS Code)
- 5.3.4 Type 4 (HS Code)
- 5.3.5 Type 5 (HS Code)
- 5.4 Average Unit Trade Prices
- 5.4.1 Average Export Price – Segment & Country
- 5.4.2 Average Import Price – Segment & Source Country
- 5.4.3 Price Trends (2024)
- 5.5 Key Trade Route Analysis
- 5.5.1 Trade Route 1
- 5.5.2 Trade Route 2
- 5.5.3 Trade Route 3
- 5.5.4 Trade Route 4
- 5.5.5 Trade Route 5
- 5.6 Trade Policy Impact Assessment
- 5.6.1 US Anti-Dumping & Section 301 Tariffs
- 5.6.2 EU Customs Union Impact
- 5.6.3 Major Free Trade Agreements
- 5.6.4 USMCA Rules of Origin
Note: Trade policy analysis will be included only where relevant to the India E-Commerce market.
Chapter 6. Competitive Landscape & Company Benchmarking
- 6.1 India E-Commerce Market Concentration & Structure
- 6.1.1 Herfindahl-Hirschman Index (HHI) – vs. 2024
- 6.1.2 Tier 1, Tier 2 & Tier 3 Market Structure
- 6.1.3 Global, Regional & Local Player Dynamics
- 6.2 India E-Commerce Market Share Analysis – 2024
- 6.2.1 Global Revenue Share by Company
- 6.2.2 Global Volume Share by Company
- 6.2.3 Regional Revenue Share
- 6.2.4 Market Share Evolution ( vs. 2024)
- 6.2.5 OEM Segment Share by Company
- 6.2.6 Replacement Segment Share by Company
- 6.3 Production/Delivery Capacity & Facility Analysis
- 6.3.1 Global Installed Capacity
- 6.3.2 Capacity Utilization Rates
- 6.3.3 Production/Output Volume
- 6.3.4 Facility Locations & Capacity Map
- 6.3.5 Planned Capacity Additions
- 6.4 India E-Commerce Competitive Benchmarking Matrix
- 6.4.1 Revenue, Volume, CAGR & Profitability Comparison
- 6.4.2 Channel Revenue Mix
- 6.4.3 Geographic Revenue Exposure
- 6.4.4 R&D Intensity
- 6.4.5 Sustainability Maturity
- 6.5 Strategic Developments in India E-Commerce (Last 24 Months)
- 6.5.1 Mergers, Acquisitions & Divestments
- 6.5.2 New India E-Commerce Launches
- 6.5.3 Facility Expansions
- 6.5.4 Strategic Alliances, Joint Ventures & Partnerships
- 6.5.5 Distribution Expansion & Market Entry
- 6.5.6 Sustainability & ESG Initiatives
- 6.6 Competitive Strategy Mapping
- 6.6.1 Leader, Challenger, Follower & Niche Classification
- 6.6.2 Pricing Strategy Comparison
- 6.6.3 Channel Strategy Matrix
Note: Strategic developments are included based on their materiality and the availability of reliable information.
Chapter 7. Global India E-Commerce Market – By Distribution Channel
- 7.1 Segment Overview
- 7.1.1 Volume & Revenue Split by Channel (2024 & 2032)
- 7.1.2 Channel Mix Evolution (2024-2032)
Chapter 8. Regional Market Analysis – Global Overview
- 8.1 Global Regional Overview
- 8.1.1 Regional Volume Share
- 8.1.2 Regional Revenue Share
- 8.1.3 Regional Volume by Region
- 8.1.4 Regional Revenue by Region
- 8.1.5 Regional Forecast Through 2032
- 8.2 Cross-Regional Segment Analysis
- 8.2.1 By Distribution Channel
- 8.2.2 By Brand/Price Tier
Chapter 9. North America India E-Commerce Market
- 9.1 United States
- 9.2 Canada
- 9.3 Mexico
Chapter 10. Europe India E-Commerce Market
- 10.1 Germany
- 10.2 France
- 10.3 Italy
- 10.4 United Kingdom
- 10.5 Spain
- 10.6 Poland
- 10.7 Russia
- 10.8 Netherlands
- 10.9 Belgium
- 10.10 Sweden
- 10.11 Denmark
- 10.12 Norway
- 10.13 Rest of Europe
Chapter 11. Asia Pacific India E-Commerce Market
- 11.1 China
- 11.2 India
- 11.3 Japan
- 11.4 South Korea
- 11.5 Thailand
- 11.6 Indonesia
- 11.7 Vietnam
- 11.8 Malaysia
- 11.9 Australia
- 11.10 Rest of Asia Pacific
Chapter 12. Latin America India E-Commerce Market
- 12.1 Brazil
- 12.2 Argentina
- 12.3 Colombia
- 12.4 Chile
- 12.5 Rest of Latin America
Chapter 13. Middle East India E-Commerce Market
- 13.1 Saudi Arabia
- 13.2 United Arab Emirates
- 13.3 Turkey
- 13.4 Israel
- 13.5 Iran
- 13.6 Rest of the Middle East
Chapter 14. Africa India E-Commerce Market
- 14.1 South Africa
- 14.2 Egypt
- 14.3 Nigeria
- 14.4 Morocco
- 14.5 Rest of Africa
Chapter 15. India E-Commerce Company Profiles
- 15.1 [Company 01]
- 15.1.1 Company Overview
- 15.1.2 Key Management Personnel
- 15.1.3 Products & Services Portfolio
- 15.1.4 Financial Performance
- 15.1.5 Key Market Focus & Geographic Presence
- 15.1.6 Recent Developments & Strategic Initiatives
Note: The company profile list is preliminary and may change based on research findings, market developments, data availability, and client requirements.
Chapter 16. Appendices
- Appendix A – List of Abbreviations & Acronyms
- Appendix B – Industry Classification Code Reference – Full Series
- Appendix C – Production & Capacity Data Tables
- Appendix D – End-Use & Demand Base Tables
- Appendix E – Consumption & Replacement Rate Assumptions
- Appendix F – ASP Reference Tables
- Appendix G – Manufacturing & Facility Database
- Appendix H – Import-Export Data Tables
- Appendix I – Regulatory Summary Tables
- Appendix J – Primary Research Participant List (Anonymized)
- Appendix K – Primary Research Questionnaire Framework
- Appendix L – Data Sources & Bibliography
- Appendix M – Market Size Divergence & Source Comparison
Chapter 17. Research Methodology
- 17.1 Research Framework & Philosophy
- 17.2 Secondary Research – Sources, Hierarchy & Data Extraction
- 17.3 Data Modeling – Bottom-Up & Top-Down Market Sizing
- 17.4 Primary Research – Stakeholder Framework, LOI & Sample Sizes
- 17.5 Forecast Methodology – Regression, Scenario & Sensitivity Analysis
- 17.6 Quality Control – Four-Layer Validation Framework
- 17.7 Limitations & Standard Assumptions
- 17.8 Disclaimer
