Generic pharmacy outlets widen low-cost access in India
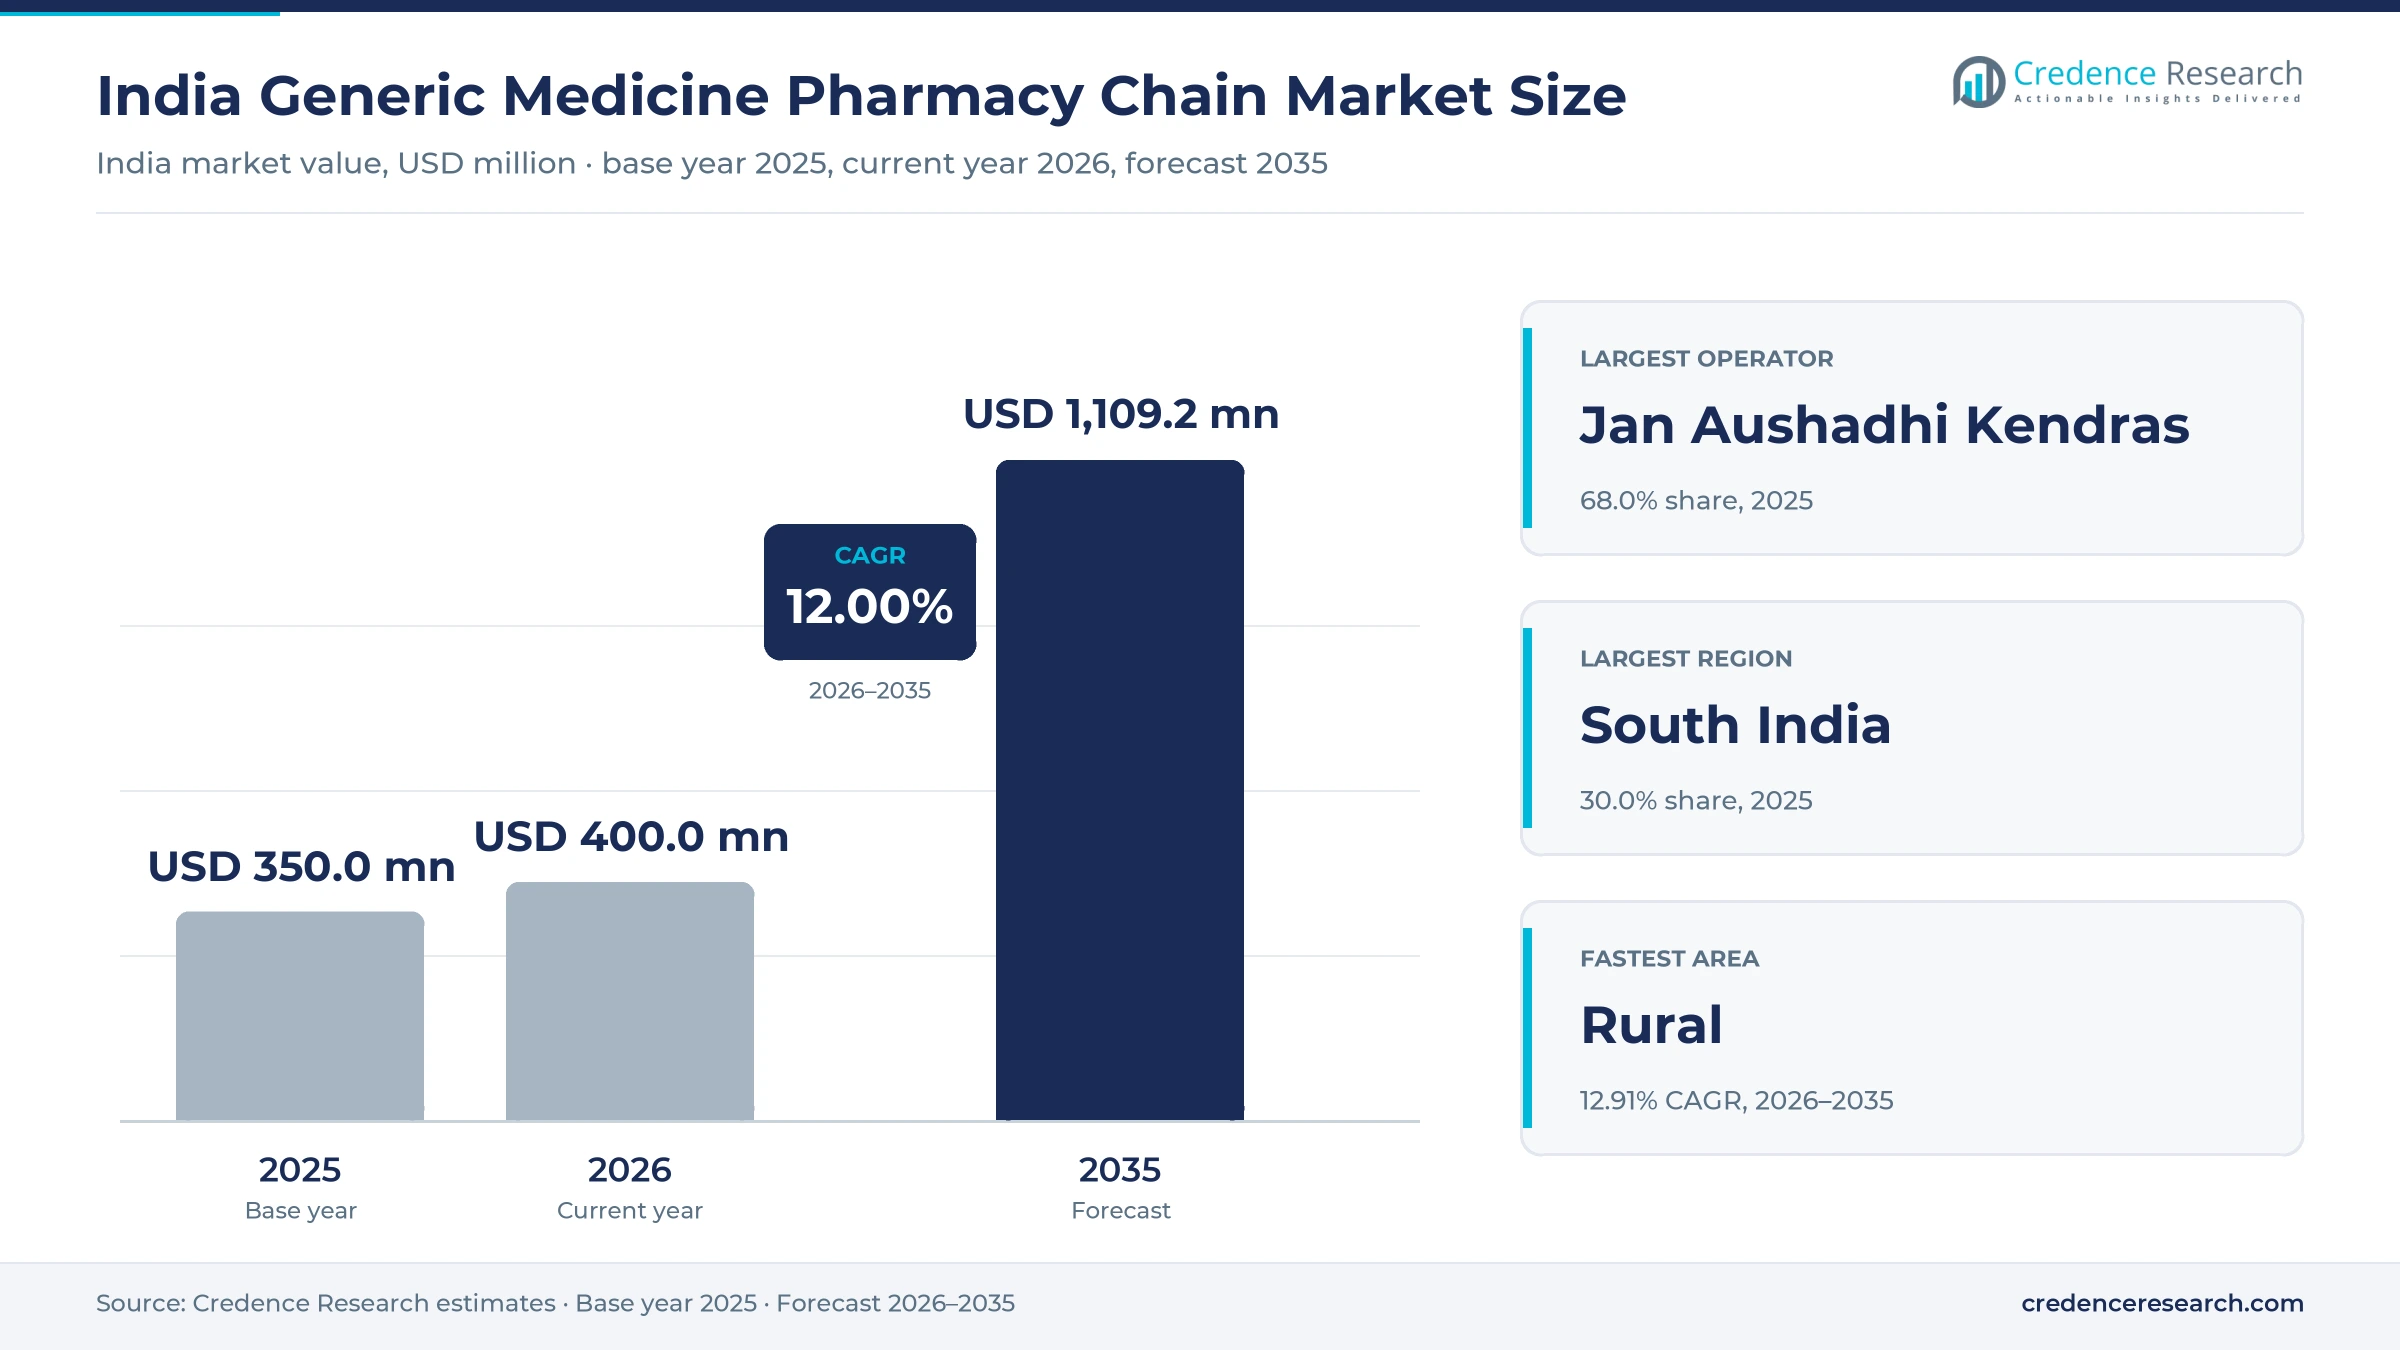
The India generic medicine pharmacy chain market was valued at USD 357.1 million in 2025 and is projected to increase from USD 400.0 million in 2026 to USD 1.11 billion by 2035, registering a CAGR of 12.00% during 2026–2035. Demand comes from households that pay for most medicines themselves and from chronic patients who refill diabetes, cardiac and thyroid therapies each month. South India held the largest regional share, 30.0% in 2025, because Kerala, Karnataka and Tamil Nadu have the densest Jan Aushadhi coverage in the country. Northeast India is the fastest-growing region at 13.03% a year, although it starts from a small base of outlets. The Jan Aushadhi network passed 20,547 kendras on July 31, 2026, against a government target of 25,000 by March 2027. Private chains are scaling as well, and Davaindia ran 2,825 stores by June 30, 2026, most of them company-owned. This mix of state-backed licensees and private-label chains is changing how lower-cost prescriptions reach Indian patients.
Which outlets and sales does the generic pharmacy chain market count?
The India generic medicine pharmacy chain market counts retail sales of medicines, surgical items and allied products through outlets that sell mainly unbranded or private-label generics under one network name. It covers Jan Aushadhi Kendras licensed under the Pradhan Mantri Bhartiya Janaushadhi Pariyojana and private generic chains, whether franchised or company-owned, in urban and rural areas. Patients buy at the counter, by phone or through a chain app, and most pay in cash.
The market excludes generic sales at ordinary chemists, hospital inpatient pharmacies, free drug schemes run by state governments and online pharmacies without generic-only stores. Value flows from patients to store operators, who buy from the central bureau or the chain, which in turn sources from contract manufacturers and its own warehouses.
India Generic Medicine Pharmacy Chain Market Insights
- Sales rise from USD 357.1 million in 2025 to USD 1.11 billion by 2035 at a 12.00% CAGR, as kendra numbers and private chain stores both keep climbing.
- South India held 30.0% of 2025 value, because Kerala, Karnataka and Tamil Nadu each had more than 1,500 kendras in 2026.
- Jan Aushadhi Kendras accounted for 68.0% of 2025 value, since the state network recorded Rs 2,252.19 crore of sales in fiscal 2025-26.
- Davaindia reached 2,825 stores on June 30, 2026, with 1,855 company-owned outlets, which shows the shift toward direct control.
- Chronic therapies made up 60% of Davaindia revenue in fiscal 2026, so refill demand now anchors private chain economics.
Jan Aushadhi Kendras and franchise stores lead sales
Jan Aushadhi Kendras lead while private chains grow faster
Based on operator, the market is categorized into Jan Aushadhi Kendras and private generic chains. Jan Aushadhi Kendras led with 68.0% of 2025 value because the state network is far larger, with sales of Rs 2,252.19 crore in fiscal 2025-26 and 20,547 kendras by July 31, 2026, according to the Jan Aushadhi Varta newsletter of August 2026. Private Generic Chains grow fastest at 13.20% a year as private-label retailers add outlets quickly, since Davaindia opened 264 stores in the April to June 2026 quarter alone, Zota Health Care reported. Medkart in Gujarat and Jaipur-based Dawaa Dost add smaller regional networks.
Franchise outlets dominate as company-owned stores expand
Based on format, the market is categorized into franchise and company-owned stores. Franchise outlets led with 76.0% of 2025 value because almost every Jan Aushadhi Kendra is run by an independent licensee who earns a 20% margin on MRP, Organiser reported in November 2025. These licensees also receive a monthly incentive of 10% of purchases, capped at Rs 10,000, according to a December 2025 Lok Sabha reply. Company-Owned stores grow fastest at 13.27% a year as private chains favor direct control, and Davaindia ran 1,855 company-owned outlets against 970 franchise stores on June 30, 2026, Zota Health Care disclosed.
Urban stores hold most sales as rural kendras multiply
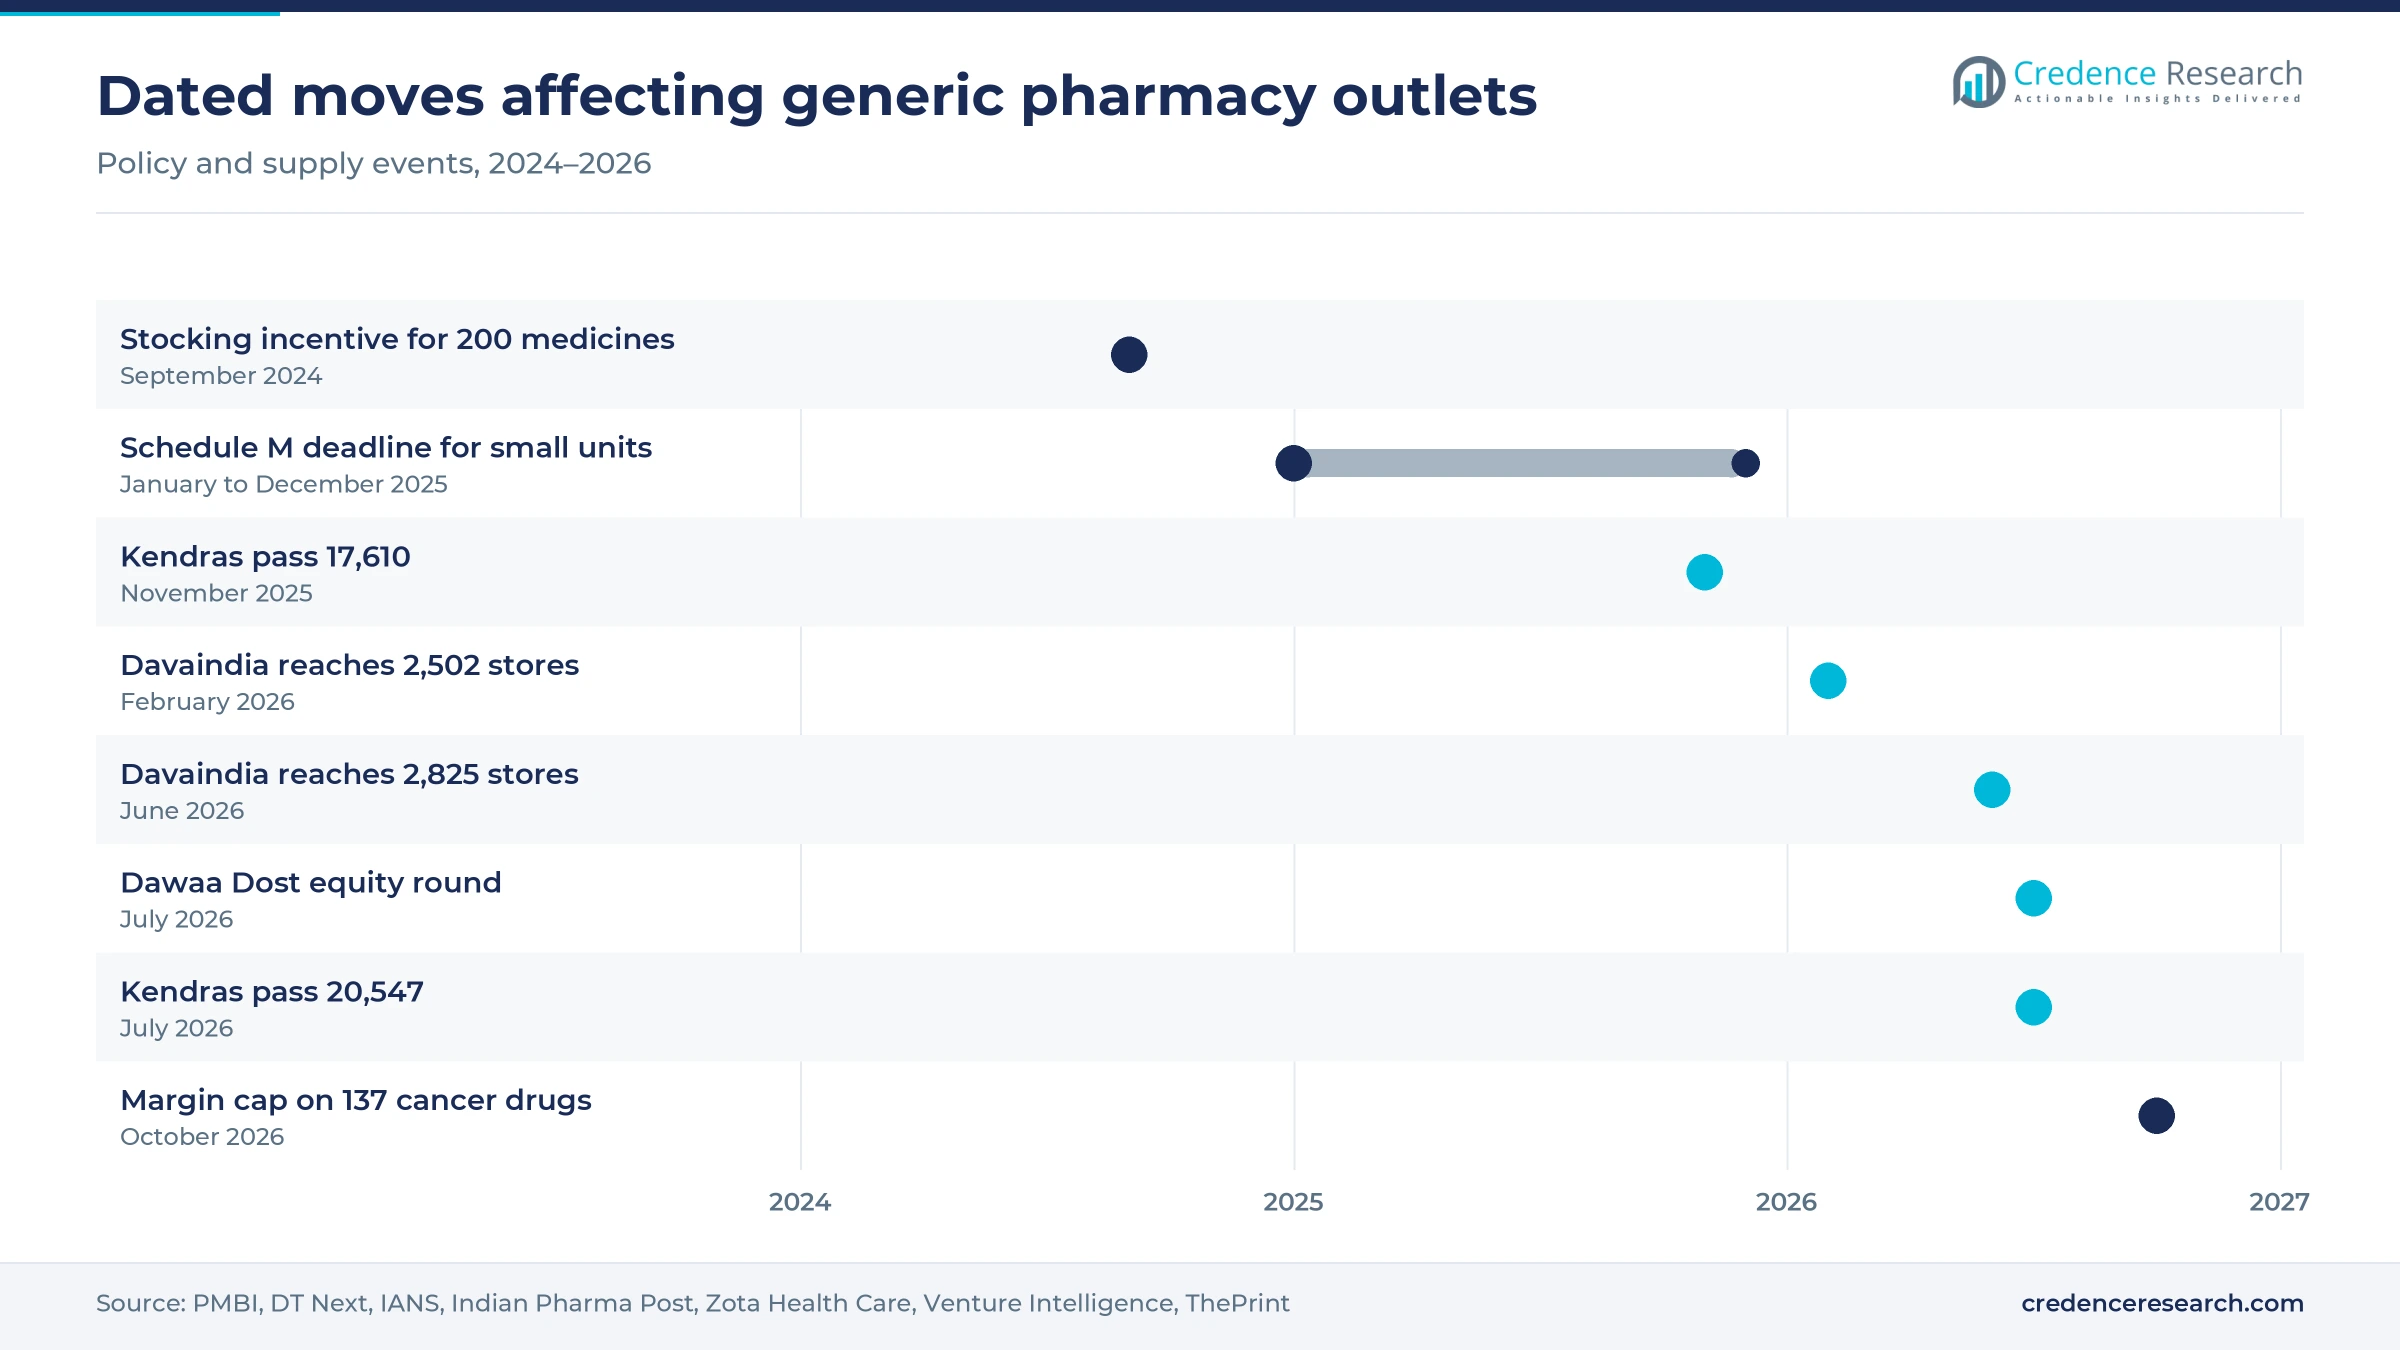
Based on area, the market is categorized into urban and rural outlets. Urban stores led with 71.0% of 2025 value because kendras cluster in dense, prescription-heavy districts and Kerala and Tamil Nadu reach about one kendra per 30,000 people against a national average of one per 45,000, The Hitavada reported in March 2026. Rural outlets grow fastest at 12.91% a year as cooperatives join the network, since primary agricultural credit societies had opened 846 kendras by June 30, 2026, according to the PMBI newsletter. Village societies already handle farm credit and inputs, which gives them local footfall.
| Segment Group | Leading Sub-segment | Share, 2025 | Fastest-growing Sub-segment | CAGR, 2026–2035 |
|---|---|---|---|---|
| By Operator | Jan Aushadhi Kendras | 68.0% | Private Generic Chains | 13.20% |
| By Format | Franchise | 76.0% | Company-Owned | 13.27% |
| By Area | Urban | 71.0% | Rural | 12.91% |
Request a Free Sample
Fill in your details and we'll send you a free sample report.
- Sample data tables & charts
- Research methodology
Price gaps and store rollouts lift generic pharmacy sales
Price-sensitive households shift to low-cost generics
Households that pay for medicines from their own pockets have strong reasons to switch to lower-cost generics, and dedicated outlets capture that switch. Out-of-pocket payments made up 43.9% of current health spending in India in 2023, according to World Bank data. The price gap is wide, because Organiser reported in November 2025 that glimepiride costs about Rs 54 in the open market but Rs 5.16 at a Jan Aushadhi Kendra. A Sage Journals study cited by the Free Press Journal in January 2026 found that households buying generics saved nearly 40% on medication. In the Credence Research model this price sensitivity adds about 4.68 percentage points to annual growth to 2035.
Store rollouts bring cheaper prescriptions closer to patients
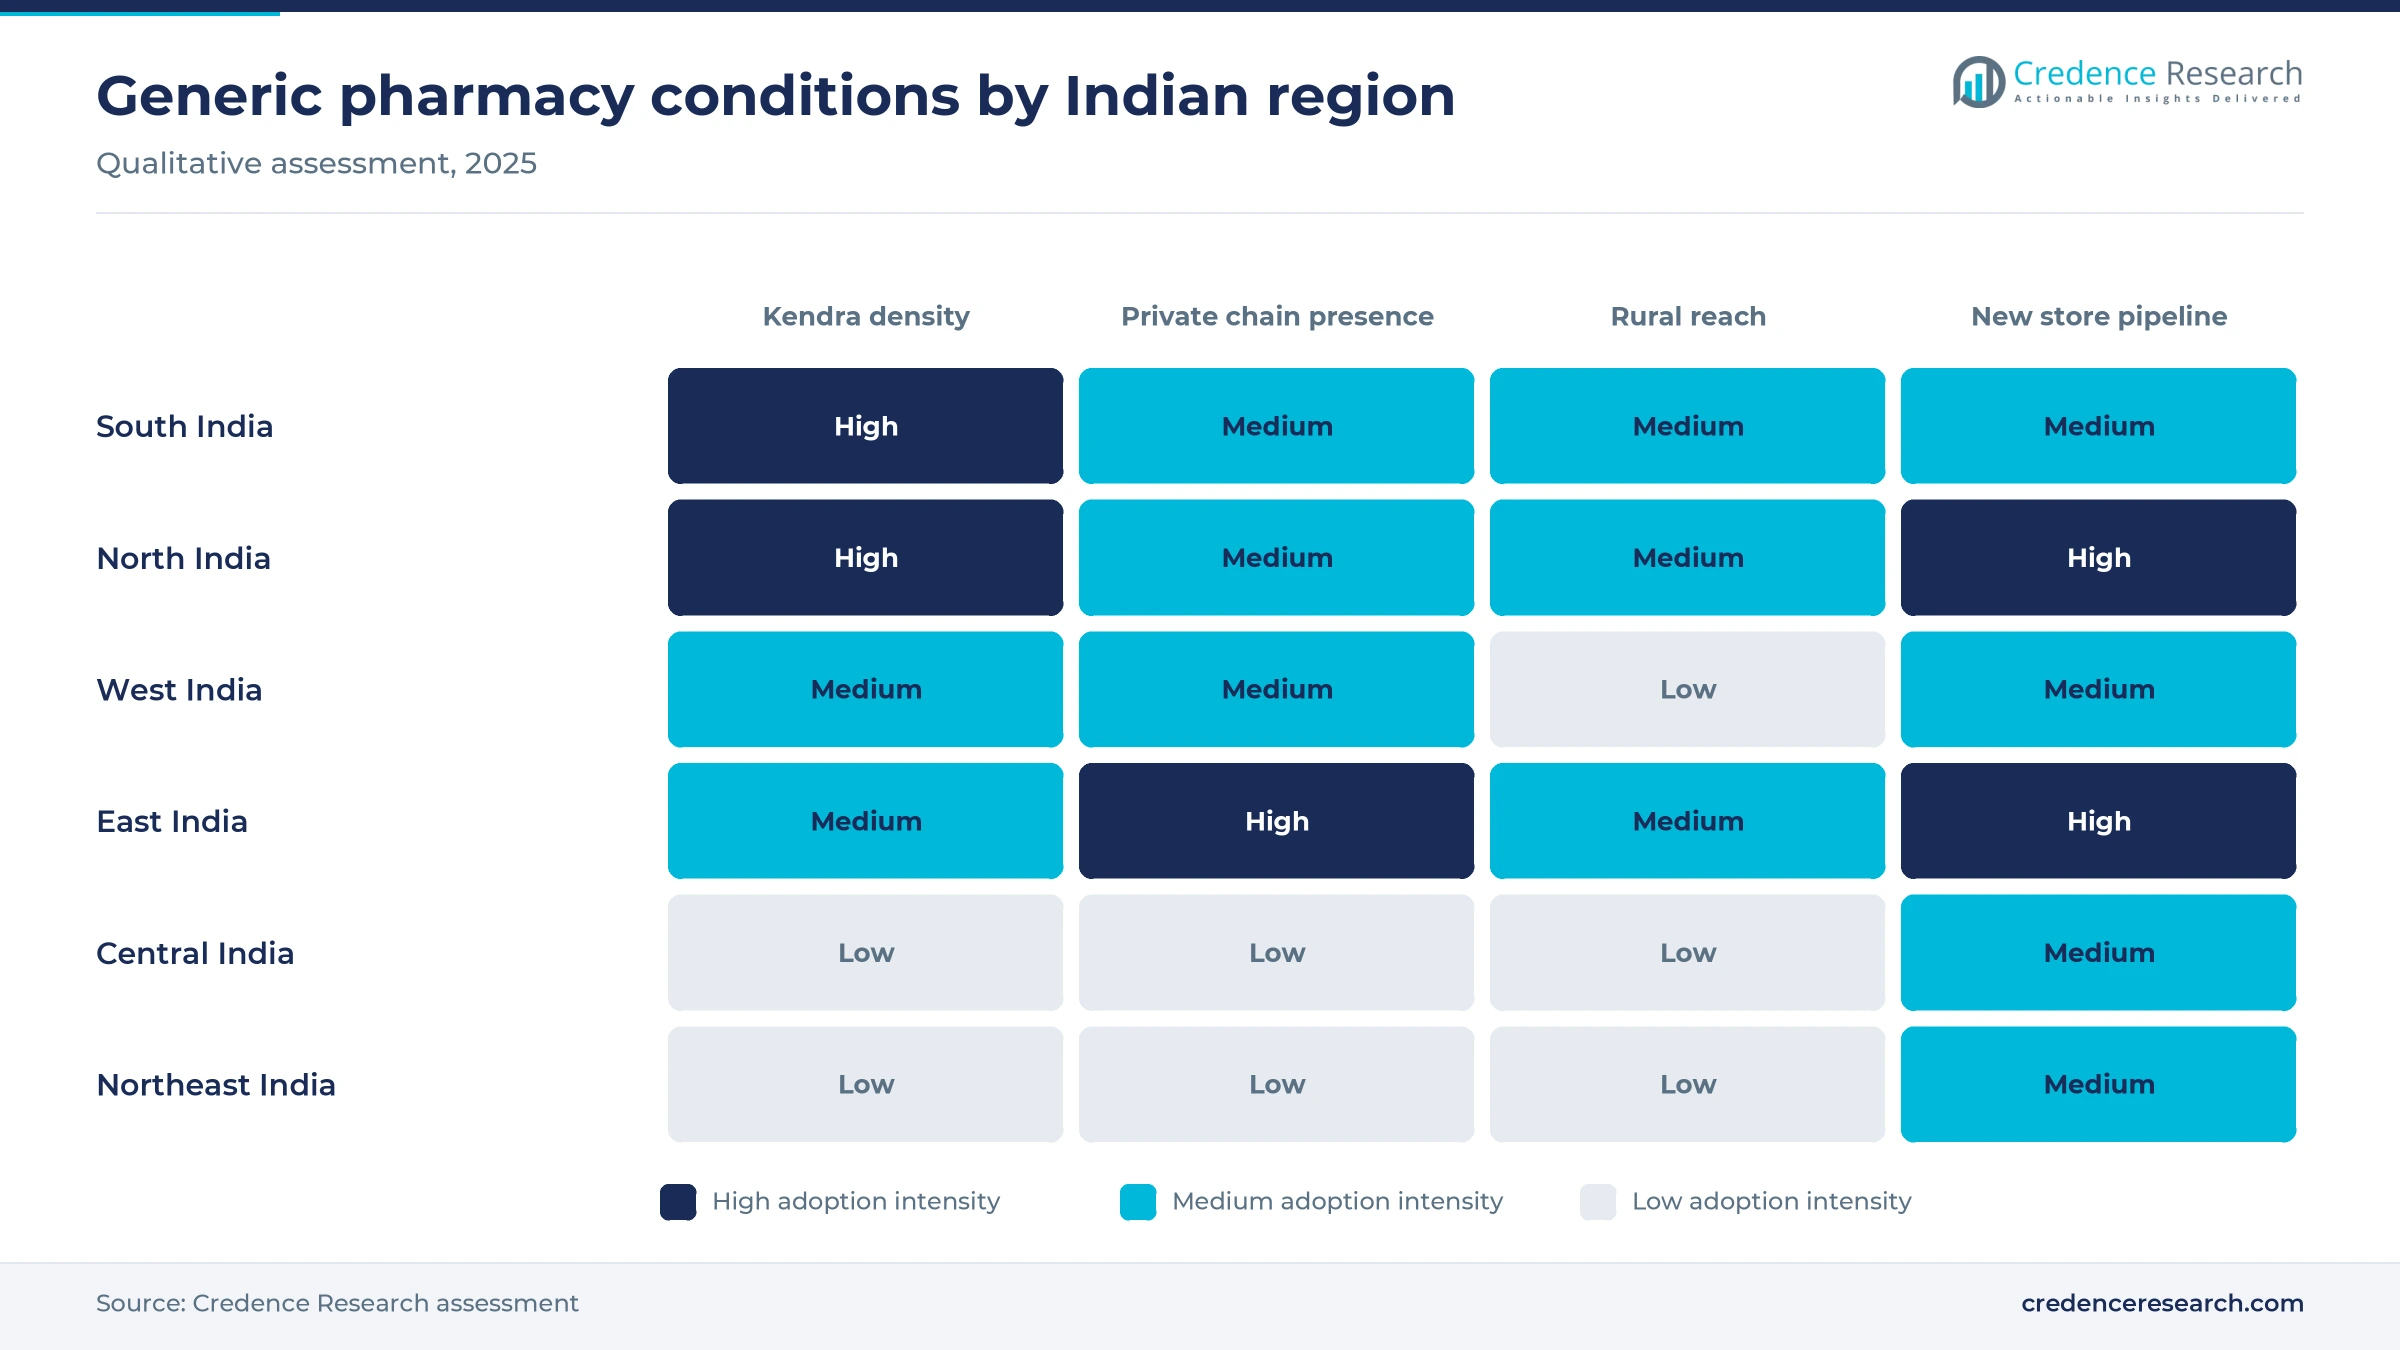
New outlets widen access to cheaper prescriptions, because most patients buy medicines close to their clinic or home. The Jan Aushadhi network grew from about 84 kendras in 2014 to more than 19,200 in 2026, IANS reported in June 2026, and the government has set a target of 25,000 kendras by March 2027. Funding rose with that target, as Rs 284.50 crore was sanctioned for the scheme in 2024-25 against Rs 110 crore in 2023-24, according to a Lok Sabha reply reported by Medical Dialogues in December 2025. Davaindia also lifted its network from 2,502 stores in February 2026 to 2,825 by June 30, 2026. In the Credence Research model these rollouts add about 3.36 percentage points to annual growth to 2035.
Private labels and chronic refills lift repeat revenue
Private labels and long-term therapy refills turn an occasional buyer into a monthly customer, which steadies store revenue. Chronic therapies made up 60% of Davaindia revenue in fiscal 2026, up from 57% a year earlier, and about 80% of its customers were repeat buyers, according to a Zota Health Care investor presentation of August 2026. The same filing shows that its entire range of more than 2,000 products is sold under exclusive private labels. Medkart cites voriconazole at Rs 720 against nearly Rs 5,000 for the branded version, an 86% saving, The Tribune reported in September 2025. In the Credence Research model this repeat demand adds about 2.04 percentage points to annual growth to 2035.
Wider baskets and tested supply build patient trust
A broader product basket and a tested supply chain help kendras fill complete prescriptions, which keeps patients from returning to branded chemists. The Jan Aushadhi range expanded from 1,450 medicines in 2021-22 to 2,110 medicines and 315 surgical products in 2025, Organiser reported. Supplies move through five warehouses and 42 distributors, according to the PMBI newsletter of August 2026. Every batch is tested at NABL-accredited laboratories before it reaches a kendra, and an estimated 15 lakh people visit kendras each day, Kashmir Life reported from a Lok Sabha reply in August 2026. Since September 2024 the bureau has also paid kendras to keep 200 commonly used medicines in stock.
Company-owned stores and rural kendras reshape the market
Shift toward company-owned stores at private chains
Private generic chains are shifting toward company-owned stores, which give them tighter control over stock, pricing and pharmacist conduct. Davaindia ran 1,607 company-owned and 895 franchise stores on Feb. 11, 2026, Indian Pharma Post reported, after adding 755 company-owned outlets and 165 franchise outlets during the fiscal year. By June 30, 2026, the company-owned count had reached 1,855 against 970 franchise stores, according to Zota Health Care. Its newer franchise stores, added since early 2023, all follow a walk-in format, the same filing shows. Company-Owned stores grow at 13.27% a year in the Credence Research model, faster than the franchise base.
Rise of app ordering and home delivery for generics
Generic chains are adding app ordering and home delivery to their stores, which extends each outlet beyond its immediate neighborhood. Medkart reported delivery to more than 35,000 pin codes from over 100 physical stores in September 2025, according to The Tribune. Jaipur-based Dawaa Dost claims to serve about 19,000 pin codes from more than 80 pharmacies and was seeking Rs 200 to 250 crore in new equity in July 2026, Venture Intelligence reported. On the public side, the Jan Aushadhi Sugam app has recorded more than 38 lakh downloads, Organiser reported in November 2025. These channels matter most for chronic patients who reorder the same therapies each month.
Opening for cooperative kendras in rural blocks
Rural blocks offer the clearest opening, because many districts still lack a nearby kendra and cooperatives already run village offices. Chhattisgarh had one kendra for about 89,205 residents in February 2026, compared with one per 30,000 in Kerala and Tamil Nadu, The Hitavada reported. More than 4,250 primary agricultural credit societies held initial approval to open kendras by June 30, 2026, according to the PMBI newsletter. A one-time Rs 2 lakh incentive is also available for kendras in the Northeast, Himalayan and island areas and in aspirational districts, Medical Dialogues reported in December 2025. Rural outlets grow at 12.91% a year in the Credence Research model.
Opening in hospital kendras and oncology refills
Hospital-based outlets and high-cost chronic therapies give operators a second opening, because patients leaving a ward or clinic need prescriptions filled at once. Government hospitals hosted 2,370 of the 18,646 kendras open on Feb. 28, 2026, The Week reported. Price gaps are largest in oncology, where Organiser cited imatinib 400 mg at about Rs 1,952 in the open market against Rs 210 at a kendra. Davaindia lists cardiac, diabetic, thyroid and neuropsychiatric care as its focus areas, according to Zota Health Care, which shows how private chains target the same refill demand. Steady diabetes therapy refills linked to hospital outlets could add reliable monthly volume.
Brand prescribing and quality doubts slow the switch
Brand-name prescribing keeps generic uptake low
Prescribing habits remain the largest barrier, because patients rarely switch when a doctor writes a brand name. Generics hold only about 4% of the Rs 1.4 lakh crore chemist retail business, Prasad Danave of the Retail and Dispensing Chemist Association told the Free Press Journal in January 2026. The National Medical Commission put its 2023 rule requiring generic prescriptions on hold in August 2023, Business Today reported. Chains therefore rely on pharmacist counseling and shelf price labels to win substitution at the counter.
Quality doubts persist after substandard drug alerts
Quality doubts are a persistent risk that deters many buyers, because monthly regulatory alerts keep substandard drugs in the news. The Central Drugs Standard Control Organisation declared 205 drug samples not of standard quality in its November 2025 alert, IANS reported. About 8,500 of the 10,500 drug manufacturing units in India are small firms that had until Dec. 31, 2025, to meet revised Schedule M standards, DT Next reported in January 2025. Generic chains that source from these units must show testing records to keep patient trust.
Thin retail margins strain store economics
Low ticket sizes put pressure on store owners through thin earnings, which makes some outlets hard to sustain outside busy markets. A kendra earns a 20% margin on MRP, Organiser reported in November 2025, on products such as glimepiride that sell for about Rs 5.16. The monthly purchase incentive is capped at Rs 10,000, the December 2025 Lok Sabha reply showed. Private chains face churn too, as Davaindia opened 264 stores but added only 246 net in the June 2026 quarter, Sahi reported.
Margin caps on branded drugs narrow the price gap
Price controls on branded drugs are a pricing risk, because they can narrow the gap that draws shoppers to generic outlets. The National Pharmaceutical Pricing Authority capped trade margins at 30% on 137 non-scheduled anti-cancer formulations in a notification dated Oct. 17, 2026, ThePrint reported, with retail prices expected to fall by up to 70% from Nov. 9, 2026. As branded oncology prices fall, chains must compete more on availability, counseling and refill convenience than on price alone, especially in cancer care.
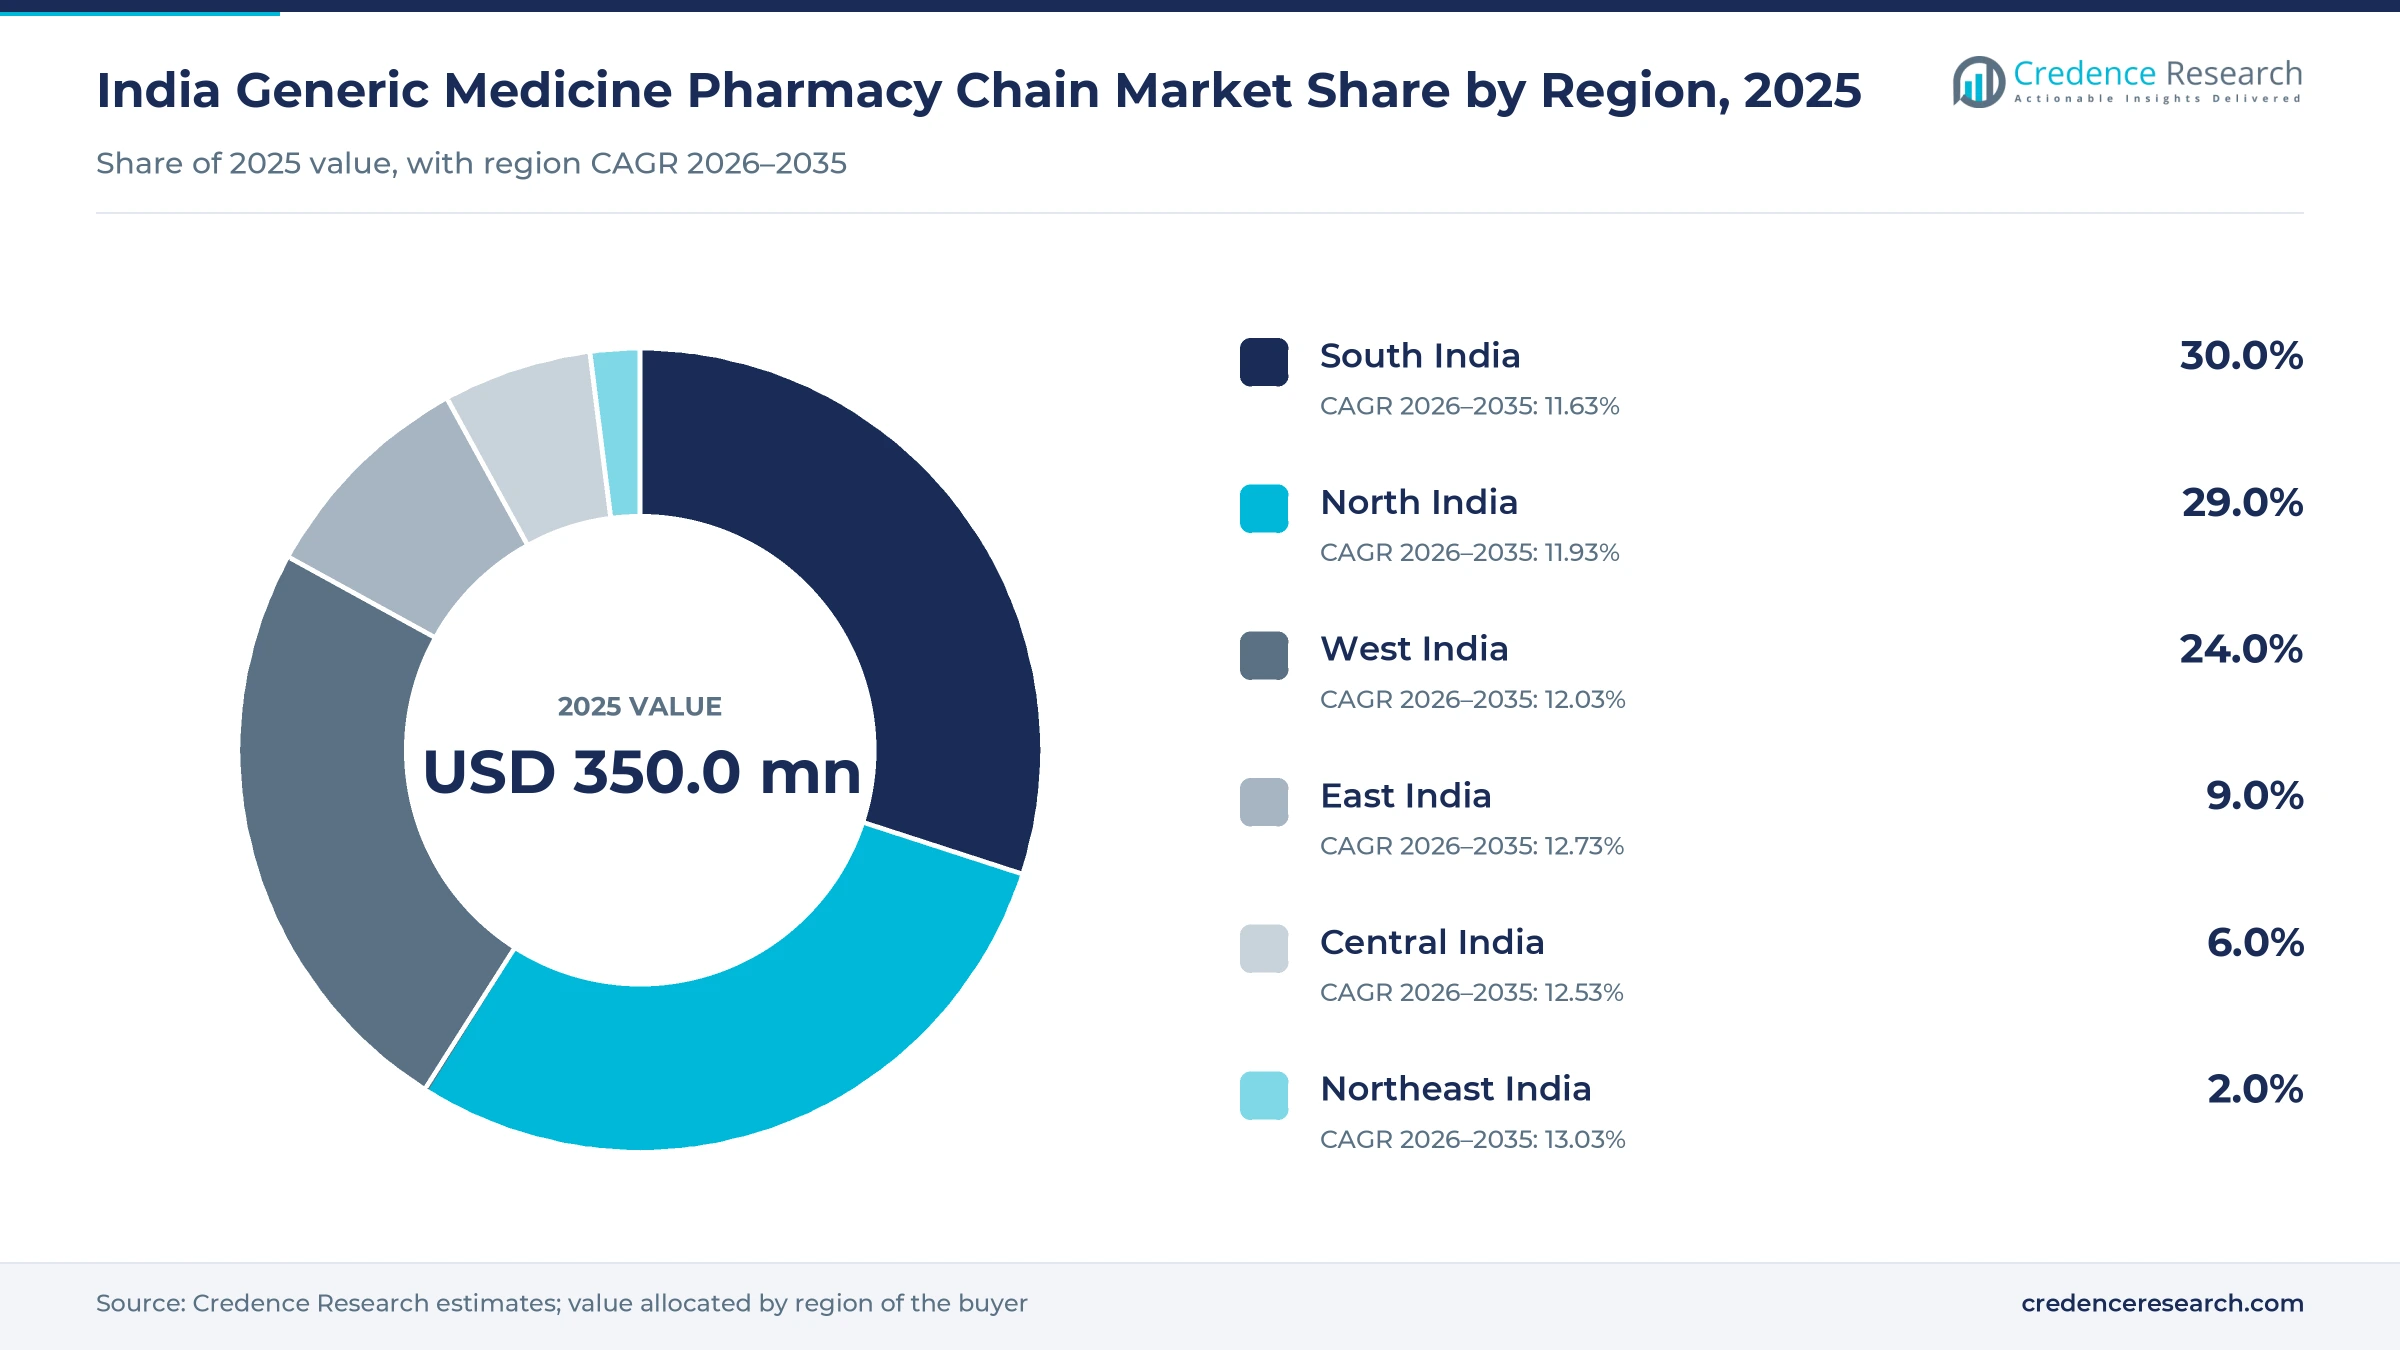
South India leads while the Northeast grows fastest
| Region | Value, 2025 (USD million) | Share, 2025 | CAGR, 2026–2035 |
|---|---|---|---|
| South India | 107.1 | 30.0% | 11.63% |
| North India | 103.6 | 29.0% | 11.93% |
| West India | 85.7 | 24.0% | 12.03% |
| East India | 32.1 | 9.0% | 12.73% |
| Central India | 21.4 | 6.0% | 12.53% |
| Northeast India | 7.1 | 2.0% | 13.03% |
South India has the densest kendra coverage
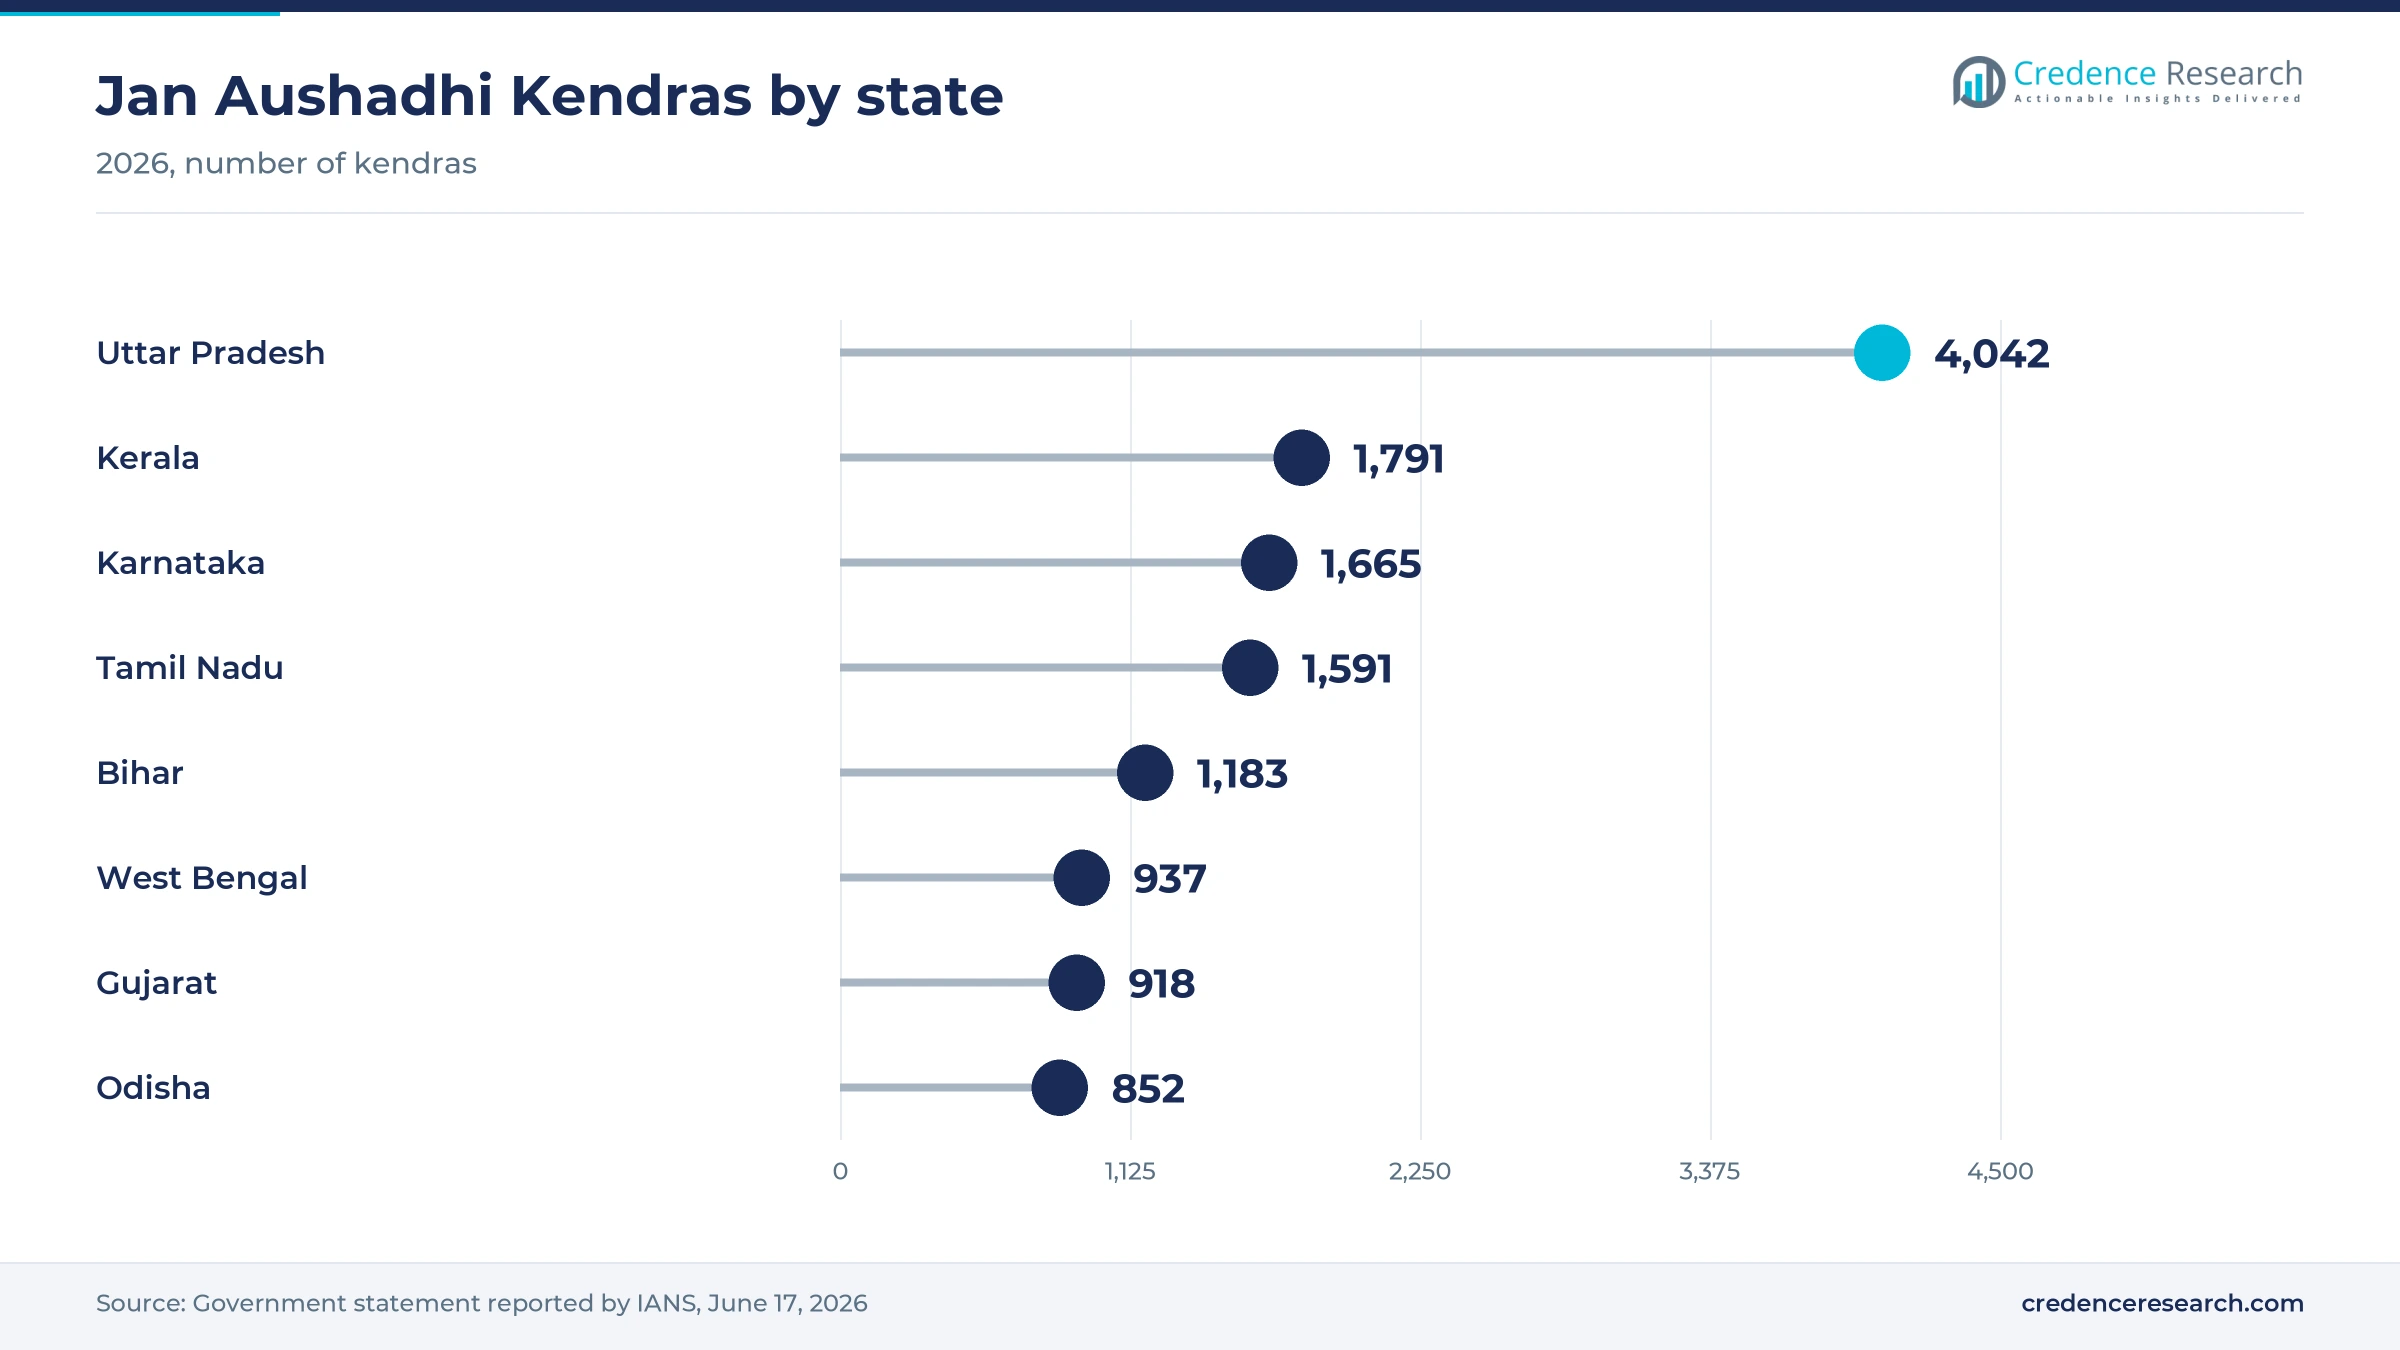
South India held a 30.0% share of 2025 value, the largest of any zone, and grows at 11.63% a year. Kerala had 1,791 kendras, Karnataka 1,665 and Tamil Nadu 1,591 in 2026, IANS reported in June 2026, which gives the zone the densest coverage in the country. National warehouses in Chennai and Bengaluru shorten replenishment cycles, according to Organiser. Generic Aadhaar also built franchise stores across Karnataka, Andhra Pradesh, Kerala and Tamil Nadu, BioSpectrum reported in May 2022. Growth runs slightly below the national rate because the southern base is already mature.
North India rests on Uttar Pradesh and Delhi growth
North India accounted for a 29.0% share of 2025 generic pharmacy sales, with growth of 11.93% a year. Uttar Pradesh alone had 4,042 kendras in 2026, the most of any state, while Delhi rose from four kendras in 2014 to 645 and Punjab from 20 to 556, according to IANS. Jammu and Kashmir recorded Rs 69.37 crore of Jan Aushadhi sales in 2025-26, Kashmir Life reported. Davaindia ran 540 stores in Uttar Pradesh in June 2026, Zota Health Care disclosed, and a national warehouse at Gurugram serves the zone.
West India combines Gujarat chains and Maharashtra stores
West India took a 24.0% share of 2025 sales and expands at 12.03% a year in the regional model. Gujarat had 918 kendras, Maharashtra 741 and Rajasthan 718 in 2026, IANS reported in June 2026. Medkart, founded in Ahmedabad in 2014, runs more than 100 stores from its Gujarat base, The Tribune reported and Jaipur-based Dawaa Dost targets tier-II and tier-III towns. Davaindia ran 243 stores in Maharashtra, according to Zota Health Care, while a national warehouse at Surat supplies kendras across the zone.
East India draws the largest private chain network
East India held a 9.0% share of 2025 value and grows at 12.73% a year, faster than the national pace. Bihar had 1,183 kendras, West Bengal 937 and Odisha 852 in 2026, IANS reported. Private chains are also expanding here, as Davaindia ran 770 stores in West Bengal on June 30, 2026, its largest state network, according to Zota Health Care. Bihar alone had more kendras than any other eastern state, at 1,183 in 2026, according to IANS.
Central India has wide gaps in kendra coverage
Central India contributed a 6.0% share of 2025 sales and grows at 12.53% a year as kendra gaps close. Madhya Pradesh had 597 kendras and Chhattisgarh 339 on Nov. 30, 2025, according to a Lok Sabha reply reported by Medical Dialogues. Chhattisgarh reached 352 kendras by February 2026, or about one for every 89,205 residents, The Hitavada reported. Several districts in the Bilaspur and Surguja divisions have one kendra for more than 1 lakh people, which leaves room for new outlets.
Northeast kendras rise from one outlet to more than 400
Northeast India held a 2.0% share of 2025 value and grows at 13.03% a year, the fastest pace among the six zones. The eight northeastern states had 417 kendras in 2026 against one in 2014, IANS reported. Assam led with 175 kendras on Nov. 30, 2025, followed by Manipur with 66 and Arunachal Pradesh with 35, according to the Lok Sabha reply. A national warehouse in Guwahati and the one-time Rs 2 lakh incentive for northeastern kendras both support new openings.
Network, policy and funding moves from 2024 to 2026
| Development | Status and market relevance |
|---|---|
| In September 2024, the Pharmaceuticals and Medical Devices Bureau of India began paying kendras an incentive to stock 200 commonly used medicines. | In force, paid on top of the 10% purchase incentive |
| In January 2025, the Health Ministry extended the revised Schedule M deadline for small drug makers to Dec. 31, 2025, DT Next reported. | Deadline passed, compliance audits follow |
| In February 2026, Davaindia reached 2,502 operational stores, of which 1,607 were company-owned, Indian Pharma Post reported. | Network reached 2,825 stores by June 30, 2026 |
| In July 2026, Dawaa Dost began seeking Rs 200 to 250 crore in its first institutional equity round, Venture Intelligence reported. | Under way, funds to widen its omnichannel network |
| In October 2026, the National Pharmaceutical Pricing Authority capped trade margins on 137 anti-cancer formulations at 30%, ThePrint reported. | Effective Nov. 9, 2026 |
Apps, batch testing and supply software support stores
- The Jan Aushadhi Sugam app lets patients find the nearest kendra, search products and compare prices with branded equivalents.
- NABL batch testing checks every Jan Aushadhi batch before supply, and suppliers, many of them contract manufacturers, must hold WHO-GMP certification, according to an August 2026 Lok Sabha reply.
- IT-enabled supply chains link five warehouses with 42 distributors, so kendras can reorder the 400 fast-moving products that the bureau monitors.
- Store-level software tracks inventory, sales and patient needs at each Generic Aadhaar outlet in real time, according to an NMIMS profile of January 2026.
Need a Custom Version of This Report?
Tailor the scope, geography, or segments to your exact requirements.
- Custom geography or segment scope
- Direct access to our analyst team
State kendras compete with private-label chains
Competition splits between the state-backed Jan Aushadhi network and private chains that sell their own labels. The Pharmaceuticals and Medical Devices Bureau of India supplies kendras from a central catalog, so independent licensees compete mainly on location, stock depth and service. Davaindia, owned by Zota Health Care, is the largest private network with 2,825 stores in 23 states and five union territories, and it competes through company-owned outlets, national brand ambassadors and an exclusive private-label range. Generic Aadhaar works through franchisees and sources from more than 25 WHO-GMP certified manufacturers, Telangana Today reported. Medkart competes on substitution advice and home delivery from its Gujarat base, while Dawaa Dost uses an affiliate-assisted model in smaller towns. Many of these operators borrow methods from drug store franchises, but they differ by selling few or no branded products. Because no private chain yet rivals the state network, rivals compete on store count, refill programs and pharmacist trust.
Companies profiled and their roles in this market
| Company | Type | Role in the market |
|---|---|---|
| PMBJP Jan Aushadhi Kendras | Government scheme network | More than 20,500 licensed kendras supplied by the bureau from five warehouses |
| Davaindia (Zota Health Care) | Private-label chain | 2,825 stores in 23 states, mostly company-owned, with a chronic-therapy focus |
| Generic Aadhaar | Franchise chain | Franchise stores in about 100 cities, sourcing from more than 25 WHO-GMP makers |
| Medkart | Omnichannel chain | More than 100 stores in Gujarat and delivery to over 35,000 pin codes |
| Dawaa Dost | Omnichannel chain | Jaipur-based network of more than 80 pharmacies aimed at smaller towns |
Chronic refills will decide which chains scale
Credence Research's view is that chronic refills, not store count alone, will decide which generic pharmacy operators scale. Price gaps bring patients through the door, yet repeat demand for diabetes, cardiac and thyroid therapies keeps stores profitable after the first visit. Private Generic Chains grow at 13.20% a year in the model, because their private labels and company-owned formats let them manage stock and counseling closely. The state network will stay the largest operator through 2035, supported by its 25,000-kendra target. Prescribing habits and quality perception remain the two indicators to watch through 2030.
How the generic pharmacy chain model was built
The report uses 2025 as the base year and forecasts to 2035. Market values come from the Credence Research model, checked against Jan Aushadhi sales reported by the bureau and Parliament and against store counts that private chains have made public. Segment and regional splits are Credence Research estimates informed by state kendra counts, cooperative approvals, company filings and press reports. Sources used include Lok Sabha replies, bureau newsletters, World Bank data, company investor presentations and trade press. No interviews or surveys were conducted in preparing this report.
Kendra targets and chain rollouts set growth to 2035
Generic pharmacy chain sales are forecast to reach USD 1.11 billion by 2035 as kendras, cooperative outlets and private-label chains widen access to lower-cost prescriptions. South India should remain the largest region, although East India, Central India and Northeast India gain share as new outlets open where coverage is thin. The March 2027 kendra target and the pace of Davaindia store openings will show whether new outlets can reach steady sales quickly. Cooperative kendras should lift rural reach later in the decade. Prescribing habits and trust in quality will set the pace of switching more than price alone.
Frequently Asked Questions
How big is the India generic medicine pharmacy chain market?
Which region leads the market?
Which operator type is largest?
How many Jan Aushadhi Kendras are open in India?
Which companies operate in this market?
How much cheaper are generic medicines at these stores?
Why are rural outlets growing faster?
What is the largest risk for operators?
Table of Content
Chapter 1 Market Segmentation
- 1.1 Segmentation Framework
- 1.1.1 Product and Service Classification
- 1.1.2 Application and End-Use Classification
- 1.1.3 Technology and Solution Classification
- 1.1.4 Customer and Distribution Channel Classification
- 1.1.5 Geographic Segmentation
- 1.1.6 Market Segment Definitions and Boundaries
- 1.2 By Operator
- 1.2.1 Jan Aushadhi Kendras
- 1.2.2 Private Generic Chains
- 1.3 By Format
- 1.3.1 Franchise
- 1.3.2 Company-Owned
- 1.4 By Area
- 1.4.1 Urban
- 1.4.2 Rural
Chapter 2 Introduction
- 2.1 Report Objectives and Scope
- 2.2 Product Definition and Industry Terminology
- 2.3 Market Inclusions and Exclusions
- 2.4 Research Process
- 2.4.1 Primary Research and Expert Interviews
- 2.4.2 Secondary Research and Source Review
- 2.4.3 Top-Down and Bottom-Up Estimation
- 2.4.4 Data Triangulation and Verification
- 2.5 Market Size Measurement Basis
- 2.5.1 2025: USD 357.1 million → 2035: USD 1.11 billion
- 2.6 Historical and Forecast Reference Periods
- 2.6.1 Historical Period: 2018-2025
- 2.6.2 Base Year: 2025
- 2.6.3 Forecast Period: 2025-2035
- 2.7 Research Assumptions and Limitations
Chapter 3 Executive Summary
- 3.1 Market Snapshot and Key Findings
- 3.2 Base-Year Market Size, 2025
- 3.3 Forecast Market Size, 2035
- 3.4 Revenue and Volume Growth Outlook
- 3.5 Key Demand and Supply Indicators
- 3.6 Leading Market Segments
- 3.7 Fastest-Growing Market Opportunities
- 3.8 Regional Performance Highlights
- 3.9 Technology and Industry Transformation
- 3.10 Competitive Landscape Summary
- 3.11 Analyst View and Strategic Implications
Chapter 4 India Generic Medicine Pharmacy Chain Market Trends and Developments
- 4.1 Historical Industry Development, 2018-2025
- 4.2 Recent Market Trends and Developments
- 4.3 Demand and Customer Behavior Trends
- 4.4 Technology and Product Innovation
- 4.5 Artificial Intelligence, Automation and Digitalization
- 4.6 Local Manufacturing and Supply Chain Realignment
- 4.7 Industry Partnerships, Mergers and Acquisitions
- 4.8 Sustainability and Circular Economy Developments
- 4.9 Government and Private Sector Investment Trends
- 4.10 Emerging Business Models and Commercialization
- 4.11 Industry Developments and Announcements
Chapter 5 India Generic Medicine Pharmacy Chain Market Production, Supply and Demand Analysis
- 5.1 Demand Trend and Consumption Analysis, 2018-2025
- 5.2 Demand Forecast, 2025-2035
- 5.3 Production and Output Trend, 2018-2025
- 5.4 Production and Output Forecast, 2025-2035
- 5.5 Installed Capacity and Capacity Utilization
- 5.6 Company-Wise Production Plants and Statistics
- 5.6.1 Installed Production Capacity
- 5.6.2 Actual Production
- 5.6.3 Planned Capacity and Expansion Targets
- 5.7 Supply Chain Structure and Procurement Trends
- 5.8 Supply-Demand Gap and Bottlenecks
- 5.9 Import Dependence and Sourcing Structure
- 5.10 Contract Manufacturing and Outsourcing
- 5.11 Regional Supply and Demand Concentration
Chapter 6 India Generic Medicine Pharmacy Chain Market Pricing Analysis
- 6.1 Pricing Structure and Measurement
- 6.2 Historical Pricing Trends, 2018-2025
- 6.3 Pricing Outlook, 2025-2035
- 6.4 Average Selling Price and Unit Economics
- 6.5 Pricing by Product and Market Segment
- 6.6 Geographic Pricing Differences
- 6.7 Key Input, Energy, Labor and Logistics Costs
- 6.8 Contract Pricing and Purchasing Models
- 6.9 Pricing Sensitivity and Competitive Positioning
- 6.10 Price, Margin and Profitability Implications
Chapter 7 India Generic Medicine Pharmacy Chain Market Dynamics
- 7.1 Market Growth Drivers
- 7.1.1 Demand-Side Drivers
- 7.1.2 Technology and Innovation Drivers
- 7.1.3 Infrastructure and Investment Drivers
- 7.1.4 Regulatory and Policy Drivers
- 7.2 Market Restraints
- 7.2.1 Cost and Affordability Constraints
- 7.2.2 Technology and Adoption Barriers
- 7.2.3 Supply Chain and Operational Constraints
- 7.3 Market Challenges
- 7.3.1 Competitive Pressure and Margin Erosion
- 7.3.2 Skills, Infrastructure and Implementation Gaps
- 7.4 Emerging Market Opportunities
- 7.5 Market Dynamics Impact and Time-Horizon Assessment
Chapter 8 India Generic Medicine Pharmacy Chain Value Chain Analysis
- 8.1 Industry Value Chain Overview
- 8.2 Upstream Suppliers and Critical Inputs
- 8.3 Technology and Component Providers
- 8.4 Manufacturing or Service Delivery
- 8.5 Distribution, Channel Partners and Integrators
- 8.6 Downstream Applications and End Users
- 8.7 Value Addition and Profit Pools
- 8.8 Vertical Integration and Outsourcing
- 8.9 Supplier Concentration and Risk
- 8.10 Supply Chain Localization and Resilience
Chapter 9 India Generic Medicine Pharmacy Chain Market Regulations and Policies
- 9.1 Relevant Laws, Standards and Compliance Frameworks
- 9.2 Product, Service, Safety and Quality Requirements
- 9.3 Government Policies, Incentives and Subsidies
- 9.4 Imports, Exports and Trade Barriers
- 9.5 Public Procurement and Local Content Requirements
- 9.6 Environmental and Sustainability Compliance
- 9.7 Upcoming Policy Changes and Market Implications
Chapter 10 India Generic Medicine Pharmacy Chain Market Hotspots and Opportunities
- 10.1 Market Opportunity Mapping and Growth Hotspots
- 10.2 High-Growth Applications and Customer Groups
- 10.3 Underserved Markets and White-Space Opportunities
- 10.4 Emerging Technology and Product Opportunities
- 10.5 New Capacity and Investment Hotspots
- 10.6 Market Entry and Expansion Opportunities
- 10.7 Distribution and Partnership Opportunities
- 10.8 Near-Term and Long-Term Commercial Potential
- 10.9 Opportunity Attractiveness and Execution Risks
Chapter 11 India Generic Medicine Pharmacy Chain Market Outlook, 2025-2035
- 11.1 Market Size and Analysis
- 11.1.1 Revenue (Market Measurement: 2025: USD 357.1 million → 2035: USD 1.11 billion)
- 11.1.2 Market Volume and Quantity Sold
- 11.1.3 Historical Market Size, 2018-2025
- 11.1.4 Base-Year Market Size, 2025
- 11.2 Market Forecast, 2025-2035
- 11.2.1 Revenue Forecast to 2035
- 11.2.2 Volume Forecast to 2035
- 11.2.3 CAGR and Year-on-Year Growth
- 11.2.4 Incremental Revenue Opportunity
- 11.3 Forecast Assumptions and Scenario Analysis
- 11.3.1 Base-Case Forecast
- 11.3.2 Optimistic and Conservative Scenarios
- 11.3.3 Technology, Pricing and Policy Sensitivities
- 11.4 Market Attractiveness and Growth Outlook
Chapter 12 India Generic Medicine Pharmacy Chain Market Segmentation and Outlook
- 12.1 Segmentation Summary and Market Shares, 2025
- 12.2 Largest and Fastest-Growing Segments
- 12.3 By Operator - Market Size and Forecast, 2025-2035
- 12.3.1 Segment Definition and Scope
- 12.3.2 Historical Market Size, 2018-2025
- 12.3.3 Revenue Forecast, 2025-2035
- 12.3.4 Volume Forecast, 2025-2035
- 12.3.5 Base-Year Market Share, 2025
- 12.3.6 Segment CAGR and Growth Drivers
- 12.3.7 Subsegment Market Size and Forecast
- 12.3.7.1 Jan Aushadhi Kendras
- 12.3.7.2 Private Generic Chains
- 12.3.8 Subsegment Pricing and Adoption Trends
- 12.3.9 Leading Suppliers and Competition
- 12.3.10 Regional Demand and Opportunities
- 12.4 By Format - Market Size and Forecast, 2025-2035
- 12.4.1 Segment Definition and Scope
- 12.4.2 Historical Market Size, 2018-2025
- 12.4.3 Revenue Forecast, 2025-2035
- 12.4.4 Volume Forecast, 2025-2035
- 12.4.5 Base-Year Market Share, 2025
- 12.4.6 Segment CAGR and Growth Drivers
- 12.4.7 Subsegment Market Size and Forecast
- 12.4.7.1 Franchise
- 12.4.7.2 Company-Owned
- 12.4.8 Subsegment Pricing and Adoption Trends
- 12.4.9 Leading Suppliers and Competition
- 12.4.10 Regional Demand and Opportunities
- 12.5 By Area - Market Size and Forecast, 2025-2035
- 12.5.1 Segment Definition and Scope
- 12.5.2 Historical Market Size, 2018-2025
- 12.5.3 Revenue Forecast, 2025-2035
- 12.5.4 Volume Forecast, 2025-2035
- 12.5.5 Base-Year Market Share, 2025
- 12.5.6 Segment CAGR and Growth Drivers
- 12.5.7 Subsegment Market Size and Forecast
- 12.5.7.1 Urban
- 12.5.7.2 Rural
- 12.5.8 Subsegment Pricing and Adoption Trends
- 12.5.9 Leading Suppliers and Competition
- 12.5.10 Regional Demand and Opportunities
- 12.6 Segment Growth Comparison
- 12.7 Segment Attractiveness and Priority Matrix
Chapter 13 India Generic Medicine Pharmacy Chain Geographic Market Outlook, 2025-2035
- 13.1 Domestic Market Distribution and Demand Clusters
- 13.2 State- or Province-Wise Market Size and Forecast, 2025-2035
- 13.3 City and Metropolitan Market Outlook
- 13.4 Industrial, Manufacturing and Commercial Clusters
- 13.5 Geographic Concentration of Key End Users
- 13.6 Local Pricing and Purchasing Differences
- 13.7 Domestic Production Facilities and Capacity Map
- 13.8 Local Infrastructure and Project Pipeline
- 13.9 State-Level Policy and Incentive Differences
- 13.10 Subnational Investment Hotspots and Opportunities
- 13.11 Distribution and Logistics Networks
- 13.12 Domestic Competitive Footprint
Chapter 14 India Generic Medicine Pharmacy Chain Technology, Innovation and Sustainability Outlook
- 14.1 Technology Landscape and Maturity
- 14.2 Product, Process and Service Innovation
- 14.3 AI, Automation and Digital Tools in the Industry
- 14.4 Technology Adoption and Performance Benchmarking
- 14.5 Innovation Pipeline and R&D Investment
- 14.6 Patent and Intellectual Property Trends
- 14.7 Energy Efficiency and Resource Management
- 14.8 Sustainability, Recycling and Circularity
- 14.9 Technology Roadmap, 2025-2035
- 14.10 Risks of Obsolescence and Technology Substitution
Chapter 15 India Generic Medicine Pharmacy Chain Market Key Strategic Imperatives
- 15.1 Growth and Market Entry Priorities
- 15.2 High-Return Products and Segments
- 15.3 Pricing, Profitability and Cost Optimization
- 15.4 Technology Investment and Product Differentiation
- 15.5 Supply Chain Localization and Resilience
- 15.6 Distribution and Customer Acquisition
- 15.7 Partnership, Acquisition and Capacity Strategy
- 15.8 Regional Expansion Priorities
- 15.9 Short-, Medium- and Long-Term Actions
Chapter 16 Competition Outlook
- 16.1 Industry Competition Characteristics
- 16.2 Market Structure and Concentration
- 16.3 Market Share and Competitive Positioning, 2025
- 16.4 Company-Wise Revenue and Product Benchmarking
- 16.5 Production and Service Capacity Benchmarking
- 16.6 Technology, Pricing and Differentiation
- 16.7 Regional Footprint and Distribution Strength
- 16.8 Mergers, Acquisitions and Strategic Alliances
- 16.9 New Entrants and Competitive Threats
- 16.10 Porter's Five Forces and Industry Attractiveness
- 16.11 Competitive Outlook, 2025-2035
Chapter 17 Company Profiles
- 17.1 Company Coverage and Selection Criteria
- 17.2 PMBJP Jan Aushadhi Kendras
- 17.2.1 Business Description
- 17.2.2 Company Ownership and Geographic Presence
- 17.2.3 Product and Service Portfolio
- 17.2.4 Manufacturing and Operating Footprint
- 17.2.5 Production Capacity and Expansion Plans
- 17.2.6 Financial Performance and Investment
- 17.2.7 Market Share and Competitive Position
- 17.2.8 Technology and Innovation Capabilities
- 17.2.9 Strategic Alliances or Partnerships
- 17.2.10 Recent Developments
- 17.2.11 Growth Strategy and Outlook
- 17.3 Davaindia (Zota Health Care)
- 17.4 Generic Aadhaar
- 17.5 Dawaa Dost
- 17.6 Medkart
- 17.7 Other Relevant Market Participants
Note: Every listed company is profiled on the structure shown under the first company. The company list is preliminary and may change based on research findings, market developments, data availability and client requirements.
Chapter 18 Disclaimer
- 18.1 Research and Forecast Disclaimer
- 18.2 Data Source and Estimation Limitations
Note: The depth of individual sections depends on data availability for this market. Volume, capacity, trade and other unit-based metrics are included where applicable.