What counts as a drugstore and pharmacy counter sale
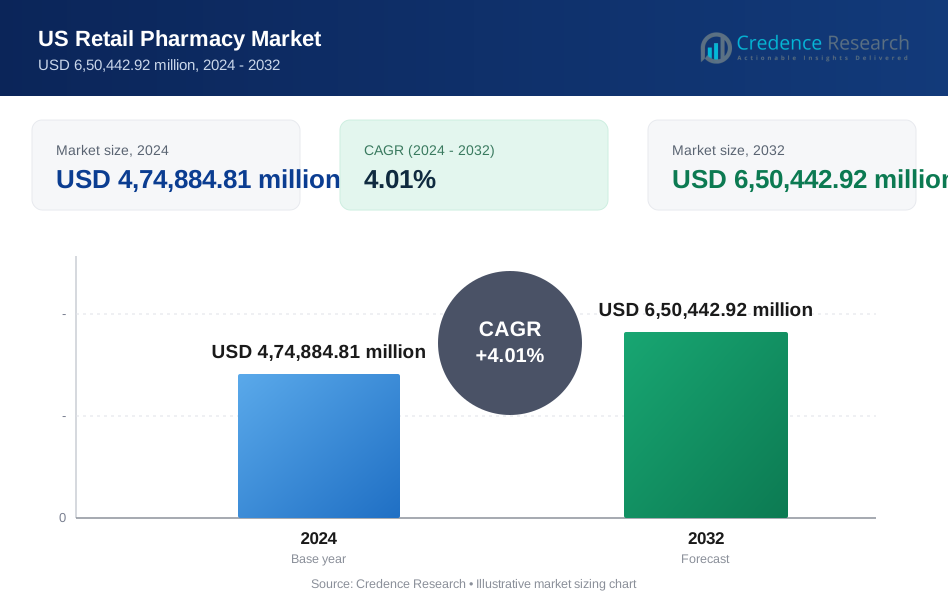
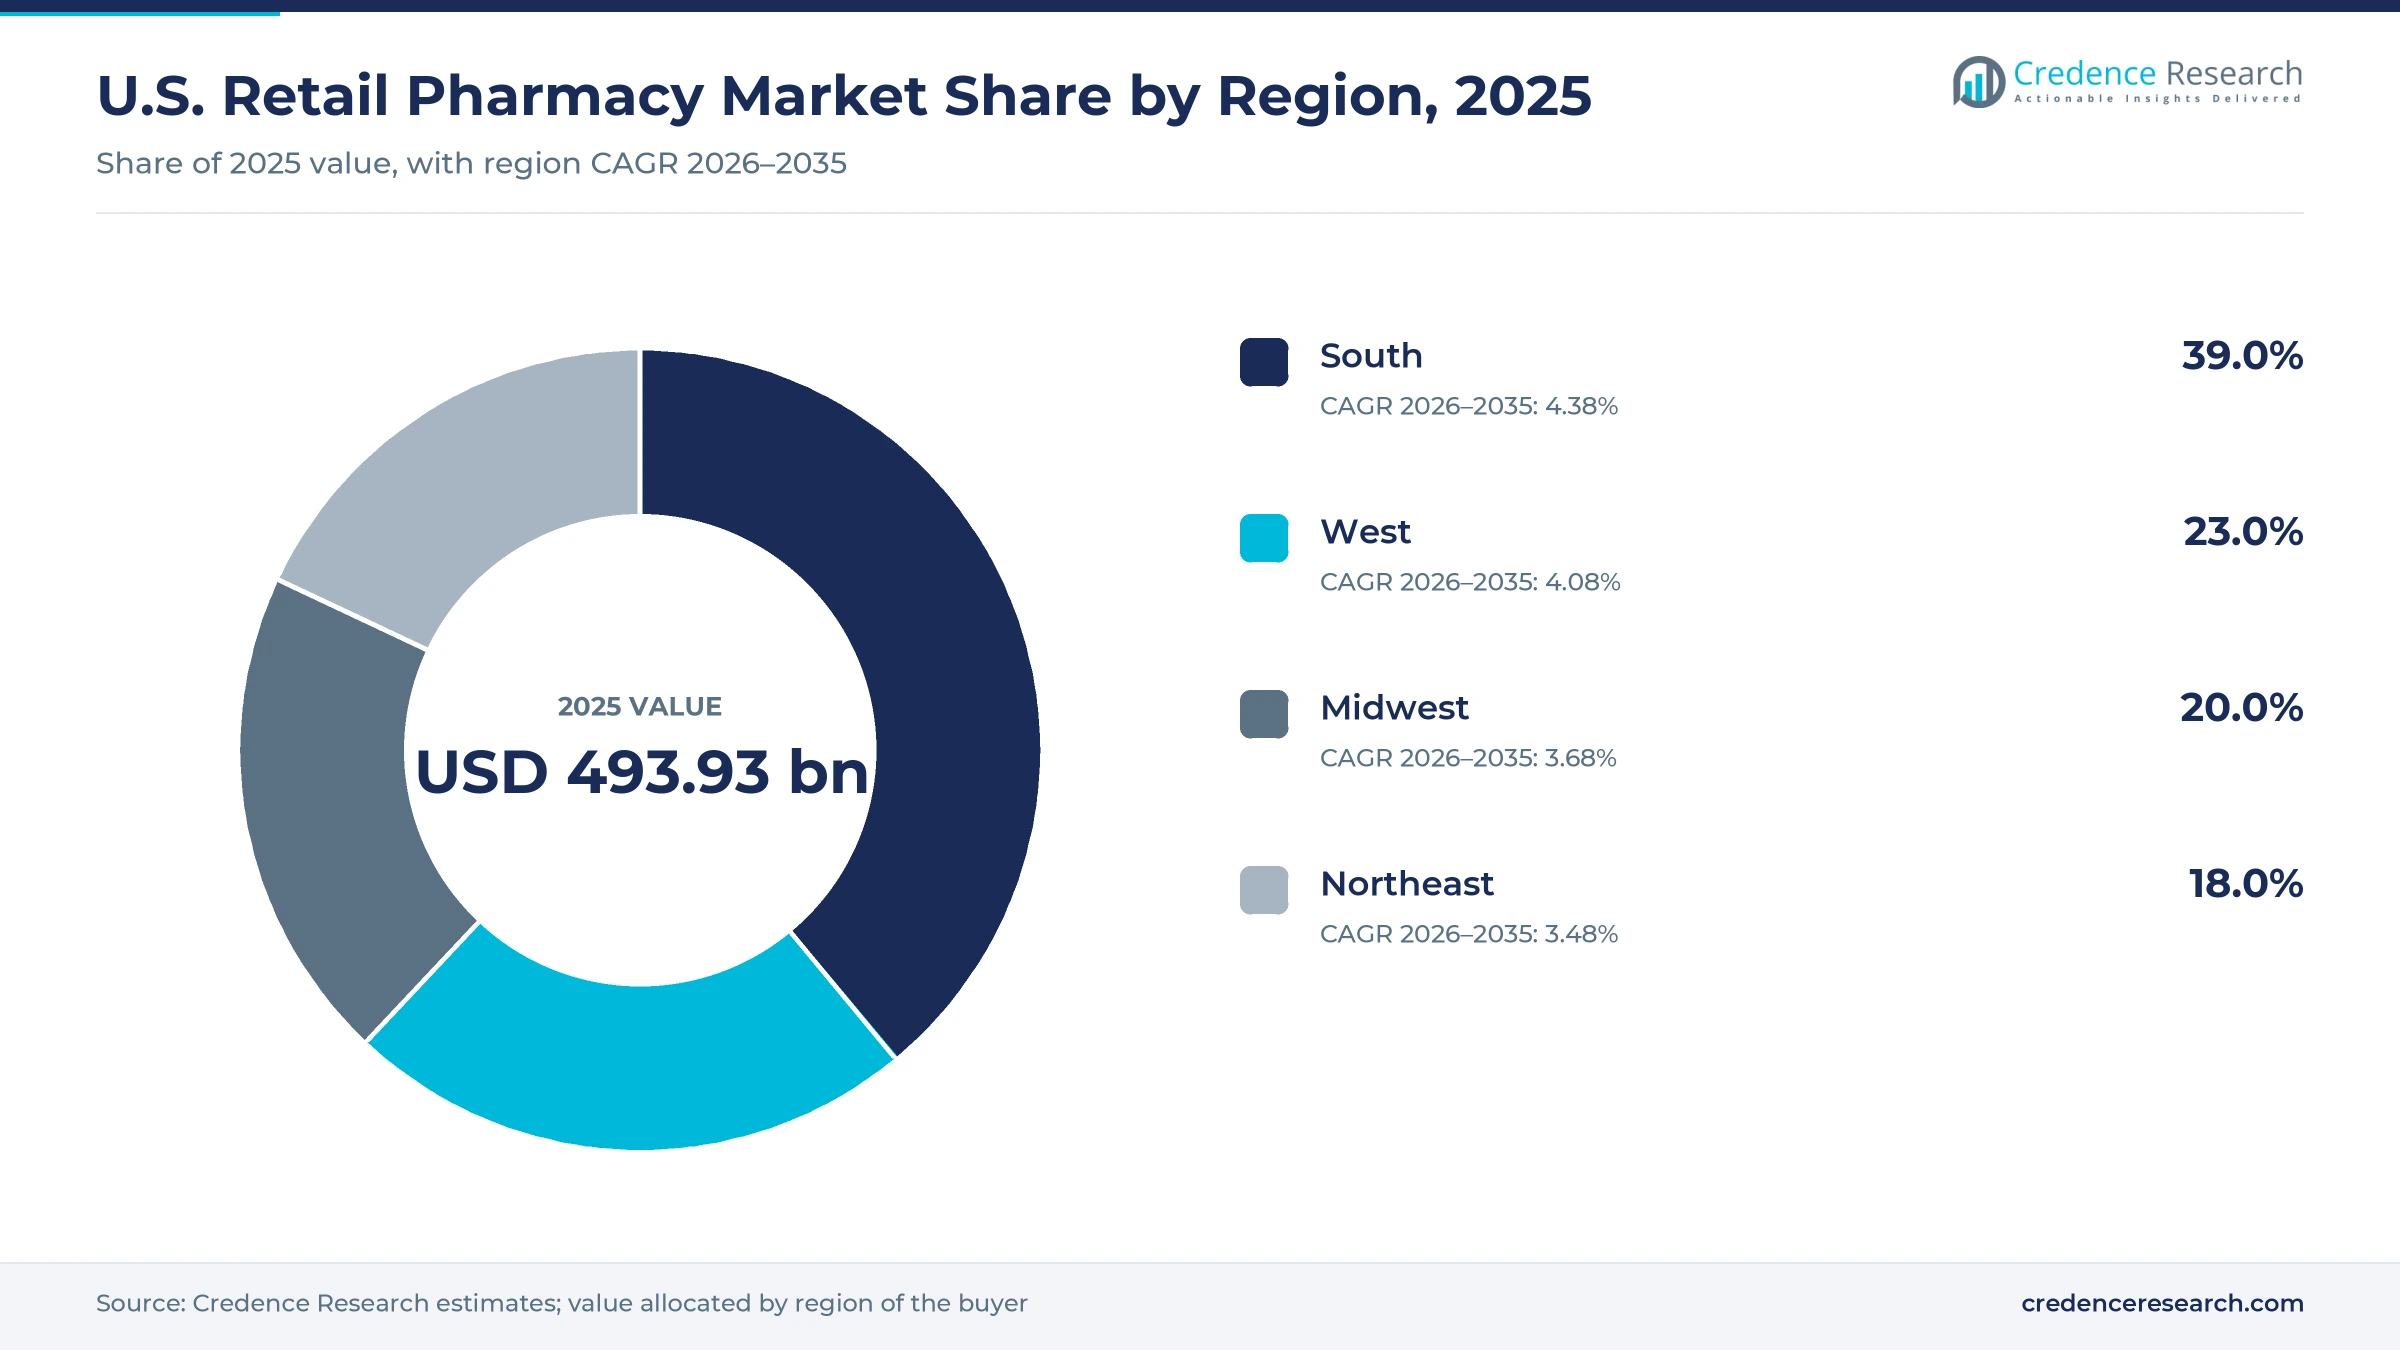
The U.S. retail pharmacy market was valued at USD 493.93 billion in 2025 and is projected to increase from USD 513.73 billion in 2026 to USD 731.84 billion by 2035, registering a CAGR of 4.01% during 2026–2035. Demand comes from an aging patient base, weight-loss and diabetes prescriptions, and vaccines and clinical services delivered at the counter. South held the largest regional share, 39.0% in 2025, and it is also the fastest-growing region at 4.38% a year. The structure of the industry changed sharply after Rite Aid closed its stores and Walgreens moved into private ownership in 2025, which pushed prescription files toward surviving chains and independent owners. Federal pricing has become the main commercial variable, because negotiated Medicare prices took effect in January 2026 while a new law signed in February 2026 changes how benefit managers are paid from 2028.
How big is the U.S. retail pharmacy industry and what does it count?
The market counts sales of prescription and over-the-counter medicines, along with paid clinical services, at chain drugstores, grocer and mass-merchant counters, independent stores, hospital outpatient counters and consumer mail or online orders. Value is measured at the point of sale to patients and payers. The United States has about 51,000 retail locations, a figure derived from the National Community Pharmacists Association count of 18,988 independents representing about 37% of the total.
The estimate excludes central-fill specialty dispensing by benefit manager affiliates, long-term care dispensing and drugs administered in hospitals. Those channels explain why total dispensing revenue across all pharmacy types, which Drug Channels reported as up 10% for 2025, runs well above this market. General merchandise sold in drugstores falls outside the estimate as well, except for health and personal care items sold beside the counter.
US Retail Pharmacy Market Insights
- The market rises from USD 493.93 billion in 2025 to USD 731.84 billion by 2035, a 4.01% CAGR that rests on prescription volume more than on price increases.
- The South led with 39.0% of 2025 value, supported by Florida and Texas, which rank first and third in a March 2026 ScrapeHero dataset of tracked pharmacy locations.
- Chain Pharmacies held 69.0% of 2025 value, while CVS Health alone operated about 9,000 retail locations on Sept. 30, 2026.
- Rite Aid closed all of its stores in 2025, and CVS Health moved prescription files from 626 of those pharmacies in 15 states to nearby stores.
- Amazon Pharmacy plans same-day delivery in nearly 4,500 cities and towns by the end of 2026, adding about 2,000 communities during the year.
Chain counters and branded prescriptions carry the value
Chains hold the counter while online orders grow fastest
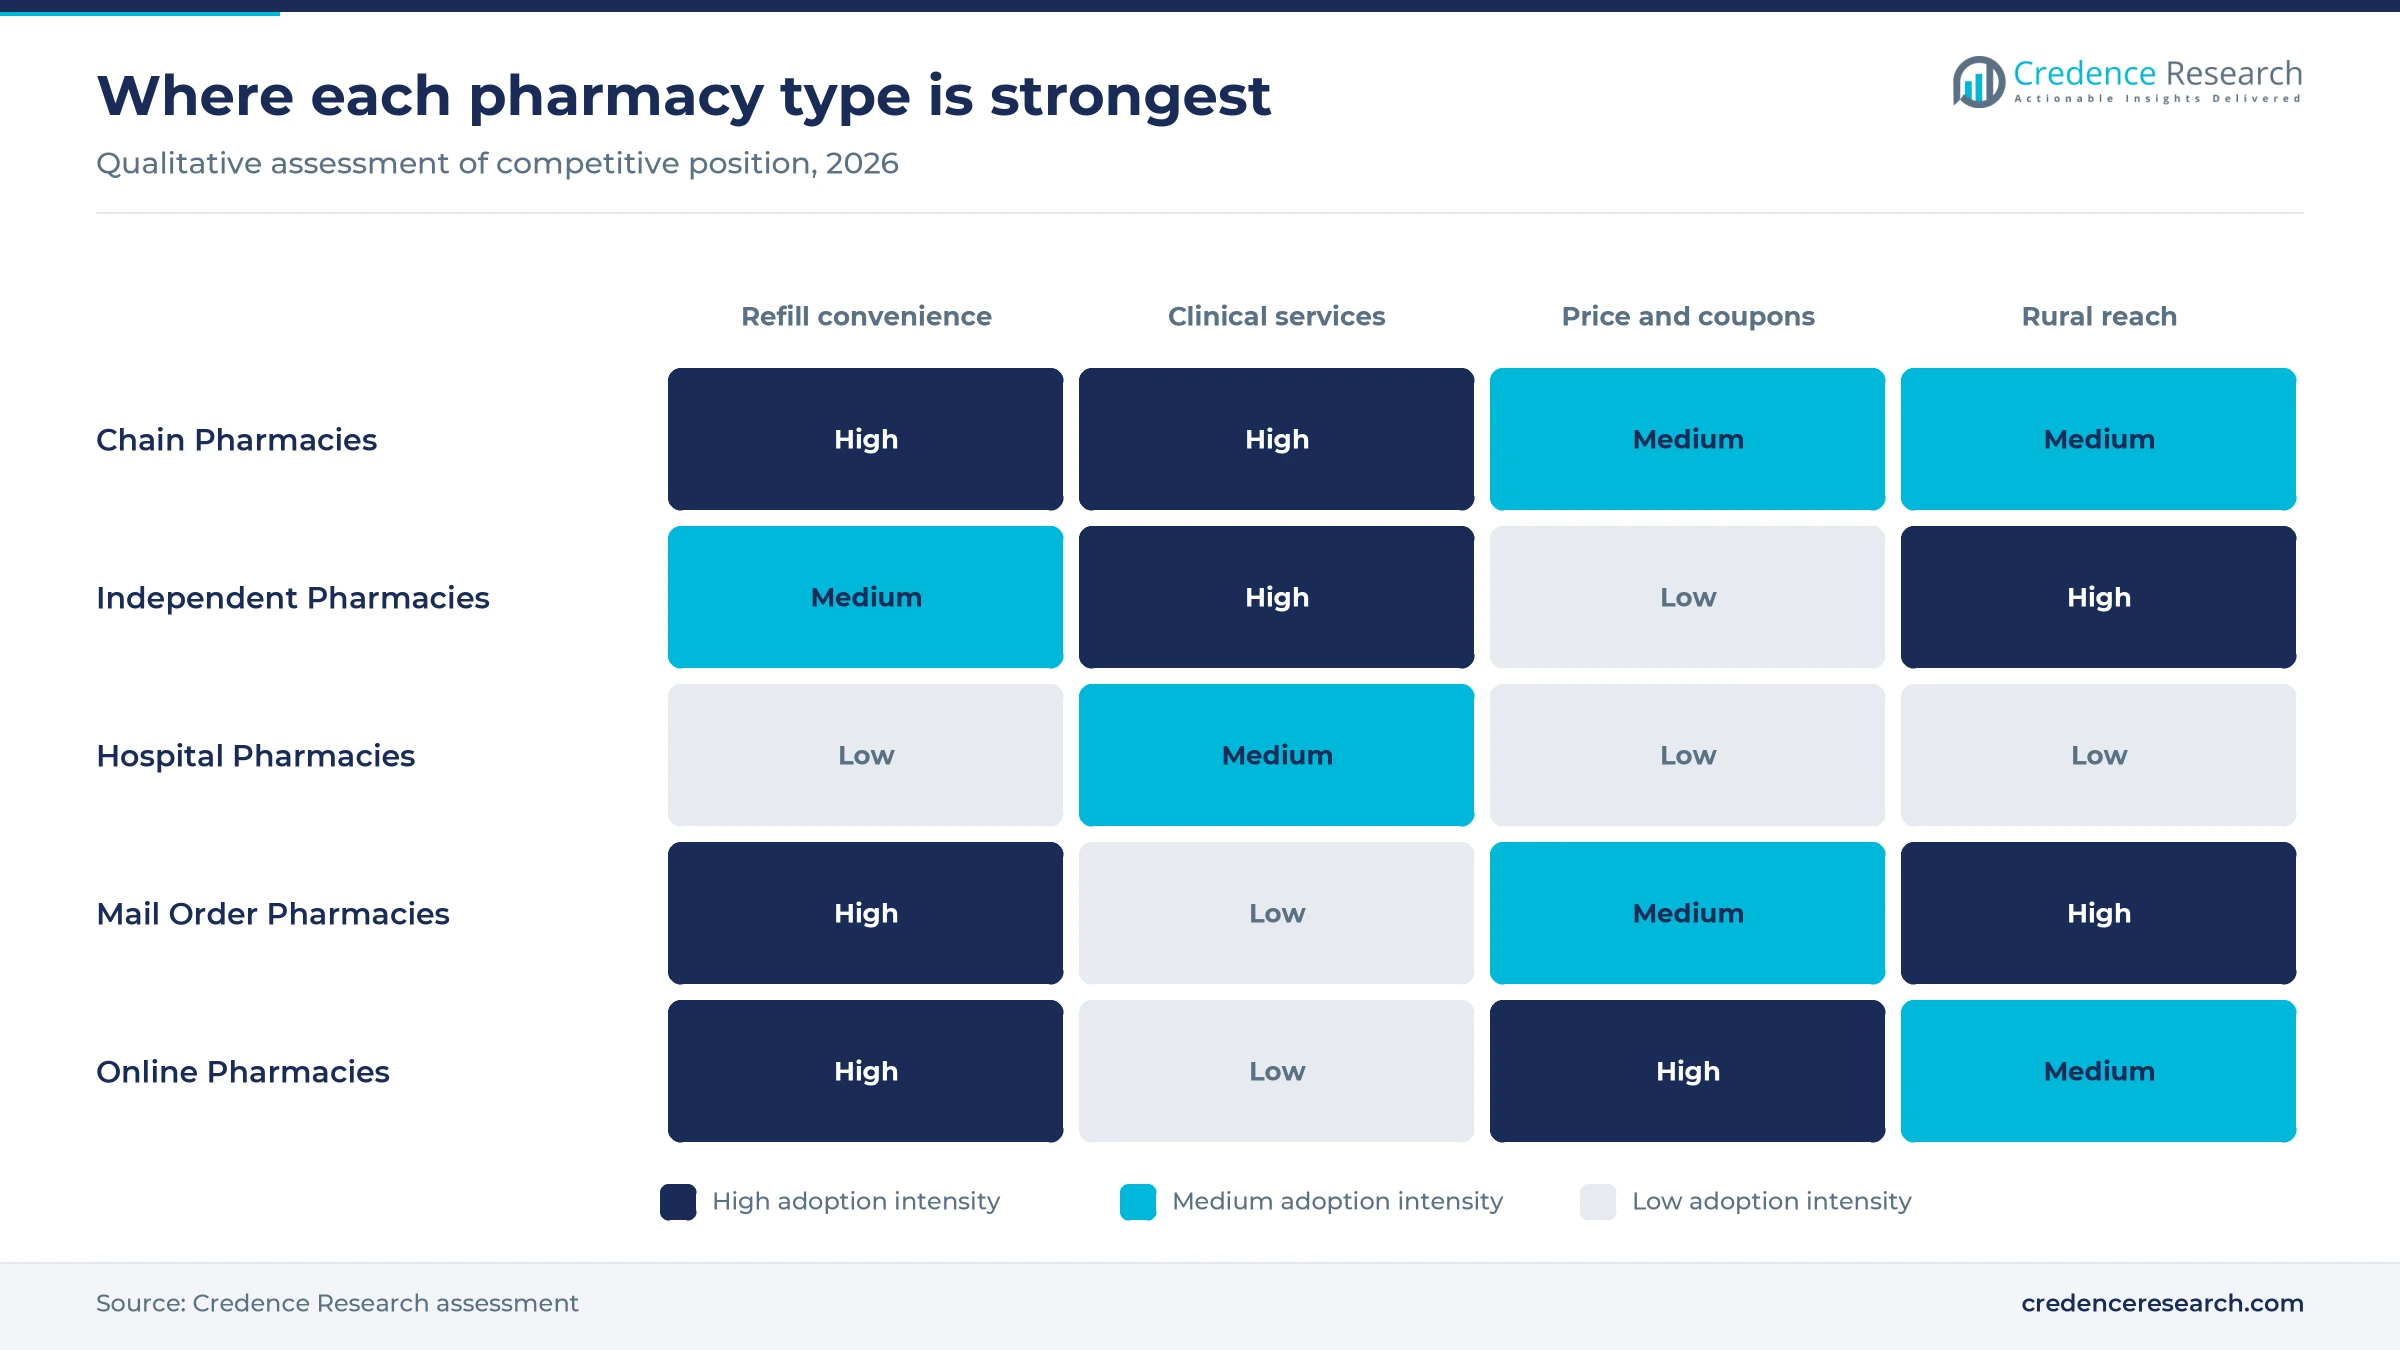
Based on type of pharmacy, the market is categorized into chain, independent, hospital, mail order and online pharmacies. Chain Pharmacies led with 69.0% of 2025 value because CVS Health runs about 9,000 retail locations and Walmart reported nearly 4,600 pharmacies in an April 2026 release. Independents remain significant, with the National Community Pharmacists Association estimating 18,988 stores and USD 103 billion in 2025 sales. Online Pharmacies grow fastest at 9.03% a year as Amazon Pharmacy adds about 2,000 same-day communities during 2026, according to its Feb. 11, 2026 release.
Prescriptions dominate as cough and cold units slip
Based on type of prescription, the market is categorized into prescription drugs and over-the-counter drugs. Prescription Drugs (Rx) led with 90.0% of 2025 value because the National Community Pharmacists Association reports that over 96% of independent sales come from prescriptions. The same group also grows fastest at 4.12% a year, as the Medicare GLP-1 Bridge opened weight-loss coverage to eligible enrollees on July 1, 2026, according to the Medicare Rights Center. Nonprescription medicines move more slowly because Consumer Healthcare Products Association data show units falling from 6,197 million in 2020 to 5,668 million in 2023.
Branded drugs hold the value while generics fill the volume
Based on product type, the market is categorized into branded drugs and generic drugs. Branded Drugs led with 78.0% of 2025 value because generics and biosimilars filled 90% of 2024 prescriptions yet took only 12% of drug spending, according to the Association for Accessible Medicines in September 2025. Generic Drugs grow fastest at 4.71% a year as new launches reach the counter, and CVS Health named generic introductions among its revenue pressures in its third-quarter 2026 filing. Biosimilars add to that shift, having saved USD 56.2 billion since 2015 on the same association figures.
Dispensing pays the bills as chronic care services expand
Based on service offered, the market is categorized into medication dispensing, vaccination services, consultation and counseling, chronic disease management and health screenings. Medication Dispensing led with 88.0% of 2025 value because CMS counted USD 467.0 billion in 2024 national prescription spending, which dwarfs paid clinical work. Chronic Disease Management grows fastest at 6.45% a year as owners broaden their clinical work, and the 2026 National Community Pharmacists Association Digest shows 81% offering medication therapy management and 62% monitoring blood pressure. Vaccination remains the best-established service, with 91% of independents offering flu shots.
| Segment Group | Leading Sub-segment | Share, 2025 | Fastest-growing Sub-segment | CAGR, 2026–2035 |
|---|---|---|---|---|
| By Type of Pharmacy | Chain Pharmacies | 69.0% | Online Pharmacies | 9.03% |
| By Type of Prescription | Prescription Drugs (Rx) | 90.0% | Prescription Drugs (Rx) | 4.12% |
| By Product Type | Branded Drugs | 78.0% | Generic Drugs | 4.71% |
| By Service Offered | Medication Dispensing | 88.0% | Chronic Disease Management | 6.45% |
Request a Free Sample
Fill in your details and we'll send you a free sample report.
- Sample data tables & charts
- Research methodology
Older patients and GLP-1 volume lift prescription counts
An older population fills more prescriptions each year
Aging is the steadiest source of counter volume, because older patients take more maintenance medicines and visit more often. The Census Bureau reported in June 2025 that the population aged 65 and older rose 3.1% to 61.2 million in 2024, reaching 18.0% of residents. Older adults already outnumber children in 11 states, including Florida and Pennsylvania. CMS data point the same way, since Medicare drug spending grew at its fastest pace in more than a decade in 2024, according to Drug Channels in February 2026. As a result, public programs now pay 51.2% of net outpatient drug spending, which ties store revenue closely to Medicare enrollment.
GLP-1 prescriptions add value at a historic pace
Diabetes and weight-loss medicines have become the largest single source of new counter revenue. Drug Channels estimated in March 2026 that GLP-1 dispensing accounted for about 60% of retail revenue growth over the past five years. CMS reported that demand for these drugs partly offset slower growth in 2024, when prescription spending rose 7.9% to USD 467.0 billion. Federal coverage is now widening the patient pool, because the Medicare GLP-1 Bridge began on July 1, 2026 with a USD 50 monthly copay and runs through Dec. 31, 2027. In turn, Walgreens pharmacists are explaining eligibility and connecting patients with prescribers, according to Fierce Healthcare.
Pharmacists are taking on vaccines and point-of-care tests
Clinical work brings patients to the counter and adds fees that do not depend on drug reimbursement. A CDC report dated Jan. 23, 2026, cited by Pharmacy Times, found pharmacies and drugstores were the most common nonmedical vaccination setting in 2023-2024, at 71.5% for COVID-19, 81.7% for RSV and 48.0% for influenza. State rules are widening this role, since North Carolina standing orders let retail pharmacists test and treat flu in patients aged 5 and older from Oct. 1, 2025. Independent owners have moved too, with 91% offering flu immunization in 2025 under the NCPA 2026 Digest. Therefore, Chronic Disease Management grows fastest within the services group.
Closed Rite Aid stores send prescriptions to survivors
Consolidation is moving existing patients rather than removing them, which lifts volume per surviving store. The Associated Press reported in October 2025 that CVS Health transferred files from 626 Rite Aid pharmacies in 15 states and kept running 63 former locations. That volume shows up in filings, because the CVS Health third-quarter 2026 filing reports same-store prescription volume up 5.8% over nine months on a 30-day equivalent basis. Drug Channels counts more than 6,000 locations bought by CVS Pharmacy and Walgreens from smaller rivals between 2010 and 2025. As a result, Chain Pharmacies kept 69.0% of 2025 value despite shrinking store networks.
Same-day delivery and smaller stores redraw access
Shift to same-day prescription delivery across the country
Delivery has moved from a mail-order convenience to a direct contest for the routine refill. Amazon Pharmacy said on Feb. 11, 2026 that same-day service will reach nearly 4,500 cities and towns by the end of the year, including new service in Idaho and Massachusetts. Walmart answered in September 2025 by adding refrigerated and reconstituted medicines such as insulin and GLP-1 drugs, and it says it now delivers more than 90% of prescription medications. This competition supports demand for prescription delivery services beyond chain stores. In turn, Online Pharmacies post the fastest type growth, 9.03% a year, though stores still handle most refills today.
Rise of small pharmacy-only stores after years of closures
Chains are rethinking the large front-of-store box after a long period of shrinkage. Bisnow reported on March 31, 2026 that CVS Health closed more than 1,100 stores from 2022 through 2025 but now plans about 60 openings in 2026, including 20 pharmacy-only stores of around 3,000 square feet. The first of these opened in Chicago on March 30, 2026. Weak front-end sales help explain the change, since Consumer Healthcare Products Association figures show unit declines across three years to 2023. As a result, future counters will rely less on general merchandise and more on prescriptions, which already hold 90.0% of 2025 value in the Credence Research model.
Opportunity in cash-pay GLP-1 and direct price programs
Cash-pay programs offer an opening for pharmacies that can serve patients without insurance coverage for weight-loss medicines. TrumpRx launched on Feb. 5, 2026 with more than 40 discounted drugs, and Pharmaceutical Technology reported a Wegovy pill price of USD 149 a month and pharmacy coupons for the Wegovy pen. Walmart moved on the same demand in April 2026 by adding virtual care, nutrition and pharmacist support around GLP-1 treatment across nearly 4,600 pharmacies. Amazon Pharmacy also lists the Wegovy pill from USD 149 for cash payers. Consequently, counters that pair coupons with counseling can win refills, and this supports Chronic Disease Management growth of 6.45% a year.
Opportunity for independents as chains leave neighborhoods
Chain exits leave patients looking for a nearby counter, which gives independent owners a practical opening. The National Community Pharmacists Association estimates independents edged up from 18,960 stores in 2025 to 18,988 in 2026, even as Rite Aid disappeared. Federal law now strengthens their position, because Pharmacy Times reports that the act signed on Feb. 3, 2026 requires Part D sponsors to admit any willing pharmacy from 2029 and creates protections for essential retail pharmacies in underserved areas. Branded franchise programs give small owners scale as well, with ScrapeHero counting about 4,275 Health Mart and 2,352 Good Neighbor Pharmacy locations in March 2026. Independent owners can therefore defend a local patient base ahead of the 2029 network rule.
Negotiated prices and reimbursement squeeze store margins
Negotiated Medicare prices strain pharmacy cash flow
Maximum fair prices took effect in January 2026, and refunds now arrive well after pharmacies pay wholesalers. A National Community Pharmacists Association survey of more than 500 owners, released Feb. 27, 2026, found 67% wait 22 or more days for refunds, while wholesalers often expect payment in about 14 days. In addition, 64% were considering refusing to stock these drugs. Another 15 drugs join the program in January 2027, so owners need faster refund rules.
Volume grows while same-store sales and prices fall
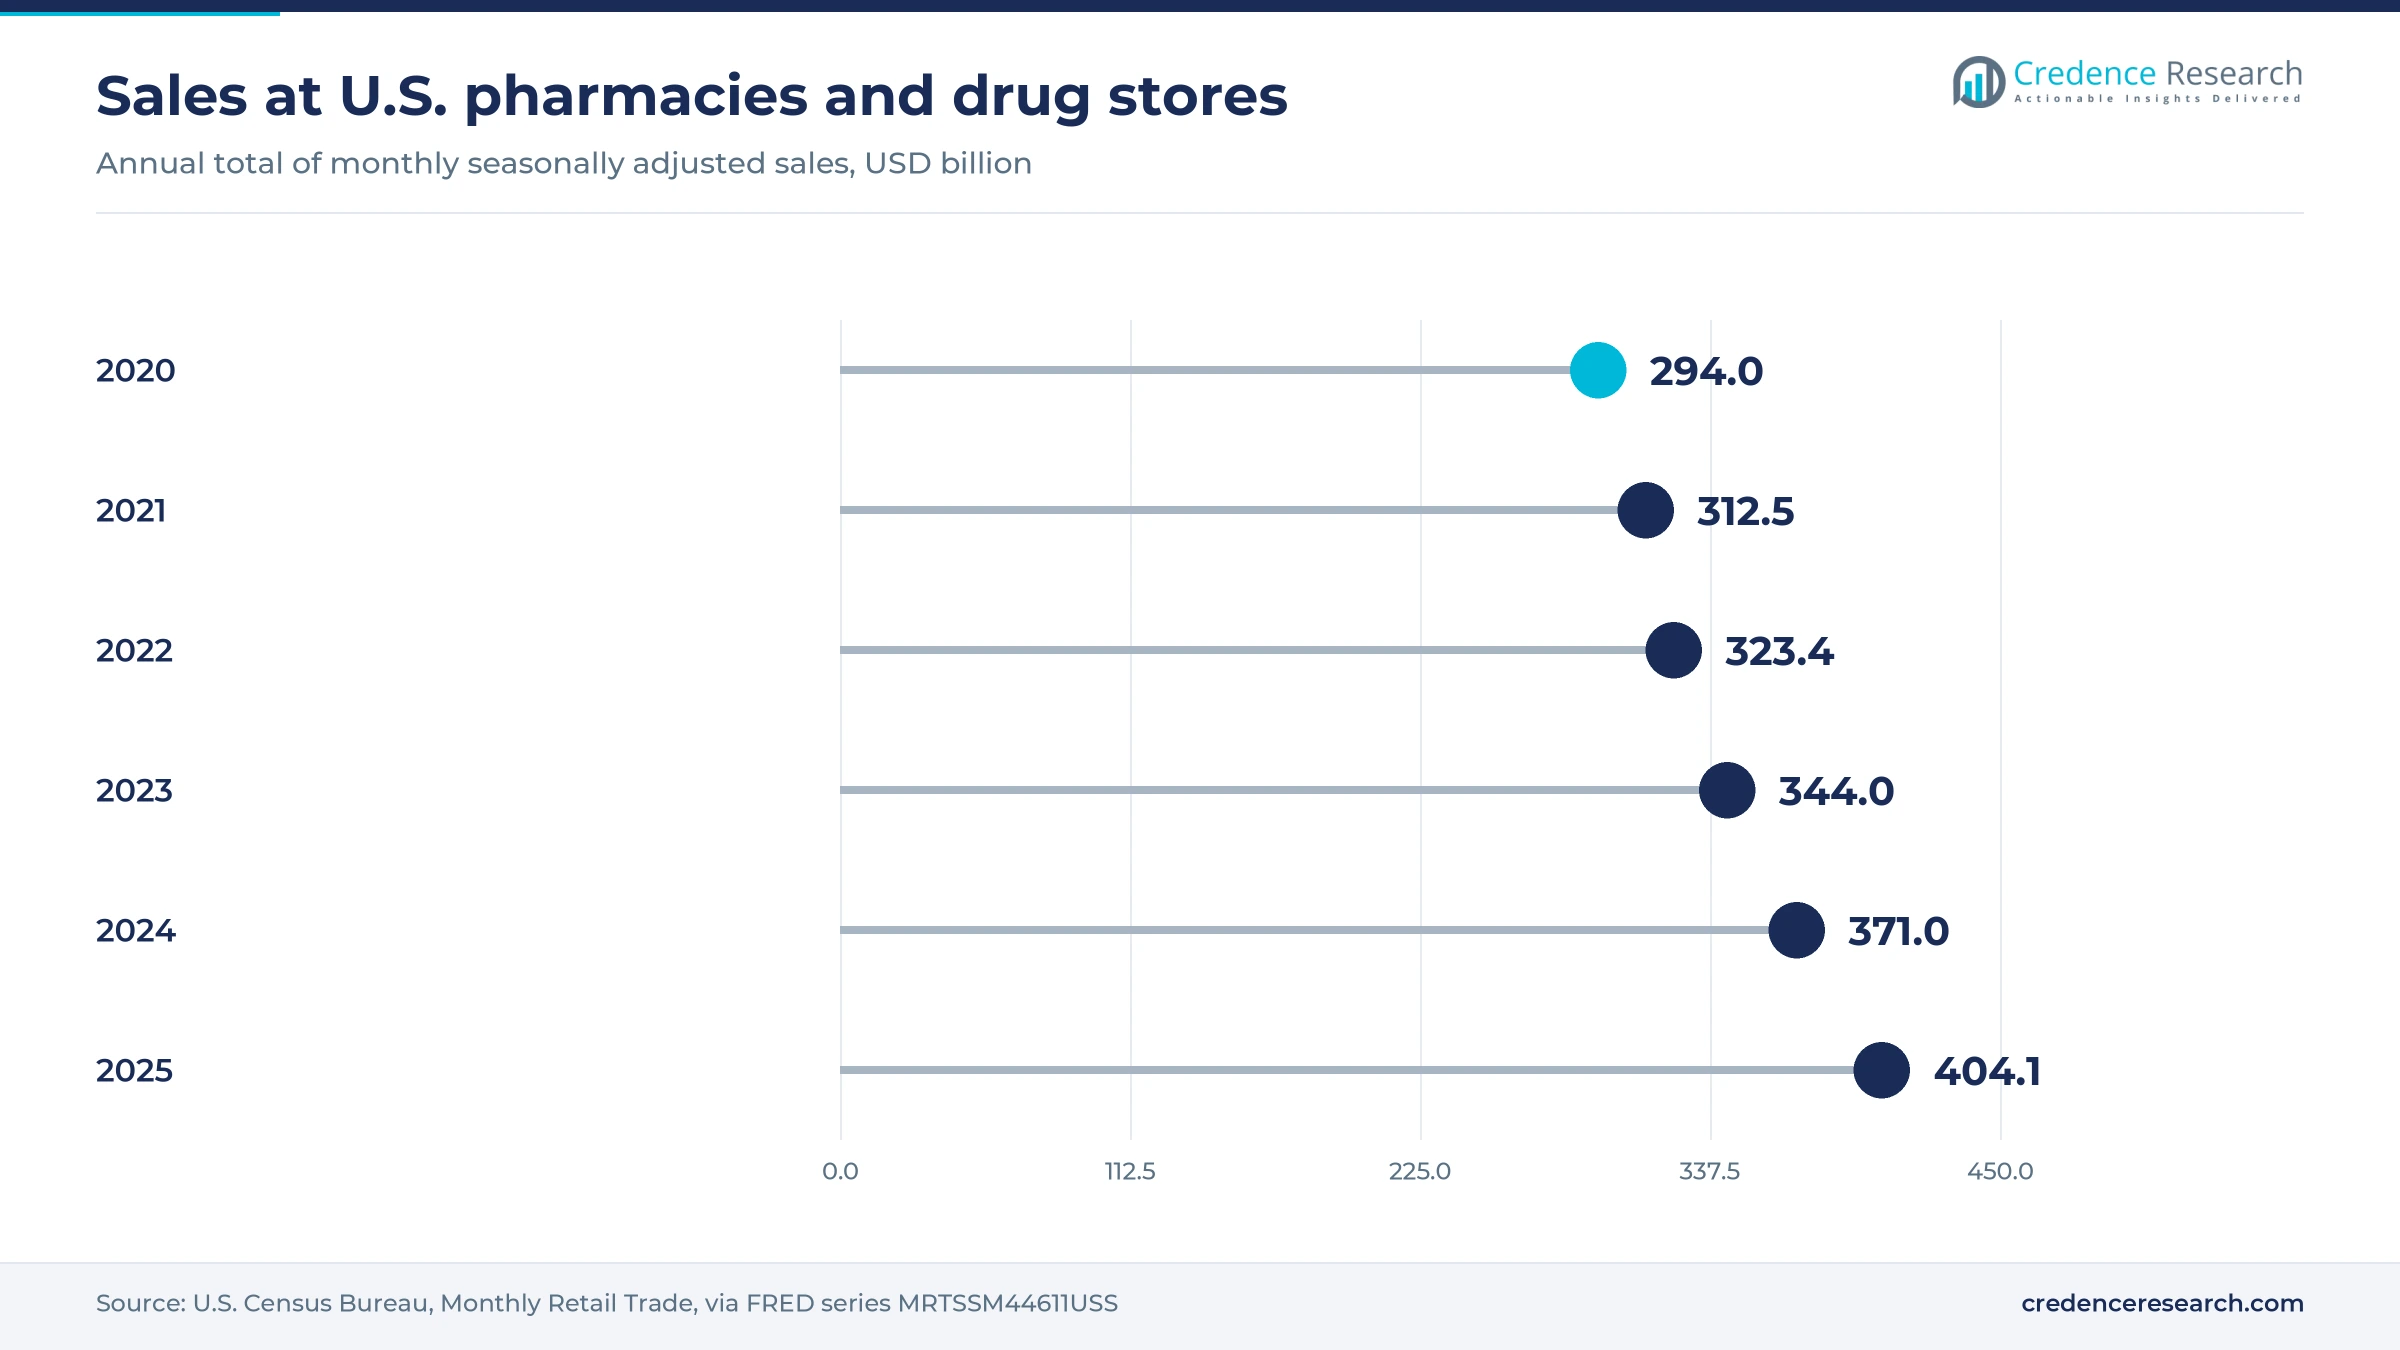
Higher prescription counts no longer guarantee higher revenue, as federal and company data now show. CVS Health reported third-quarter 2026 pharmacy same-store sales down 0.6% despite same-store prescription volume up 3.9%, citing regulatory price cuts and reimbursement pressure. Census Bureau store sales for January through August 2026 ran about 2.1% below the same months of 2025. The White House cited Bureau of Labor Statistics data in November 2026 showing prescription prices down 4.5%, so chains must lower dispensing costs.
Store closures widen gaps in local access
Closures hurt patients in neighborhoods where no replacement counter opens, and independents carry the greater risk. A study in Health Affairs, published in December 2024, found 29.4% of the 88,930 pharmacies operating from 2010 to 2020 had closed by 2021, with independents at higher risk than chains. Rite Aid had around 1,200 stores before its final 2025 shutdown, according to the Associated Press. Delivery services can fill part of this gap, though patients needing vaccines or counseling still require a physical location nearby.
Benefit manager rules arrive years after the damage
Reimbursement reform will not relieve current margins, because the main provisions start only in 2028 and 2029. The law signed on Feb. 3, 2026 delinks Part D benefit management pay from drug prices, yet Bisnow reports that insurers had already slashed reimbursement before CVS Health closed over 1,100 stores. Independent volume is slipping too, with the 2026 National Community Pharmacists Association Digest showing 65,795 prescriptions per store in 2025 against 67,601 in 2024. Owners must therefore renegotiate contracts while waiting for federal standards due in April 2028.
The South leads on store count and older residents
| Region | Value, 2025 (USD billion) | Share, 2025 | CAGR, 2026–2035 |
|---|---|---|---|
| South | 192.63 | 39.0% | 4.38% |
| West | 113.60 | 23.0% | 4.08% |
| Midwest | 98.79 | 20.0% | 3.68% |
| Northeast | 88.91 | 18.0% | 3.48% |
The South leads on Florida and Texas store networks
The South held 39.0% of 2025 value and grows at 4.38% a year, the fastest pace among the four regions. ScrapeHero's March 2026 dataset of 30,145 tracked locations lists 3,243 in Florida and 2,323 in Texas, with Georgia at 1,125 and North Carolina at 930. Florida is also among the 11 states where older adults outnumber children, according to the Census Bureau. Policy is active as well, because North Carolina standing orders opened flu test-and-treat services to pharmacists in October 2025.
The West combines California scale with thin rural coverage
The West held 23.0% of 2025 value and grows at 4.08% a year. California alone shows 2,876 locations in the March 2026 ScrapeHero dataset, which tracks only part of the national store base. Rural gaps shape the rest of the region, since Amazon Pharmacy cites Navajo Nation communities where the nearest store can be a 45 to 60 minute drive. CVS Health also runs former Rite Aid and Bartell Drugs locations in Idaho, Oregon and Washington, according to the Associated Press.
The Midwest tests new formats from Chicago outward
The Midwest held 20.0% of 2025 value and grows at 3.68% a year. Illinois has 1,023 pharmacy locations and Michigan has 916 in the March 2026 ScrapeHero count, which places both among the larger state networks. The region is also a testing ground for store design, because CVS Health opened its first pharmacy-only store in Chicago on March 30, 2026. Delivery reaches its edges too, with Amazon Pharmacy describing prescriptions sent to Mackinac Island in Michigan by ferry and horse.
The Northeast is dense, older and slower growing
The Northeast held 18.0% of 2025 value and grows at 3.48% a year, the slowest pace among the four regions. New York has 1,529 pharmacy locations in the March 2026 ScrapeHero count. Age supports refills here, since the Census Bureau lists Maine, New Hampshire, Pennsylvania, Rhode Island and Vermont among the states where older adults outnumber children. However, Rite Aid was concentrated on the East Coast before it closed, according to the Associated Press, and Amazon Pharmacy named Massachusetts among its 2026 additions.
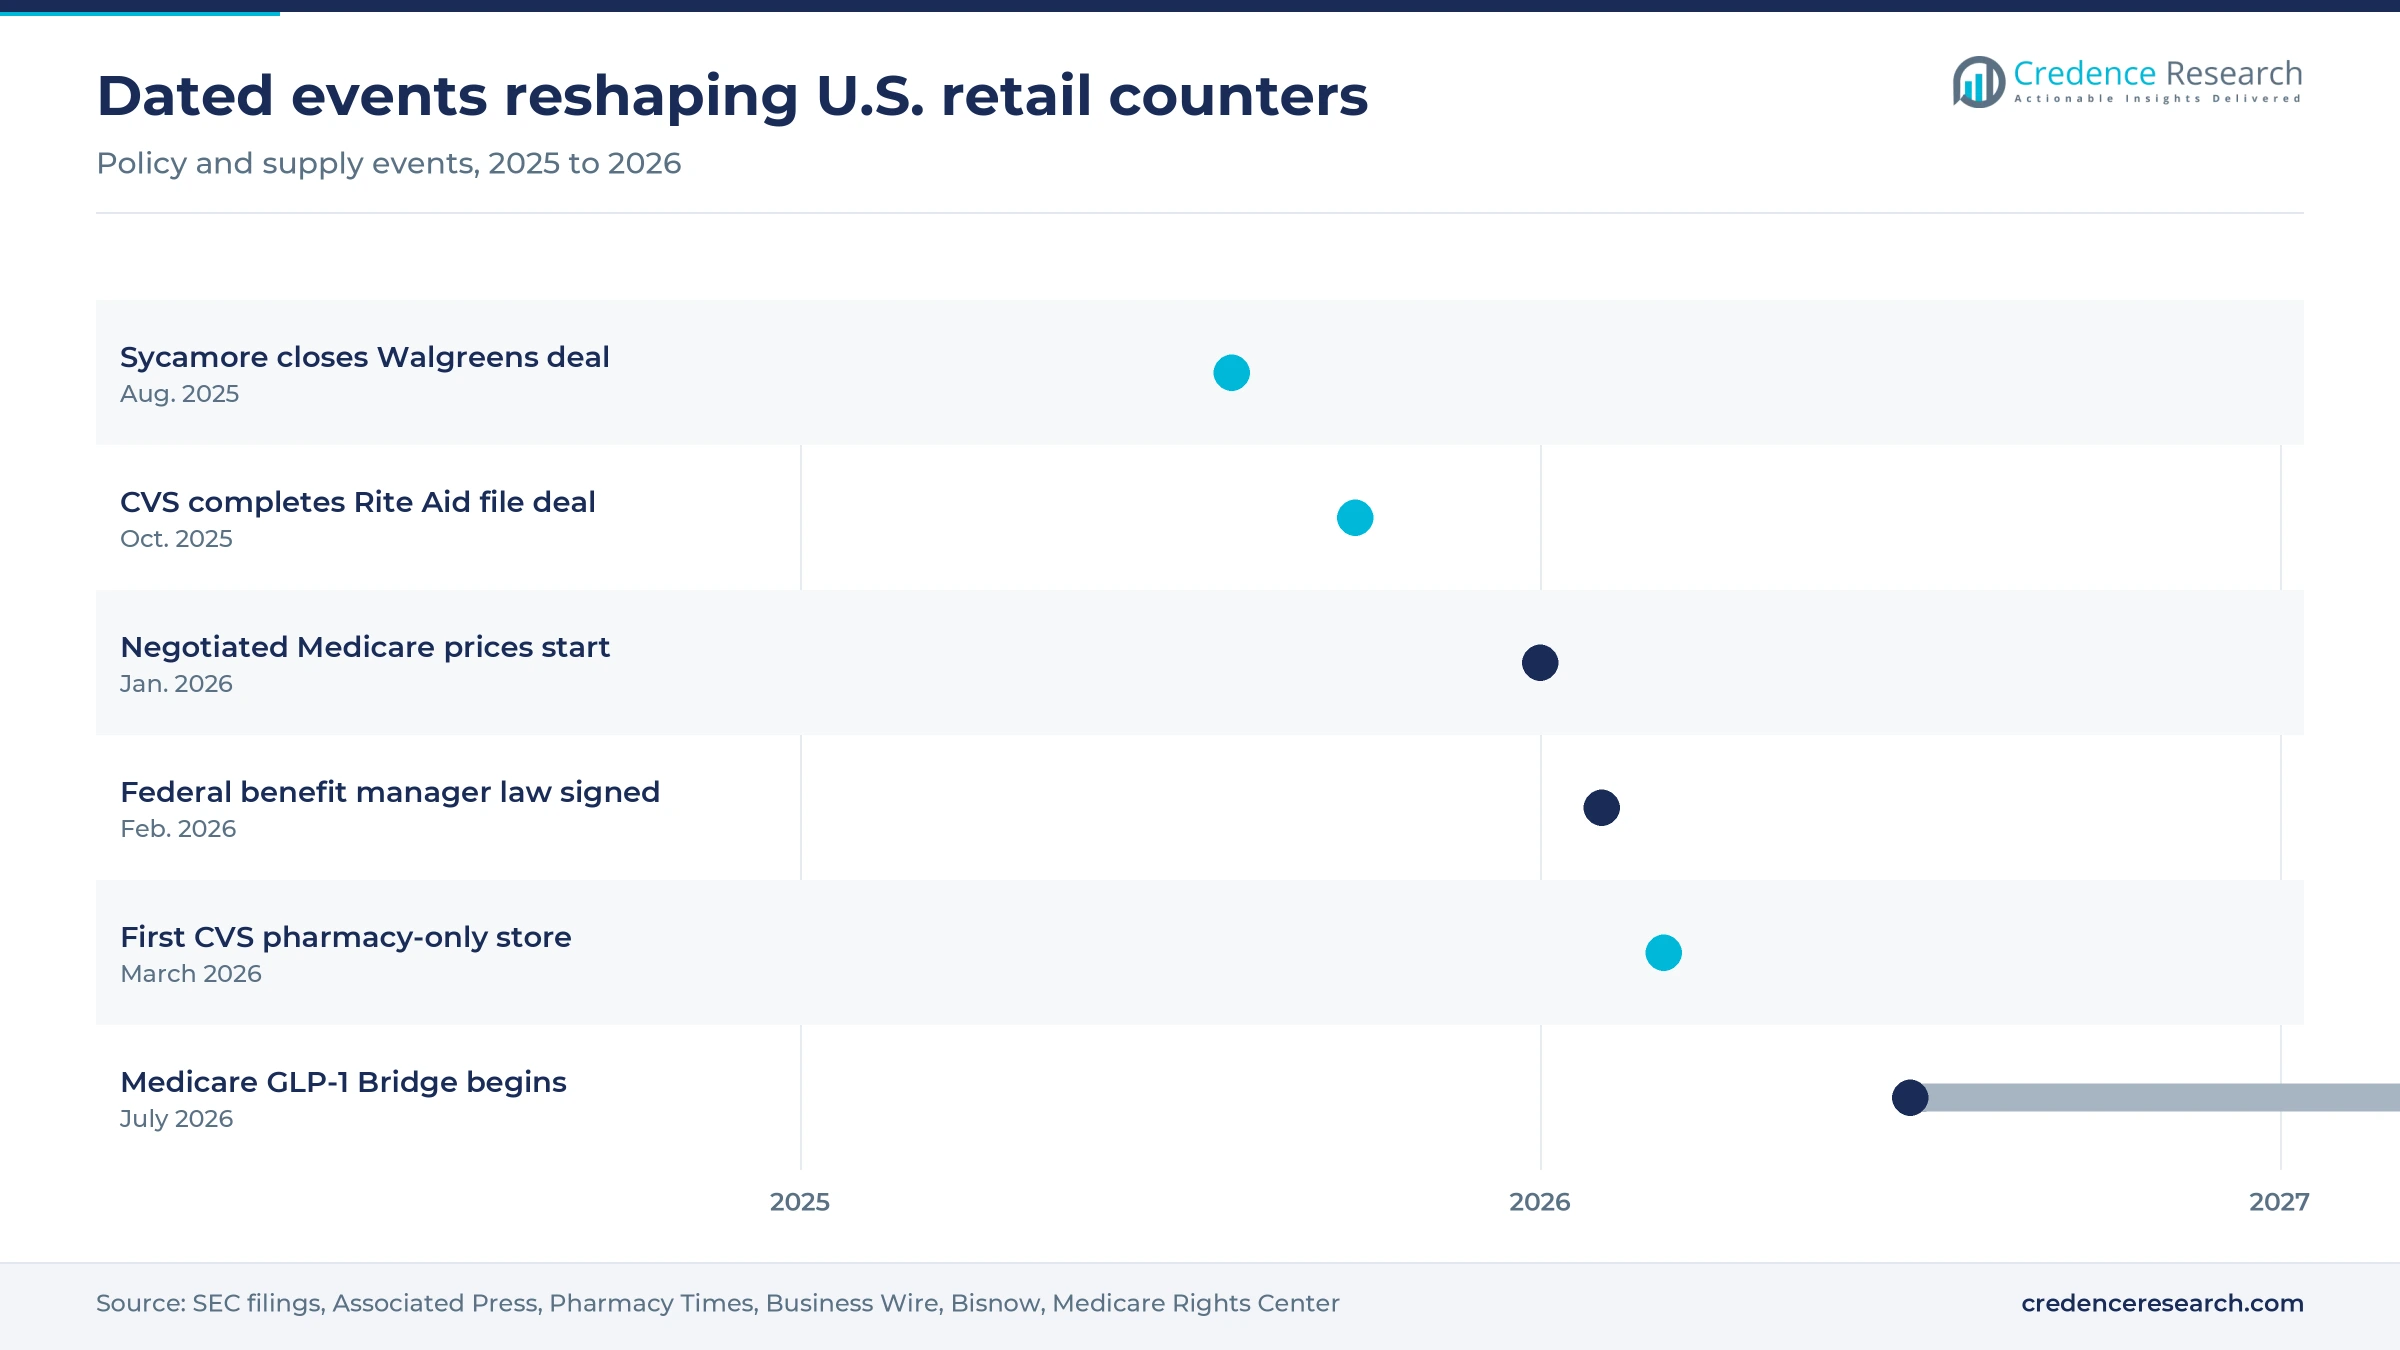
Dated moves that reset the chain landscape since 2025
| Development | Status and market relevance |
|---|---|
| In August 2025, Sycamore Partners completed its acquisition of Walgreens Boots Alliance, which left Walgreens as a separate private company. | Closed Aug. 28, 2025; shares delisted from Nasdaq |
| In October 2025, CVS Health finished buying Rite Aid prescription files from 626 pharmacies in 15 states and kept 63 stores running. | Completed; moves patients to surviving stores |
| In February 2026, the Consolidated Appropriations Act became law, with Part D benefit manager pay delinked from drug prices starting in 2028. | Signed Feb. 3, 2026; any willing pharmacy applies from 2029 |
| In February 2026, Amazon Pharmacy announced same-day delivery expansion to nearly 4,500 U.S. cities and towns by the end of the year. | Rollout through 2026, about 2,000 new communities |
| In July 2026, the Medicare GLP-1 Bridge began offering eligible enrollees certain weight-loss drugs for a USD 50 monthly copay. | Started July 1, 2026; runs through Dec. 31, 2027 |
Delivery, kiosks and refund systems change the counter
- Same-day cold chain delivery now covers insulin and GLP-1 drugs at Walmart, which added refrigerated and reconstituted medicines in September 2025.
- Pickup kiosks sit in a Los Angeles One Medical lobby for Amazon Pharmacy customers, and the company plans more of them during 2026.
- The Medicare Transaction Facilitator routes negotiated price refunds to pharmacies, and 78% of owners surveyed by the National Community Pharmacists Association reported problems reconciling those claims.
- Dispensing automation matters more as CVS Health same-store volume rises while sales fall, because lower labor cost per fill protects margin at the counter.
Need a Custom Version of This Report?
Tailor the scope, geography, or segments to your exact requirements.
- Custom geography or segment scope
- Direct access to our analyst team
Two chains and Walmart face a new delivery rival
Competition centers on who keeps the prescription relationship as store networks shrink. CVS Health operates about 9,000 retail locations and absorbed prescription files from 626 Rite Aid stores. Walgreens, private since Aug. 28, 2025, remains the second-largest network with 8,084 locations in the March 2026 ScrapeHero count. Walmart competes on price and grocery baskets across nearly 4,600 pharmacies, while Amazon Pharmacy competes on delivery speed and automatic coupons. Independents compete on service, often through Health Mart or Good Neighbor Pharmacy programs. Drug Channels reports that CVS Health, Walgreens, Cigna and UnitedHealth Group together took more than half of all U.S. dispensing revenue in 2025, and the top 15 took nearly three-quarters. Chain-level share by state is not officially published, so location counts remain the best public guide to local position. Rite Aid no longer competes after closing all of its stores.
Companies with verified U.S. store or delivery activity
| Company | Type | Role in the market |
|---|---|---|
| CVS Health | National chain | About 9,000 retail locations; bought Rite Aid prescription files in 2025 |
| Walgreens | National chain | Private since Aug. 28, 2025; 8,084 locations in a March 2026 count |
| Walmart | Mass merchant | Nearly 4,600 pharmacies and same-day delivery of most prescriptions |
| Amazon Pharmacy | Online pharmacy | Same-day delivery planned for nearly 4,500 communities by the end of 2026 |
| Health Mart | Franchise program | About 4,275 independently owned locations in a March 2026 count |
| Good Neighbor Pharmacy | Franchise program | About 2,352 independently owned locations in a March 2026 count |
Volume is healthy, while pricing decides who stays open
Credence Research's view is that U.S. retail pharmacy has a pricing problem rather than a demand problem. Prescription counts continue to rise, as CVS Health same-store volume shows, yet the same filing shows sales falling once regulated prices apply. Operators with low dispensing cost and strong clinical programs should keep their margins, while stores relying on reimbursement spread are exposed until the 2028 federal changes arrive. Delivery will also take routine refills away from weaker counters. The most important indicator to watch is therefore the gap between prescription volume and same-store sales during 2027.
How store sales and prescription data were modeled
The report uses 2025 as the base year, 2026 as the estimate year and 2035 as the forecast year. Market values come from the Credence Research model, checked against Census Bureau store sales, CMS spending data, company filings and pharmacy association reports. Segment and regional splits in this report are Credence Research estimates throughout. The research relied on public documents and databases only, and no interviews or surveys were conducted for this report.
Prescription volume outruns price cuts through 2035
Through 2035, the U.S. retail pharmacy business should benefit from an older patient base, and wider obesity coverage should keep prescription counts growing faster than prices. Near-term revenue will look weaker than volume, because 15 more negotiated drugs arrive in January 2027 and regulated price cuts continue to feed through store sales. From 2028, Part D benefit manager changes should improve contract terms, and the any willing pharmacy rule follows in 2029. Store numbers are unlikely to return to earlier levels, though smaller pharmacy-only formats and delivery should hold access together, particularly in the South, which remains the largest region.
Frequently Asked Questions
How big is the U.S. retail pharmacy market?
How many retail pharmacies are in the United States?
What is the CVS and Walgreens drugstore market share?
Which states have the most pharmacies, and is CVS share known by state?
What is the future of retail pharmacy in the United States?
Which drug store chains operate the most U.S. locations?
How fast are online pharmacies growing?
Why are retail pharmacies closing?
Table of Content
Chapter 1 Market Segmentation
- 1.1 Segmentation Framework
- 1.1.1 Product and Service Classification
- 1.1.2 Application and End-Use Classification
- 1.1.3 Technology and Solution Classification
- 1.1.4 Customer and Distribution Channel Classification
- 1.1.5 Geographic Segmentation
- 1.1.6 Market Segment Definitions and Boundaries
- 1.2 By Type of Pharmacy
- 1.2.1 Chain Pharmacies
- 1.2.2 Independent Pharmacies
- 1.2.3 Hospital Pharmacies
- 1.2.4 Mail Order Pharmacies
- 1.2.5 Online Pharmacies
- 1.3 By Type of Prescription
- 1.3.1 Prescription Drugs (Rx)
- 1.3.2 Over-the-Counter (OTC) Drugs
- 1.4 By Product Type
- 1.4.1 Branded Drugs
- 1.4.2 Generic Drugs
- 1.5 By Service Offered
- 1.5.1 Medication Dispensing
- 1.5.2 Vaccination Services
- 1.5.3 Consultation and Counseling
- 1.5.4 Chronic Disease Management
- 1.5.5 Health Screenings
Chapter 2 Introduction
- 2.1 Report Objectives and Scope
- 2.2 Product Definition and Industry Terminology
- 2.3 Market Inclusions and Exclusions
- 2.4 Research Process
- 2.4.1 Primary Research and Expert Interviews
- 2.4.2 Secondary Research and Source Review
- 2.4.3 Top-Down and Bottom-Up Estimation
- 2.4.4 Data Triangulation and Verification
- 2.5 Market Size Measurement Basis
- 2.5.1 2025: USD 493.93 billion → 2035: USD 731.84 billion
- 2.6 Historical and Forecast Reference Periods
- 2.6.1 Historical Period: 2018-2025
- 2.6.2 Base Year: 2025
- 2.6.3 Forecast Period: 2025-2035
- 2.7 Research Assumptions and Limitations
Chapter 3 Executive Summary
- 3.1 Market Snapshot and Key Findings
- 3.2 Base-Year Market Size, 2025
- 3.3 Forecast Market Size, 2035
- 3.4 Revenue and Volume Growth Outlook
- 3.5 Key Demand and Supply Indicators
- 3.6 Leading Market Segments
- 3.7 Fastest-Growing Market Opportunities
- 3.8 Regional Performance Highlights
- 3.9 Technology and Industry Transformation
- 3.10 Competitive Landscape Summary
- 3.11 Analyst View and Strategic Implications
Chapter 4 US Retail Pharmacy Market Trends and Developments
- 4.1 Historical Industry Development, 2018-2025
- 4.2 Recent Market Trends and Developments
- 4.3 Demand and Customer Behavior Trends
- 4.4 Technology and Product Innovation
- 4.5 Artificial Intelligence, Automation and Digitalization
- 4.6 Local Manufacturing and Supply Chain Realignment
- 4.7 Industry Partnerships, Mergers and Acquisitions
- 4.8 Sustainability and Circular Economy Developments
- 4.9 Government and Private Sector Investment Trends
- 4.10 Emerging Business Models and Commercialization
- 4.11 Industry Developments and Announcements
Chapter 5 US Retail Pharmacy Market Production, Supply and Demand Analysis
- 5.1 Demand Trend and Consumption Analysis, 2018-2025
- 5.2 Demand Forecast, 2025-2035
- 5.3 Production and Output Trend, 2018-2025
- 5.4 Production and Output Forecast, 2025-2035
- 5.5 Installed Capacity and Capacity Utilization
- 5.6 Company-Wise Production Plants and Statistics
- 5.6.1 Installed Production Capacity
- 5.6.2 Actual Production
- 5.6.3 Planned Capacity and Expansion Targets
- 5.7 Supply Chain Structure and Procurement Trends
- 5.8 Supply-Demand Gap and Bottlenecks
- 5.9 Import Dependence and Sourcing Structure
- 5.10 Contract Manufacturing and Outsourcing
- 5.11 Regional Supply and Demand Concentration
Chapter 6 US Retail Pharmacy Market Pricing Analysis
- 6.1 Pricing Structure and Measurement
- 6.2 Historical Pricing Trends, 2018-2025
- 6.3 Pricing Outlook, 2025-2035
- 6.4 Average Selling Price and Unit Economics
- 6.5 Pricing by Product and Market Segment
- 6.6 Geographic Pricing Differences
- 6.7 Key Input, Energy, Labor and Logistics Costs
- 6.8 Contract Pricing and Purchasing Models
- 6.9 Pricing Sensitivity and Competitive Positioning
- 6.10 Price, Margin and Profitability Implications
Chapter 7 US Retail Pharmacy Market Dynamics
- 7.1 Market Growth Drivers
- 7.1.1 Demand-Side Drivers
- 7.1.2 Technology and Innovation Drivers
- 7.1.3 Infrastructure and Investment Drivers
- 7.1.4 Regulatory and Policy Drivers
- 7.2 Market Restraints
- 7.2.1 Cost and Affordability Constraints
- 7.2.2 Technology and Adoption Barriers
- 7.2.3 Supply Chain and Operational Constraints
- 7.3 Market Challenges
- 7.3.1 Competitive Pressure and Margin Erosion
- 7.3.2 Skills, Infrastructure and Implementation Gaps
- 7.4 Emerging Market Opportunities
- 7.5 Market Dynamics Impact and Time-Horizon Assessment
Chapter 8 US Retail Pharmacy Value Chain Analysis
- 8.1 Industry Value Chain Overview
- 8.2 Upstream Suppliers and Critical Inputs
- 8.3 Technology and Component Providers
- 8.4 Manufacturing or Service Delivery
- 8.5 Distribution, Channel Partners and Integrators
- 8.6 Downstream Applications and End Users
- 8.7 Value Addition and Profit Pools
- 8.8 Vertical Integration and Outsourcing
- 8.9 Supplier Concentration and Risk
- 8.10 Supply Chain Localization and Resilience
Chapter 9 US Retail Pharmacy Market Regulations and Policies
- 9.1 Relevant Laws, Standards and Compliance Frameworks
- 9.2 Product, Service, Safety and Quality Requirements
- 9.3 Government Policies, Incentives and Subsidies
- 9.4 Imports, Exports and Trade Barriers
- 9.5 Public Procurement and Local Content Requirements
- 9.6 Environmental and Sustainability Compliance
- 9.7 Upcoming Policy Changes and Market Implications
Chapter 10 US Retail Pharmacy Market Hotspots and Opportunities
- 10.1 Market Opportunity Mapping and Growth Hotspots
- 10.2 High-Growth Applications and Customer Groups
- 10.3 Underserved Markets and White-Space Opportunities
- 10.4 Emerging Technology and Product Opportunities
- 10.5 New Capacity and Investment Hotspots
- 10.6 Market Entry and Expansion Opportunities
- 10.7 Distribution and Partnership Opportunities
- 10.8 Near-Term and Long-Term Commercial Potential
- 10.9 Opportunity Attractiveness and Execution Risks
Chapter 11 US Retail Pharmacy Market Outlook, 2025-2035
- 11.1 Market Size and Analysis
- 11.1.1 Revenue (Market Measurement: 2025: USD 493.93 billion → 2035: USD 731.84 billion)
- 11.1.2 Market Volume and Quantity Sold
- 11.1.3 Historical Market Size, 2018-2025
- 11.1.4 Base-Year Market Size, 2025
- 11.2 Market Forecast, 2025-2035
- 11.2.1 Revenue Forecast to 2035
- 11.2.2 Volume Forecast to 2035
- 11.2.3 CAGR and Year-on-Year Growth
- 11.2.4 Incremental Revenue Opportunity
- 11.3 Forecast Assumptions and Scenario Analysis
- 11.3.1 Base-Case Forecast
- 11.3.2 Optimistic and Conservative Scenarios
- 11.3.3 Technology, Pricing and Policy Sensitivities
- 11.4 Market Attractiveness and Growth Outlook
Chapter 12 US Retail Pharmacy Market Segmentation and Outlook
- 12.1 Segmentation Summary and Market Shares, 2025
- 12.2 Largest and Fastest-Growing Segments
- 12.3 By Type of Pharmacy - Market Size and Forecast, 2025-2035
- 12.3.1 Segment Definition and Scope
- 12.3.2 Historical Market Size, 2018-2025
- 12.3.3 Revenue Forecast, 2025-2035
- 12.3.4 Volume Forecast, 2025-2035
- 12.3.5 Base-Year Market Share, 2025
- 12.3.6 Segment CAGR and Growth Drivers
- 12.3.7 Subsegment Market Size and Forecast
- 12.3.7.1 Chain Pharmacies
- 12.3.7.2 Independent Pharmacies
- 12.3.7.3 Hospital Pharmacies
- 12.3.7.4 Mail Order Pharmacies
- 12.3.7.5 Online Pharmacies
- 12.3.8 Subsegment Pricing and Adoption Trends
- 12.3.9 Leading Suppliers and Competition
- 12.3.10 Regional Demand and Opportunities
- 12.4 By Type of Prescription - Market Size and Forecast, 2025-2035
- 12.4.1 Segment Definition and Scope
- 12.4.2 Historical Market Size, 2018-2025
- 12.4.3 Revenue Forecast, 2025-2035
- 12.4.4 Volume Forecast, 2025-2035
- 12.4.5 Base-Year Market Share, 2025
- 12.4.6 Segment CAGR and Growth Drivers
- 12.4.7 Subsegment Market Size and Forecast
- 12.4.7.1 Prescription Drugs (Rx)
- 12.4.7.2 Over-the-Counter (OTC) Drugs
- 12.4.8 Subsegment Pricing and Adoption Trends
- 12.4.9 Leading Suppliers and Competition
- 12.4.10 Regional Demand and Opportunities
- 12.5 By Product Type - Market Size and Forecast, 2025-2035
- 12.5.1 Segment Definition and Scope
- 12.5.2 Historical Market Size, 2018-2025
- 12.5.3 Revenue Forecast, 2025-2035
- 12.5.4 Volume Forecast, 2025-2035
- 12.5.5 Base-Year Market Share, 2025
- 12.5.6 Segment CAGR and Growth Drivers
- 12.5.7 Subsegment Market Size and Forecast
- 12.5.7.1 Branded Drugs
- 12.5.7.2 Generic Drugs
- 12.5.8 Subsegment Pricing and Adoption Trends
- 12.5.9 Leading Suppliers and Competition
- 12.5.10 Regional Demand and Opportunities
- 12.6 By Service Offered - Market Size and Forecast, 2025-2035
- 12.6.1 Segment Definition and Scope
- 12.6.2 Historical Market Size, 2018-2025
- 12.6.3 Revenue Forecast, 2025-2035
- 12.6.4 Volume Forecast, 2025-2035
- 12.6.5 Base-Year Market Share, 2025
- 12.6.6 Segment CAGR and Growth Drivers
- 12.6.7 Subsegment Market Size and Forecast
- 12.6.7.1 Medication Dispensing
- 12.6.7.2 Vaccination Services
- 12.6.7.3 Consultation and Counseling
- 12.6.7.4 Chronic Disease Management
- 12.6.7.5 Health Screenings
- 12.6.8 Subsegment Pricing and Adoption Trends
- 12.6.9 Leading Suppliers and Competition
- 12.6.10 Regional Demand and Opportunities
- 12.7 Segment Growth Comparison
- 12.8 Segment Attractiveness and Priority Matrix
Chapter 13 US Retail Pharmacy Geographic Market Outlook, 2025-2035
- 13.1 Domestic Market Distribution and Demand Clusters
- 13.2 State- or Province-Wise Market Size and Forecast, 2025-2035
- 13.3 City and Metropolitan Market Outlook
- 13.4 Industrial, Manufacturing and Commercial Clusters
- 13.5 Geographic Concentration of Key End Users
- 13.6 Local Pricing and Purchasing Differences
- 13.7 Domestic Production Facilities and Capacity Map
- 13.8 Local Infrastructure and Project Pipeline
- 13.9 State-Level Policy and Incentive Differences
- 13.10 Subnational Investment Hotspots and Opportunities
- 13.11 Distribution and Logistics Networks
- 13.12 Domestic Competitive Footprint
Chapter 14 US Retail Pharmacy Technology, Innovation and Sustainability Outlook
- 14.1 Technology Landscape and Maturity
- 14.2 Product, Process and Service Innovation
- 14.3 AI, Automation and Digital Tools in the Industry
- 14.4 Technology Adoption and Performance Benchmarking
- 14.5 Innovation Pipeline and R&D Investment
- 14.6 Patent and Intellectual Property Trends
- 14.7 Energy Efficiency and Resource Management
- 14.8 Sustainability, Recycling and Circularity
- 14.9 Technology Roadmap, 2025-2035
- 14.10 Risks of Obsolescence and Technology Substitution
Chapter 15 US Retail Pharmacy Market Key Strategic Imperatives
- 15.1 Growth and Market Entry Priorities
- 15.2 High-Return Products and Segments
- 15.3 Pricing, Profitability and Cost Optimization
- 15.4 Technology Investment and Product Differentiation
- 15.5 Supply Chain Localization and Resilience
- 15.6 Distribution and Customer Acquisition
- 15.7 Partnership, Acquisition and Capacity Strategy
- 15.8 Regional Expansion Priorities
- 15.9 Short-, Medium- and Long-Term Actions
Chapter 16 Competition Outlook
- 16.1 Industry Competition Characteristics
- 16.2 Market Structure and Concentration
- 16.3 Market Share and Competitive Positioning, 2025
- 16.4 Company-Wise Revenue and Product Benchmarking
- 16.5 Production and Service Capacity Benchmarking
- 16.6 Technology, Pricing and Differentiation
- 16.7 Regional Footprint and Distribution Strength
- 16.8 Mergers, Acquisitions and Strategic Alliances
- 16.9 New Entrants and Competitive Threats
- 16.10 Porter's Five Forces and Industry Attractiveness
- 16.11 Competitive Outlook, 2025-2035
Chapter 17 Company Profiles
- 17.1 Company Coverage and Selection Criteria
- 17.2 CVS Health
- 17.2.1 Business Description
- 17.2.2 Company Ownership and Geographic Presence
- 17.2.3 Product and Service Portfolio
- 17.2.4 Manufacturing and Operating Footprint
- 17.2.5 Production Capacity and Expansion Plans
- 17.2.6 Financial Performance and Investment
- 17.2.7 Market Share and Competitive Position
- 17.2.8 Technology and Innovation Capabilities
- 17.2.9 Strategic Alliances or Partnerships
- 17.2.10 Recent Developments
- 17.2.11 Growth Strategy and Outlook
- 17.3 Walgreens
- 17.4 Walmart
- 17.5 Amazon Pharmacy
- 17.6 Health Mart
- 17.7 Good Neighbor Pharmacy
- 17.8 Other Relevant Market Participants
Note: Every listed company is profiled on the structure shown under the first company. The company list is preliminary and may change based on research findings, market developments, data availability and client requirements.
Chapter 18 Disclaimer
- 18.1 Research and Forecast Disclaimer
- 18.2 Data Source and Estimation Limitations
Note: The depth of individual sections depends on data availability for this market. Volume, capacity, trade and other unit-based metrics are included where applicable.