United States specialty pharmacy value rests on few networks
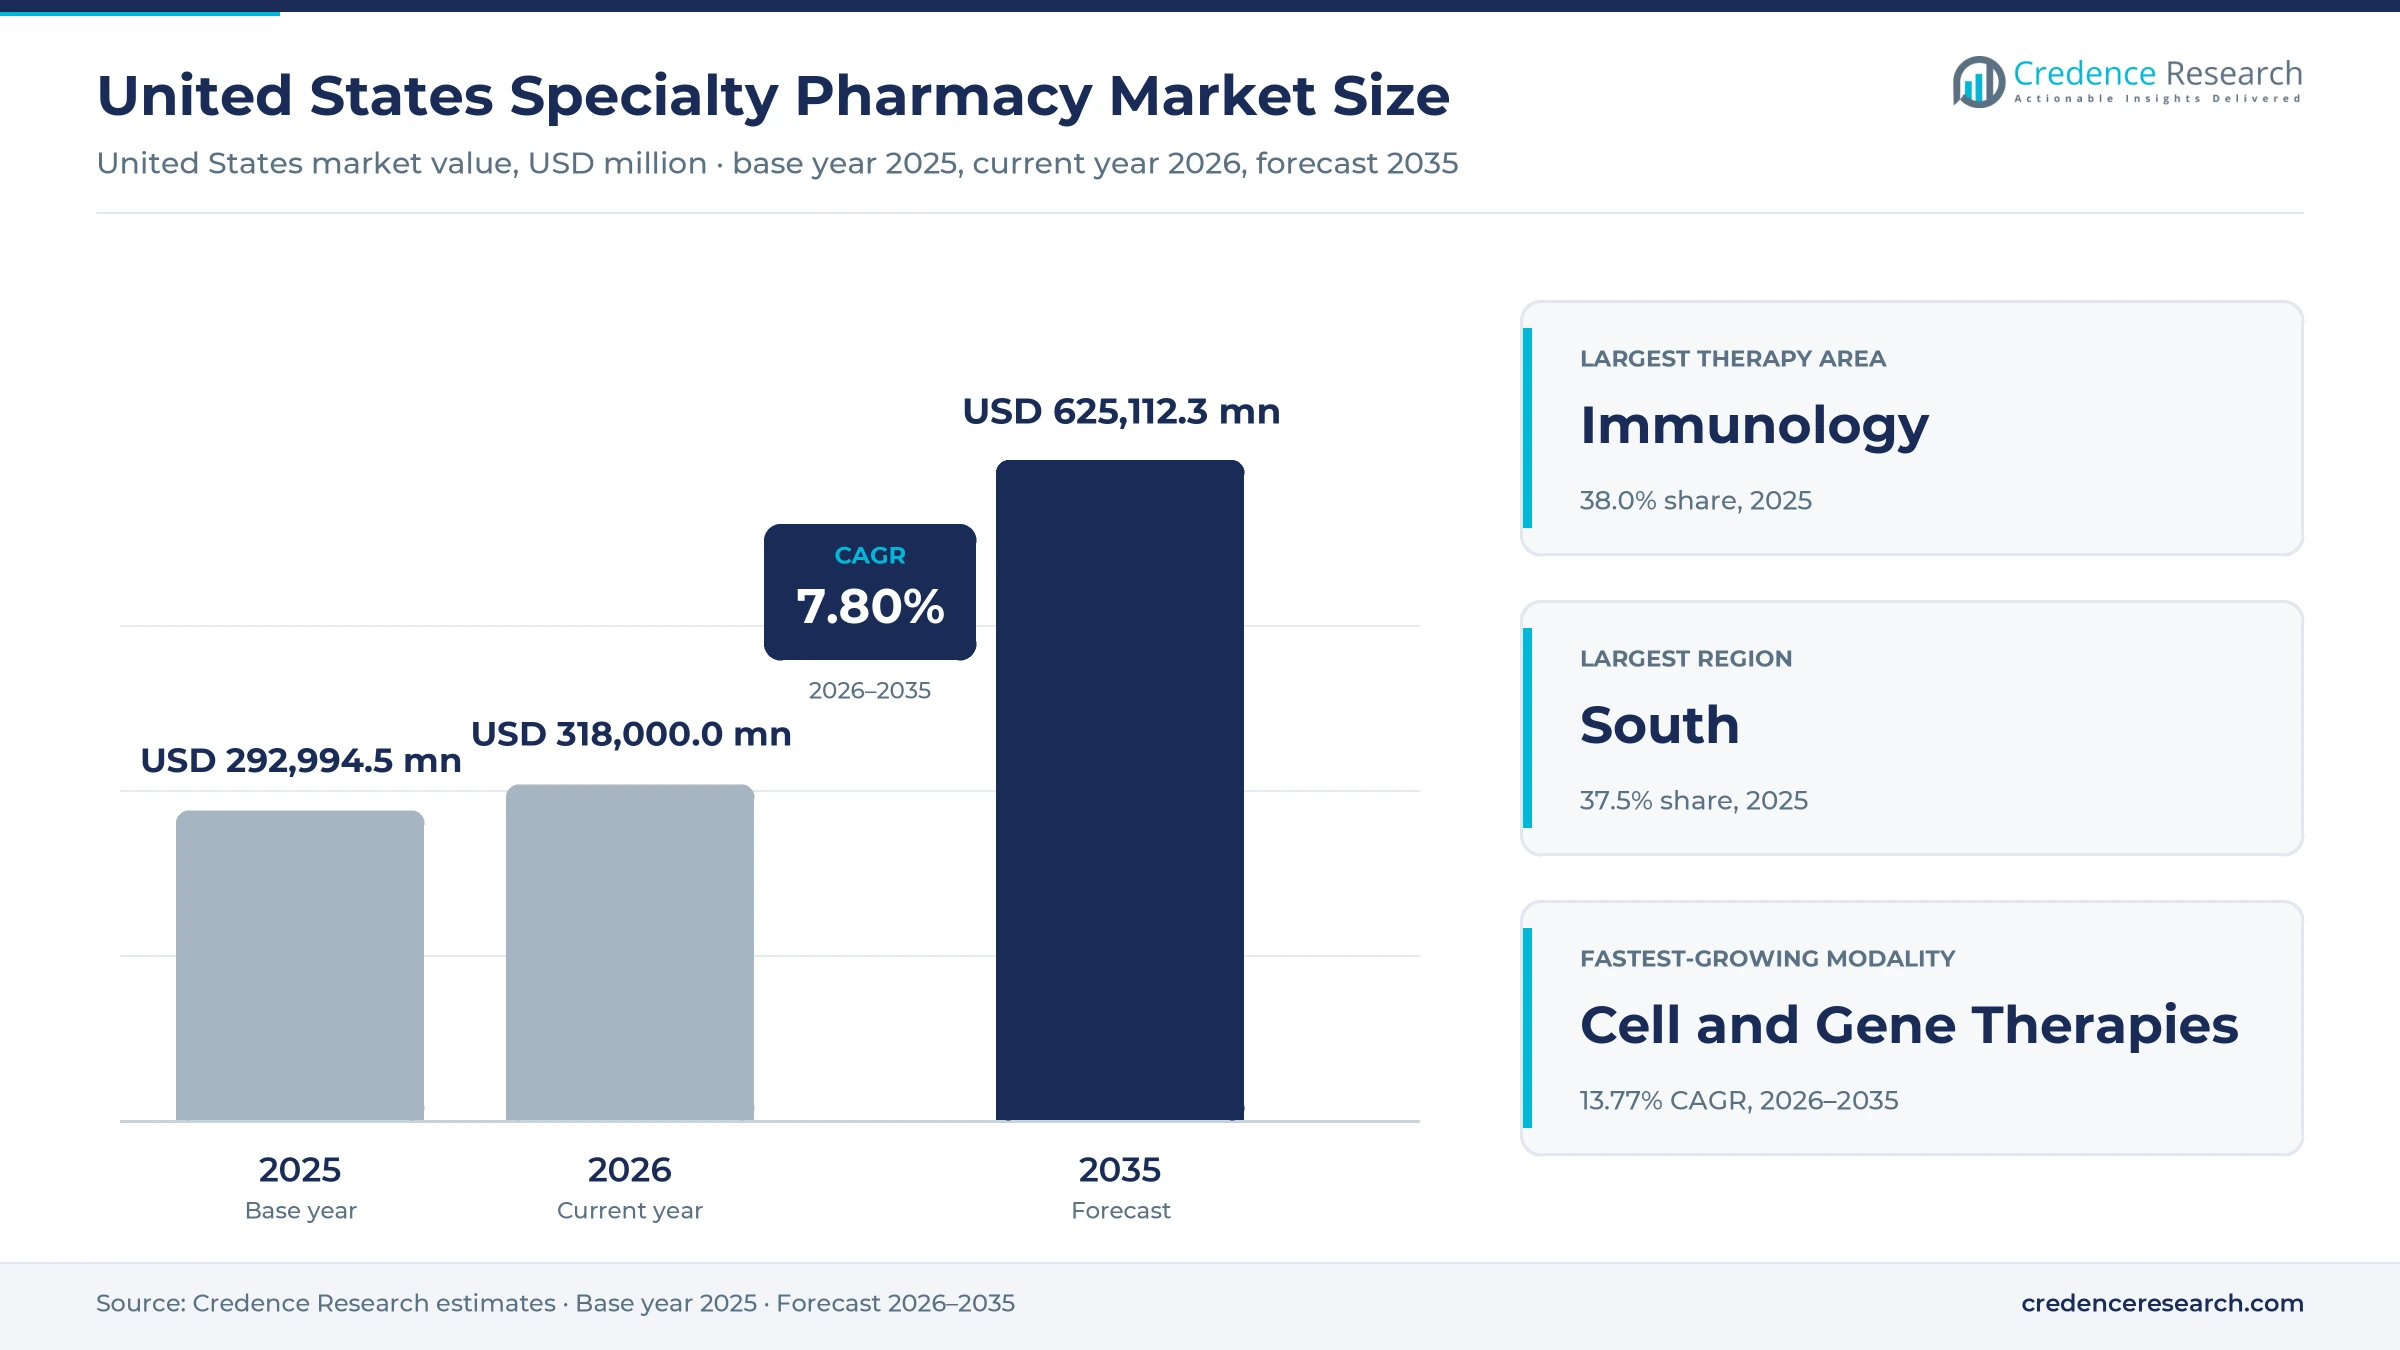
The United States specialty pharmacy market was valued at USD 292.99 billion in 2025 and is projected to increase from USD 318.00 billion in 2026 to USD 625.11 billion by 2035, registering a CAGR of 7.80% during 2026–2035. Demand comes from oral oncology drugs, self-injected immunology biologics and a growing list of orphan medicines that need cold-chain handling, payer authorization and nurse support. South held the largest regional share, 37.5% in 2025, and also grows fastest at 8.08% a year as Census Bureau counts show the region adding the most residents. Commercial plans still pay for half of dispensed value, while the $2,100 Medicare Part D out-of-pocket cap that took effect in 2026 keeps more older patients on expensive therapy. Medicare negotiated prices on 15 more drugs begin in 2027, which shifts pharmacy economics toward clinical services and away from a percentage of list price.
What does the specialty dispensing market count and leave out?
The market counts prescription revenue from specialty drugs dispensed by central-fill, health-system, independent and retail-affiliated pharmacies to patients at home or at a clinic. Value is measured at the pharmacy level, so it captures the drug cost plus the dispensing, care-management and patient-access work bundled with each fill.
The estimate excludes provider-administered drugs billed under the medical benefit, which physician offices and hospital outpatient departments buy and bill themselves. It also excludes standard retail prescriptions, manufacturer hub fees paid outside the dispensing claim and infusion nursing billed separately from the drug.
United States Specialty Pharmacy Market Insights
- The market rises from USD 292.99 billion in 2025 to USD 625.11 billion by 2035, a 7.80% CAGR built on new therapies rather than on list-price increases alone.
- The South led with 37.5% of 2025 value, supported by the largest and fastest-growing resident base recorded in the Census Bureau estimates for 2025.
- PBM-Affiliated Central Fill held 68.0% of 2025 value because three vertically integrated networks control about two-thirds of pharmacy-dispensed specialty prescription revenue.
- Accredited health-system locations grew from 106 in 2017 to 553 in 2025, which moves oncology and transplant patients toward hospital-owned dispensing programs.
- Medicare negotiated prices on 15 drugs start in 2027, and the deepest listed specialty cuts make clinical services a stronger source of pharmacy income.
Immunology and PBM networks anchor dispensing value
Why does immunology carry the largest therapy share?
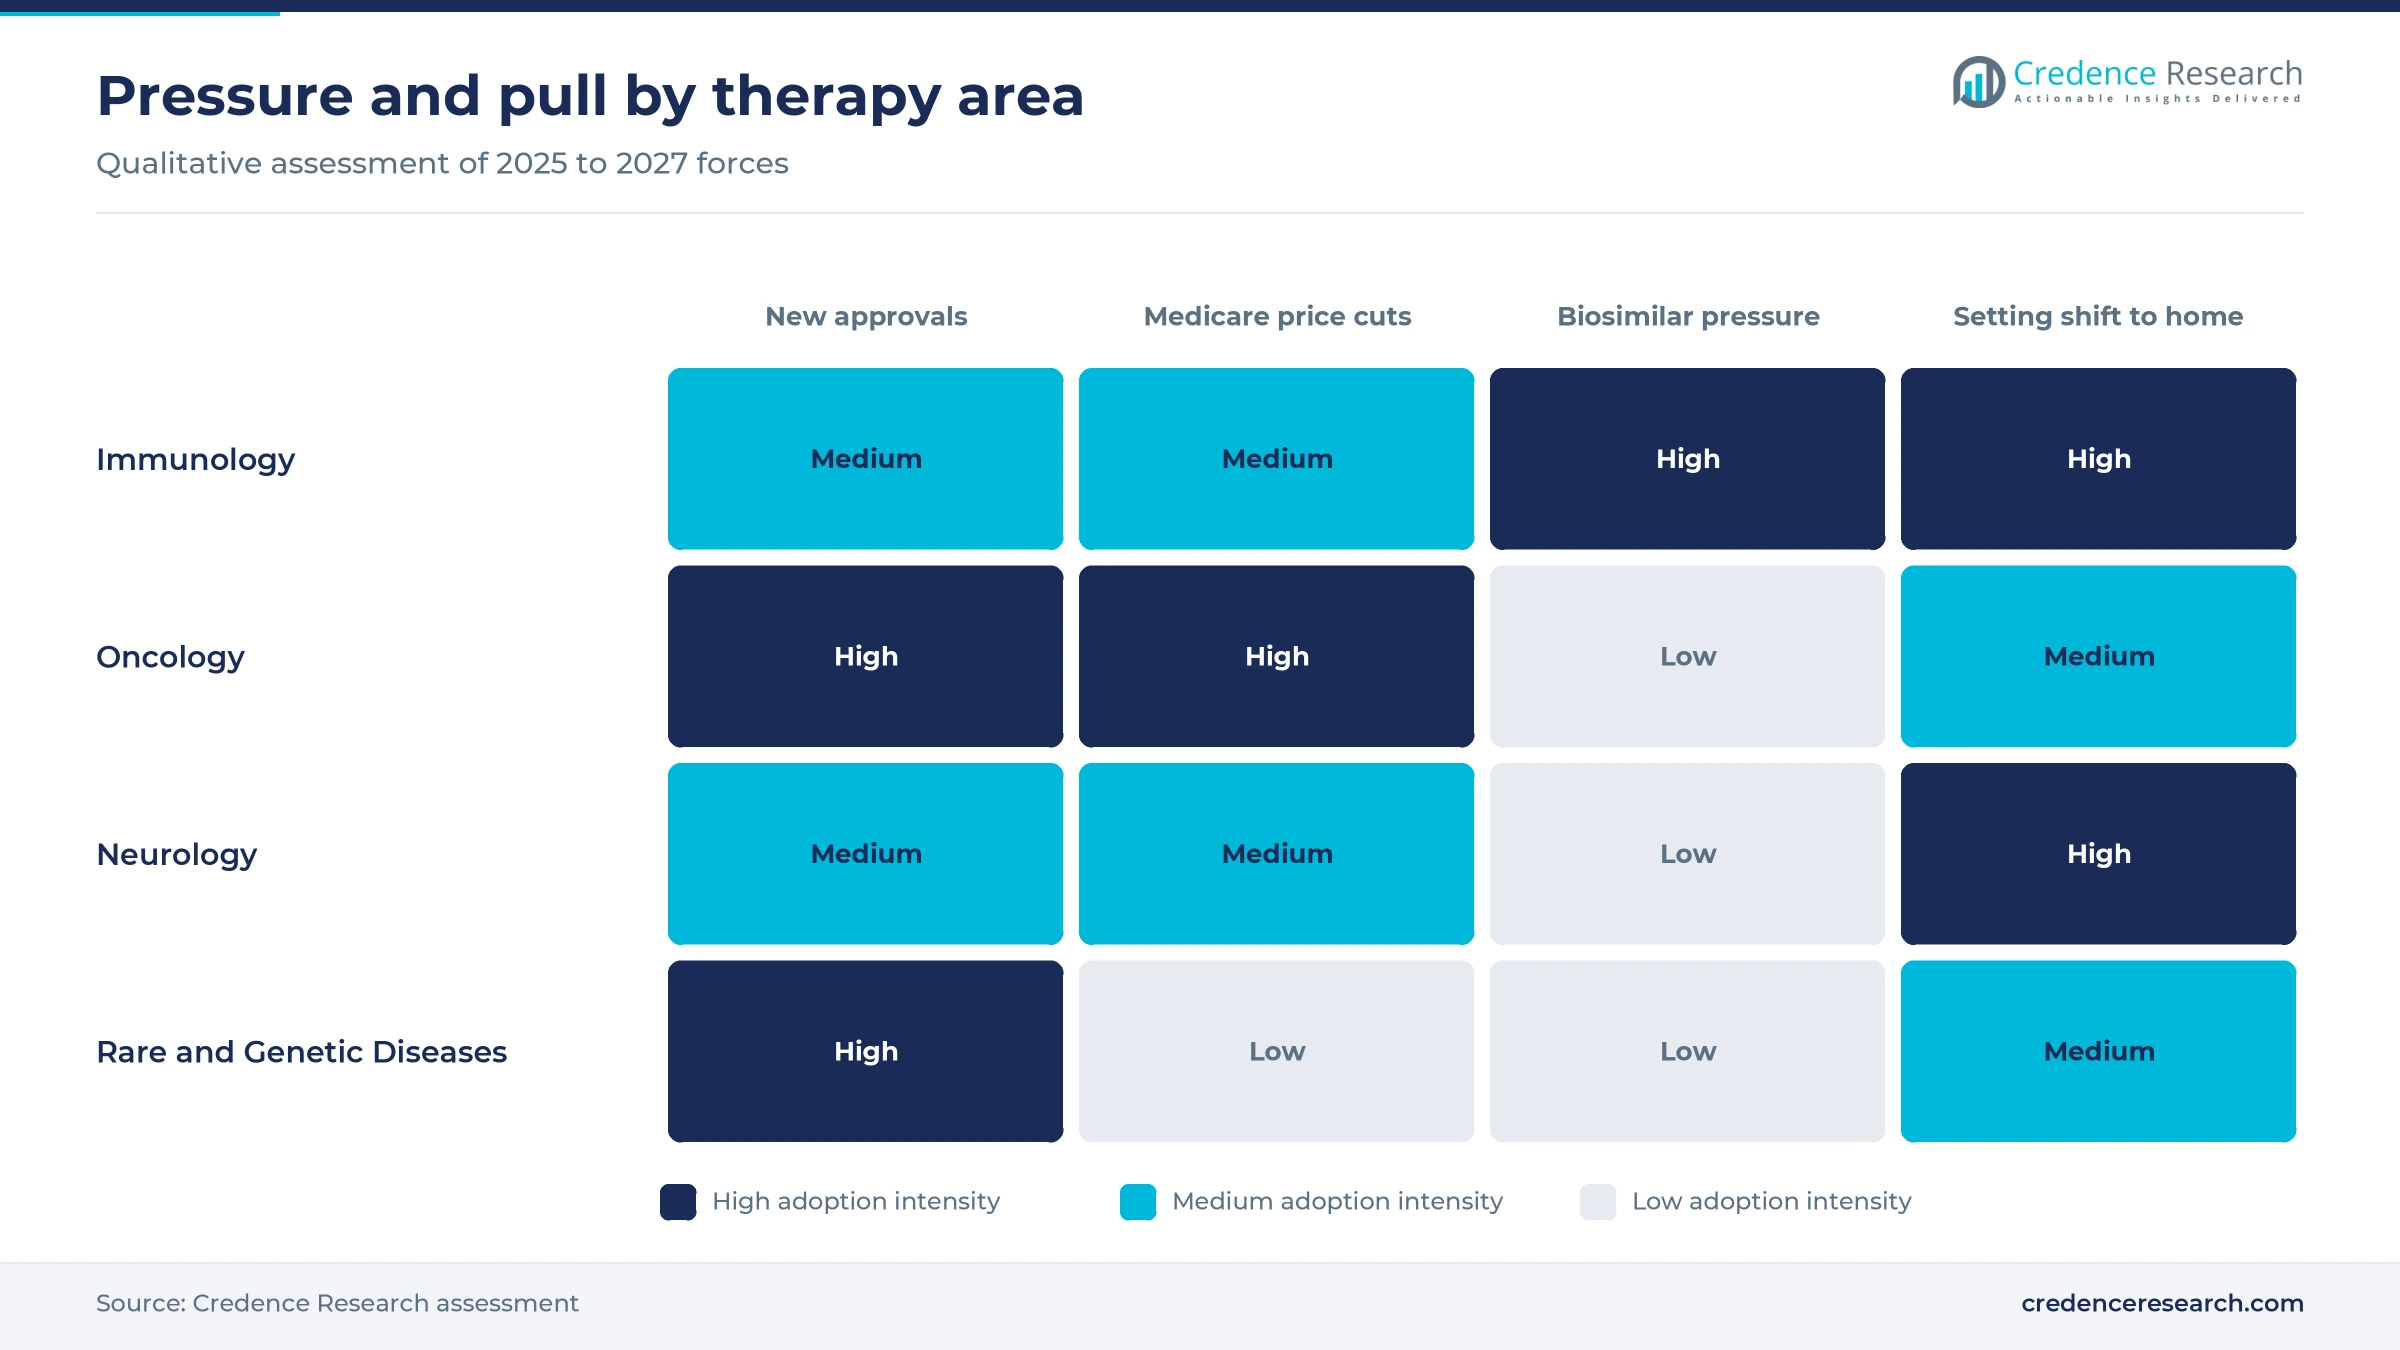
Based on therapy area, the market is categorized into immunology, oncology, neurology and rare and genetic diseases. Immunology led with 38.0% of 2025 value because self-injected anti-inflammatory biologics sit under the pharmacy benefit, and Tremfya added subcutaneous approvals for Crohn's disease in March 2025 and ulcerative colitis in September 2025. Oncology follows on oral agents such as Ibrance and Xtandi. Rare and Genetic Diseases grows fastest at 9.28% a year as approvals reach conditions with few options, including Qfitlia for hemophilia on March 28, 2025, and Ekterly for hereditary angioedema on July 3, 2025, according to the FDA.
How does the modality mix shift toward complex products?
Based on drug modality, the market is categorized into small-molecule specialty drugs, biologics, biosimilars and cell and gene therapies. Biologics led with 58.0% of 2025 value because payers route high-cost injectables through managed dispensing networks, and the FDA cleared 12 novel biologics in 2025 alone. Biosimilars gained 18 further FDA approvals that year, which adds lower-cost options to the same channel. Cell and Gene Therapies grows fastest at 13.77% a year from a very small base as the CMS access model for sickle cell gene therapies, announced July 15, 2025, brings 33 states into outcomes-based payment.
Who controls the prescriptions and who is gaining ground?
Based on distribution channel, the market is categorized into PBM-affiliated central fill, health-system, independent and retail-affiliated specialty pharmacy. PBM-Affiliated Central Fill led with 68.0% of 2025 value because the three largest dispensers, all tied to PBMs, took about two-thirds of prescription revenue, according to Becker's Hospital Review in April 2026. Retail-affiliated players such as Walgreens and Walmart count store fills as well. Health-System Specialty Pharmacy grows fastest at 9.77% a year as hospital programs reached 28% of accredited sites in 2025, which places dispensing next to the prescribing clinic and its medical records.
Which payers fund dispensing and which group grows fastest?
Based on customer type, the market is categorized into commercially insured members, Medicare beneficiaries, Medicaid beneficiaries and cash-pay and assistance patients. Commercially Insured Members led with 50.0% of 2025 value because employers covered 53.8% of Americans in 2024, according to Census Bureau data reported by Fierce Healthcare. Medicaid remains price-constrained, with KFF showing rebates cutting gross drug spending by 53% on average from fiscal 2019 to fiscal 2024. Medicare Beneficiaries grows fastest at 8.41% a year as the program covered 19.1% of Americans in 2024 and the 2026 Part D cap limits what older patients pay at the counter.
| Segment Group | Leading Sub-segment | Share, 2025 | Fastest-growing Sub-segment | CAGR, 2026–2035 |
|---|---|---|---|---|
| By Therapy Area | Immunology | 38.0% | Rare and Genetic Diseases | 9.28% |
| By Drug Modality | Biologics | 58.0% | Cell and Gene Therapies | 13.77% |
| By Distribution Channel | PBM-Affiliated Central Fill | 68.0% | Health-System Specialty Pharmacy | 9.77% |
| By Customer Type | Commercially Insured Members | 50.0% | Medicare Beneficiaries | 8.41% |
Request a Free Sample
Fill in your details and we'll send you a free sample report.
- Sample data tables & charts
- Research methodology
Orphan approvals and the Part D cap widen treated demand
Expanding specialty-therapy pipeline adds new fills
New approvals remain the most direct source of added dispensing value because most launches now target small, complex patient groups. The FDA drug center approved 46 novel drugs in 2025, and 23 of them carried orphan status while 20 were first in class. Several are dispensed for home use, including Palsonify for acromegaly on Sept. 25, 2025, and Jascayd for idiopathic pulmonary fibrosis on Oct. 7, 2025. Cancer launches in capsule and tablet form followed, with Komzifti on Nov. 13, 2025, and Hyrnuo on Nov. 19, 2025, which added self-administered oncology fills rather than clinic infusions. As a result, Rare and Genetic Diseases expands at 9.28% a year, the quickest pace among therapy groups in the Credence Research model.
Coverage expansion and affordability reform aid persistence
Federal reform matters because abandonment falls when patients can predict what a costly fill will cost them. The Medicare Part D out-of-pocket cap stands at $2,100 for 2026, according to Pharmaceutical Commerce in February 2026, and the first ten negotiated prices took effect on Jan. 1, 2026. In parallel, the CMS Cell and Gene Therapy Access Model covers about 84% of Medicaid beneficiaries with sickle cell disease across 33 states, the District of Columbia and Puerto Rico, according to a CMS release of July 15, 2025. Those states can also draw up to $9.55 million each in federal support. Together these steps underpin the 8.41% annual growth modeled for Medicare Beneficiaries.
High chronic-disease burden sustains long-duration therapy
Disease prevalence sets the floor under dispensing volume because most specialty regimens run for years rather than weeks. The American Cancer Society projects about 2,114,850 new cancer cases and 626,140 cancer deaths in the country during 2026, which keeps oral oncolytic demand large and steady. The National Organization for Rare Disorders counted more than 30 million Americans living with a rare disease in February 2026, or about one in ten residents. Among older adults, about 5.3 million Part D enrollees took one of the 15 drugs chosen for 2027 negotiation during 2024, according to CMS. Those long regimens help explain why Immunology alone held 38.0% of 2025 value.
Subcutaneous launches move therapy into the pharmacy benefit
A newer driver is the shift of intravenous brands into injections that patients or nurses can give outside the hospital, which also complements home infusion therapy programs. Managed Healthcare Executive reported in December 2025 that intravenous drugs usually fall under the medical benefit while subcutaneous versions fall under the pharmacy benefit. Leqembi Iqlik launched in October 2025 at $375 per autoinjector, or $19,500 a year, against a $26,632 annual list price for the infused form. The FDA approved Keytruda Qlex on Sept. 19, 2025, following Opdivo Qvantig in December 2024, although these remain clinician-given and mainly shorten chair time. Leqembi Iqlik is therefore the clearer case of a brand entering pharmacy channels.
Health systems and private-label biosimilars reset access
Rise of hospital-owned dispensing programs
Hospitals are pulling specialty prescriptions back toward the clinic that writes them, which is the clearest channel shift of this decade. Becker's Hospital Review reported on April 21, 2026 that accredited hospital and health-system locations rose from 106 in 2017 to 553 in 2025. The national count passed 1,900 accredited sites, up 3% in a year and more than five times the 2015 figure. Payers are moving the same way, as Elevance Health closed its purchase of Paragon Healthcare on March 11, 2024, adding more than 40 ambulatory infusion centers in eight states. As a result, Health-System Specialty Pharmacy grows at 9.77% a year while central-fill share slowly declines.
Shift toward private-label biosimilar programs
PBM-linked private labels are turning biosimilars from a slow substitution story into a formulary decision made in a single plan year. Samsung Bioepis reported in its second-quarter 2026 review that 92 biosimilar medicines had won approval in the country across 20 molecules by March 2026, with 67 already launched. Adalimumab biosimilars reached 60% share in February 2026, a jump the same review partly attributes to counting Quallent private-label sales. Ustekinumab versions held 27% by the fourth quarter of 2025, which shows the next immunology conversion is already underway. In turn, Cell and Gene Therapies and biosimilar products both outgrow Biologics through 2035.
Opening in cell and gene therapy coordination
Cell and gene therapies create an opening for pharmacies that can coordinate logistics, payer contracts and long follow-up rather than simply ship a product. Combined approvals from the two FDA review centers reached 58 in 2025, which widened the list of complex products needing coordination. The agency also removed REMS programs for six autologous CAR-T therapies, according to Regulatory Focus on June 30, 2025, and cut the required stay near a treatment facility from four weeks to two. Sites outside large academic centers can therefore treat more patients, while manufacturers still owe 15 years of postmarketing follow-up. Pharmacies with outcomes-tracking capability are well placed because CMS ties its sickle cell model to rebates if a therapy fails, and that tracking work has real value.
Opening in rare-disease limited distribution
Rare disease offers the widest unmet need, which favors dispensers that manufacturers trust with small, closely tracked patient groups. The National Organization for Rare Disorders counts more than 10,000 known rare diseases, and fewer than 5% have an approved treatment. New products keep arriving for these patients, including Gomekli on Feb. 11, 2025, Forzinity on Sept. 19, 2025, and Kygevvi on Nov. 3, 2025, according to the FDA. PANTHERx Rare Pharmacy ranked sixth by dispensing revenue among all dispensers on the 2025 list published by Becker's, which shows that a focused independent can reach national scale. Independents with disease-specific nurses can win these launches because contract terms reward data capture.
Negotiated prices and coverage losses squeeze margins
How much will Medicare negotiation take from specialty revenue?
Negotiated prices cut the revenue base directly for pharmacies whose income follows list price. CMS set 2027 discounts of 65% for Otezla, 60% for Pomalyst, 50% for Ibrance and 48% for Xtandi, against 2024 list prices, and estimated USD 12 billion in savings across the 15 drugs. Oncology dispensers feel this first because three of those products are cancer drugs. Fee-based contracts and added clinical services offer the most practical offset for affected pharmacies.
Will coverage losses interrupt therapy for lower-income patients?
Coverage is eroding, which threatens persistence among working-age patients on expensive regimens. AJMC reported on Oct. 22, 2026 that the Commonwealth Fund measured uninsurance among adults 19 to 64 at 11.2% in 2026, up from 8.9% in 2024, while KFF showed effectuated marketplace enrollment falling from 22.1 million in 2025 to 19.2 million in February 2026. The Congressional Budget Office projected that the 2025 reconciliation law will add 10 million uninsured people by 2034, according to KFF in August 2025. Pharmacies carry more unpaid work as a result, so assistance-program staffing becomes a real cost.
What does PBM regulation mean for affiliated dispensers?
Vertical integration faces direct legal attack, which clouds long-range planning for the largest networks. The FTC said in January 2025 that the three largest benefit managers marked up dozens of specialty generics by hundreds and thousands of percent. Arkansas Act 624 banned PBM ownership of pharmacies, although a federal judge blocked it on July 28, 2025, and Tennessee passed a similar ban in May 2026. Federal delinking for Part D then starts in 2028, according to HLTH.
How could the 340B rebate pilot affect hospital programs?
Hospital programs depend on 340B margins, so a move from upfront discounts to rebates can strain their cash flow. A federal court blocked the first HRSA pilot on Dec. 29, 2025, and HRSA then revived it with a Jan. 1, 2027 start, according to Baker Donelson in August 2026. The pilot covers only negotiated-drug-list products, under 5.5% of 2025 340B sales volume, which limits the first exposure. Finance teams still need reserves in case the list widens later.
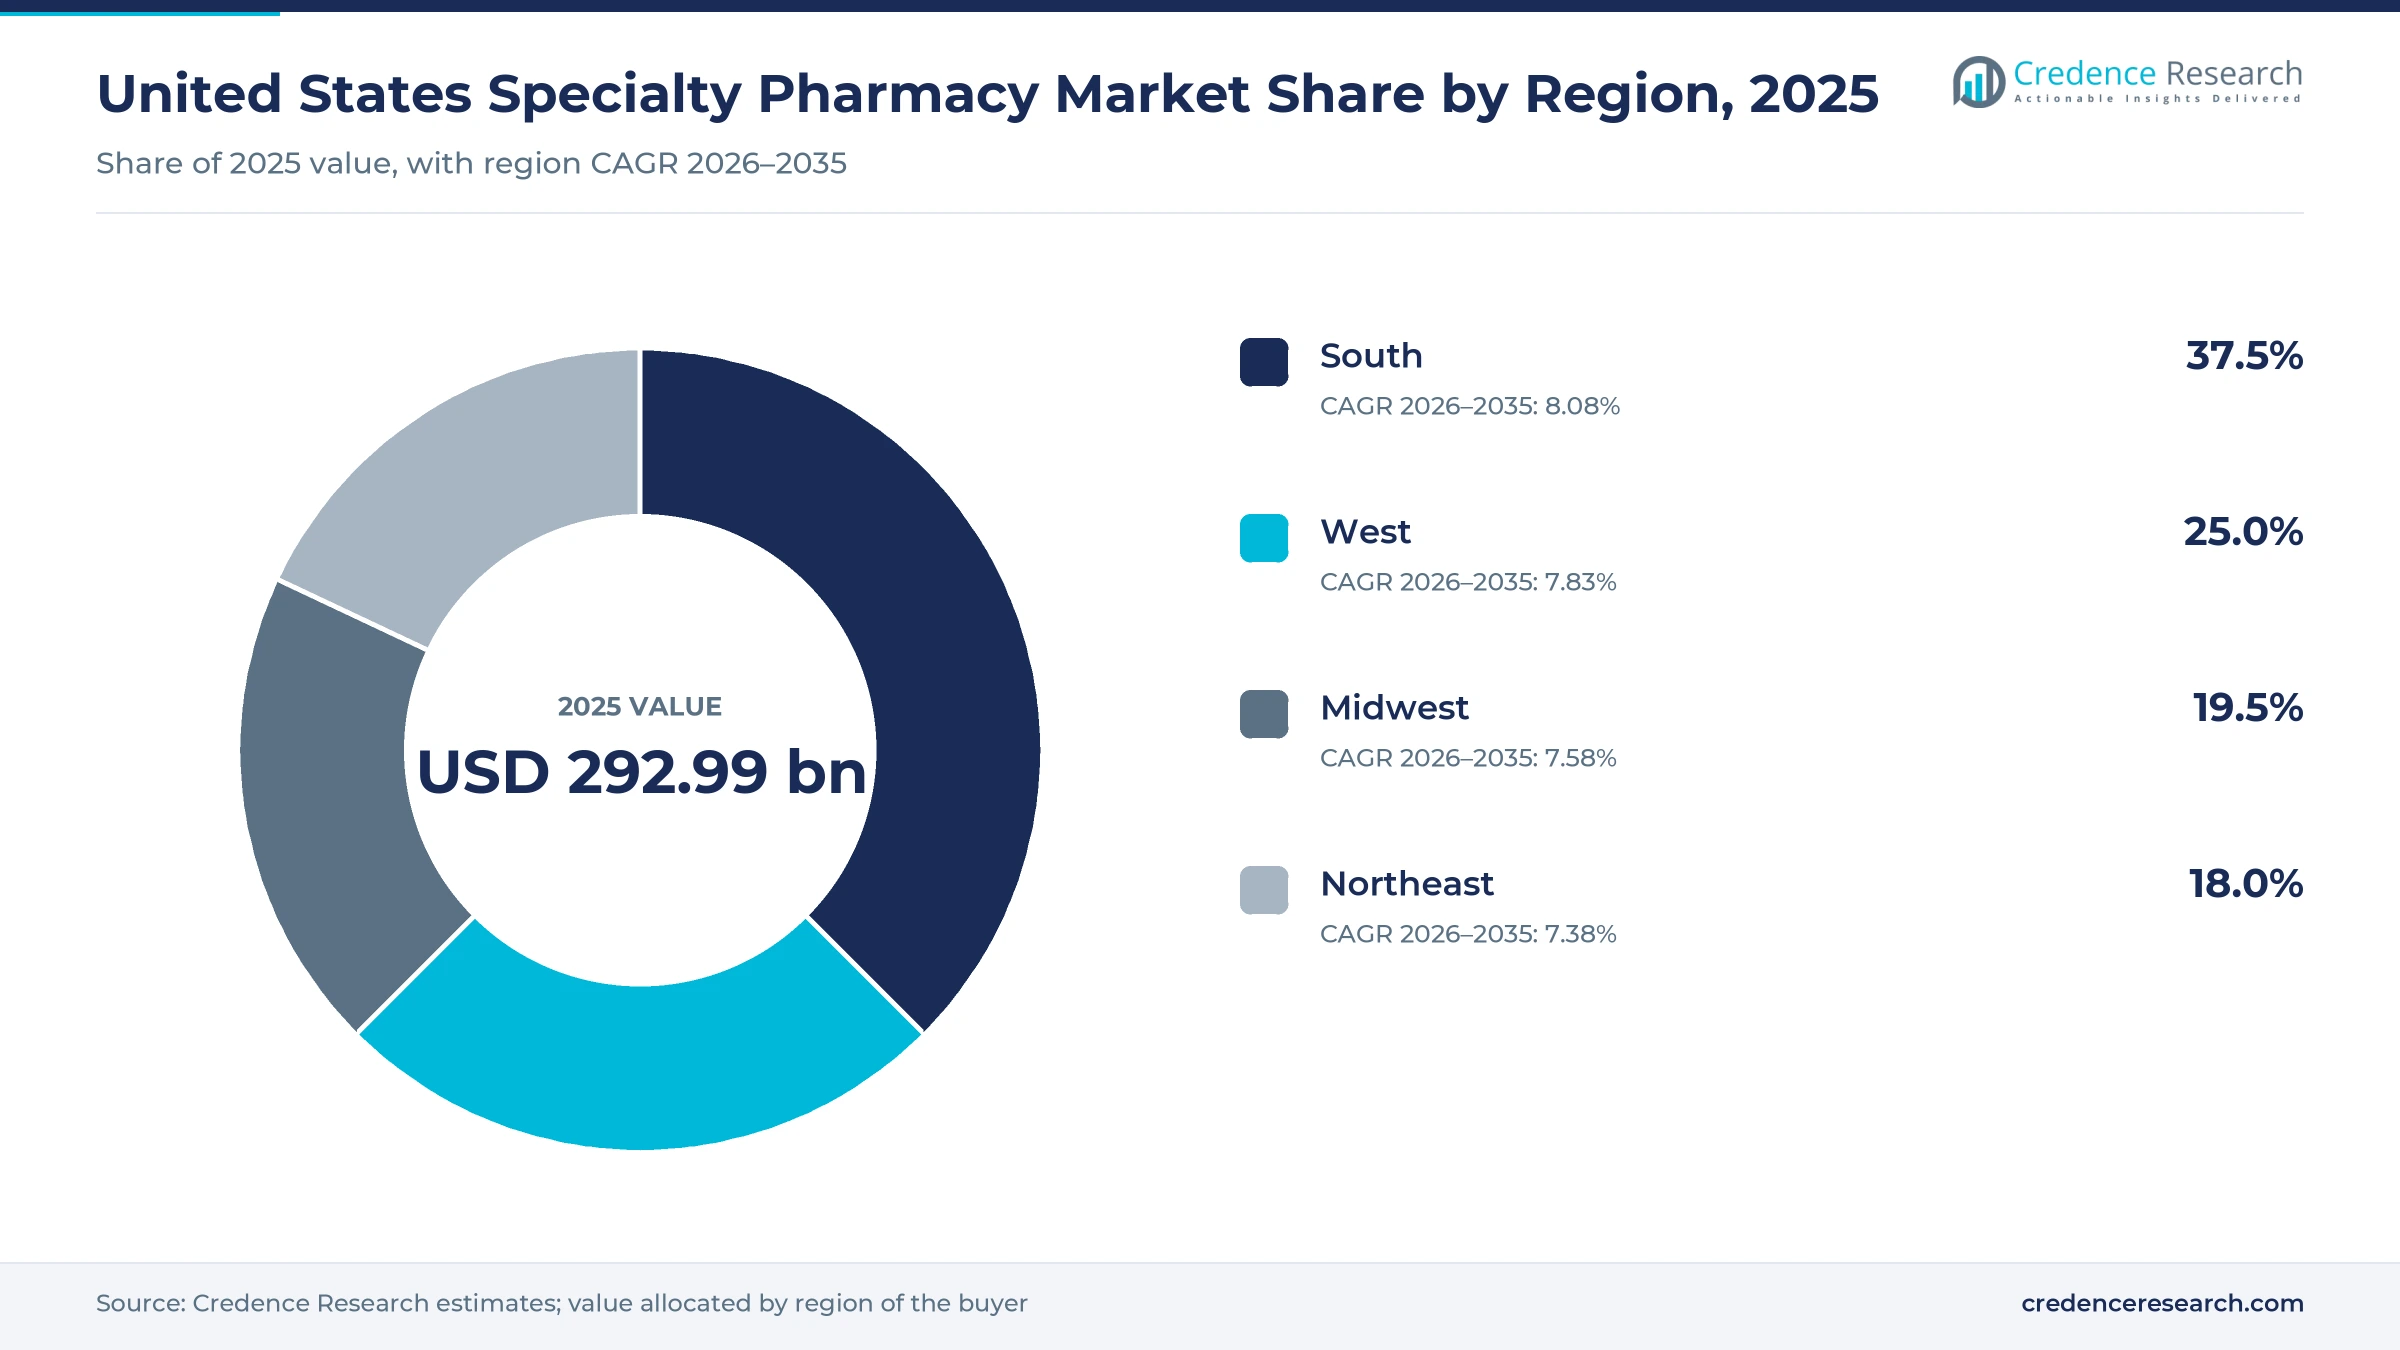
The South holds the largest share of dispensed therapy
| Region | Value, 2025 (USD billion) | Share, 2025 | CAGR, 2026–2035 |
|---|---|---|---|
| South | 109.87 | 37.5% | 8.08% |
| West | 73.25 | 25.0% | 7.83% |
| Midwest | 57.13 | 19.5% | 7.58% |
| Northeast | 52.74 | 18.0% | 7.38% |
South leads on population and adds residents fastest
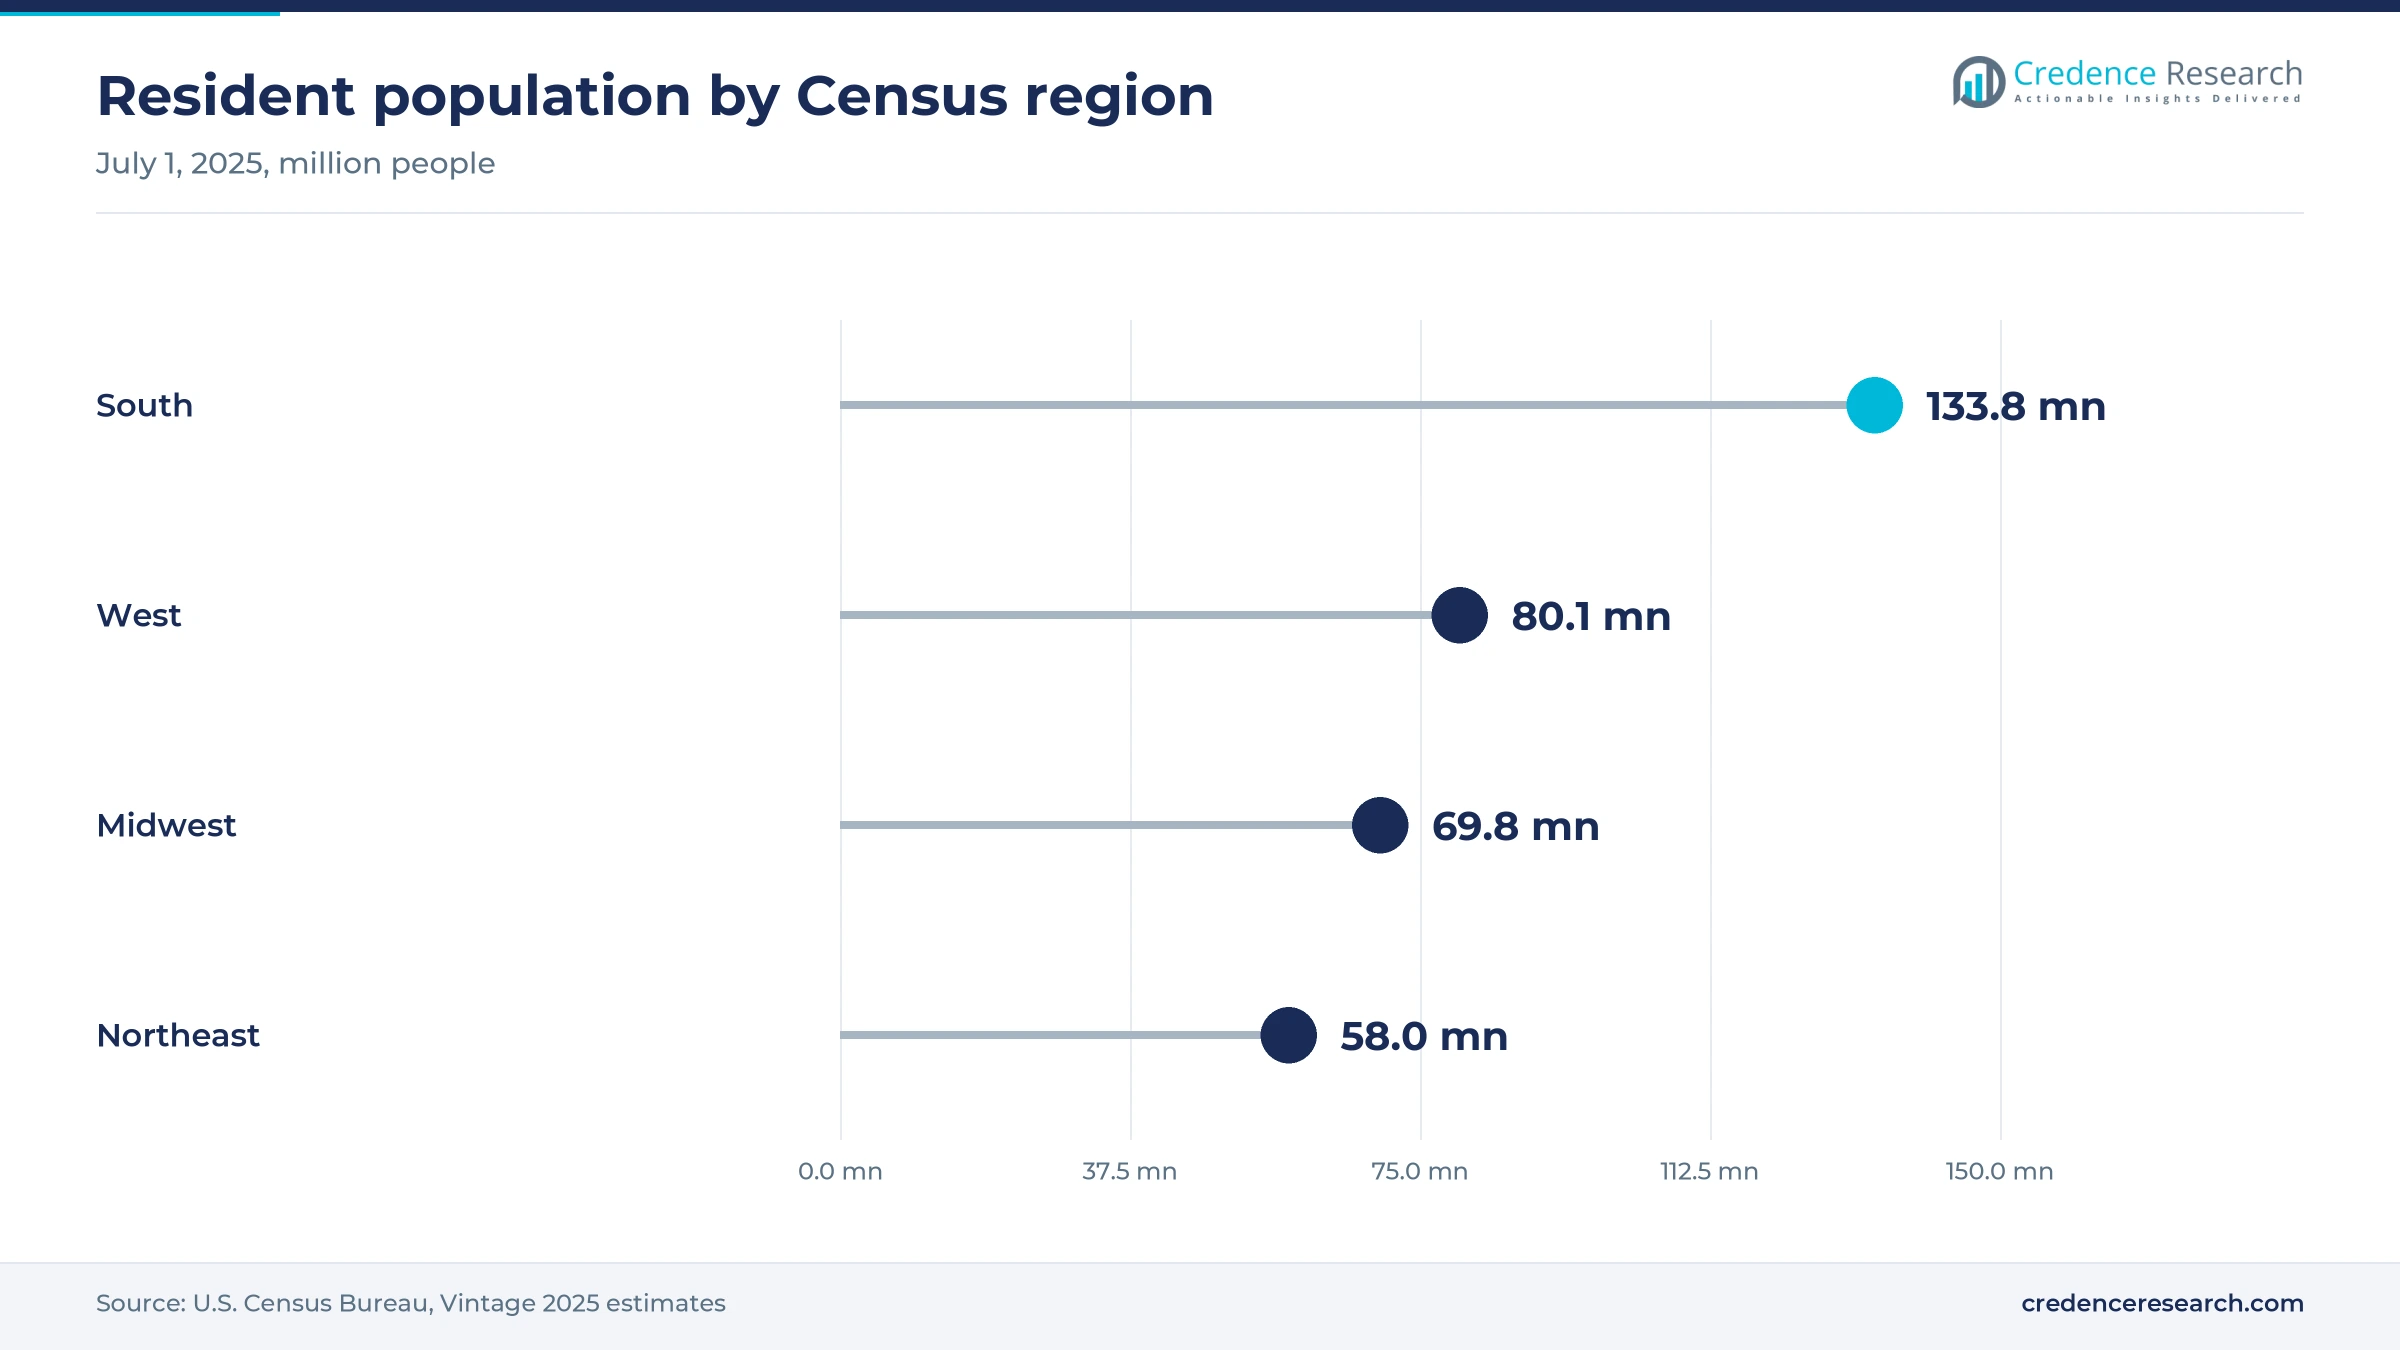
The South held 37.5% of 2025 value and grows at 8.08% a year, the fastest pace among the four regions. Census Bureau estimates released in January 2026 show 133.8 million residents there in July 2025, a gain of about 1.17 million in one year. Texas reached 31.7 million people and Florida 23.5 million, which supports large oncology and immunology patient pools. Plano, Texas, also hosts Paragon Healthcare, the infusion and drug therapy company Elevance Health acquired in March 2024.
West growth depends on large coastal markets and new rules
The West held 25.0% of 2025 value and grows at 7.83% a year, with 80.1 million residents recorded by the Census Bureau for July 2025. California alone accounts for 39.4 million of them, so its rules carry weight across the region. Governor Gavin Newsom signed SB 41 on Oct. 11, 2025, and AMCP reports that it bans spread pricing in plan contracts from Jan. 1, 2026, and bars steering patients to affiliated pharmacies. Independent and health-system dispensers in the state stand to gain from these limits.
Midwest share holds as population gains slow
The Midwest held 19.5% of 2025 value and grows at 7.58% a year, reflecting slower population gains than the South. The Census Bureau counted 69.8 million residents in July 2025, up only about 244,000 from a year earlier, which limits new patient flow across the region. Illinois, with 12.7 million people, has passed the Prescription Drug Affordability Act, which HLTH reports bans steering patients to PBM-owned pharmacies and faces a federal lawsuit from the PBM trade group. Hospital-owned dispensers would benefit most if that law survives its court test.
Northeast grows slowest from a mature, well-served base
The Northeast held 18.0% of 2025 value and grows at 7.38% a year, the slowest pace of the four regions. Census Bureau data show 58.0 million residents in July 2025, a gain of only about 102,000 in a year, while New York stayed flat at 20.0 million people. Slow population growth means value here depends more on therapy mix than on new patients. Credence Research expects dense academic hospital networks in the region to favor hospital-owned dispensing over mail-based central fill.
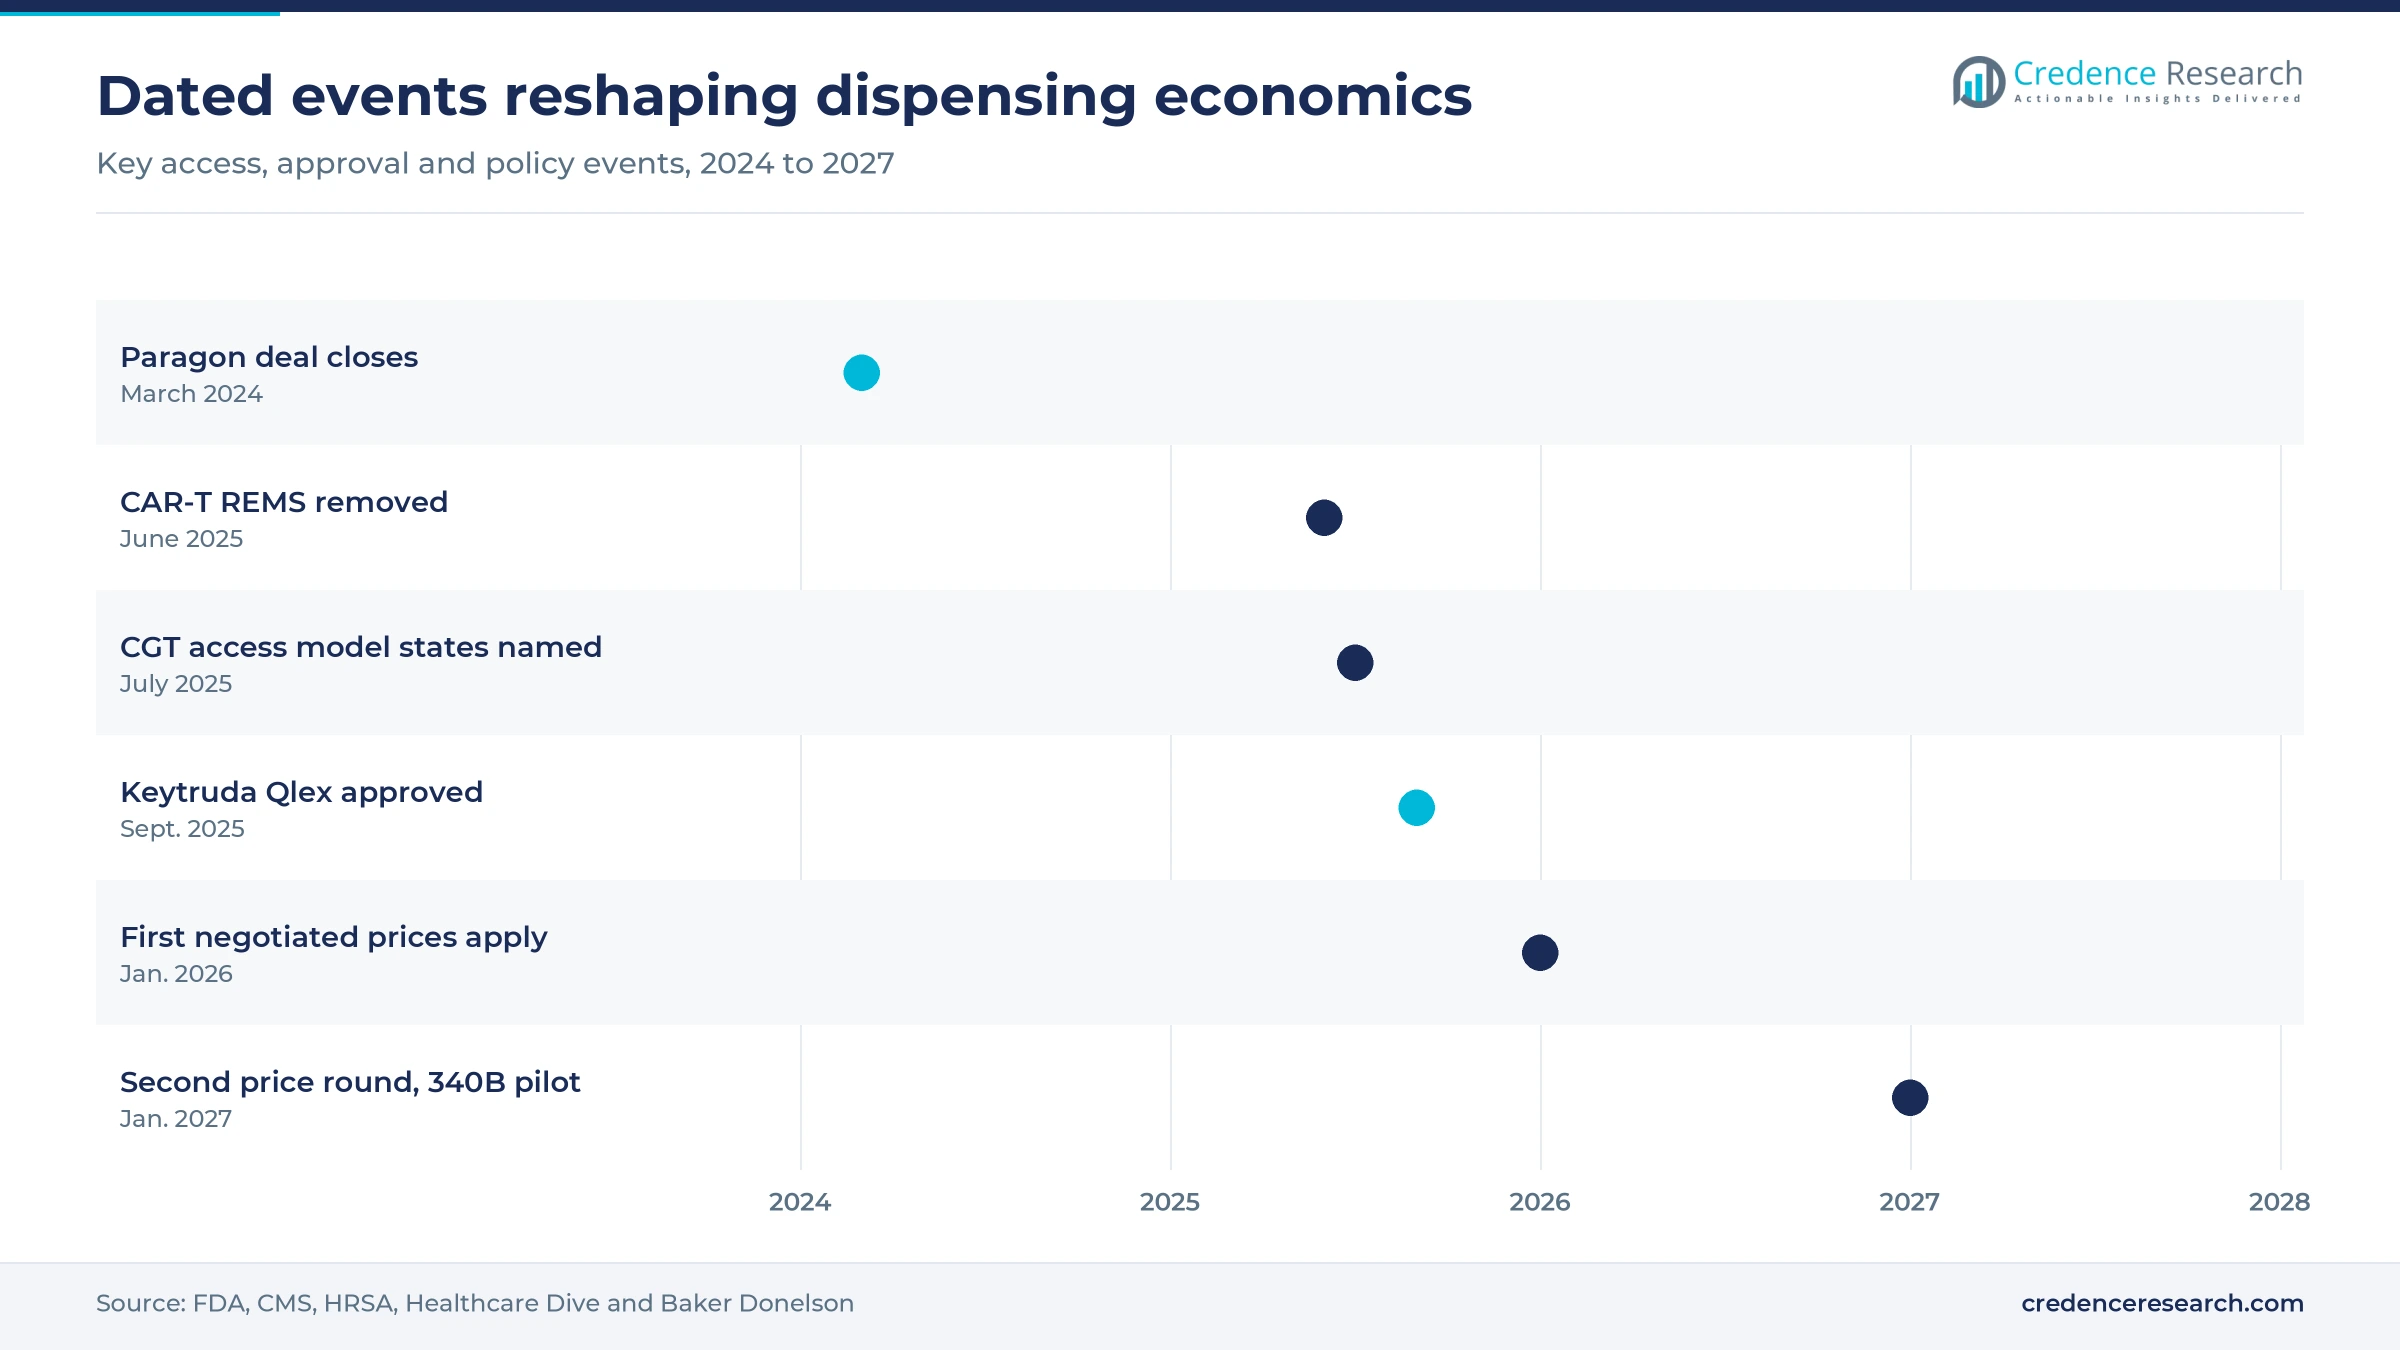
Dated moves reshaping dispensing, access and price
| Development | Status and market relevance |
|---|---|
| In March 2024, Elevance Health closed its purchase of Paragon Healthcare and placed it under CarelonRx. | Completed; brings more than 40 infusion centers and 35,000 patients into a payer-owned platform |
| In June 2025, the FDA removed REMS programs for six autologous CAR-T therapies and shortened post-treatment stay guidance. | In effect; widens the set of sites able to treat patients |
| In July 2025, CMS announced that 33 states, the District of Columbia and Puerto Rico joined its Cell and Gene Therapy Access Model. | Active; outcomes-based sickle cell payment with staged state starts |
| In November 2025, CMS published negotiated 2027 prices for 15 Medicare Part D drugs, including Ibrance, Pomalyst and Xtandi. | Effective 2027; cuts the revenue base on several oral cancer drugs |
| In August 2026, HRSA revived its 340B rebate pilot with a Jan. 1, 2027 effective date after a court had blocked the first version. | Pending; limited to drugs on the Medicare negotiation lists |
Autoinjectors and traceability change the service model
- Subcutaneous autoinjectors take about 15 seconds in the case of Leqembi Iqlik, against an hour-long infusion, which moves training and adherence calls to the pharmacy.
- Drug supply chain tracing under the Drug Supply Chain Security Act requires trading partners, including dispensers, to exchange transaction data at the package level, and the FDA has exempted pharmacies with 25 or fewer full-time employees from certain requirements until Nov. 27, 2027, according to Pharmaceutical Commerce.
- Outcomes tracking supports the rebates that CMS attaches to sickle cell gene therapies when a treatment fails to deliver its promised benefit.
- Post-treatment monitoring continues for CAR-T patients because manufacturers must still follow them for 15 years under postmarketing study requirements set by the FDA.
Need a Custom Version of This Report?
Tailor the scope, geography, or segments to your exact requirements.
- Custom geography or segment scope
- Direct access to our analyst team
Three vertically integrated networks set the terms
Competition centers on network access first and clinical capability second. The 2025 ranking published by Becker's Hospital Review places CVS Specialty first, Accredo second and Optum Specialty Pharmacy third by dispensing revenue, followed by Walgreens Specialty Pharmacy and the combined Onco360 and CareMed business. PANTHERx Rare Pharmacy, CenterWell Specialty Pharmacy, BioPlus with Paragon, AcariaHealth with Foundation Care and Walmart Specialty Pharmacy complete the top ten. The largest three hold their position through plan networks, while oncology and rare-disease specialists compete for manufacturer contracts on data quality and nurse support. Walgreens and Walmart also count fills from their wider retail store networks, which gives them neighborhood reach that central-fill sites lack. Health-system programs compete on a different basis, using shared medical records and fast clinic handoffs to retain patients.
Who ranks where among national dispensers?
| Company | Type | Role in the market |
|---|---|---|
| CVS Specialty | Central fill | Ranked first by 2025 dispensing revenue on the list published by Becker's |
| Accredo | Central fill | Ranked second by 2025 dispensing revenue, listed together with Freedom Fertility |
| Optum Specialty Pharmacy | Central fill | Ranked third by 2025 dispensing revenue among all dispensers |
| Walgreens Specialty Pharmacy | Retail-affiliated | Ranked fourth, with store-based fills counted alongside central sites |
| Onco360 and CareMed Specialty Pharmacy | Oncology specialist | Ranked fifth, as a combined oncology-focused dispensing business |
| PANTHERx Rare Pharmacy | Independent | Ranked sixth, with a focus on rare-disease therapies |
| CenterWell Specialty Pharmacy | Payer-linked | Ranked seventh by 2025 dispensing revenue among all dispensers |
| BioPlus Specialty Pharmacy | Payer-linked | Ranked eighth, listed together with infusion provider Paragon Healthcare |
| AcariaHealth and Foundation Care | Payer-linked | Ranked ninth as a combined dispensing business on the same list |
| Walmart Specialty Pharmacy | Retail-affiliated | Ranked tenth, with Walmart store fills counted in the listing |
Service depth will matter more than dispensing scale
Credence Research's view is that dispensing scale alone will earn less each year through 2035. Negotiated Medicare prices, state limits on spread pricing and federal delinking all reduce the value of a percentage-of-price model. The pharmacies best placed are those that can document clinical outcomes, manage prior authorization and retain patients across long regimens. Hospital-owned programs hold a natural advantage in oncology and transplant, while disease-focused independents can win rare launches. PBM-linked networks will keep most of the value, although their margin mix should move toward fees and away from generic spreads.
How the dispensing value was modeled and checked
The report uses 2025 as the base year and 2035 as the forecast year, with market values taken from the Credence Research model. Regional, segment and customer splits are Credence Research estimates informed by public data and are not reported statistics. Sources include FDA and CMS publications, Census Bureau population estimates, the American Cancer Society, the National Organization for Rare Disorders, KFF, Commonwealth Fund survey coverage and trade press reporting on channel structure. No interviews or surveys were conducted for this edition, so channel shares should be read as modeled ranges.
Volume growth outruns price pressure through 2035
From USD 318.00 billion in 2026, the market is expected to reach USD 625.11 billion by 2035 as treated patient counts rise faster than net price pressure. Therapy mix will keep moving toward rare diseases, and self-injected launches should continue to bring neurology and some oncology brands into pharmacy channels. Medicare negotiation will widen as new drug lists arrive each year, which keeps pressure on oral oncology and immunology revenue. Health-system dispensers should hold a larger share by 2035, although central-fill networks are likely to remain the largest channel throughout the period. Coverage trends remain the main downside risk to this forecast.
Frequently Asked Questions
How big is the United States specialty pharmacy market?
Which therapy area holds the largest share?
Which channel leads specialty dispensing?
Which region leads and which grows fastest?
How does Medicare negotiation affect dispensers?
What is driving hospital-owned dispensing growth?
How are biosimilars changing the market?
Who are the leading companies?
Table of Content
Chapter 1 Market Segmentation
- 1.1 Segmentation Framework
- 1.1.1 Product and Service Classification
- 1.1.2 Application and End-Use Classification
- 1.1.3 Technology and Solution Classification
- 1.1.4 Customer and Distribution Channel Classification
- 1.1.5 Geographic Segmentation
- 1.1.6 Market Segment Definitions and Boundaries
- 1.2 By Therapy Area
- 1.2.1 Immunology
- 1.2.2 Oncology
- 1.2.3 Neurology
- 1.2.4 Rare and Genetic Diseases
- 1.3 By Drug Modality
- 1.3.1 Biologics
- 1.3.2 Small-Molecule Specialty Drugs
- 1.3.3 Biosimilars
- 1.3.4 Cell and Gene Therapies
- 1.4 By Customer Type
- 1.4.1 Commercially Insured Members
- 1.4.2 Medicare Beneficiaries
- 1.4.3 Medicaid Beneficiaries
- 1.4.4 Cash-Pay and Assistance Patients
Chapter 2 Introduction
- 2.1 Report Objectives and Scope
- 2.2 Product Definition and Industry Terminology
- 2.3 Market Inclusions and Exclusions
- 2.4 Research Process
- 2.4.1 Primary Research and Expert Interviews
- 2.4.2 Secondary Research and Source Review
- 2.4.3 Top-Down and Bottom-Up Estimation
- 2.4.4 Data Triangulation and Verification
- 2.5 Market Size Measurement Basis
- 2.5.1 2025: USD 292.99 billion → 2035: USD 625.11 billion
- 2.6 Historical and Forecast Reference Periods
- 2.6.1 Historical Period: 2018-2025
- 2.6.2 Base Year: 2025
- 2.6.3 Forecast Period: 2025-2035
- 2.7 Research Assumptions and Limitations
Chapter 3 Executive Summary
- 3.1 Market Snapshot and Key Findings
- 3.2 Base-Year Market Size, 2025
- 3.3 Forecast Market Size, 2035
- 3.4 Revenue and Volume Growth Outlook
- 3.5 Key Demand and Supply Indicators
- 3.6 Leading Market Segments
- 3.7 Fastest-Growing Market Opportunities
- 3.8 Regional Performance Highlights
- 3.9 Technology and Industry Transformation
- 3.10 Competitive Landscape Summary
- 3.11 Analyst View and Strategic Implications
Chapter 4 United States Specialty Pharmacy Market Trends and Developments
- 4.1 Historical Industry Development, 2018-2025
- 4.2 Recent Market Trends and Developments
- 4.3 Demand and Customer Behavior Trends
- 4.4 Technology and Product Innovation
- 4.5 Artificial Intelligence, Automation and Digitalization
- 4.6 Local Manufacturing and Supply Chain Realignment
- 4.7 Industry Partnerships, Mergers and Acquisitions
- 4.8 Sustainability and Circular Economy Developments
- 4.9 Government and Private Sector Investment Trends
- 4.10 Emerging Business Models and Commercialization
- 4.11 Industry Developments and Announcements
Chapter 5 United States Specialty Pharmacy Market Production, Supply and Demand Analysis
- 5.1 Demand Trend and Consumption Analysis, 2018-2025
- 5.2 Demand Forecast, 2025-2035
- 5.3 Production and Output Trend, 2018-2025
- 5.4 Production and Output Forecast, 2025-2035
- 5.5 Installed Capacity and Capacity Utilization
- 5.6 Company-Wise Production Plants and Statistics
- 5.6.1 Installed Production Capacity
- 5.6.2 Actual Production
- 5.6.3 Planned Capacity and Expansion Targets
- 5.7 Supply Chain Structure and Procurement Trends
- 5.8 Supply-Demand Gap and Bottlenecks
- 5.9 Import Dependence and Sourcing Structure
- 5.10 Contract Manufacturing and Outsourcing
- 5.11 Regional Supply and Demand Concentration
Chapter 6 United States Specialty Pharmacy Market Pricing Analysis
- 6.1 Pricing Structure and Measurement
- 6.2 Historical Pricing Trends, 2018-2025
- 6.3 Pricing Outlook, 2025-2035
- 6.4 Average Selling Price and Unit Economics
- 6.5 Pricing by Product and Market Segment
- 6.6 Geographic Pricing Differences
- 6.7 Key Input, Energy, Labor and Logistics Costs
- 6.8 Contract Pricing and Purchasing Models
- 6.9 Pricing Sensitivity and Competitive Positioning
- 6.10 Price, Margin and Profitability Implications
Chapter 7 United States Specialty Pharmacy Market Dynamics
- 7.1 Market Growth Drivers
- 7.1.1 Demand-Side Drivers
- 7.1.2 Technology and Innovation Drivers
- 7.1.3 Infrastructure and Investment Drivers
- 7.1.4 Regulatory and Policy Drivers
- 7.2 Market Restraints
- 7.2.1 Cost and Affordability Constraints
- 7.2.2 Technology and Adoption Barriers
- 7.2.3 Supply Chain and Operational Constraints
- 7.3 Market Challenges
- 7.3.1 Competitive Pressure and Margin Erosion
- 7.3.2 Skills, Infrastructure and Implementation Gaps
- 7.4 Emerging Market Opportunities
- 7.5 Market Dynamics Impact and Time-Horizon Assessment
Chapter 8 United States Specialty Pharmacy Value Chain Analysis
- 8.1 Industry Value Chain Overview
- 8.2 Upstream Suppliers and Critical Inputs
- 8.3 Technology and Component Providers
- 8.4 Manufacturing or Service Delivery
- 8.5 Distribution, Channel Partners and Integrators
- 8.6 Downstream Applications and End Users
- 8.7 Value Addition and Profit Pools
- 8.8 Vertical Integration and Outsourcing
- 8.9 Supplier Concentration and Risk
- 8.10 Supply Chain Localization and Resilience
Chapter 9 United States Specialty Pharmacy Market Regulations and Policies
- 9.1 Relevant Laws, Standards and Compliance Frameworks
- 9.2 Product, Service, Safety and Quality Requirements
- 9.3 Government Policies, Incentives and Subsidies
- 9.4 Imports, Exports and Trade Barriers
- 9.5 Public Procurement and Local Content Requirements
- 9.6 Environmental and Sustainability Compliance
- 9.7 Upcoming Policy Changes and Market Implications
Chapter 10 United States Specialty Pharmacy Market Hotspots and Opportunities
- 10.1 Market Opportunity Mapping and Growth Hotspots
- 10.2 High-Growth Applications and Customer Groups
- 10.3 Underserved Markets and White-Space Opportunities
- 10.4 Emerging Technology and Product Opportunities
- 10.5 New Capacity and Investment Hotspots
- 10.6 Market Entry and Expansion Opportunities
- 10.7 Distribution and Partnership Opportunities
- 10.8 Near-Term and Long-Term Commercial Potential
- 10.9 Opportunity Attractiveness and Execution Risks
Chapter 11 United States Specialty Pharmacy Market Outlook, 2025-2035
- 11.1 Market Size and Analysis
- 11.1.1 Revenue (Market Measurement: 2025: USD 292.99 billion → 2035: USD 625.11 billion)
- 11.1.2 Market Volume and Quantity Sold
- 11.1.3 Historical Market Size, 2018-2025
- 11.1.4 Base-Year Market Size, 2025
- 11.2 Market Forecast, 2025-2035
- 11.2.1 Revenue Forecast to 2035
- 11.2.2 Volume Forecast to 2035
- 11.2.3 CAGR and Year-on-Year Growth
- 11.2.4 Incremental Revenue Opportunity
- 11.3 Forecast Assumptions and Scenario Analysis
- 11.3.1 Base-Case Forecast
- 11.3.2 Optimistic and Conservative Scenarios
- 11.3.3 Technology, Pricing and Policy Sensitivities
- 11.4 Market Attractiveness and Growth Outlook
Chapter 12 United States Specialty Pharmacy Market Segmentation and Outlook
- 12.1 Segmentation Summary and Market Shares, 2025
- 12.2 Largest and Fastest-Growing Segments
- 12.3 By Therapy Area - Market Size and Forecast, 2025-2035
- 12.3.1 Segment Definition and Scope
- 12.3.2 Historical Market Size, 2018-2025
- 12.3.3 Revenue Forecast, 2025-2035
- 12.3.4 Volume Forecast, 2025-2035
- 12.3.5 Base-Year Market Share, 2025
- 12.3.6 Segment CAGR and Growth Drivers
- 12.3.7 Subsegment Market Size and Forecast
- 12.3.7.1 Immunology
- 12.3.7.2 Oncology
- 12.3.7.3 Neurology
- 12.3.7.4 Rare and Genetic Diseases
- 12.3.8 Subsegment Pricing and Adoption Trends
- 12.3.9 Leading Suppliers and Competition
- 12.3.10 Regional Demand and Opportunities
- 12.4 By Drug Modality - Market Size and Forecast, 2025-2035
- 12.4.1 Segment Definition and Scope
- 12.4.2 Historical Market Size, 2018-2025
- 12.4.3 Revenue Forecast, 2025-2035
- 12.4.4 Volume Forecast, 2025-2035
- 12.4.5 Base-Year Market Share, 2025
- 12.4.6 Segment CAGR and Growth Drivers
- 12.4.7 Subsegment Market Size and Forecast
- 12.4.7.1 Biologics
- 12.4.7.2 Small-Molecule Specialty Drugs
- 12.4.7.3 Biosimilars
- 12.4.7.4 Cell and Gene Therapies
- 12.4.8 Subsegment Pricing and Adoption Trends
- 12.4.9 Leading Suppliers and Competition
- 12.4.10 Regional Demand and Opportunities
- 12.5 By Customer Type - Market Size and Forecast, 2025-2035
- 12.5.1 Segment Definition and Scope
- 12.5.2 Historical Market Size, 2018-2025
- 12.5.3 Revenue Forecast, 2025-2035
- 12.5.4 Volume Forecast, 2025-2035
- 12.5.5 Base-Year Market Share, 2025
- 12.5.6 Segment CAGR and Growth Drivers
- 12.5.7 Subsegment Market Size and Forecast
- 12.5.7.1 Commercially Insured Members
- 12.5.7.2 Medicare Beneficiaries
- 12.5.7.3 Medicaid Beneficiaries
- 12.5.7.4 Cash-Pay and Assistance Patients
- 12.5.8 Subsegment Pricing and Adoption Trends
- 12.5.9 Leading Suppliers and Competition
- 12.5.10 Regional Demand and Opportunities
- 12.6 Segment Growth Comparison
- 12.7 Segment Attractiveness and Priority Matrix
Chapter 13 United States Specialty Pharmacy End-Use and Application Market Outlook
- 13.1 End-Use Industry and Customer Demand Structure
- 13.2 Leading Applications and Customer Groups
- 13.3 End-Use Market Size, Share and Forecast
- 13.4 Major End-Use Industry Deep Dives
- 13.4.1 Customer Requirements and Use Cases
- 13.4.2 Demand and Replacement Cycles
- 13.4.3 Technical and Regulatory Considerations
- 13.4.4 Purchasing and Procurement Models
- 13.4.5 Leading Vendors and Distribution Channels
- 13.4.6 Forecast and Commercial Opportunities
- 13.5 Emerging Applications and Cross-Segment Demand
- 13.6 End-Use Industry Investment Priorities
Chapter 14 United States Specialty Pharmacy Geographic Market Outlook, 2025-2035
- 14.1 Domestic Market Distribution and Demand Clusters
- 14.2 State- or Province-Wise Market Size and Forecast, 2025-2035
- 14.3 City and Metropolitan Market Outlook
- 14.4 Industrial, Manufacturing and Commercial Clusters
- 14.5 Geographic Concentration of Key End Users
- 14.6 Local Pricing and Purchasing Differences
- 14.7 Domestic Production Facilities and Capacity Map
- 14.8 Local Infrastructure and Project Pipeline
- 14.9 State-Level Policy and Incentive Differences
- 14.10 Subnational Investment Hotspots and Opportunities
- 14.11 Distribution and Logistics Networks
- 14.12 Domestic Competitive Footprint
Chapter 15 United States Specialty Pharmacy Technology, Innovation and Sustainability Outlook
- 15.1 Technology Landscape and Maturity
- 15.2 Product, Process and Service Innovation
- 15.3 AI, Automation and Digital Tools in the Industry
- 15.4 Technology Adoption and Performance Benchmarking
- 15.5 Innovation Pipeline and R&D Investment
- 15.6 Patent and Intellectual Property Trends
- 15.7 Energy Efficiency and Resource Management
- 15.8 Sustainability, Recycling and Circularity
- 15.9 Technology Roadmap, 2025-2035
- 15.10 Risks of Obsolescence and Technology Substitution
Chapter 16 United States Specialty Pharmacy Market Key Strategic Imperatives
- 16.1 Growth and Market Entry Priorities
- 16.2 High-Return Products and Segments
- 16.3 Pricing, Profitability and Cost Optimization
- 16.4 Technology Investment and Product Differentiation
- 16.5 Supply Chain Localization and Resilience
- 16.6 Distribution and Customer Acquisition
- 16.7 Partnership, Acquisition and Capacity Strategy
- 16.8 Regional Expansion Priorities
- 16.9 Short-, Medium- and Long-Term Actions
Chapter 17 Competition Outlook
- 17.1 Industry Competition Characteristics
- 17.2 Market Structure and Concentration
- 17.3 Market Share and Competitive Positioning, 2025
- 17.4 Company-Wise Revenue and Product Benchmarking
- 17.5 Production and Service Capacity Benchmarking
- 17.6 Technology, Pricing and Differentiation
- 17.7 Regional Footprint and Distribution Strength
- 17.8 Mergers, Acquisitions and Strategic Alliances
- 17.9 New Entrants and Competitive Threats
- 17.10 Porter's Five Forces and Industry Attractiveness
- 17.11 Competitive Outlook, 2025-2035
Chapter 18 Company Profiles
- 18.1 Company Coverage and Selection Criteria
- 18.2 CVS Specialty
- 18.2.1 Business Description
- 18.2.2 Company Ownership and Geographic Presence
- 18.2.3 Product and Service Portfolio
- 18.2.4 Manufacturing and Operating Footprint
- 18.2.5 Production Capacity and Expansion Plans
- 18.2.6 Financial Performance and Investment
- 18.2.7 Market Share and Competitive Position
- 18.2.8 Technology and Innovation Capabilities
- 18.2.9 Strategic Alliances or Partnerships
- 18.2.10 Recent Developments
- 18.2.11 Growth Strategy and Outlook
- 18.3 Accredo
- 18.4 Optum Specialty Pharmacy
- 18.5 Walgreens Specialty Pharmacy
- 18.6 Onco360 and CareMed Specialty Pharmacy
- 18.7 CenterWell Specialty Pharmacy
- 18.8 BioPlus Specialty Pharmacy
- 18.9 PANTHERx Rare Pharmacy
- 18.10 Walmart Specialty Pharmacy
- 18.11 AcariaHealth and Foundation Care
- 18.12 Other Relevant Market Participants
Note: Every listed company is profiled on the structure shown under the first company. The company list is preliminary and may change based on research findings, market developments, data availability and client requirements.
Chapter 19 Disclaimer
- 19.1 Research and Forecast Disclaimer
- 19.2 Data Source and Estimation Limitations
Note: The depth of individual sections depends on data availability for this market. Volume, capacity, trade and other unit-based metrics are included where applicable.