
Small-city shoppers and Gen Z buyers widen fashion demand
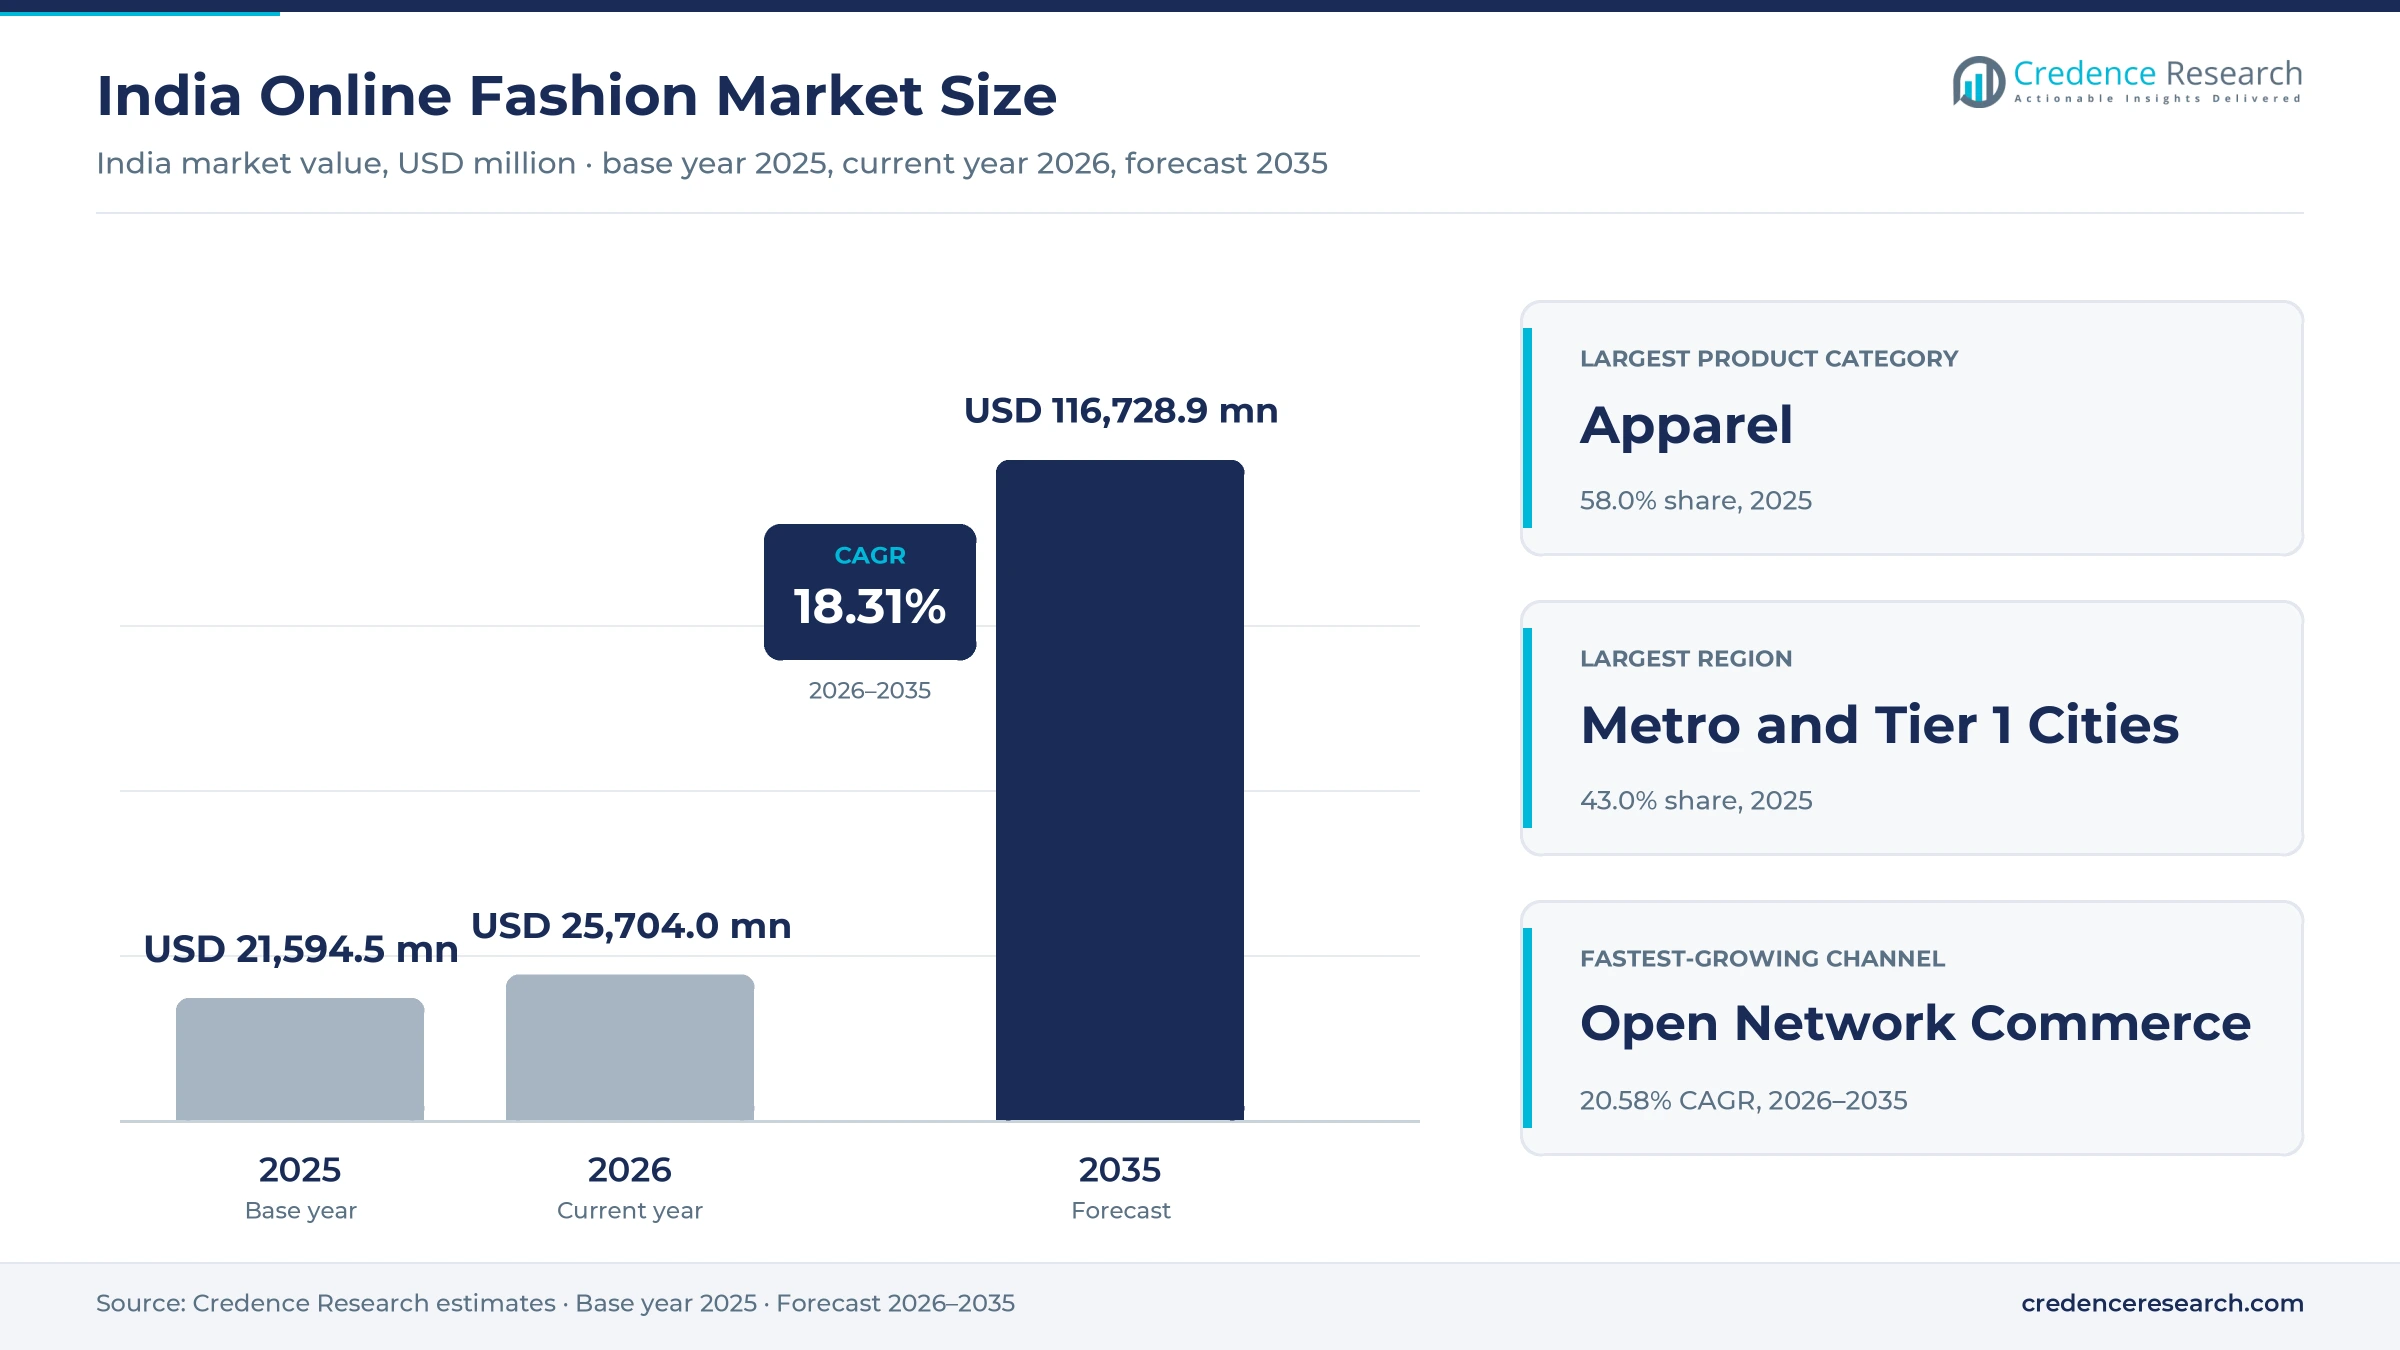
The India online fashion market was valued at USD 21.59 billion in 2025 and is projected to increase from USD 25.70 billion in 2026 to USD 116.73 billion by 2035, registering a CAGR of 18.31% during 2026–2035. Demand comes from Gen Z and millennial shoppers, family households and occasion-led buyers who purchase clothing, footwear, accessories, jewellery and bags through marketplaces, fashion apps and brand websites. Metro and Tier 1 Cities held the largest regional share, 43.0% in 2025, because large cities have the highest incomes, the most brands and the fastest delivery. Rural Areas and Smaller Towns is the fastest-growing region at 19.58% a year, as cheaper data, digital payments and value-priced platforms bring new buyers online. In turn, the GST rate on readymade garments up to 2,500 rupees per piece fell to 5% from Sept. 22, 2025, which lowers prices for most mass-market apparel orders.
Which fashion products and channels does the estimate cover?
The estimate measures the value of fashion goods bought online in India, including apparel, footwear, fashion accessories, jewellery and watches, and bags and luggage. It counts sales through multi-category marketplaces, fashion-specialist marketplaces, brand-owned websites, social commerce and open network commerce.
The estimate excludes offline store sales, beauty products, home textiles and secondhand resale. The value chain runs from mills, garment makers and brands through marketplace sellers, warehouses and courier networks to shoppers in metro cities, smaller cities and rural districts.
India Online Fashion Market Insights
- The India online fashion market was valued at USD 21.59 billion in 2025 and is projected to reach USD 116.73 billion by 2035, registering a CAGR of 18.31% during 2026–2035.
- Metro and Tier 1 Cities held a 43.0% share of 2025 value, because large cities have the highest incomes and fastest delivery.
- Apparel led with a 58.0% share of 2025 value, because clothing is bought most often and has the widest range of styles online.
- Meesho listed on Indian stock exchanges on Dec. 10, 2025, at a 45.23% premium to its issue price of 111 rupees.
- Myntra said in December 2025 that more than 70% of its new customers in 2025 came from non-metro areas.
Apparel leads as open network commerce grows fastest
Why does apparel hold the largest share of fashion orders?
Based on product category, the market is categorized into apparel, footwear, fashion accessories, jewellery and watches, and bags and luggage. Apparel led with a 58.0% share of 2025 value, because clothing is bought often for daily wear, work, festivals and weddings. Jewellery and Watches grows fastest at 18.91% a year, as platforms add thousands of jewelry brands and shoppers buy festive pieces online.
How do Gen Z shoppers change the customer mix?
Based on customer type, the market is categorized into Gen Z shoppers, millennials, family households, affluent digital shoppers and occasion-led buyers. Millennials led with a 36.0% share of 2025 value, because working adults buy the widest range of clothing and footwear. Gen Z Shoppers grow fastest at 19.40% a year, as young buyers follow weekly trend drops and creator content.
Which channels capture most digital fashion spending?
Based on distribution channel, the market is categorized into multi-category marketplaces, fashion-specialist marketplaces, brand-owned D2C websites, social commerce and open network commerce. Multi-category Marketplaces led with a 46.0% share of 2025 value, because large platforms combine fashion with electronics and household goods. Open Network Commerce grows fastest at 20.58% a year, as small sellers join the government-backed network.
| Segment Group | Leading Sub-segment | Share, 2025 | Fastest-growing Sub-segment | CAGR, 2026–2035 |
|---|---|---|---|---|
| By Product Category | Apparel | 58.0% | Jewellery and Watches | 18.91% |
| By Customer Type | Millennials | 36.0% | Gen Z Shoppers | 19.40% |
| By Distribution Channel | Multi-category Marketplaces | 46.0% | Open Network Commerce | 20.58% |
Request a Free Sample
Fill in your details and we'll send you a free sample report.
- Sample data tables & charts
- Research methodology
Shopper reach, payments and seller tools drive orders
How do smaller-city and Gen Z shoppers expand demand?
Smaller-city and Gen Z shoppers expand demand, because new buyers outside the largest metros now shop for clothing and footwear on their phones. More than 70% of Myntra's new customers in 2025 came from non-metro areas, and Gen Z made up about half of its active base, according to India CSR. Myntra also expected about 200 million annual active users by the end of 2025. During Flipkart's sale event in October 2026, non-metro customers contributed about 60% of demand, and new customers rose 34%. As a result, Tier 2 and Tier 3 Cities hold 39.0% of 2025 value, close to the metro share.
Why do digital payments and connectivity deepen buying?
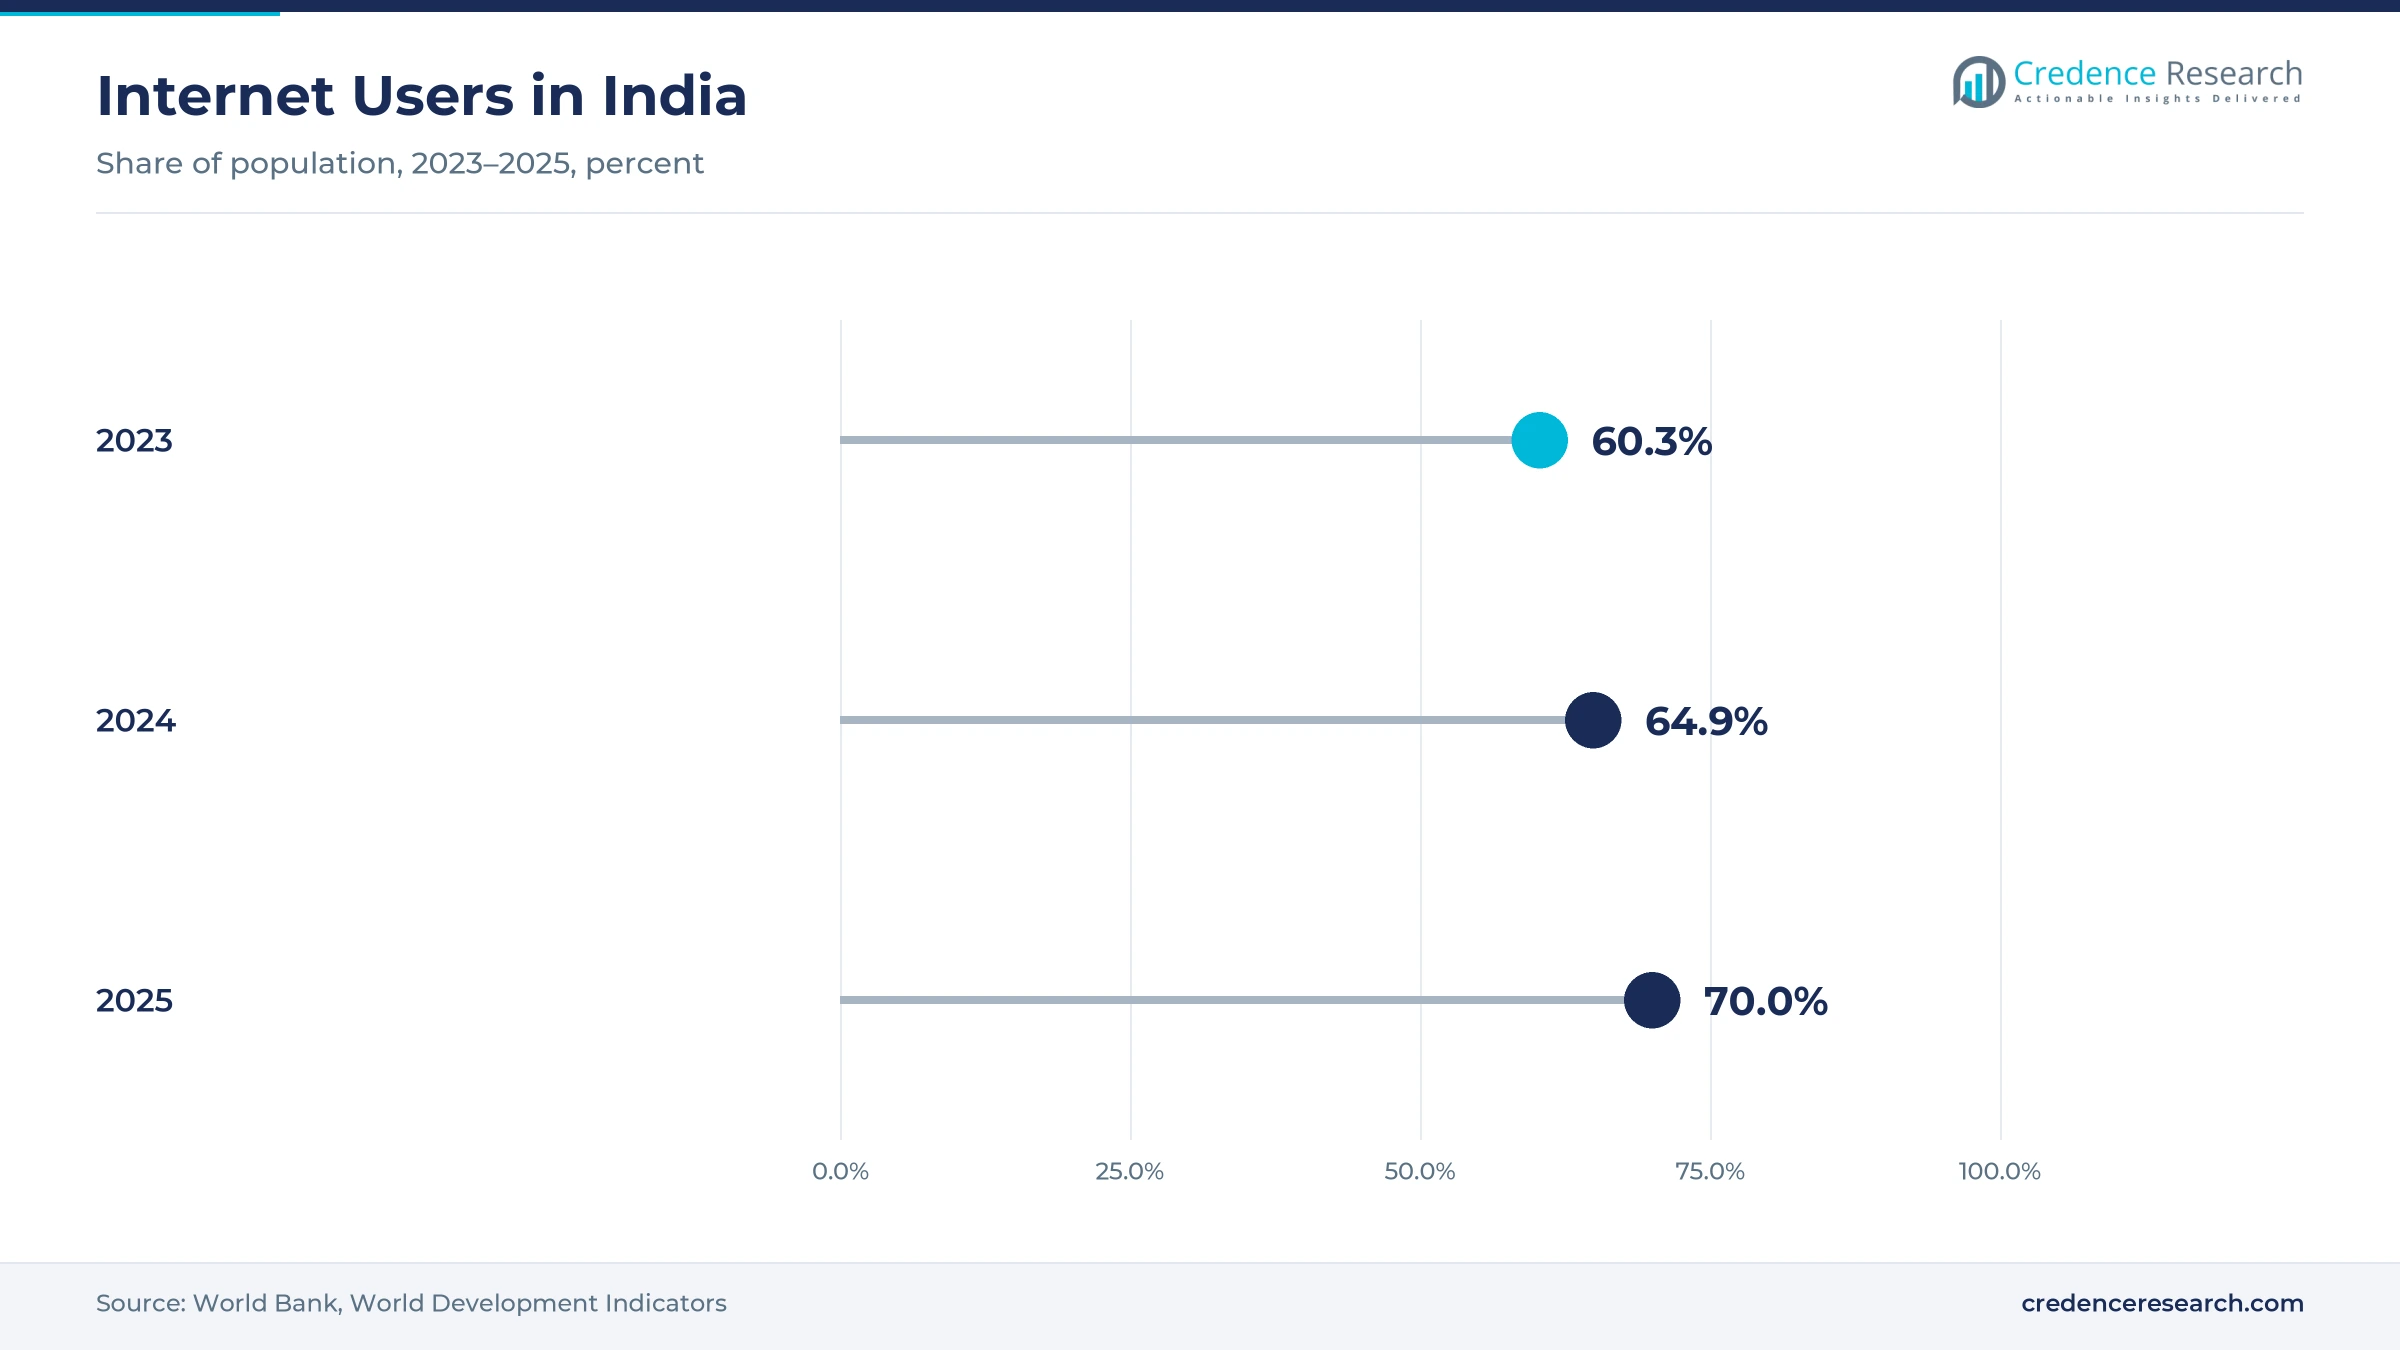
Digital payments and connectivity deepen buying, because shoppers who pay instantly by phone order more often and refuse fewer parcels. UPI handled a record 21.63 billion transactions in December 2025, up 29% from a year earlier, according to Entrackr. That equals about 698 million payments a day across the country. Internet use reached 70% of the population in 2025, up from 60.3% in 2023, according to the World Bank. In turn, online buying spreads from apparel to footwear, accessories and gemstone and jewelry pieces, as payment and data costs stop being a barrier for first-time shoppers in smaller towns and villages.
How do trend-first commerce and seller digitization lift supply?
Trend-first commerce and seller digitization lift supply, because platforms now help small manufacturers and brands list new styles within days. Meesho had 234.20 million annual transacting users and 706,471 annual transacting sellers in the 12 months to September 2025, according to 5paisa. Myntra's FWD format offers about 500,000 trend-focused styles with about 8,000 drops each week. Myntra also carries more than 4 million trend-first styles across global, domestic and D2C brands. Sellers can test a design in small batches and restock quickly if it sells. As a result, Gen Z shoppers grow at 19.40% a year, the fastest customer rate, as weekly drops reward frequent visits.
Why do lower GST rates support mass-market fashion?
Lower GST rates support mass-market fashion, because most clothing and shoes sold online carry modest price tags. The GST rate on readymade garments costing up to 2,500 rupees per piece fell to 5% from Sept. 22, 2025, according to All India Radio. Footwear priced up to 2,500 rupees also moved out of the 12% slab under the same reform package announced in September 2025. Rates on man-made fibers and yarns fell as well, which eases input costs for garment makers and small textile units. In turn, apparel holds 58.0% of 2025 value, and demand for women's clothing and value footwear benefits from lower checkout prices.
Fast delivery, trend drops and tax cuts reshape buying
How is the rise of 30-minute delivery changing fashion orders?
The rise of 30-minute delivery is changing fashion orders, because shoppers now expect last-minute outfits and gifts to arrive within hours. Myntra's M-Now service delivers in as little as 30 minutes and accounted for 10% of orders in live locations by December 2025. In February 2026, Myntra expanded M-Now to Patna, Jaipur, Lucknow and Ahmedabad, taking the service to 10 markets backed by more than 87 dark stores. Reliance expanded AJIO Rush to 420 pin codes across 10 cities in the quarter ended Dec. 31, 2025. As a result, fashion platforms place stock closer to buyers, and occasion-led purchases such as party and festive outfits move online.
Why is the shift to creator-led discovery gaining pace?
The shift to creator-led discovery is gaining pace, because young shoppers find new styles through videos and reviews rather than catalog pages. Myntra counted 3.5 million shopper creators in its community by December 2025. Monthly active users on the platform reached a record 80 million during the 2025 festive season. Gen Z customer acquisitions on Myntra doubled in two years, which deepens the audience for short videos, live sessions and styling posts. In turn, social commerce grows faster than the market average, and brands invest in creator programs to turn content views into orders for activewear, casualwear and festive clothing.
Can open network commerce help small sellers reach buyers?
Open network commerce can help small sellers reach buyers, because the government-backed network lets any compatible app list products from any seller. The network handled 12 million orders in July 2024, including 600,000 fashion orders, according to official data. About 630,000 sellers and service providers were on the network at that time, across 600 cities in many states. Lower GST rates on garments from September 2025 also help small sellers compete on price. As a result, open network commerce grows at 20.58% a year, the fastest channel rate, from a small base as sellers in textile towns list directly on shopping apps.
Is there an opening in jewelry and festive wear online?
Jewelry and festive wear offer a clear opening, because shoppers now buy wedding and festival pieces online with confidence. Myntra listed more than 2,100 jewellery brands by December 2025, and its jewellery sales grew 80% during the festive period. Orders in Patna, Jaipur, Lucknow and Ahmedabad doubled during the 2025 Diwali season, according to Myntra. Nykaa Fashion GMV rose 18% year on year in the January to March 2025 quarter, which shows wider demand for premium labels. In turn, jewellery and watches grow at 18.91% a year, the fastest product rate, as platforms add certified pieces, easy returns, gift wrapping and festive gifting options.
Returns, discounting and fit issues test platform margins
How do high return rates cut platform margins?
High return rates cut platform margins, because shoppers often send back clothing and shoes that do not fit or match photos. Each return needs a pickup, quality check and repackaging before resale. As a result, low-priced orders can lose money after reverse logistics costs. Platforms respond with size charts, fit prediction tools, try-and-buy options and return fees on repeat cases, which reduce avoidable returns across categories.
Why does heavy discounting pressure brands and sellers?
Heavy discounting pressures brands and sellers, because large sale events train shoppers to wait for price cuts. Sellers then accept thin margins to stay visible during festive campaigns. In turn, smaller brands struggle to fund marketing and product quality at the same time. Platforms and brands respond with private labels, trend-first ranges and loyalty programs that reward full-price purchases outside major sale periods.
How do delivery gaps limit reach in remote districts?
Delivery gaps limit reach in remote districts, because villages far from sorting hubs face longer delivery times and fewer payment options. Couriers find it hard to serve low-density routes at low cost. As a result, rural buyers see fewer styles and slower returns than city shoppers. Platforms respond with partner pickup points, regional warehouses and shared delivery networks that raise the number of parcels per route.
Why do counterfeit and quality concerns weigh on trust?
Counterfeit and quality concerns weigh on trust, because some listings show branded goods or materials that differ from the delivered product. First-time shoppers are most likely to stop buying after a bad experience. In turn, platforms risk losing new users in smaller cities. Companies respond with seller verification, brand authorization programs, review checks and quick refunds that protect buyers and honest sellers alike.
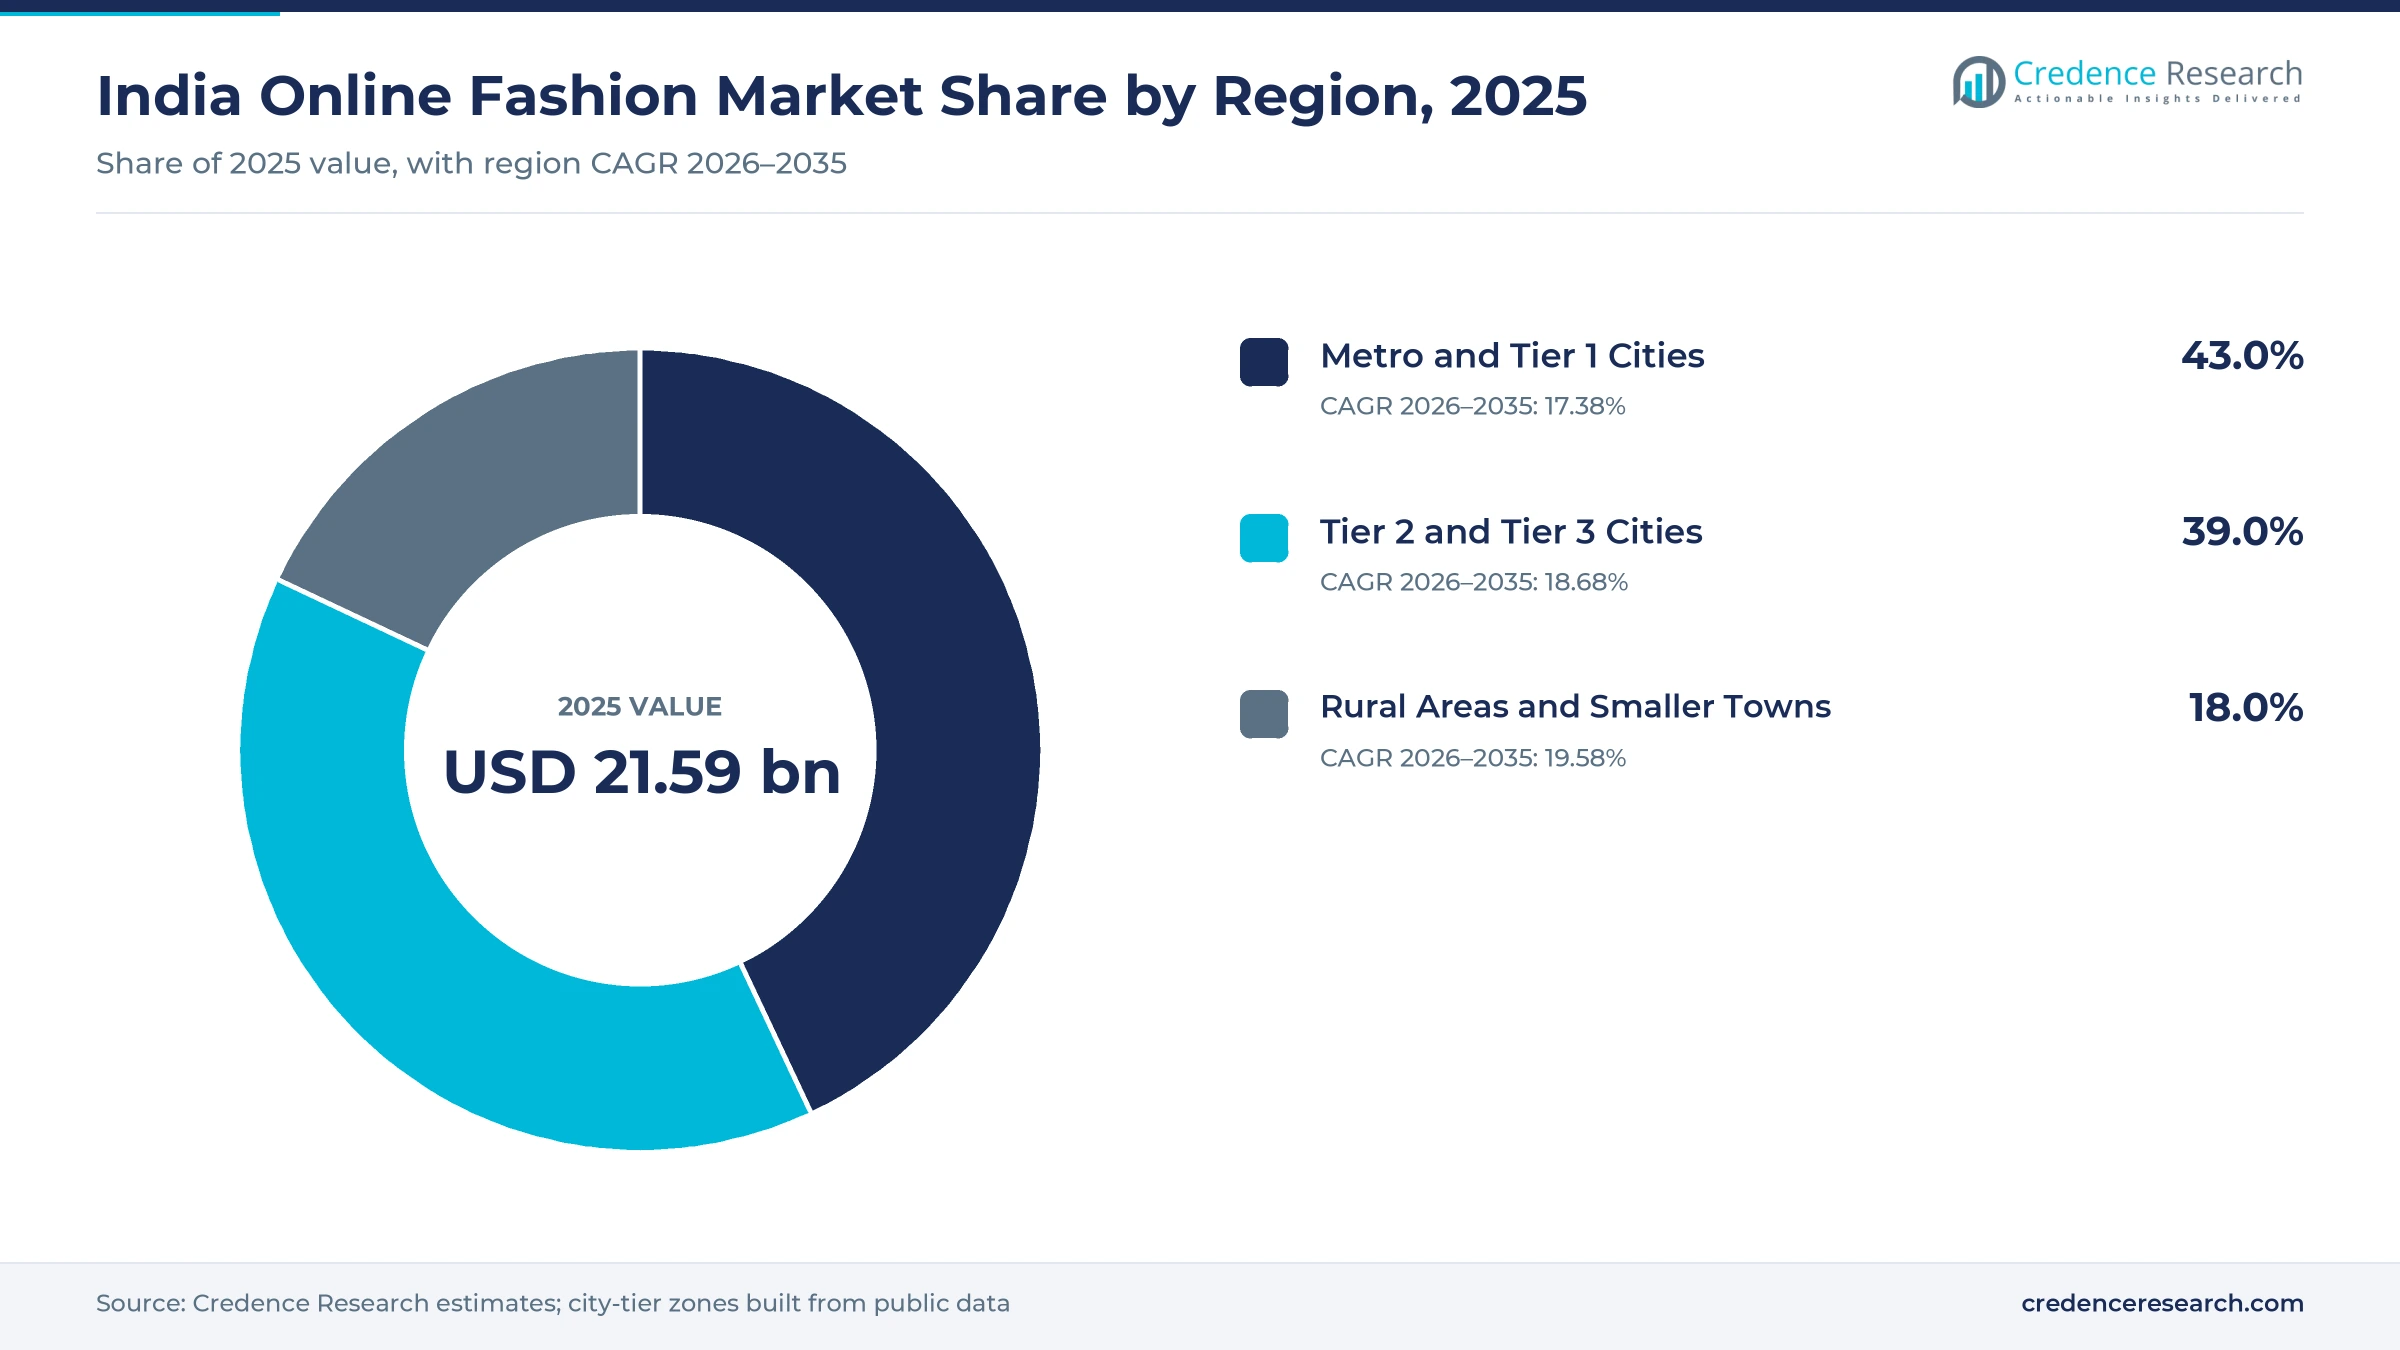
Metro cities lead while smaller towns post the fastest gains
| Region | Value, 2025 (USD billion) | Share, 2025 | CAGR, 2026–2035 |
|---|---|---|---|
| Metro and Tier 1 Cities | 9.29 | 43.0% | 17.38% |
| Tier 2 and Tier 3 Cities | 8.42 | 39.0% | 18.68% |
| Rural Areas and Smaller Towns | 3.89 | 18.0% | 19.58% |
Why do metro and tier 1 cities lead digital fashion spending?
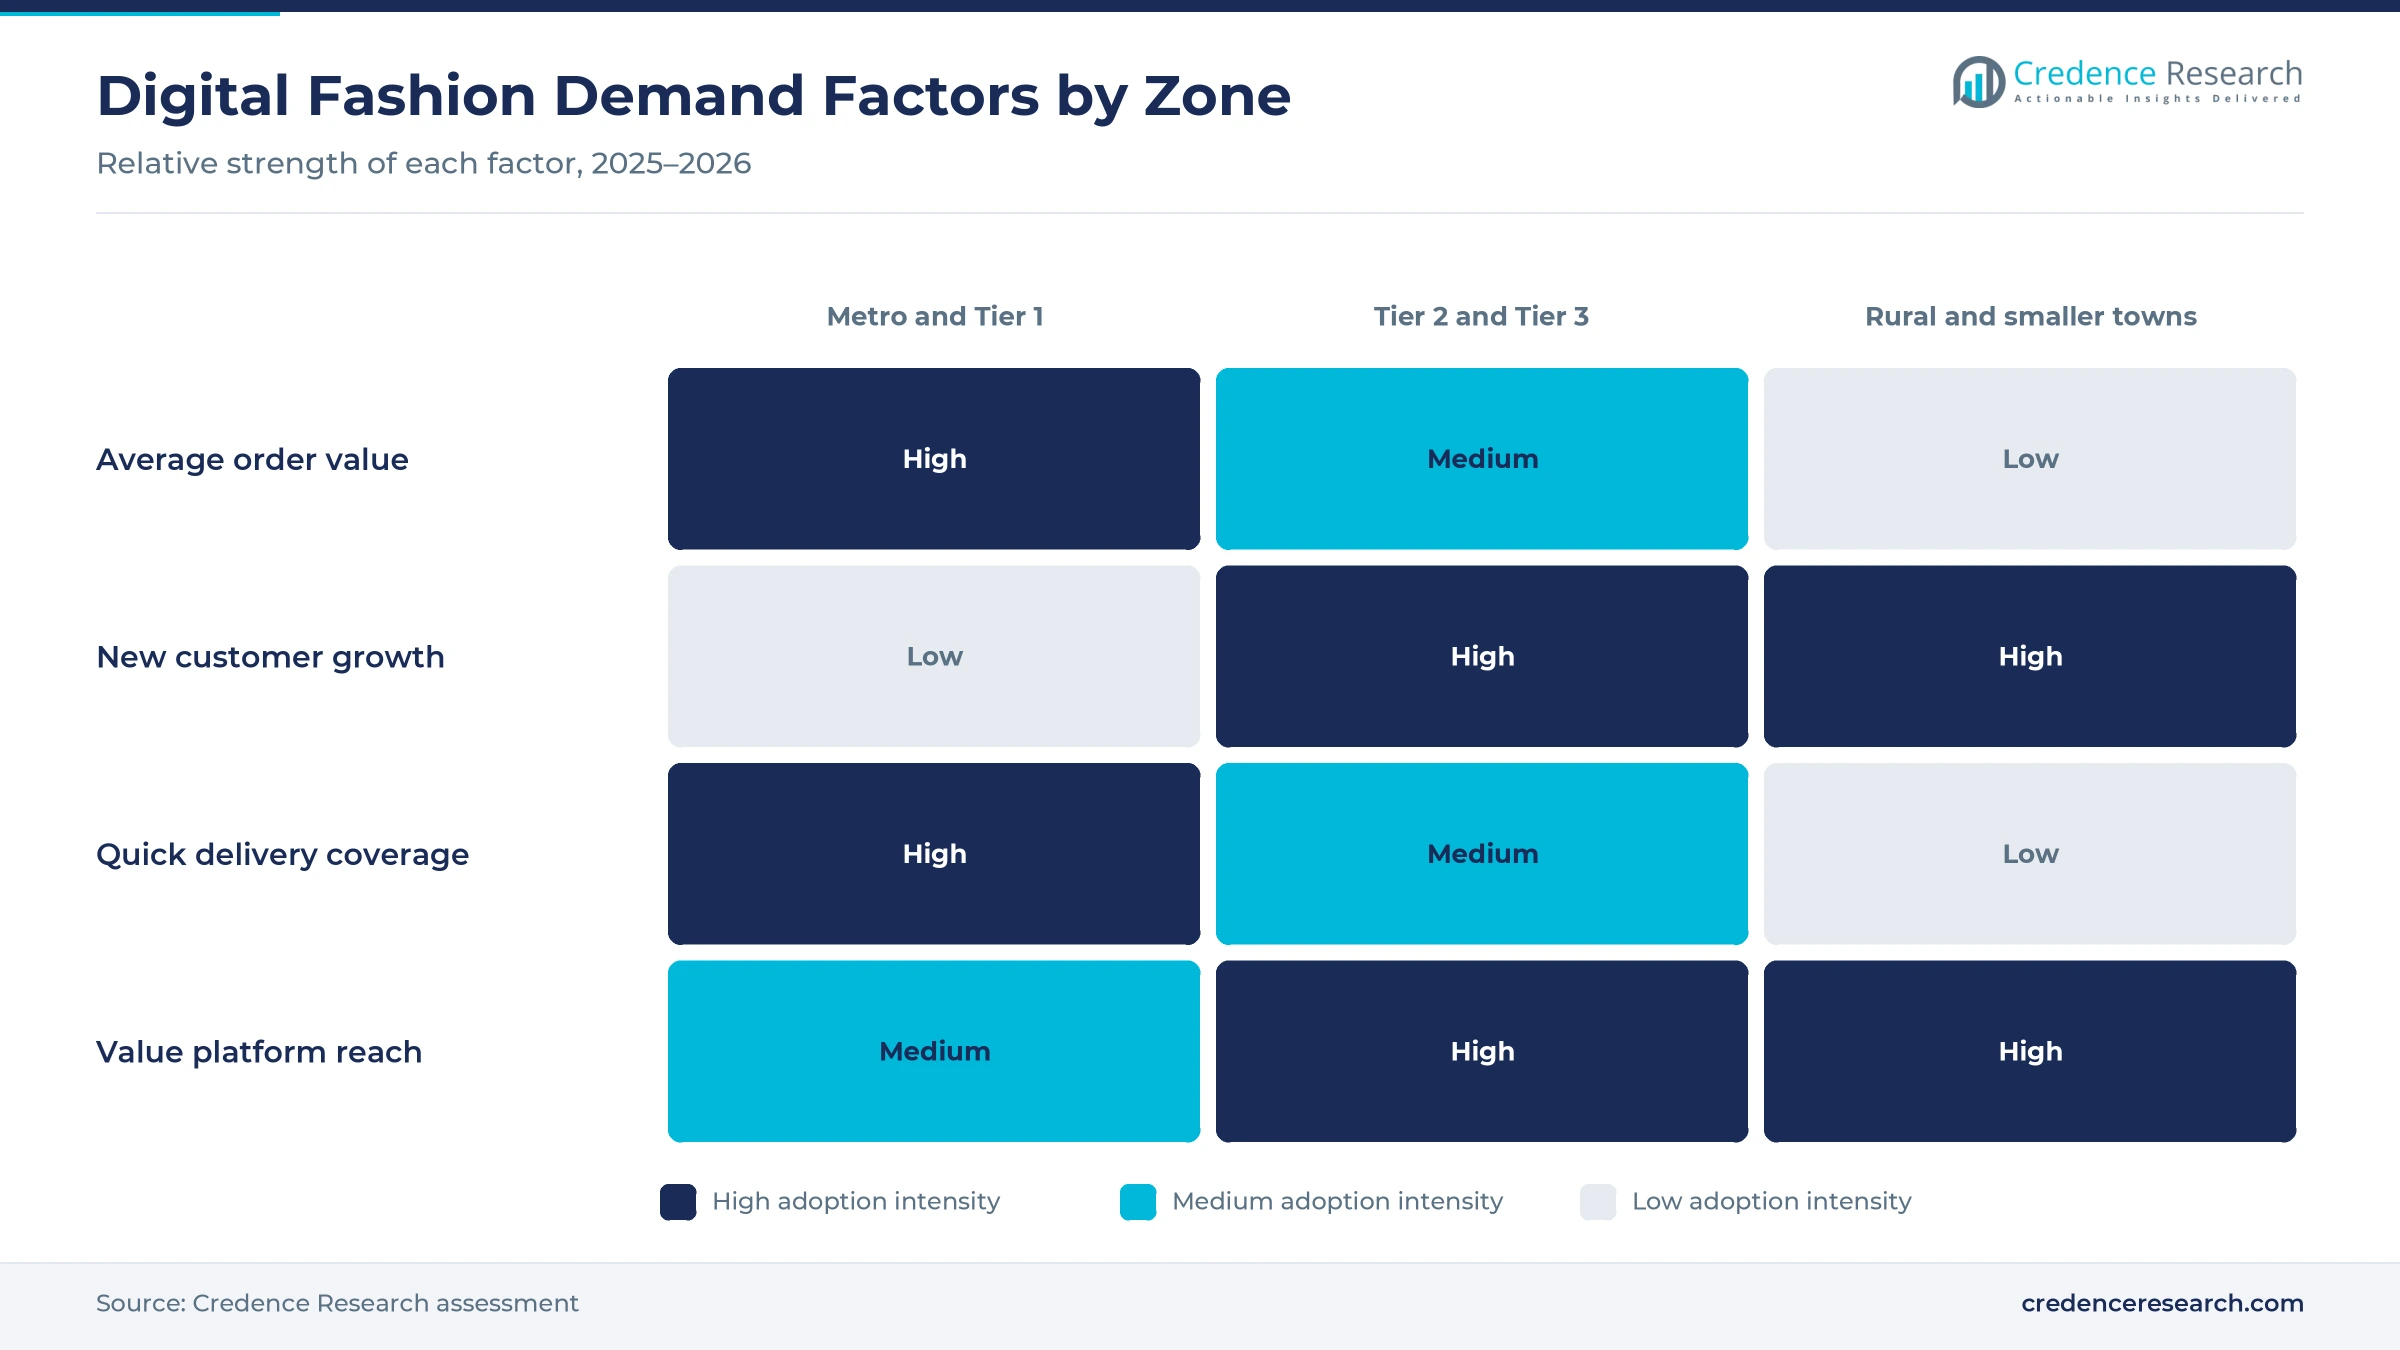
Metro and Tier 1 Cities held a 43.0% share of 2025 value and grow at 17.38% a year, because large cities have the highest incomes, the widest brand choice and the fastest delivery. Myntra said its metro customers now visit the shopping app almost daily. As a result, premium labels, quick delivery and new trend drops reach these shoppers first, which keeps average order values above the national level for most categories, including footwear and accessories.
How do tier 2 and tier 3 cities drive new customer growth?
Tier 2 and Tier 3 Cities held a 39.0% share of 2025 value and grow at 18.68% a year, because rising incomes and phone use bring new shoppers online. Myntra added 30-minute delivery in Patna, Jaipur, Lucknow and Ahmedabad in February 2026. Orders in those cities doubled during the 2025 Diwali season, which shows how quickly demand builds once delivery improves. As a result, platforms are opening more dark stores and regional warehouses in these cities.
How do rural areas and smaller towns add the fastest growth?
Rural Areas and Smaller Towns held 18.0% of 2025 value and grow fastest at 19.58% a year, because value platforms and cheaper data reach first-time buyers. Tier 3 towns and beyond made up nearly one in two visits in the first hour of Flipkart's October 2026 sale. In turn, hyper-value clothing and footwear lead orders in these districts, and value platforms with low prices and cash-free checkout gain the most new shoppers.
Listings, delivery launches and tax changes, 2025–2026
| Development | Status and market relevance |
|---|---|
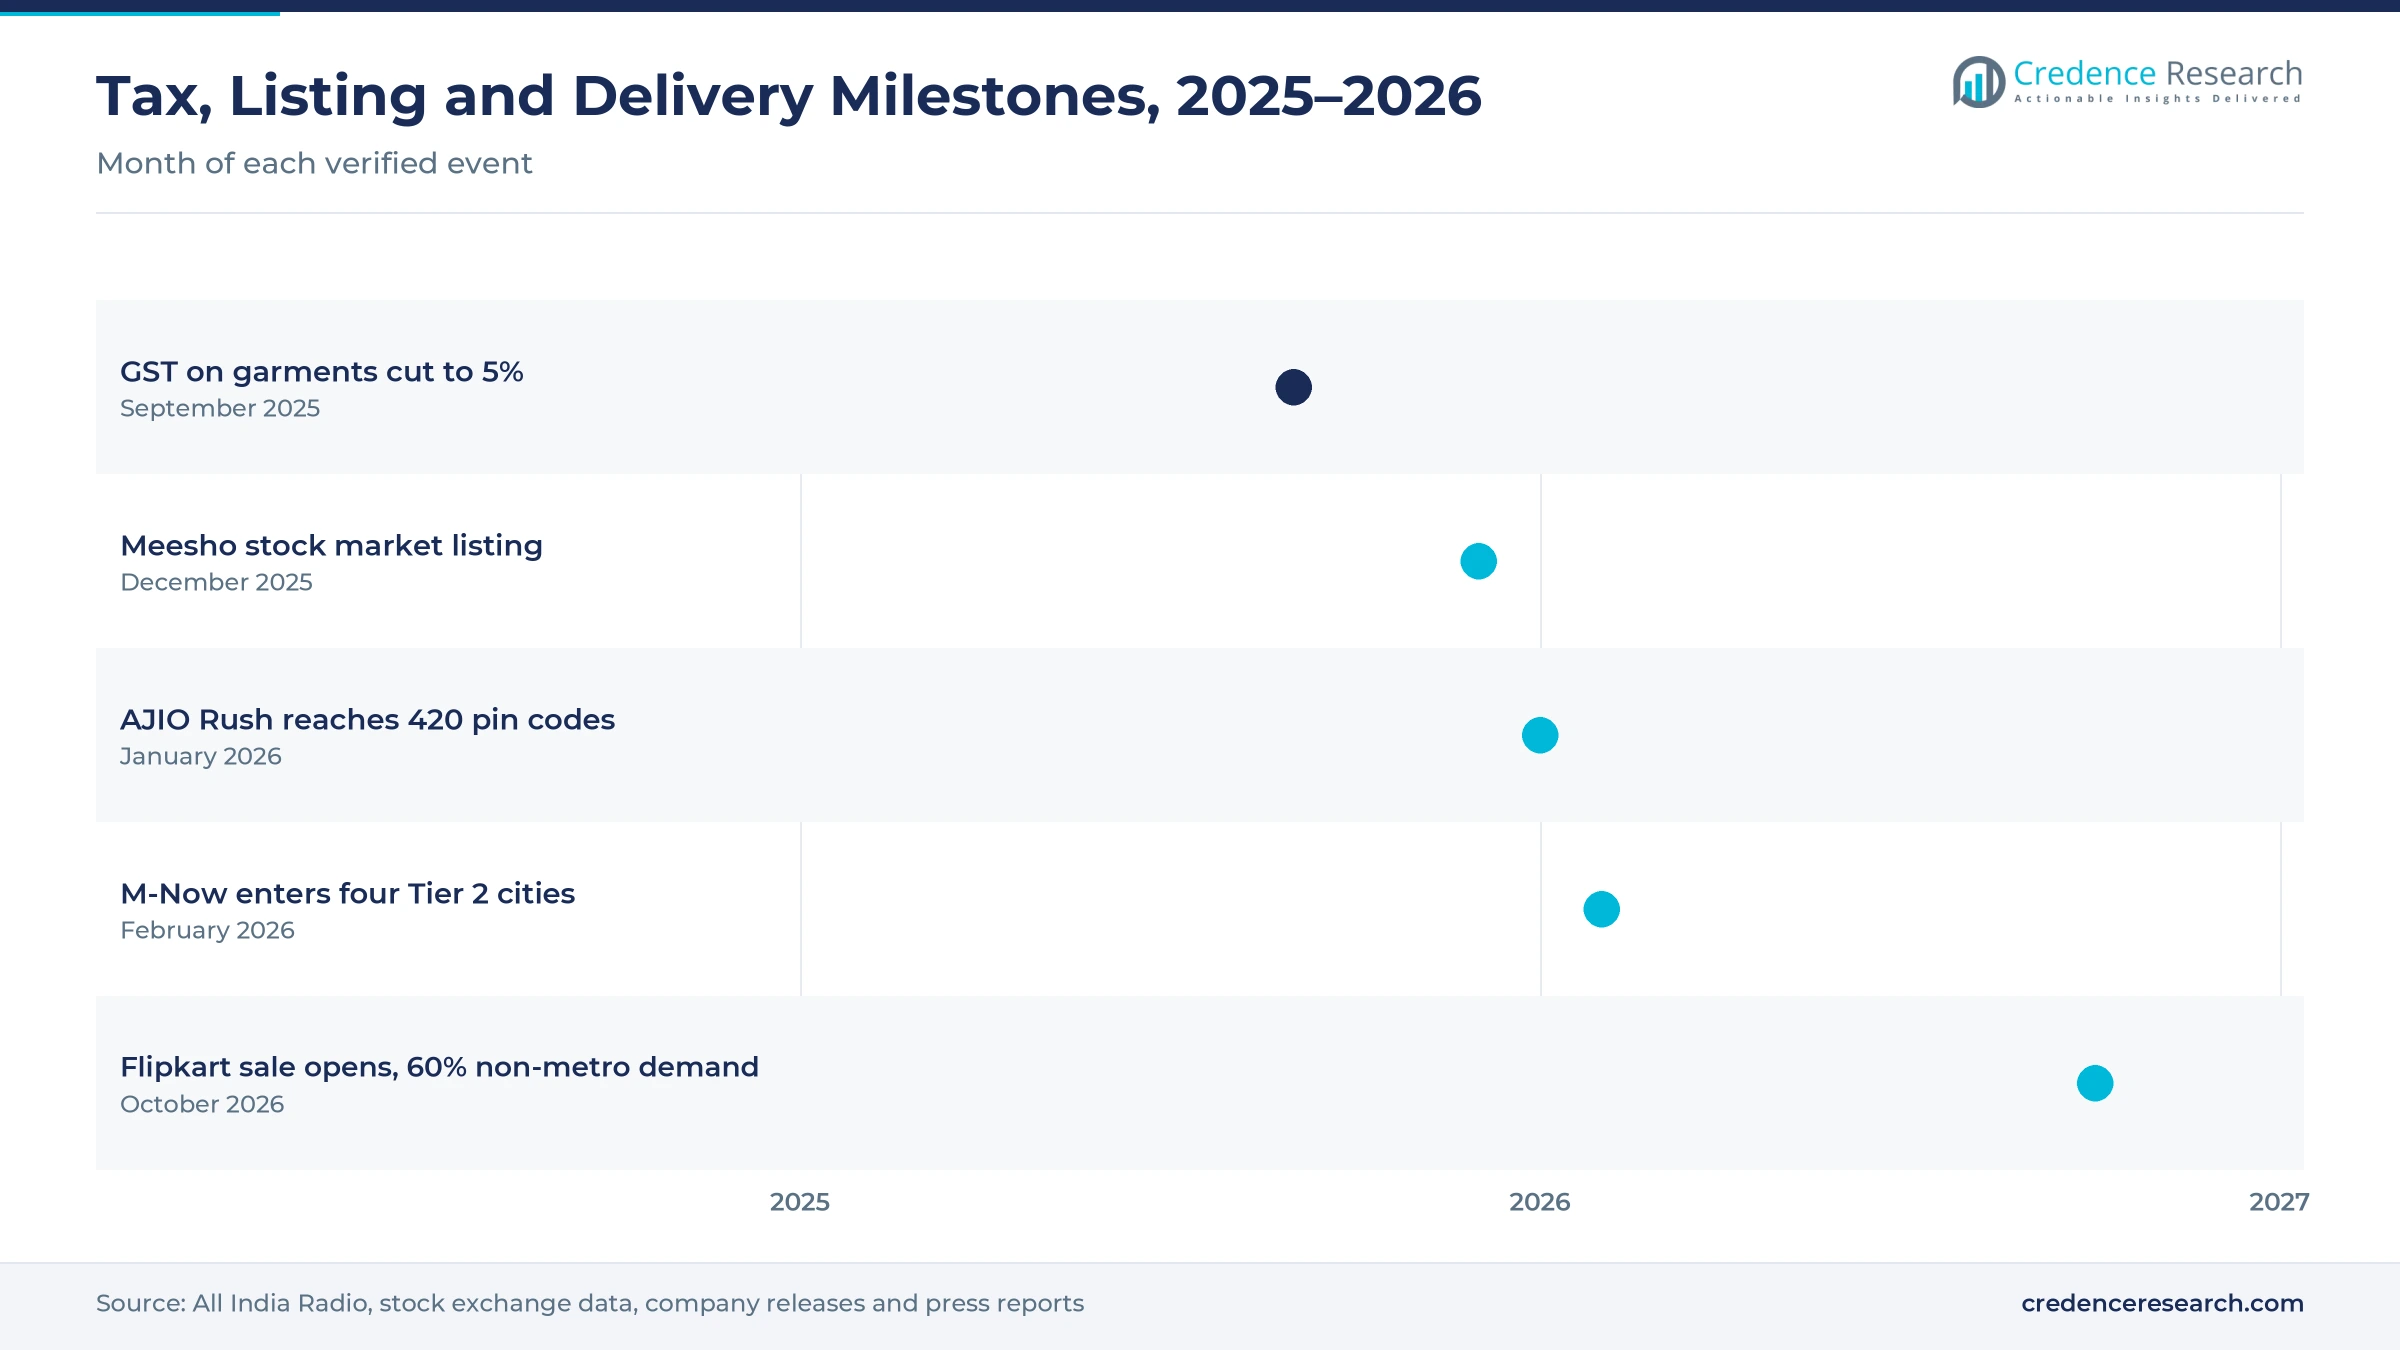
| In September 2025, the GST Council announced a cut in the rate on readymade garments up to 2,500 rupees to 5%, effective Sept. 22. | Lowers checkout prices for mass-market apparel |
| In December 2025, Meesho listed on Indian stock exchanges at a 45.23% premium to its issue price. | Brings public capital to a value fashion platform |
| In January 2026, Reliance announced that AJIO Rush had expanded to 420 pin codes across 10 cities. | Adds quick delivery for fashion orders |
| In February 2026, Myntra expanded M-Now 30-minute delivery to Patna, Jaipur, Lucknow and Ahmedabad. | Extends fast delivery to Tier 2 cities |
| In October 2026, Flipkart opened its Big Billion Days sale, with non-metro customers driving about 60% of demand. | Confirms the weight of smaller-city shoppers |
Dark stores, creator content and fit tools advance
- Dark stores and quick delivery networks hold popular styles close to shoppers, which lets platforms deliver outfits and gifts within 30 minutes in live cities and cut cancellations for urgent orders.
- Creator content and shoppable video show clothes on real people, which helps young buyers judge fit and style and links content views to orders through in-app product tags.
- Size prediction and visual search tools match shoppers to the right fit and to similar styles from photos, which reduces returns and helps wider digital retail platforms convert first-time buyers.
Need a Custom Version of This Report?
Tailor the scope, geography, or segments to your exact requirements.
- Custom geography or segment scope
- Direct access to our analyst team
Marketplaces and fashion platforms compete on speed
Competition is split between multi-category marketplaces, fashion-specialist platforms, value platforms and retailer-led apps. Myntra expected about 200 million annual active users by the end of 2025 and runs M-Now 30-minute delivery in 10 markets. Flipkart drew 6.3 million concurrent users at the opening of its October 2026 sale, with new customers up 34%. Meesho had 234.20 million annual transacting users and listed on stock exchanges in December 2025. Reliance Retail expanded AJIO Rush to 420 pin codes, while Nykaa Fashion GMV rose 12% in the year to March 2025. Rivals compete on assortment, price, delivery speed, returns and creator content. Because new buyers come mostly from smaller cities, value pricing and reliable delivery have become key advantages.
Which platforms lead digital fashion sales in India?
| Company | Type | Role in the market |
|---|---|---|
| Myntra Designs Pvt. Ltd. | Fashion-specialist marketplace | About 200 million annual active users expected by end-2025; M-Now in 10 markets |
| Flipkart Internet Pvt. Ltd. | Multi-category marketplace | 6.3 million concurrent users at the October 2026 sale opening |
| Meesho Ltd. | Value marketplace | 234.20 million annual transacting users in the 12 months to September 2025 |
| Reliance Retail Ltd. (AJIO) | Retailer-led fashion platform | AJIO Rush expanded to 420 pin codes across 10 cities |
| FSN E-Commerce Ventures Ltd. (Nykaa Fashion) | Fashion and lifestyle platform | Fashion GMV up 18% in the January to March 2025 quarter |
Credence Research view on Indian digital fashion buying
Credence Research's view is that Indian digital fashion buying will keep growing quickly because smaller-city shoppers, Gen Z buyers and instant payments all lower the cost of buying clothes online. Apparel remains the largest value pool, while jewellery, social commerce and open network channels add the fastest growth. Lower GST rates on garments also help mass-market orders in every city tier. Platforms that combine fast delivery, trend-first ranges and low return rates should gain share fastest across the India online fashion base over the next decade.
How the national digital fashion estimate was built
The report uses 2025 as the base year on a calendar basis, and market values come from the Credence Research model. That model combines payment statistics, World Bank internet and population data, tax notices, stock exchange listing data and company announcements. Segment splits, city-tier zone shares and zone growth rates are Credence Research estimates. Sources used are official statistics, government releases and company disclosures, and no interviews or surveys were used.
Social and open network channels lead growth to 2035
Digital fashion value is expected to reach USD 116.73 billion by 2035, an 18.31% CAGR during 2026–2035, as more Indians buy clothing, footwear and jewellery on their phones. Growth should come from smaller cities, Gen Z shoppers, social commerce and open network channels. Quick delivery and lower garment taxes would support demand, while high returns and heavy discounting would pressure margins. Platforms with wide assortments, fast delivery and strong fit tools are expected to gain the most as India online fashion demand spreads across the country.
Frequently Asked Questions
How big is the India online fashion market?
Which product category leads Indian digital fashion sales?
Which region leads the Indian market?
How important are smaller-city shoppers?
How did the 2025 GST reform affect fashion prices?
Which channel is growing fastest?
Who are the leading companies in the Indian market?
What are the main challenges for platforms?
Table of Content
Chapter 1 Market Segmentation
- 1.1 Segmentation Framework
- 1.1.1 Product and Service Classification
- 1.1.2 Application and End-Use Classification
- 1.1.3 Technology and Solution Classification
- 1.1.4 Customer and Distribution Channel Classification
- 1.1.5 Geographic Segmentation
- 1.1.6 Market Segment Definitions and Boundaries
- 1.2 By Product Category
- 1.2.1 Apparel
- 1.2.2 Footwear
- 1.2.3 Fashion Accessories
- 1.2.4 Jewellery and Watches
- 1.2.5 Bags and Luggage
- 1.3 By Customer Type
- 1.3.1 Gen Z Shoppers
- 1.3.2 Millennials
- 1.3.3 Family Households
- 1.3.4 Affluent Digital Shoppers
- 1.3.5 Occasion-led Buyers
Chapter 2 Introduction
- 2.1 Report Objectives and Scope
- 2.2 Product Definition and Industry Terminology
- 2.3 Market Inclusions and Exclusions
- 2.4 Research Process
- 2.4.1 Primary Research and Expert Interviews
- 2.4.2 Secondary Research and Source Review
- 2.4.3 Top-Down and Bottom-Up Estimation
- 2.4.4 Data Triangulation and Verification
- 2.5 Market Size Measurement Basis
- 2.5.1 2025: USD 21.59 billion → 2035: USD 116.73 billion
- 2.6 Historical and Forecast Reference Periods
- 2.6.1 Historical Period: 2018-2025
- 2.6.2 Base Year: 2025
- 2.6.3 Forecast Period: 2025-2035
- 2.7 Research Assumptions and Limitations
Chapter 3 Executive Summary
- 3.1 Market Snapshot and Key Findings
- 3.2 Base-Year Market Size, 2025
- 3.3 Forecast Market Size, 2035
- 3.4 Revenue and Volume Growth Outlook
- 3.5 Key Demand and Supply Indicators
- 3.6 Leading Market Segments
- 3.7 Fastest-Growing Market Opportunities
- 3.8 Regional Performance Highlights
- 3.9 Technology and Industry Transformation
- 3.10 Competitive Landscape Summary
- 3.11 Analyst View and Strategic Implications
Chapter 4 India Online Fashion Market Trends and Developments
- 4.1 Historical Industry Development, 2018-2025
- 4.2 Recent Market Trends and Developments
- 4.3 Demand and Customer Behavior Trends
- 4.4 Technology and Product Innovation
- 4.5 Artificial Intelligence, Automation and Digitalization
- 4.6 Local Manufacturing and Supply Chain Realignment
- 4.7 Industry Partnerships, Mergers and Acquisitions
- 4.8 Sustainability and Circular Economy Developments
- 4.9 Government and Private Sector Investment Trends
- 4.10 Emerging Business Models and Commercialization
- 4.11 Industry Developments and Announcements
Chapter 5 India Online Fashion Market Production, Supply and Demand Analysis
- 5.1 Demand Trend and Consumption Analysis, 2018-2025
- 5.2 Demand Forecast, 2025-2035
- 5.3 Production and Output Trend, 2018-2025
- 5.4 Production and Output Forecast, 2025-2035
- 5.5 Installed Capacity and Capacity Utilization
- 5.6 Company-Wise Production Plants and Statistics
- 5.6.1 Installed Production Capacity
- 5.6.2 Actual Production
- 5.6.3 Planned Capacity and Expansion Targets
- 5.7 Supply Chain Structure and Procurement Trends
- 5.8 Supply-Demand Gap and Bottlenecks
- 5.9 Import Dependence and Sourcing Structure
- 5.10 Contract Manufacturing and Outsourcing
- 5.11 Regional Supply and Demand Concentration
Chapter 6 India Online Fashion Market Pricing Analysis
- 6.1 Pricing Structure and Measurement
- 6.2 Historical Pricing Trends, 2018-2025
- 6.3 Pricing Outlook, 2025-2035
- 6.4 Average Selling Price and Unit Economics
- 6.5 Pricing by Product and Market Segment
- 6.6 Geographic Pricing Differences
- 6.7 Key Input, Energy, Labor and Logistics Costs
- 6.8 Contract Pricing and Purchasing Models
- 6.9 Pricing Sensitivity and Competitive Positioning
- 6.10 Price, Margin and Profitability Implications
Chapter 7 India Online Fashion Market Dynamics
- 7.1 Market Growth Drivers
- 7.1.1 Demand-Side Drivers
- 7.1.2 Technology and Innovation Drivers
- 7.1.3 Infrastructure and Investment Drivers
- 7.1.4 Regulatory and Policy Drivers
- 7.2 Market Restraints
- 7.2.1 Cost and Affordability Constraints
- 7.2.2 Technology and Adoption Barriers
- 7.2.3 Supply Chain and Operational Constraints
- 7.3 Market Challenges
- 7.3.1 Competitive Pressure and Margin Erosion
- 7.3.2 Skills, Infrastructure and Implementation Gaps
- 7.4 Emerging Market Opportunities
- 7.5 Market Dynamics Impact and Time-Horizon Assessment
Chapter 8 India Online Fashion Value Chain Analysis
- 8.1 Industry Value Chain Overview
- 8.2 Upstream Suppliers and Critical Inputs
- 8.3 Technology and Component Providers
- 8.4 Manufacturing or Service Delivery
- 8.5 Distribution, Channel Partners and Integrators
- 8.6 Downstream Applications and End Users
- 8.7 Value Addition and Profit Pools
- 8.8 Vertical Integration and Outsourcing
- 8.9 Supplier Concentration and Risk
- 8.10 Supply Chain Localization and Resilience
Chapter 9 India Online Fashion Market Regulations and Policies
- 9.1 Relevant Laws, Standards and Compliance Frameworks
- 9.2 Product, Service, Safety and Quality Requirements
- 9.3 Government Policies, Incentives and Subsidies
- 9.4 Imports, Exports and Trade Barriers
- 9.5 Public Procurement and Local Content Requirements
- 9.6 Environmental and Sustainability Compliance
- 9.7 Upcoming Policy Changes and Market Implications
Chapter 10 India Online Fashion Market Hotspots and Opportunities
- 10.1 Market Opportunity Mapping and Growth Hotspots
- 10.2 High-Growth Applications and Customer Groups
- 10.3 Underserved Markets and White-Space Opportunities
- 10.4 Emerging Technology and Product Opportunities
- 10.5 New Capacity and Investment Hotspots
- 10.6 Market Entry and Expansion Opportunities
- 10.7 Distribution and Partnership Opportunities
- 10.8 Near-Term and Long-Term Commercial Potential
- 10.9 Opportunity Attractiveness and Execution Risks
Chapter 11 India Online Fashion Market Outlook, 2025-2035
- 11.1 Market Size and Analysis
- 11.1.1 Revenue (Market Measurement: 2025: USD 21.59 billion → 2035: USD 116.73 billion)
- 11.1.2 Market Volume and Quantity Sold
- 11.1.3 Historical Market Size, 2018-2025
- 11.1.4 Base-Year Market Size, 2025
- 11.2 Market Forecast, 2025-2035
- 11.2.1 Revenue Forecast to 2035
- 11.2.2 Volume Forecast to 2035
- 11.2.3 CAGR and Year-on-Year Growth
- 11.2.4 Incremental Revenue Opportunity
- 11.3 Forecast Assumptions and Scenario Analysis
- 11.3.1 Base-Case Forecast
- 11.3.2 Optimistic and Conservative Scenarios
- 11.3.3 Technology, Pricing and Policy Sensitivities
- 11.4 Market Attractiveness and Growth Outlook
Chapter 12 India Online Fashion Market Segmentation and Outlook
- 12.1 Segmentation Summary and Market Shares, 2025
- 12.2 Largest and Fastest-Growing Segments
- 12.3 By Product Category - Market Size and Forecast, 2025-2035
- 12.3.1 Segment Definition and Scope
- 12.3.2 Historical Market Size, 2018-2025
- 12.3.3 Revenue Forecast, 2025-2035
- 12.3.4 Volume Forecast, 2025-2035
- 12.3.5 Base-Year Market Share, 2025
- 12.3.6 Segment CAGR and Growth Drivers
- 12.3.7 Subsegment Market Size and Forecast
- 12.3.7.1 Apparel
- 12.3.7.2 Footwear
- 12.3.7.3 Fashion Accessories
- 12.3.7.4 Jewellery and Watches
- 12.3.7.5 Bags and Luggage
- 12.3.8 Subsegment Pricing and Adoption Trends
- 12.3.9 Leading Suppliers and Competition
- 12.3.10 Regional Demand and Opportunities
- 12.4 By Customer Type - Market Size and Forecast, 2025-2035
- 12.4.1 Segment Definition and Scope
- 12.4.2 Historical Market Size, 2018-2025
- 12.4.3 Revenue Forecast, 2025-2035
- 12.4.4 Volume Forecast, 2025-2035
- 12.4.5 Base-Year Market Share, 2025
- 12.4.6 Segment CAGR and Growth Drivers
- 12.4.7 Subsegment Market Size and Forecast
- 12.4.7.1 Gen Z Shoppers
- 12.4.7.2 Millennials
- 12.4.7.3 Family Households
- 12.4.7.4 Affluent Digital Shoppers
- 12.4.7.5 Occasion-led Buyers
- 12.4.8 Subsegment Pricing and Adoption Trends
- 12.4.9 Leading Suppliers and Competition
- 12.4.10 Regional Demand and Opportunities
- 12.5 Segment Growth Comparison
- 12.6 Segment Attractiveness and Priority Matrix
Chapter 13 India Online Fashion End-Use and Application Market Outlook
- 13.1 End-Use Industry and Customer Demand Structure
- 13.2 Leading Applications and Customer Groups
- 13.3 End-Use Market Size, Share and Forecast
- 13.4 Major End-Use Industry Deep Dives
- 13.4.1 Customer Requirements and Use Cases
- 13.4.2 Demand and Replacement Cycles
- 13.4.3 Technical and Regulatory Considerations
- 13.4.4 Purchasing and Procurement Models
- 13.4.5 Leading Vendors and Distribution Channels
- 13.4.6 Forecast and Commercial Opportunities
- 13.5 Emerging Applications and Cross-Segment Demand
- 13.6 End-Use Industry Investment Priorities
Chapter 14 India Online Fashion Geographic Market Outlook, 2025-2035
- 14.1 Domestic Market Distribution and Demand Clusters
- 14.2 State- or Province-Wise Market Size and Forecast, 2025-2035
- 14.3 City and Metropolitan Market Outlook
- 14.4 Industrial, Manufacturing and Commercial Clusters
- 14.5 Geographic Concentration of Key End Users
- 14.6 Local Pricing and Purchasing Differences
- 14.7 Domestic Production Facilities and Capacity Map
- 14.8 Local Infrastructure and Project Pipeline
- 14.9 State-Level Policy and Incentive Differences
- 14.10 Subnational Investment Hotspots and Opportunities
- 14.11 Distribution and Logistics Networks
- 14.12 Domestic Competitive Footprint
Chapter 15 India Online Fashion Technology, Innovation and Sustainability Outlook
- 15.1 Technology Landscape and Maturity
- 15.2 Product, Process and Service Innovation
- 15.3 AI, Automation and Digital Tools in the Industry
- 15.4 Technology Adoption and Performance Benchmarking
- 15.5 Innovation Pipeline and R&D Investment
- 15.6 Patent and Intellectual Property Trends
- 15.7 Energy Efficiency and Resource Management
- 15.8 Sustainability, Recycling and Circularity
- 15.9 Technology Roadmap, 2025-2035
- 15.10 Risks of Obsolescence and Technology Substitution
Chapter 16 India Online Fashion Market Key Strategic Imperatives
- 16.1 Growth and Market Entry Priorities
- 16.2 High-Return Products and Segments
- 16.3 Pricing, Profitability and Cost Optimization
- 16.4 Technology Investment and Product Differentiation
- 16.5 Supply Chain Localization and Resilience
- 16.6 Distribution and Customer Acquisition
- 16.7 Partnership, Acquisition and Capacity Strategy
- 16.8 Regional Expansion Priorities
- 16.9 Short-, Medium- and Long-Term Actions
Chapter 17 Competition Outlook
- 17.1 Industry Competition Characteristics
- 17.2 Market Structure and Concentration
- 17.3 Market Share and Competitive Positioning, 2025
- 17.4 Company-Wise Revenue and Product Benchmarking
- 17.5 Production and Service Capacity Benchmarking
- 17.6 Technology, Pricing and Differentiation
- 17.7 Regional Footprint and Distribution Strength
- 17.8 Mergers, Acquisitions and Strategic Alliances
- 17.9 New Entrants and Competitive Threats
- 17.10 Porter's Five Forces and Industry Attractiveness
- 17.11 Competitive Outlook, 2025-2035
Chapter 18 Company Profiles
- 18.1 Company Coverage and Selection Criteria
- 18.2 Myntra Designs Pvt. Ltd.
- 18.2.1 Business Description
- 18.2.2 Company Ownership and Geographic Presence
- 18.2.3 Product and Service Portfolio
- 18.2.4 Manufacturing and Operating Footprint
- 18.2.5 Production Capacity and Expansion Plans
- 18.2.6 Financial Performance and Investment
- 18.2.7 Market Share and Competitive Position
- 18.2.8 Technology and Innovation Capabilities
- 18.2.9 Strategic Alliances or Partnerships
- 18.2.10 Recent Developments
- 18.2.11 Growth Strategy and Outlook
- 18.3 Flipkart Internet Pvt. Ltd.
- 18.4 Reliance Retail Ltd. (AJIO)
- 18.5 Amazon Seller Services Pvt. Ltd. (Amazon Fashion)
- 18.6 Meesho Ltd.
- 18.7 FSN E-Commerce Ventures Ltd. (Nykaa Fashion)
- 18.8 Tata UniStore Ltd. (Tata CLiQ Fashion)
- 18.9 V-Mart Retail Ltd. (LimeRoad)
- 18.10 Shoppers Stop Ltd.
- 18.11 Arvind Fashions Ltd. (NNNOW)
- 18.12 Other Relevant Market Participants
Note: Every listed company is profiled on the structure shown under the first company. The company list is preliminary and may change based on research findings, market developments, data availability and client requirements.
Chapter 19 Disclaimer
- 19.1 Research and Forecast Disclaimer
- 19.2 Data Source and Estimation Limitations
Note: The depth of individual sections depends on data availability for this market. Volume, capacity, trade and other unit-based metrics are included where applicable.

