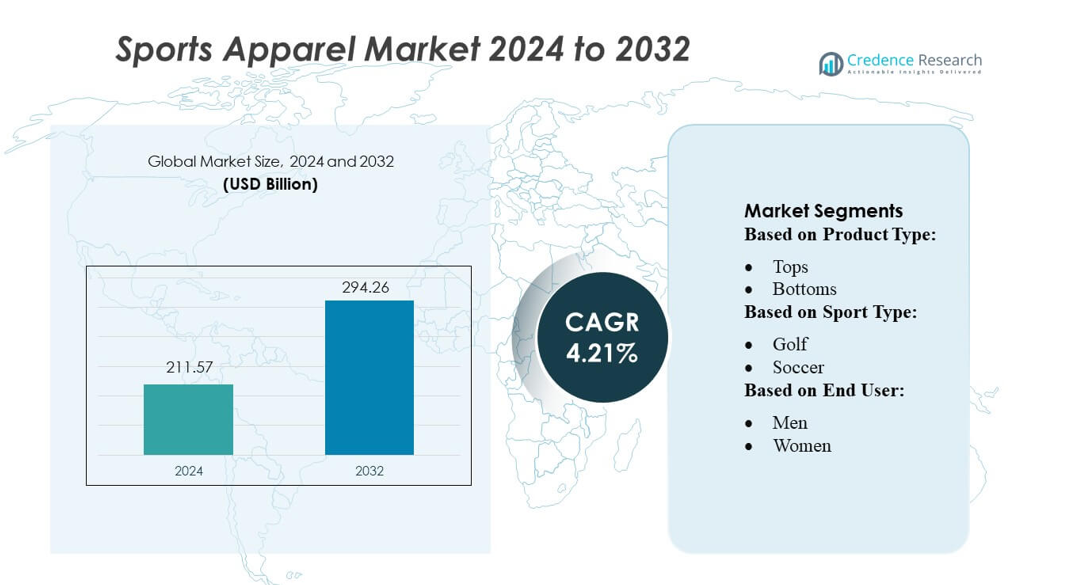
Home » Consumer Goods » Sports Apparel Market

Global Sports Apparel Market By Sports (Soccer, Basketball, Baseball and Others), By Material (Natural and Synthetic) Growth, Future Prospects & Competitive Analysis, 2016 – 2030

Price: $4999

Published: | Report ID: 16925 | Report Format : PDF

About this report

The study on the global sports apparel market examines the critical analysis of the sports apparel sector utilising important metrics. The research covers investment tactics, the necessity of making investments in the sports clothing sector, and the numerous advantages for investors. This paper, which is significant, details significant modifications to international technical standards governing the sports clothing sector as well as how obstacles of both a financial and non-financial kind are promoting the expansion of the sports apparel market. The paper also examines historical and projected market sizes at the international, regional, and national levels. A thorough study of the report’s core investment propositions, supply and demand gaps, competition positioning, STAR, SRC, and Tornado analyses are also included. Important technology advancements and other assessments, including PESTEL, value chain, and Porter’s Five Forces analyses.

What is the market size of sports apparel regarding value?

The global sports apparel market is anticipated to grow at a significant CAGR of 4.90% in the upcoming years. The global sports apparel industry was estimated to be worth USD 172.5 billion in 2021 and was expected to worth USD 229.8 billion by 2028.

Design Element 2

Access crucial information at unmatched prices!

Request your free sample report today & start making informed decisions powered by Credence Research!

Download Free Sample
CTA Design Element 3

Key Highlights of the report

How are the major segments performing in the sports apparel market?

  • In 2021, the soccer segment accounted for the highest share of the market because it is one of the most popular sports in the world.
  • In 2021, the natural segment was anticipated to have a major share of the global sports apparel market due to its low-cost, lightweight, renewability, and highly specific properties.
  • In 2021, the silicone emboss segment was anticipated to have a major share of the global sports apparel market due to the rising use of silicone emboss in sports apparel.
  • In 2021, the E-commerce segment was anticipated to have a major share of the global sports apparel market due to increasing penetration of the internet and the use of smartphones.
  • In 2021, due to the increasing engagement of men in sports and physical activities and the growing popularity of sportswear, it was projected that the men’s sector would account for a sizable portion of the global sports apparel industry.

Which region dominated the sports apparel market?

In 2021, the North American region was expected to have the highest share of the global market over the forecast year. Sports gear is required due to rising health consciousness and the popularity of active lifestyles. In this area, the leisure business is expanding, which has led to increased product use.

How is US market performing in the sports apparel market?

In 2021, the North American region was expected to hold a major global sports apparel market share. The U.S. is expected to majorly contribute to the sports apparel market. For instance, according to Bureau of Economic Analysis data, in 2019, the U.S recreational economy accounted for 2.2 percent of the current dollar GDP, which is USD 459.8 billion. Additionally, many school students involved in sports fostered the demand for the product, which is likely to fuel the consumption rate.

What is the competitive environment of the sports apparel market?

The major market competitors have shifted their attention to equipping the product with electrical sensors. Therefore, this will contribute to improving the experience of purchasing sports gear. The product can track current information thanks to the electronic sensors, which also aid in enhancing users’ sport and fitness activities. For instance, Asics smart running shoes have electronic sensors that transmit real-time running information, such as kick strength, stability, and the capacity to make suggestions for running more effectively.

Executive Summary

How does sports apparel used by men?

Sports apparel is expected to register significant growth in the men’s segment due to many men being involved in various outdoor activities, including cycling, rock climbing, trekking, and other activities.

Which are the key investments by the Sports Apparel Market players?

R&D expenditures by many businesses are very high. The main approaches used by market participants are portfolio diversification of products and acquisitions and mergers. For instance: In September 2021, Global sports brand PUMA launched Royal Challenger Bangalore athleisure range as part of its three-year strategic partnership deal. The company signed with the franchise in March 2021.

Some major players in the sports apparel market are V.F. Corporation (U.S.), Columbia Sportswear Company (U.S.), Adidas (Germany), Amer Sports (Finland), DESCENTE LTD (Japan), Decathlon Sports India Pvt Ltd (India), Lafuma (France), Group Rossignol Inc. (U.S.), Volcom, LLC. (U.S.), SPYDER ACTIVE SPORTS (U.S.), Halti Global Store. (Finland).

Sports Apparel Market

What are the major driving factors for the sports apparel market?

The rise in people’s participation in a wide range of sporting events, such as football, cricket, and tennis, is boosting the demand for sports apparel globally. An increase in disposable income, the high spending power of consumers, and the rise in the propensity of consumers to purchase comfortable clothing are factors driving the global sports apparel market. Due to lifestyle problems and high levels of working stress, consumers are becoming more and more concerned with their health and fitness. To keep active and healthy, these customers choose a variety of fitness pursuits including swimming, working out at the gym, and jogging. As a result, the market for sportswear has grown in popularity across all end-user categories.

What are the major risks for the sports apparel market?

The expansion of the market is being constrained by the rise in counterfeit goods in clothes, footwear, leather goods, and other industries throughout the world. For instance, according to information released by the Organisation for Economic Co-operation and Development in March 2019, 3.3% of global commerce is made up of the sale of counterfeit products, including sportswear.

Which is the key sport in the sports apparel market?

The market for sports apparel is expanding as a result of the rising popularity of regional, national, and global events like the Soccer World Cup. The necessity for the product has been exacerbated by the growing number of health-conscious people driving more gym attendance in several nations throughout the world.

How is the sports apparel market performing in regions?

North America is leading the sports apparel market over the forecast period. The growth of the recreational industry in this region resulted in escalating product utilization. In addition, many school students involved in sports fostered the demand for the product, which fuels the consumption rate.  Europe is projected to have substantial growth in the sports apparel market due to the increased funding to reduce the inactive elderly population in the region, which led to the involvement of the older population in physical activities. Additionally, a large percentage of the European population exercising regularly has escalated the demand for the product. For instance, the data released by Play the Game. Org, March 2018, proclaims that 40 %of European citizens exercise at least once a week.

What is the regulatory landscape for the sports apparel market?

Making clothing more useful, better managing temperature, and offering comfort to players throughout play sessions has been one of the distinguishing features of innovation in sports wear. For example, during the past ten years, Adidas has spent $1.7 billion on R&D, whereas Puma spent around $500 million in the period between 2013 and 2020.

Shape Your Report to Specific Countries or Regions & Enjoy 30% Off!

What are the major players planning for the future of the sports apparel market?

Major players are increasingly focusing on introducing innovative solutions with advanced efficiency and features. New product launches and mergers and acquisitions are the prime strategies adopted by major players to sustain themselves in the highly competitive sportswear market.

REPORT ATTRIBUTE DETAILS
Sports Apparel Market by Volume Yes
Sports Apparel Market by Value Yes
Sports Apparel Market, Tornado Analysis Yes
Sports Apparel Market, STAR Analysis Yes
Sports Apparel Market, SRC Analysis Yes
Sports Apparel Market Pricing Analysis Yes (On Demand)
Sports Apparel Market Segment Analysis By Sports (Soccer, Basketball, Baseball and Others)

By Material (Natural and Synthetic)

By Type of Print (Water Based, Silicone Emboss, Reflective Transfer, Pigment, High Density, Foil, Glitter, Cracking Ink, Discharge, All Over Print, Photo Print and Others)

By  Distribution Channel (E-Commerce, Supermarket/Hypermarket, Brand Outlets, Discount Stores, and Others)

By End User (Men, Women and Children)

Sports Apparel Market, Regional Analysis North America (the US and Canada)

Europe (Germany, UK, France, Italy, Spain, and the Rest of Europe)

Asia Pacific (China, India, Japan, South Korea, Southeast Asia, and the Rest of Asia Pacific)

Latin America (Brazil, Mexico, and the Rest of Latin America)

The Middle East and Africa (GCC Countries, South Africa, and the Rest of the Middle East and Africa)

Sports Apparel Market Key Companies V.F. Corporation (U.S.), Columbia Sportswear Company (U.S.), Adidas (Germany), Amer Sports (Finland), DESCENTE LTD (Japan), Decathlon Sports India Pvt Ltd (India), Lafuma (France), Group Rossignol Inc. (U.S.), Volcom, LLC. (U.S.), SPYDER ACTIVE SPORTS (U.S.), Halti Global Store. (Finland), Under Armour Inc, (U.S.), BOGNER (U.S.), Trek Kit India (India), Tube Pro, Inc (Canada), Airhead Sports Group (U.S.), L.L. Bean Inc, (U.S.), Agit Global, Inc. (U.S.), Emsco Group (U.S.), Slippery Racer (U.S.), Gizmo Riders (U.S.), Zipfy Inc, (Canada)
Sports Apparel Market Competitive Landscape Market Share Analysis

Competitive Benchmarking

Key Players Market Positioning

Geographical Presence Analysis

Major Strategies Adopted

Segmentation of the Global Sports Apparel Market-

Global Sports Apparel Market – By Sports

  • Soccer
  • Basketball
  • Baseball
  • Others

Global Sports Apparel Market – By Material

  • Natural
  • Synthetic

Global Sports Apparel Market – By Type of Print

  • Water Based
  • Silicone Emboss
  • Reflective Transfer
  • Pigment
  • High Density
  • Foil
  • Glitter
  • Cracking Ink
  • Discharge
  • All Over Print
  • Photo Print
  • Others

Global Sports Apparel Market – By Distribution Channel

  • E-Commerce
  • Supermarket/Hypermarket
  • Brand Outlets
  • Discount Stores
  • Others

Global Sports Apparel Market – By End User

  • Men
  • Women
  • Children

Global Sports Apparel Market – By Region

  • North America
    • U.S.
    • Canada
  • Europe
    • Germany
    • France
    • U.K.
    • Italy
    • Spain
    • Rest of Europe
  • Asia Pacific
    • China
    • Japan
    • India
    • South Korea
    • South-east Asia
    • Rest of Asia Pacific
  • Latin America
    • Brazil
    • Mexico
    • Rest of Latin America
  • Middle East & Africa
    • GCC Countries
    • South Africa
    • Rest of the Middle East and Africa

1. Preface
1.1. Report Description
1.1.1. Purpose of the Report
1.1.2. Target Audience
1.1.3. USP and Key Offerings
1.2. Research Scope
1.3. Research Methodology
1.3.1. Phase I – Secondary Research
1.3.2. Phase II – Primary Research
1.3.3. Phase III – Expert Panel Review
1.3.4. Approach Adopted
1.3.4.1. Top-Down Approach
1.3.4.2. Bottom-Up Approach
1.3.5. Assumptions
1.4. Market Segmentation

2. Executive Summary
2.1. Market Snapshot: Global Sports Apparel Market
2.2. Global Sports Apparel Market, By Sports
2.3. Global Sports Apparel Market, By Material
2.4. Global Sports Apparel Market, By Type of Print
2.5. Global Sports Apparel Market, By Distribution Channel
2.6. Global Sports Apparel Market, By End User
2.7. Global Sports Apparel Market, By Region

3. Market Dynamics & Factors Analysis
3.1. Introduction
3.1.1. Global Sports Apparel Market Value, 2016-2028, (US$ Bn)
3.2. Market Dynamics
3.2.1. Key Growth Trends
3.2.2. Market Drivers
3.2.3. Market Restraints
3.2.4. Market Opportunities
3.2.5. Major Industry Challenges
3.3. Attractive Investment Proposition,2021
3.3.1. Sports
3.3.2. Material
3.3.3. Type of Print
3.3.4. Distribution Channel
3.3.5. End User
3.3.6. Geography

4. Premium Insights
4.1. STAR (Situation, Task, Action, Results) Analysis
4.2. Porter’s Five Forces Analysis
4.2.1. Threat of New Entrants
4.2.2. Bargaining Power of Buyers/Consumers
4.2.3. Bargaining Power of Suppliers
4.2.4. Threat of Substitute Types
4.2.5. Intensity of Competitive Rivalry
4.3. Value Chain Analysis
4.4. Technology Analysis
4.5. Marketing Strategy Analysis
4.5.1. Direct Marketing
4.5.2. Indirect Marketing
4.5.3. Marketing Channel Development Trend

5. Market Positioning of Key Players, 2021
5.1. Company market share of key players, 2021
5.2. Competitive Benchmarking
5.3. Market Positioning of Key Vendors
5.4. Geographical Presence Analysis
5.5. Major Strategies Adopted by Key Players
5.5.1. Key Strategies Analysis
5.5.2. Mergers and Acquisitions
5.5.3. Partnerships
5.5.4. Product Launch
5.5.5. Geographical Expansion
5.5.6. Others

6. COVID 19 Impact Analysis
6.1. Global Sports Apparel Market Pre Vs Post COVID 19, 2019 – 2028
6.2. Impact on Import & Export
6.3. Impact on Demand & Supply

7. Global Sports Apparel Market
7.1. Global Sports Apparel Market, by Sports, 2016-2028(US$ Bn)
7.1.1. Overview
7.1.2. Global Sports Apparel Market, By Sports, 2021 vs 2028 (in%)
7.1.3. Global Sports Apparel Market, By Soccer, 2016-2028 (US$ Bn)
7.1.4. Global Sports Apparel Market, By Basketball, 2016-2028 (US$ Bn)
7.1.5. Global Sports Apparel Market, By Baseball, 2016-2028 (US$ Bn)
7.1.6. Global Sports Apparel Market, By Others, 2016-2028 (US$ Bn)
7.2. Global Sports Apparel Market, by Material, 2016-2028(US$ Bn)
7.2.1. Overview
7.2.2. Global Sports Apparel Market, By Material, 2021 vs 2028 (in%)
7.2.3. Global Sports Apparel Market, By Natural, 2016-2028 (US$ Bn)
7.2.4. Global Sports Apparel Market, By Synthetic, 2016-2028 (US$ Bn)
7.3. Global Sports Apparel Market, by Type of Print, 2016-2028(US$ Bn)
7.3.1. Overview
7.3.2. Global Sports Apparel Market, By Type of Print, 2021 vs 2028 (in%)
7.3.3. Global Sports Apparel Market, By Water Based, 2016-2028 (US$ Bn)
7.3.4. Global Sports Apparel Market, By Silicone Emboss, 2016-2028 (US$ Bn)
7.3.5. Global Sports Apparel Market, By Reflective Transfer, 2016-2028 (US$ Bn)
7.3.6. Global Sports Apparel Market, By Pigment, 2016-2028 (US$ Bn)
7.3.7. Global Sports Apparel Market, By High Density, 2016-2028 (US$ Bn)
7.3.8. Global Sports Apparel Market, By Foil, 2016-2028 (US$ Bn)
7.3.9. Global Sports Apparel Market, By Glitter, 2016-2028 (US$ Bn)
7.3.10. Global Sports Apparel Market, By Cracking Ink, 2016-2028 (US$ Bn)
7.3.11. Global Sports Apparel Market, By Discharge, 2016-2028 (US$ Bn)
7.3.12. Global Sports Apparel Market, By All Over Print, 2016-2028 (US$ Bn)
7.3.13. Global Sports Apparel Market, By Photo Print, 2016-2028 (US$ Bn)
7.4. Global Sports Apparel Market, By Distribution Channel, 2016-2028(US$ Bn)
7.4.1. Overview
7.4.2. Global Sports Apparel Market, By Distribution Channel, 2021 vs 2028 (in%)
7.4.3. Global Sports Apparel Market, By E-Commerce, 2016-2028 (US$ Bn)
7.4.4. Global Sports Apparel Market, By Supermarket/Hypermarket, 2016-2028 (US$ Bn)
7.4.5. Global Sports Apparel Market, By Brand Outlets, 2016-2028 (US$ Bn)
7.4.6. Global Sports Apparel Market, By Discount Stores, 2016-2028 (US$ Bn)
7.4.7. Global Sports Apparel Market, By Others, 2016-2028 (US$ Bn)
7.5. Global Sports Apparel Market, by End User, 2016-2028(US$ Bn)
7.5.1. Overview
7.5.2. Global Sports Apparel Market, By End User, 2021 vs 2028 (in%)
7.5.3. Global Sports Apparel Market, By Men, 2016-2028 (US$ Bn)
7.5.4. Global Sports Apparel Market, By Women, 2016-2028 (US$ Bn)
7.5.5. Global Sports Apparel Market, By Children, 2016-2028 (US$ Bn)

8. North America Sports Apparel Market Analysis
8.1. North America Sports Apparel Market, by Sports, 2016-2028(US$ Bn)
8.1.1. Overview
8.1.2. SRC Analysis
8.2. North America Sports Apparel Market, by Material, 2016-2028(US$ Bn)
8.2.1. Overview
8.2.2. SRC Analysis
8.3. North America Sports Apparel Market, by Type of Print, 2016-2028(US$ Bn)
8.3.1. Overview
8.3.2. SRC Analysis
8.4. North America Sports Apparel Market, By Distribution Channel, 2016-2028(US$ Bn)
8.4.1. Overview
8.4.2. SRC Analysis
8.5. North America Sports Apparel Market, by End User, 2016-2028(US$ Bn)
8.5.1. Overview
8.5.2. SRC Analysis
8.6. North America Sports Apparel Market, by Country, 2016-2028 (US$ Bn)
8.6.1. U.S.
8.6.1.1. U.S. Sports Apparel Market Estimates and Forecast, 2016-2028 (US$ Bn)
8.6.1.2. U.S. Sports Apparel, By Sports, 2016-2028 (US$ Bn)
8.6.1.3. U.S. Sports Apparel, By Material, 2016-2028 (US$ Bn)
8.6.1.4. U.S. Sports Apparel, By Type of Print, 2016-2028 (US$ Bn)
8.6.1.5. U.S. Sports Apparel, By Distribution Channel, 2016-2028 (US$ Bn)
8.6.1.6. U.S. Sports Apparel, By End User, 2016-2028 (US$ Bn)
8.6.2. Canada
8.6.2.1. Canada Sports Apparel Market Estimates and Forecast, 2016-2028 (US$ Bn)
8.6.2.2. Canada Sports Apparel, By Sports, 2016-2028 (US$ Bn)
8.6.2.3. Canada Sports Apparel, By Material, 2016-2028 (US$ Bn)
8.6.2.4. Canada Sports Apparel, By Type of Print, 2016-2028 (US$ Bn)
8.6.2.5. Canada Sports Apparel, By Distribution Channel, 2016-2028 (US$ Bn)
8.6.2.6. Canada Sports Apparel, By End User, 2016-2028 (US$ Bn)

9. Europe Sports Apparel Market Analysis
9.1. Europe Sports Apparel Market, by Sports, 2016-2028(US$ Bn)
9.1.1. Overview
9.1.2. SRC Analysis
9.2. Europe Sports Apparel Market, by Material, 2016-2028(US$ Bn)
9.2.1. Overview
9.2.2. SRC Analysis
9.3. Europe Sports Apparel Market, by Type of Print, 2016-2028(US$ Bn)
9.3.1. Overview
9.3.2. SRC Analysis
9.4. Europe Sports Apparel Market, By Distribution Channel, 2016-2028(US$ Bn)
9.4.1. Overview
9.4.2. SRC Analysis
9.5. Europe Sports Apparel Market, by End User, 2016-2028(US$ Bn)
9.5.1. Overview
9.5.2. SRC Analysis
9.6. Europe Sports Apparel Market, by Country, 2016-2028 (US$ Bn)
9.6.1. Germany
9.6.1.1. Germany Sports Apparel Market Estimates and Forecast, 2016-2028 (US$ Bn)
9.6.1.2. Germany Sports Apparel, By Sports, 2016-2028 (US$ Bn)
9.6.1.3. Germany Sports Apparel, By Material, 2016-2028 (US$ Bn)
9.6.1.4. Germany Sports Apparel, By Type of Print, 2016-2028 (US$ Bn)
9.6.1.5. Germany Sports Apparel, By Distribution Channel, 2016-2028 (US$ Bn)
9.6.1.6. Germany Sports Apparel, By End User, 2016-2028 (US$ Bn)
9.6.2. France
9.6.2.1. France Sports Apparel Market Estimates and Forecast, 2016-2028 (US$ Bn)
9.6.2.2. France Sports Apparel, By Sports, 2016-2028 (US$ Bn)
9.6.2.3. France Sports Apparel, By Material, 2016-2028 (US$ Bn)
9.6.2.4. France Sports Apparel, By Type of Print, 2016-2028 (US$ Bn)
9.6.2.5. France Sports Apparel, By Distribution Channel, 2016-2028 (US$ Bn)
9.6.2.6. France Sports Apparel, By End User, 2016-2028 (US$ Bn)
9.6.3. UK
9.6.3.1. UK Sports Apparel Market Estimates and Forecast, 2016-2028 (US$ Bn)
9.6.3.2. UK Sports Apparel, By Sports, 2016-2028 (US$ Bn)
9.6.3.3. UK Sports Apparel, By Material, 2016-2028 (US$ Bn)
9.6.3.4. UK Sports Apparel, By Type of Print, 2016-2028 (US$ Bn)
9.6.3.5. UK Sports Apparel, By Distribution Channel, 2016-2028 (US$ Bn)
9.6.3.6. UK Sports Apparel, By End User, 2016-2028 (US$ Bn)
9.6.4. Italy
9.6.4.1. Italy Sports Apparel Market Estimates and Forecast, 2016-2028 (US$ Bn)
9.6.4.2. Italy Sports Apparel, By Sports, 2016-2028 (US$ Bn)
9.6.4.3. Italy Sports Apparel, By Material, 2016-2028 (US$ Bn)
9.6.4.4. Italy Sports Apparel, By Type of Print, 2016-2028 (US$ Bn)
9.6.4.5. Italy Sports Apparel, By Distribution Channel, 2016-2028 (US$ Bn)
9.6.4.6. Italy Sports Apparel, By End User, 2016-2028 (US$ Bn)
9.6.5. Spain
9.6.5.1. Spain Sports Apparel Market Estimates and Forecast, 2016-2028 (US$ Bn)
9.6.5.2. Spain Sports Apparel, By Sports, 2016-2028 (US$ Bn)
9.6.5.3. Spain Sports Apparel, By Material, 2016-2028 (US$ Bn)
9.6.5.4. Spain Sports Apparel, By Type of Print, 2016-2028 (US$ Bn)
9.6.5.5. Spain Sports Apparel, By Distribution Channel, 2016-2028 (US$ Bn)
9.6.5.6. Spain Sports Apparel, By End User, 2016-2028 (US$ Bn)
9.6.6. Rest of Europe
9.6.6.1. Rest of Europe Sports Apparel Market Estimates and Forecast, 2016-2028 (US$ Bn)
9.6.6.2. Rest of Europe Sports Apparel, By Sports, 2016-2028 (US$ Bn)
9.6.6.3. Rest of Europe Sports Apparel, By Material, 2016-2028 (US$ Bn)
9.6.6.4. Rest of Europe Sports Apparel, By Type of Print, 2016-2028 (US$ Bn)
9.6.6.5. Rest of Europe Sports Apparel, By Distribution Channel, 2016-2028 (US$ Bn)
9.6.6.6. Rest of Europe Sports Apparel, By End User, 2016-2028 (US$ Bn)

10. Asia Pacific Sports Apparel Market Analysis
10.1. Asia Pacific Sports Apparel Market, by Sports, 2016-2028(US$ Bn)
10.1.1. Overview
10.1.2. SRC Analysis
10.2. Asia Pacific Sports Apparel Market, by Material, 2016-2028(US$ Bn)
10.2.1. Overview
10.2.2. SRC Analysis
10.3. Asia Pacific Sports Apparel Market, by Type of Print, 2016-2028(US$ Bn)
10.3.1. Overview
10.3.2. SRC Analysis
10.4. Asia Pacific Sports Apparel Market, By Distribution Channel, 2016-2028(US$ Bn)
10.4.1. Overview
10.4.2. SRC Analysis
10.5. Asia Pacific Sports Apparel Market, by End User, 2016-2028(US$ Bn)
10.5.1. Overview
10.5.2. SRC Analysis
10.6. Asia Pacific Sports Apparel Market, by Country, 2016-2028 (US$ Bn)
10.6.1. China
10.6.1.1. China Sports Apparel Market Estimates and Forecast, 2016-2028 (US$ Bn)
10.6.1.2. China Sports Apparel, By Sports, 2016-2028 (US$ Bn)
10.6.1.3. China Sports Apparel, By Material, 2016-2028 (US$ Bn)
10.6.1.4. China Sports Apparel, By Type of Print, 2016-2028 (US$ Bn)
10.6.1.5. China Sports Apparel, By Distribution Channel, 2016-2028 (US$ Bn)
10.6.1.6. China Sports Apparel, By End User, 2016-2028 (US$ Bn)
10.6.2. Japan
10.6.2.1. Japan Sports Apparel Market Estimates and Forecast, 2016-2028 (US$ Bn)
10.6.2.2. Japan Sports Apparel, By Sports, 2016-2028 (US$ Bn)
10.6.2.3. Japan Sports Apparel, By Material, 2016-2028 (US$ Bn)
10.6.2.4. Japan Sports Apparel, By Type of Print, 2016-2028 (US$ Bn)
10.6.2.5. Japan Sports Apparel, By Distribution Channel, 2016-2028 (US$ Bn)
10.6.2.6. Japan Sports Apparel, By End User, 2016-2028 (US$ Bn)
10.6.3. India
10.6.3.1. India Sports Apparel Market Estimates and Forecast, 2016-2028 (US$ Bn)
10.6.3.2. India Sports Apparel, By Sports, 2016-2028 (US$ Bn)
10.6.3.3. India Sports Apparel, By Material, 2016-2028 (US$ Bn)
10.6.3.4. India Sports Apparel, By Type of Print, 2016-2028 (US$ Bn)
10.6.3.5. India Sports Apparel, By Distribution Channel, 2016-2028 (US$ Bn)
10.6.3.6. India Sports Apparel, By End User, 2016-2028 (US$ Bn)
10.6.4. South Korea
10.6.4.1. South Korea Sports Apparel Market Estimates and Forecast, 2016-2028 (US$ Bn)
10.6.4.2. South Korea Sports Apparel, By Sports, 2016-2028 (US$ Bn)
10.6.4.3. South Korea Sports Apparel, By Material, 2016-2028 (US$ Bn)
10.6.4.4. South Korea Sports Apparel, By Type of Print, 2016-2028 (US$ Bn)
10.6.4.5. South Korea Sports Apparel, By Distribution Channel, 2016-2028 (US$ Bn)
10.6.4.6. South Korea Sports Apparel, By End User, 2016-2028 (US$ Bn)
10.6.5. South-East Asia
10.6.5.1. South-East Asia Sports Apparel Market Estimates and Forecast, 2016-2028 (US$ Bn)
10.6.5.2. South-East Asia Sports Apparel, By Sports, 2016-2028 (US$ Bn)
10.6.5.3. South-East Asia Sports Apparel, By Material, 2016-2028 (US$ Bn)
10.6.5.4. South-East Asia Sports Apparel, By Type of Print, 2016-2028 (US$ Bn)
10.6.5.5. South-East Asia Sports Apparel, By Distribution Channel, 2016-2028 (US$ Bn)
10.6.5.6. South-East Asia Sports Apparel, By End User, 2016-2028 (US$ Bn)
10.6.6. Rest of Asia Pacific
10.6.6.1. Rest of Asia Pacific Sports Apparel Market Estimates and Forecast, 2016-2028 (US$ Bn)
10.6.6.2. Rest of Asia Pacific Sports Apparel, By Sports, 2016-2028 (US$ Bn)
10.6.6.3. Rest of Asia Pacific Sports Apparel, By Material, 2016-2028 (US$ Bn)
10.6.6.4. Rest of Asia Pacific Sports Apparel, By Type of Print, 2016-2028 (US$ Bn)
10.6.6.5. Rest of Asia Pacific Sports Apparel, By Distribution Channel, 2016-2028 (US$ Bn)
10.6.6.6. Rest of Asia Pacific Sports Apparel, By End User, 2016-2028 (US$ Bn)

11. Latin America Sports Apparel Market Analysis
11.1. Latin America Sports Apparel Market, by Sports, 2016-2028(US$ Bn)
11.1.1. Overview
11.1.2. SRC Analysis
11.2. Latin America Sports Apparel Market, by Material, 2016-2028(US$ Bn)
11.2.1. Overview
11.2.2. SRC Analysis
11.3. Latin America Sports Apparel Market, by Type of Print, 2016-2028(US$ Bn)
11.3.1. Overview
11.3.2. SRC Analysis
11.4. Latin America Sports Apparel Market, By Distribution Channel, 2016-2028(US$ Bn)
11.4.1. Overview
11.4.2. SRC Analysis
11.5. Latin America Sports Apparel Market, by End User, 2016-2028(US$ Bn)
11.5.1. Overview
11.5.2. SRC Analysis
11.6. Latin America Sports Apparel Market, by Country, 2016-2028 (US$ Bn)
11.6.1. Brazil
11.6.1.1. Brazil Sports Apparel Market Estimates and Forecast, 2016-2028 (US$ Bn)
11.6.1.2. Brazil Sports Apparel, By Sports, 2016-2028 (US$ Bn)
11.6.1.3. Brazil Sports Apparel, By Material, 2016-2028 (US$ Bn)
11.6.1.4. Brazil Sports Apparel, By Type of Print, 2016-2028 (US$ Bn)
11.6.1.5. Brazil Sports Apparel, By Distribution Channel, 2016-2028 (US$ Bn)
11.6.1.6. Brazil Sports Apparel, By End User, 2016-2028 (US$ Bn)
11.6.2. Mexico
11.6.2.1. Mexico Sports Apparel Market Estimates and Forecast, 2016-2028 (US$ Bn)
11.6.2.2. Mexico Sports Apparel, By Sports, 2016-2028 (US$ Bn)
11.6.2.3. Mexico Sports Apparel, By Material, 2016-2028 (US$ Bn)
11.6.2.4. Mexico Sports Apparel, By Type of Print, 2016-2028 (US$ Bn)
11.6.2.5. Mexico Sports Apparel, By Distribution Channel, 2016-2028 (US$ Bn)
11.6.2.6. Mexico Sports Apparel, By End User, 2016-2028 (US$ Bn)
11.6.3. Rest of Latin America
11.6.3.1. Rest of Latin America Sports Apparel Market Estimates and Forecast, 2016-2028 (US$ Bn)
11.6.3.2. Rest of Latin America Sports Apparel, By Sports, 2016-2028 (US$ Bn)
11.6.3.3. Rest of Latin America Sports Apparel, By Material, 2016-2028 (US$ Bn)
11.6.3.4. Rest of Latin America Sports Apparel, By Type of Print, 2016-2028 (US$ Bn)
11.6.3.5. Rest of Latin America Sports Apparel, By Distribution Channel, 2016-2028 (US$ Bn)
11.6.3.6. Rest of Latin America Sports Apparel, By End User, 2016-2028 (US$ Bn)

12. Middle East and Africa Sports Apparel Market Analysis
12.1. Middle East and Africa Sports Apparel Market, by Sports, 2016-2028(US$ Bn)
12.1.1. Overview
12.1.2. SRC Analysis
12.2. Middle East and Africa Sports Apparel Market, by Material, 2016-2028(US$ Bn)
12.2.1. Overview
12.2.2. SRC Analysis
12.3. Middle East and Africa Sports Apparel Market, by Type of Print, 2016-2028(US$ Bn)
12.3.1. Overview
12.3.2. SRC Analysis
12.4. Middle East and Africa Sports Apparel Market, By Distribution Channel, 2016-2028(US$ Bn)
12.4.1. Overview
12.4.2. SRC Analysis
12.5. Middle East and Africa Sports Apparel Market, by End User, 2016-2028(US$ Bn)
12.5.1. Overview
12.5.2. SRC Analysis
12.6. Middle East and Africa Sports Apparel Market, by Country, 2016-2028 (US$ Bn)
12.6.1. GCC Countries
12.6.1.1. GCC Countries Sports Apparel Market Estimates and Forecast, 2016-2028 (US$ Bn)
12.6.1.2. GCC Countries Sports Apparel, By Sports, 2016-2028 (US$ Bn)
12.6.1.3. GCC Countries Sports Apparel, By Material, 2016-2028 (US$ Bn)
12.6.1.4. GCC Countries Sports Apparel, By Type of Print, 2016-2028 (US$ Bn)
12.6.1.5. GCC Countries Sports Apparel, By Distribution Channel, 2016-2028 (US$ Bn)
12.6.1.6. GCC Countries Sports Apparel, By End User, 2016-2028 (US$ Bn)
12.6.2. South Africa
12.6.2.1. South Africa Sports Apparel Market Estimates and Forecast, 2016-2028 (US$ Bn)
12.6.2.2. South Africa Sports Apparel, By Sports, 2016-2028 (US$ Bn)
12.6.2.3. South Africa Sports Apparel, By Material, 2016-2028 (US$ Bn)
12.6.2.4. sz(US$ Bn)
12.6.2.5. South Africa Sports Apparel, By Distribution Channel, 2016-2028 (US$ Bn)
12.6.2.6. South Africa Sports Apparel, By End User, 2016-2028 (US$ Bn)
12.6.3. Rest of Middle East and Africa
12.6.3.1. Rest of Middle East and Africa Sports Apparel Market Estimates and Forecast, 2016-2028 (US$ Bn)
12.6.3.2. Rest of Middle East and Africa Sports Apparel, By Sports, 2016-2028 (US$ Bn)
12.6.3.3. Rest of Middle East and Africa Sports Apparel, By Material, 2016-2028 (US$ Bn)
12.6.3.4. Rest of Middle East and Africa Sports Apparel, By Type of Print, 2016-2028 (US$ Bn)
12.6.3.5. Rest of Middle East and Africa Sports Apparel, By Distribution Channel, 2016-2028 (US$ Bn)
12.6.3.6. Rest of Middle East and Africa Sports Apparel, By End User, 2016-2028 (US$ Bn)

13. Company Profiles
13.1. V.F. Corporation (U.S.)
13.1.1. Company Overview
13.1.2. Products/Type of Prints Portfolio
13.1.3. Geographical Presence
13.1.4. Financial Summary
13.1.4.1. Market Revenue and Net Profit (2019-2021)
13.1.4.2. Business Segment Revenue Analysis
13.1.4.3. Geographical Revenue Analysis
13.2. Columbia Sportswear Company (U.S.)
13.3. Adidas (Germany)
13.4. Amer Sports (Finland)
13.5. DESCENTE LTD (Japan)
13.6. Decathlon Sports India Pvt Ltd (India)
13.7. Lafuma (France)
13.8. Group Rossignol Inc. (U.S.)
13.9. Volcom, LLC. (U.S.)
13.10. SPYDER ACTIVE SPORTS (U.S.)
13.11. Halti Global Store. (Finland)
13.12. Under Armour Inc, (U.S.), BOGNER (U.S.)
13.13. Trek Kit India (India)
13.14. Tube Pro Inc (Canada)
13.15. Airhead Sports Group (U.S.)
13.16. L.L. Bean Inc (U.S.)
13.17. Agit Global, Inc. (U.S.)
13.18. Emsco Group (U.S.)
13.19. Slippery Racer (U.S.)
13.20. Gizmo Riders (U.S.)
13.21. Zipfy Inc, (Canada)

List of Figures
FIG. 1 Global Sports Apparel Market: Research Methodology
FIG. 2 Market Size Estimation – Top Down & Bottom up Approach
FIG. 3 Global Sports Apparel Market Segmentation
FIG. 4 Global Sports Apparel Market, by Sports, 2021 (US$ Bn)
FIG. 5 Global Sports Apparel Market, by Material, 2021 (US$ Bn)
FIG. 6 Global Sports Apparel Market, by Type of Print Type, 2021 (US$ Bn)
FIG. 7 Global Sports Apparel Market, By Distribution Channel, 2021 (US$ Bn)
FIG. 8 Global Sports Apparel Market, by End User, 2021 (US$ Bn)
FIG. 9 Global Sports Apparel Market, by Geography, 2021 (US$ Bn)
FIG. 10 Attractive Investment Proposition, by Sports, 2021
FIG. 11 Attractive Investment Proposition, by Material, 2021
FIG. 12 Attractive Investment Proposition, by Type of Print Type, 2021
FIG. 13 Attractive Investment Proposition, By Distribution Channel, 2021
FIG. 14 Attractive Investment Proposition, by End User, 2021
FIG. 15 Attractive Investment Proposition, by Geography, 2021
FIG. 16 Global Market Share Analysis of Key Sports Apparel Market Manufacturers, 2021
FIG. 17 Global Market Positioning of Key Sports Apparel Market Manufacturers, 2021
FIG. 18 Global Sports Apparel Market Value Contribution, By Sports, 2021 & 2028 (Value %)
FIG. 19 Global Sports Apparel Market, by Sports, Value, 2016-2028 (US$ Bn)
FIG. 20 Global Sports Apparel Market, by Soccer, Value, 2016-2028 (US$ Bn)
FIG. 21 Global Sports Apparel Market, by Baseball, Value, 2016-2028 (US$ Bn)
FIG. 22 Global Sports Apparel Market, Basketball, Value, 2016-2028 (US$ Bn)
FIG. 23 Global Sports Apparel Market Value Contribution, By Material, 2021 & 2028 (Value %)
FIG. 24 Global Sports Apparel Market, by Natural, Value, 2016-2028 (US$ Bn)
FIG. 25 Global Sports Apparel Market, by Synthetic, Value, 2016-2028 (US$ Bn)
FIG. 26 Global Sports Apparel Market Value Contribution, By Type of Print, 2021 & 2028 (Value %)
FIG. 27 Global Sports Apparel Market, by Water Based, Value, 2016-2028 (US$ Bn)
FIG. 28 Global Sports Apparel Market, by Silicone Emboss, Value, 2016-2028 (US$ Bn)
FIG. 29 Global Sports Apparel Market, by Reflective Transfer, Value, 2016-2028 (US$ Bn)
FIG. 30 Global Sports Apparel Market, by Pigment, Value, 2016-2028 (US$ Bn)
FIG. 31 Global Sports Apparel Market, by High Density, Value, 2016-2028 (US$ Bn)
FIG. 32 Global Sports Apparel Market, by Foil, Value, 2016-2028 (US$ Bn)
FIG. 33 Global Sports Apparel Market, by Glitter, Value, 2016-2028 (US$ Bn)
FIG. 34 Global Sports Apparel Market, by Cracking Ink, Value, 2016-2028 (US$ Bn)
FIG. 35 Global Sports Apparel Market, by Discharge, Value, 2016-2028 (US$ Bn)
FIG. 36 Global Sports Apparel Market, by All Over Print, Value, 2016-2028 (US$ Bn)
FIG. 37 Global Sports Apparel Market, by Photo Print, Value, 2016-2028 (US$ Bn)
FIG. 38 Global Sports Apparel Market, by Others, Value, 2016-2028 (US$ Bn)

FIG. 39 Global Sports Apparel Market Value Contribution, By Distribution Channel, 2021 & 2028 (Value %)
FIG. 40 Global Sports Apparel Market, by E-Commerce, Value, 2016-2028 (US$ Bn)
FIG. 41 Global Sports Apparel Market, by Supermarket/Hypermarket, Value, 2016-2028 (US$ Bn)
FIG. 42 Global Sports Apparel Market, by Brand Outlets, Value, 2016-2028 (US$ Bn)
FIG. 43 Global Sports Apparel Market, by Discount Stores, Value, 2016-2028 (US$ Bn)
FIG. 44 Global Sports Apparel Market, by Others, Value, 2016-2028 (US$ Bn)
FIG. 45 Global Sports Apparel Market Value Contribution, By End User, 2021 & 2028 (Value %)
FIG. 46 Global Sports Apparel Market, by Men, Value, 2016-2028 (US$ Bn)
FIG. 47 Global Sports Apparel Market, by Women, Value, 2016-2028 (US$ Bn)
FIG. 48 Global Sports Apparel Market, by Children, Value, 2016-2028 (US$ Bn)
FIG. 49 North America Sports Apparel Market, 2016-2028 (US$ Bn)
FIG. 50 U.S. Sports Apparel Market, 2016-2028 (US$ Bn)
FIG. 51 Canada Sports Apparel Market, 2016-2028 (US$ Bn)
FIG. 52 Europe Sports Apparel Market, 2016-2028 (US$ Bn)
FIG. 53 Germany Sports Apparel Market, 2016-2028 (US$ Bn)
FIG. 54 France Sports Apparel Market, 2016-2028 (US$ Bn)
FIG. 55 U.K. Sports Apparel Market, 2016-2028 (US$ Bn)
FIG. 56 Italy Sports Apparel Market, 2016-2028 (US$ Bn)
FIG. 57 Spain Sports Apparel Market, 2016-2028 (US$ Bn)
FIG. 58 Rest of Europe Sports Apparel Market, 2016-2028 (US$ Bn)
FIG. 59 Asia Pacific Sports Apparel Market, 2016-2028 (US$ Bn)
FIG. 60 China Sports Apparel Market, 2016-2028 (US$ Bn)
FIG. 61 Japan Sports Apparel Market, 2016-2028 (US$ Bn)
FIG. 62 India Sports Apparel Market, 2016-2028 (US$ Bn)
FIG. 63 South Korea Sports Apparel Market, 2016-2028 (US$ Bn)
FIG. 64 Southeast Asia Sports Apparel Market, 2016-2028 (US$ Bn)
FIG. 65 Rest of Asia Pacific Sports Apparel Market, 2016-2028 (US$ Bn)
FIG. 66 Latin America Sports Apparel Market, 2016-2028 (US$ Bn)
FIG. 67 Brazil Sports Apparel Market, 2016-2028 (US$ Bn)
FIG. 68 Mexico Sports Apparel Market, 2016-2028 (US$ Bn)
FIG. 69 Rest of Latin America Sports Apparel Market, 2016-2028 (US$ Bn)
FIG. 70 Middle East & Africa Sports Apparel Market, 2016-2028 (US$ Bn)
FIG. 71 GCC Countries Sports Apparel Market, 2016-2028 (US$ Bn)
FIG. 72 South Africa Sports Apparel Market, 2016-2028 (US$ Bn)
FIG. 73 Rest of Middle East and Africa Sports Apparel Market, 2016-2028 (US$ Bn)

List of Tables
TABLE 1 Market Snapshot: Global Sports Apparel Market
TABLE 2 Global Sports Apparel Market, by Competitive Benchmarking, 2021
TABLE 3 Global Sports Apparel Market, by Geographical Presence Analysis, 2021
TABLE 4 Global Sports Apparel Market, by Key Strategies Analysis, 2021
TABLE 5 Global Sports Apparel Market, by Sports, 2016-2028 (US$ Bn)
TABLE 6 Global Sports Apparel Market, by Material, 2016-2028 (US$ Bn)
TABLE 7 Global Sports Apparel Market, by Type of Print, 2016-2028 (US$ Bn)
TABLE 8 Global Sports Apparel Market, By Distribution Channel, 2016-2028 (US$ Bn)
TABLE 9 Global Sports Apparel Market, by End User, 2016-2028 (US$ Bn)
TABLE 10 Global Sports Apparel Market, by Geography, 2016-2028 (US$ Bn)
TABLE 11 North America Sports Apparel Market, by Sports, 2016-2028 (US$ Bn)
TABLE 12 North America Sports Apparel Market, by Material, 2016-2028 (US$ Bn)
TABLE 13 North America Sports Apparel Market, by Type of Print, 2016-2028 (US$ Bn)
TABLE 14 North America Sports Apparel Market, By Distribution Channel, 2016-2028 (US$ Bn)
TABLE 15 North America Sports Apparel Market, by End User, 2016-2028 (US$ Bn)
TABLE 16 North America Sports Apparel Market, by Country, 2016-2028 (US$ Bn)
TABLE 17 US Sports Apparel Market, by Sports, 2016-2028 (US$ Bn)
TABLE 18 US Sports Apparel Market, by Material, 2016-2028 (US$ Bn)
TABLE 19 US Sports Apparel Market, by Type of Print, 2016-2028 (US$ Bn)
TABLE 20 US Sports Apparel Market, By Distribution Channel, 2016-2028 (US$ Bn)
TABLE 21 US Sports Apparel Market, by End User, 2016-2028 (US$ Bn)
TABLE 22 Canada Sports Apparel Market, by Sports, 2016-2028 (US$ Bn)
TABLE 23 Canada Sports Apparel Market, by Material, 2016-2028 (US$ Bn)
TABLE 24 Canada Sports Apparel Market, by Type of Print, 2016-2028 (US$ Bn)
TABLE 25 Canada Sports Apparel Market, By Distribution Channel, 2016-2028 (US$ Bn)
TABLE 26 Canada Sports Apparel Market, by End User, 2016-2028 (US$ Bn)
TABLE 27 Europe Sports Apparel Market, by Sports, 2016-2028 (US$ Bn)
TABLE 28 Europe Sports Apparel Market, by Material, 2016-2028 (US$ Bn)
TABLE 29 Europe Sports Apparel Market, by Type of Print, 2016-2028 (US$ Bn)
TABLE 30 Europe Sports Apparel Market, By Distribution Channel, 2016-2028 (US$ Bn)
TABLE 31 Europe Sports Apparel Market, by End User, 2016-2028 (US$ Bn)
TABLE 32 Europe Sports Apparel Market, by Country, 2016-2028 (US$ Bn)
TABLE 33 Germany Sports Apparel Market, by Sports, 2016-2028 (US$ Bn)
TABLE 34 Germany Sports Apparel Market, by Material, 2016-2028 (US$ Bn)
TABLE 35 Germany Sports Apparel Market, by Type of Print, 2016-2028 (US$ Bn)
TABLE 36 Germany Sports Apparel Market, By Distribution Channel, 2016-2028 (US$ Bn)
TABLE 37 Germany Sports Apparel Market, by End User, 2016-2028 (US$ Bn)
TABLE 38 France Sports Apparel Market, by Sports, 2016-2028 (US$ Bn)
TABLE 39 France Sports Apparel Market, by Material, 2016-2028 (US$ Bn)
TABLE 40 France Sports Apparel Market, by Type of Print, 2016-2028 (US$ Bn)
TABLE 41 France Sports Apparel Market, By Distribution Channel, 2016-2028 (US$ Bn)
TABLE 42 France Sports Apparel Market, by End User, 2016-2028 (US$ Bn)
TABLE 43 UK Sports Apparel Market, by Sports, 2016-2028 (US$ Bn)
TABLE 44 UK Sports Apparel Market, by Material, 2016-2028 (US$ Bn)
TABLE 45 UK Sports Apparel Market, by Type of Print, 2016-2028 (US$ Bn)
TABLE 46 UK Sports Apparel Market, By Distribution Channel, 2016-2028 (US$ Bn)
TABLE 47 UK Sports Apparel Market, by End User, 2016-2028 (US$ Bn)
TABLE 48 Italy Sports Apparel Market, by Sports, 2016-2028 (US$ Bn)
TABLE 49 Italy Sports Apparel Market, by Material, 2016-2028 (US$ Bn)
TABLE 50 Italy Sports Apparel Market, by Type of Print, 2016-2028 (US$ Bn)
TABLE 51 Italy Sports Apparel Market, By Distribution Channel, 2016-2028 (US$ Bn)
TABLE 52 Italy Sports Apparel Market, by End User, 2016-2028 (US$ Bn)
TABLE 53 Spain Sports Apparel Market, by Sports, 2016-2028 (US$ Bn)
TABLE 54 Spain Sports Apparel Market, by Material, 2016-2028 (US$ Bn)
TABLE 55 Spain Sports Apparel Market, by Type of Print, 2016-2028 (US$ Bn)
TABLE 56 Spain Sports Apparel Market, By Distribution Channel, 2016-2028 (US$ Bn)
TABLE 57 Spain Sports Apparel Market, by End User, 2016-2028 (US$ Bn)
TABLE 58 Rest of Europe Sports Apparel Market, by Sports, 2016-2028 (US$ Bn)
TABLE 59 Rest of Europe Sports Apparel Market, by Material, 2016-2028 (US$ Bn)
TABLE 60 Rest of Europe Sports Apparel Market, by Type of Print, 2016-2028 (US$ Bn)
TABLE 61 Rest of Europe Sports Apparel Market, By Distribution Channel, 2016-2028 (US$ Bn)
TABLE 62 Rest of Europe Sports Apparel Market, by End User, 2016-2028 (US$ Bn)
TABLE 63 Asia Pacific Sports Apparel Market, by Sports, 2016-2028 (US$ Bn)
TABLE 64 Asia Pacific Sports Apparel Market, by Material, 2016-2028 (US$ Bn)
TABLE 65 Asia Pacific Sports Apparel Market, by Type of Print, 2016-2028 (US$ Bn)
TABLE 66 Asia Pacific Sports Apparel Market, By Distribution Channel, 2016-2028 (US$ Bn)
TABLE 67 Asia Pacific Sports Apparel Market, by End User, 2016-2028 (US$ Bn)
TABLE 68 Asia Pacific Sports Apparel Market, by Country, 2016-2028 (US$ Bn)
TABLE 69 China Sports Apparel Market, by Sports, 2016-2028 (US$ Bn)
TABLE 70 China Sports Apparel Market, by Material, 2016-2028 (US$ Bn)
TABLE 71 China Sports Apparel Market, by Type of Print, 2016-2028 (US$ Bn)
TABLE 72 China Sports Apparel Market, By Distribution Channel, 2016-2028 (US$ Bn)
TABLE 73 China Sports Apparel Market, by End User, 2016-2028 (US$ Bn)
TABLE 74 Japan Sports Apparel Market, by Sports, 2016-2028 (US$ Bn)
TABLE 75 Japan Sports Apparel Market, by Material, 2016-2028 (US$ Bn)
TABLE 76 Japan Sports Apparel Market, by Type of Print, 2016-2028 (US$ Bn)
TABLE 77 Japan Sports Apparel Market, By Distribution Channel, 2016-2028 (US$ Bn)
TABLE 78 Japan Sports Apparel Market, by End User, 2016-2028 (US$ Bn)
TABLE 79 India Sports Apparel Market, by Sports, 2016-2028 (US$ Bn)
TABLE 80 India Sports Apparel Market, by Material, 2016-2028 (US$ Bn)
TABLE 81 India Sports Apparel Market, by Type of Print, 2016-2028 (US$ Bn)
TABLE 82 India Sports Apparel Market, By Distribution Channel, 2016-2028 (US$ Bn)
TABLE 83 India Sports Apparel Market, by End User, 2016-2028 (US$ Bn)
TABLE 84 South Korea Sports Apparel Market, by Sports, 2016-2028 (US$ Bn)
TABLE 85 South Korea Sports Apparel Market, by Material, 2016-2028 (US$ Bn)
TABLE 86 South Korea Sports Apparel Market, by Type of Print, 2016-2028 (US$ Bn)
TABLE 87 South Korea Sports Apparel Market, By Distribution Channel, 2016-2028 (US$ Bn)
TABLE 88 South Korea Sports Apparel Market, by End User, 2016-2028 (US$ Bn)
TABLE 89 South East Asia Sports Apparel Market, by Sports, 2016-2028 (US$ Bn)
TABLE 90 South East Asia Sports Apparel Market, by Material, 2016-2028 (US$ Bn)
TABLE 91 South East Asia Sports Apparel Market, by Type of Print, 2016-2028 (US$ Bn)
TABLE 92 South East Asia Sports Apparel Market, By Distribution Channel, 2016-2028 (US$ Bn)
TABLE 93 South East Asia Sports Apparel Market, by End User, 2016-2028 (US$ Bn)
TABLE 94 Rest of Asia Pacific Sports Apparel Market, by Sports, 2016-2028 (US$ Bn)
TABLE 95 Rest of Asia Pacific Sports Apparel Market, by Material, 2016-2028 (US$ Bn)
TABLE 96 Rest of Asia Pacific Sports Apparel Market, by Type of Print, 2016-2028 (US$ Bn)
TABLE 97 Rest of Asia Pacific Sports Apparel Market, By Distribution Channel, 2016-2028 (US$ Bn)
TABLE 98 Rest of Asia Pacific Sports Apparel Market, by End User, 2016-2028 (US$ Bn)
TABLE 99 Latin America Sports Apparel Market, by Sports, 2016-2028 (US$ Bn)
TABLE 100 Latin America Sports Apparel Market, by Material, 2016-2028 (US$ Bn)
TABLE 101 Latin America Sports Apparel Market, by Type of Print, 2016-2028 (US$ Bn)
TABLE 102 Latin America Sports Apparel Market, By Distribution Channel, 2016-2028 (US$ Bn)
TABLE 103 Latin America Sports Apparel Market, by End User, 2016-2028 (US$ Bn)
TABLE 104 Latin America Sports Apparel Market, by Country, 2016-2028 (US$ Bn)
TABLE 105 Brazil Sports Apparel Market, by Sports, 2016-2028 (US$ Bn)
TABLE 106 Brazil Sports Apparel Market, by Material, 2016-2028 (US$ Bn)
TABLE 107 Brazil Sports Apparel Market, by Type of Print, 2016-2028 (US$ Bn)
TABLE 108 Brazil Sports Apparel Market, By Distribution Channel, 2016-2028 (US$ Bn)
TABLE 109 Brazil Sports Apparel Market, by End User, 2016-2028 (US$ Bn)
TABLE 110 Mexico Sports Apparel Market, by Sports, 2016-2028 (US$ Bn)
TABLE 111 Mexico Sports Apparel Market, by Material, 2016-2028 (US$ Bn)
TABLE 112 Mexico Sports Apparel Market, by Type of Print, 2016-2028 (US$ Bn)
TABLE 113 Mexico Sports Apparel Market, By Distribution Channel, 2016-2028 (US$ Bn)
TABLE 114 Mexico Sports Apparel Market, by End User, 2016-2028 (US$ Bn)
TABLE 115 Rest of Latin America Sports Apparel Market, by Sports, 2016-2028 (US$ Bn)
TABLE 116 Rest of Latin America Sports Apparel Market, by Material, 2016-2028 (US$ Bn)
TABLE 117 Rest of Latin America Sports Apparel Market, by Type of Print, 2016-2028 (US$ Bn)
TABLE 118 Rest of Latin America Sports Apparel Market, By Distribution Channel, 2016-2028 (US$ Bn)
TABLE 119 Rest of Latin America Sports Apparel Market, by End User, 2016-2028 (US$ Bn)
TABLE 120 Middle East and Africa Sports Apparel Market, by Sports, 2016-2028 (US$ Bn)
TABLE 121 Middle East and Africa Sports Apparel Market, by Material, 2016-2028 (US$ Bn)
TABLE 122 Middle East and Africa Sports Apparel Market, by Type of Print, 2016-2028 (US$ Bn)
TABLE 123 Middle East and Africa Sports Apparel Market, By Distribution Channel, 2016-2028 (US$ Bn)
TABLE 124 Middle East and Africa Sports Apparel Market, by End User, 2016-2028 (US$ Bn)
TABLE 125 Middle East and Africa Sports Apparel Market, by Country, 2016-2028 (US$ Bn)
TABLE 126 GCC Countries Sports Apparel Market, by Sports, 2016-2028 (US$ Bn)
TABLE 127 GCC Countries Sports Apparel Market, by Material, 2016-2028 (US$ Bn)
TABLE 128 GCC Countries Sports Apparel Market, by Type of Print, 2016-2028 (US$ Bn)
TABLE 129 GCC Countries Sports Apparel Market, By Distribution Channel, 2016-2028 (US$ Bn)
TABLE 130 GCC Countries Sports Apparel Market, by End User, 2016-2028 (US$ Bn)
TABLE 131 South Africa Sports Apparel Market, by Sports, 2016-2028 (US$ Bn)
TABLE 132 South Africa Sports Apparel Market, by Material, 2016-2028 (US$ Bn)
TABLE 133 South Africa Sports Apparel Market, by Type of Print, 2016-2028 (US$ Bn)
TABLE 134 South Africa Sports Apparel Market, By Distribution Channel, 2016-2028 (US$ Bn)
TABLE 135 South Africa Sports Apparel Market, by End User, 2016-2028 (US$ Bn)
TABLE 136 Rest of Middle East and Africa Sports Apparel Market, by Sports, 2016-2028 (US$ Bn)
TABLE 137 Rest of Middle East and Africa Sports Apparel Market, by Material, 2016-2028 (US$ Bn)
TABLE 138 Rest of Middle East and Africa Sports Apparel Market, by Type of Print, 2016-2028 (US$ Bn)
TABLE 139 Rest of Middle East and Africa Sports Apparel Market, By Distribution Channel, 2016-2028 (US$ Bn)
TABLE 140 Rest of Middle East and Africa Sports Apparel Market, by End User, 2016-2028 (US$ Bn)

Frequently asked questions

How does COVID-19 impact the global Sports Apparel Market?

Even though the COVID-19 pandemic continues to have an impact on businesses across the world, the athletic goods industry has managed to recover to pre-COVID-19 levels of growth despite difficult economic conditions.

Which is the leading region of the market for sports apparel?

The North American sports apparel market is the global market’s highest revenue share. This is attributed to the presence of a large number of regional and international manufacturers of sports apparel across the world.

What are the key drivers for the growth of the sports apparel market?

The rise in demand for fashion-friendly sports apparel has encouraged key players to introduce innovative products that meet consumers’ needs, which is expected to drive global market growth.

Which is the major segment in the sports apparel market by sports?

The soccer segment had a major global market share in 2021.

Which is the major segment in the sports apparel market by material?

The natural segment had a major share in the global market.

U.S. Plus Size Women’s Clothing Market

Published:
Report ID: 35171

Takeout Container Market

Published:
Report ID: 35076

Disinfectant Spray Market

Published:
Report ID: 35060

Outdoor Garden Furniture Market

Published:
Report ID: 35057

Cat Litter Box Market

Published:
Report ID: 35043

UK Plus Size Women’s Clothing Market

Published:
Report ID: 35038

Baby Gates Market

Published:
Report ID: 35035

Art and Sculpture Market

Published:
Report ID: 35032

Floor Care Machine Market

Published:
Report ID: 35029

Latin America Residential Electric Grill Market

Published:
Report ID: 34926

Non-Stick Cookware Market

Published:
Report ID: 34923

Single Serve Coffee Maker Market

Published:
Report ID: 34920

Purchase Options

$2999
Delivery Format: Excel.
$4999
Designed for the individual purchaser.
$6999
Users located at a single corporate site or regional office.
$7999
Allowed for unlimited sharing globally within one company.
Smallform of Sample request

Have a question?

User Profile

Don’t settle for less – trust Mitul to help you find the best solution.

Report delivery within 24 to 48 hours

– Other Info –

What people say?-

User Review

I am very impressed with the information in this report. The author clearly did their research when they came up with this product and it has already given me a lot of ideas.

Jana Schmidt
CEDAR CX Technologies

– Connect with us –

Phone

+91 6232 49 3207


support

24/7 Research Support


sales@credenceresearch.com

– Research Methodology –

Going beyond the basics: advanced techniques in research methodology

– Trusted By –

Pepshi, LG, Nestle
Motorola, Honeywell, Johnson and johnson
LG Chem, SIEMENS, Pfizer
Unilever, Samsonite, QIAGEN