Ayurvedic roots and app-led buying define Indian demand
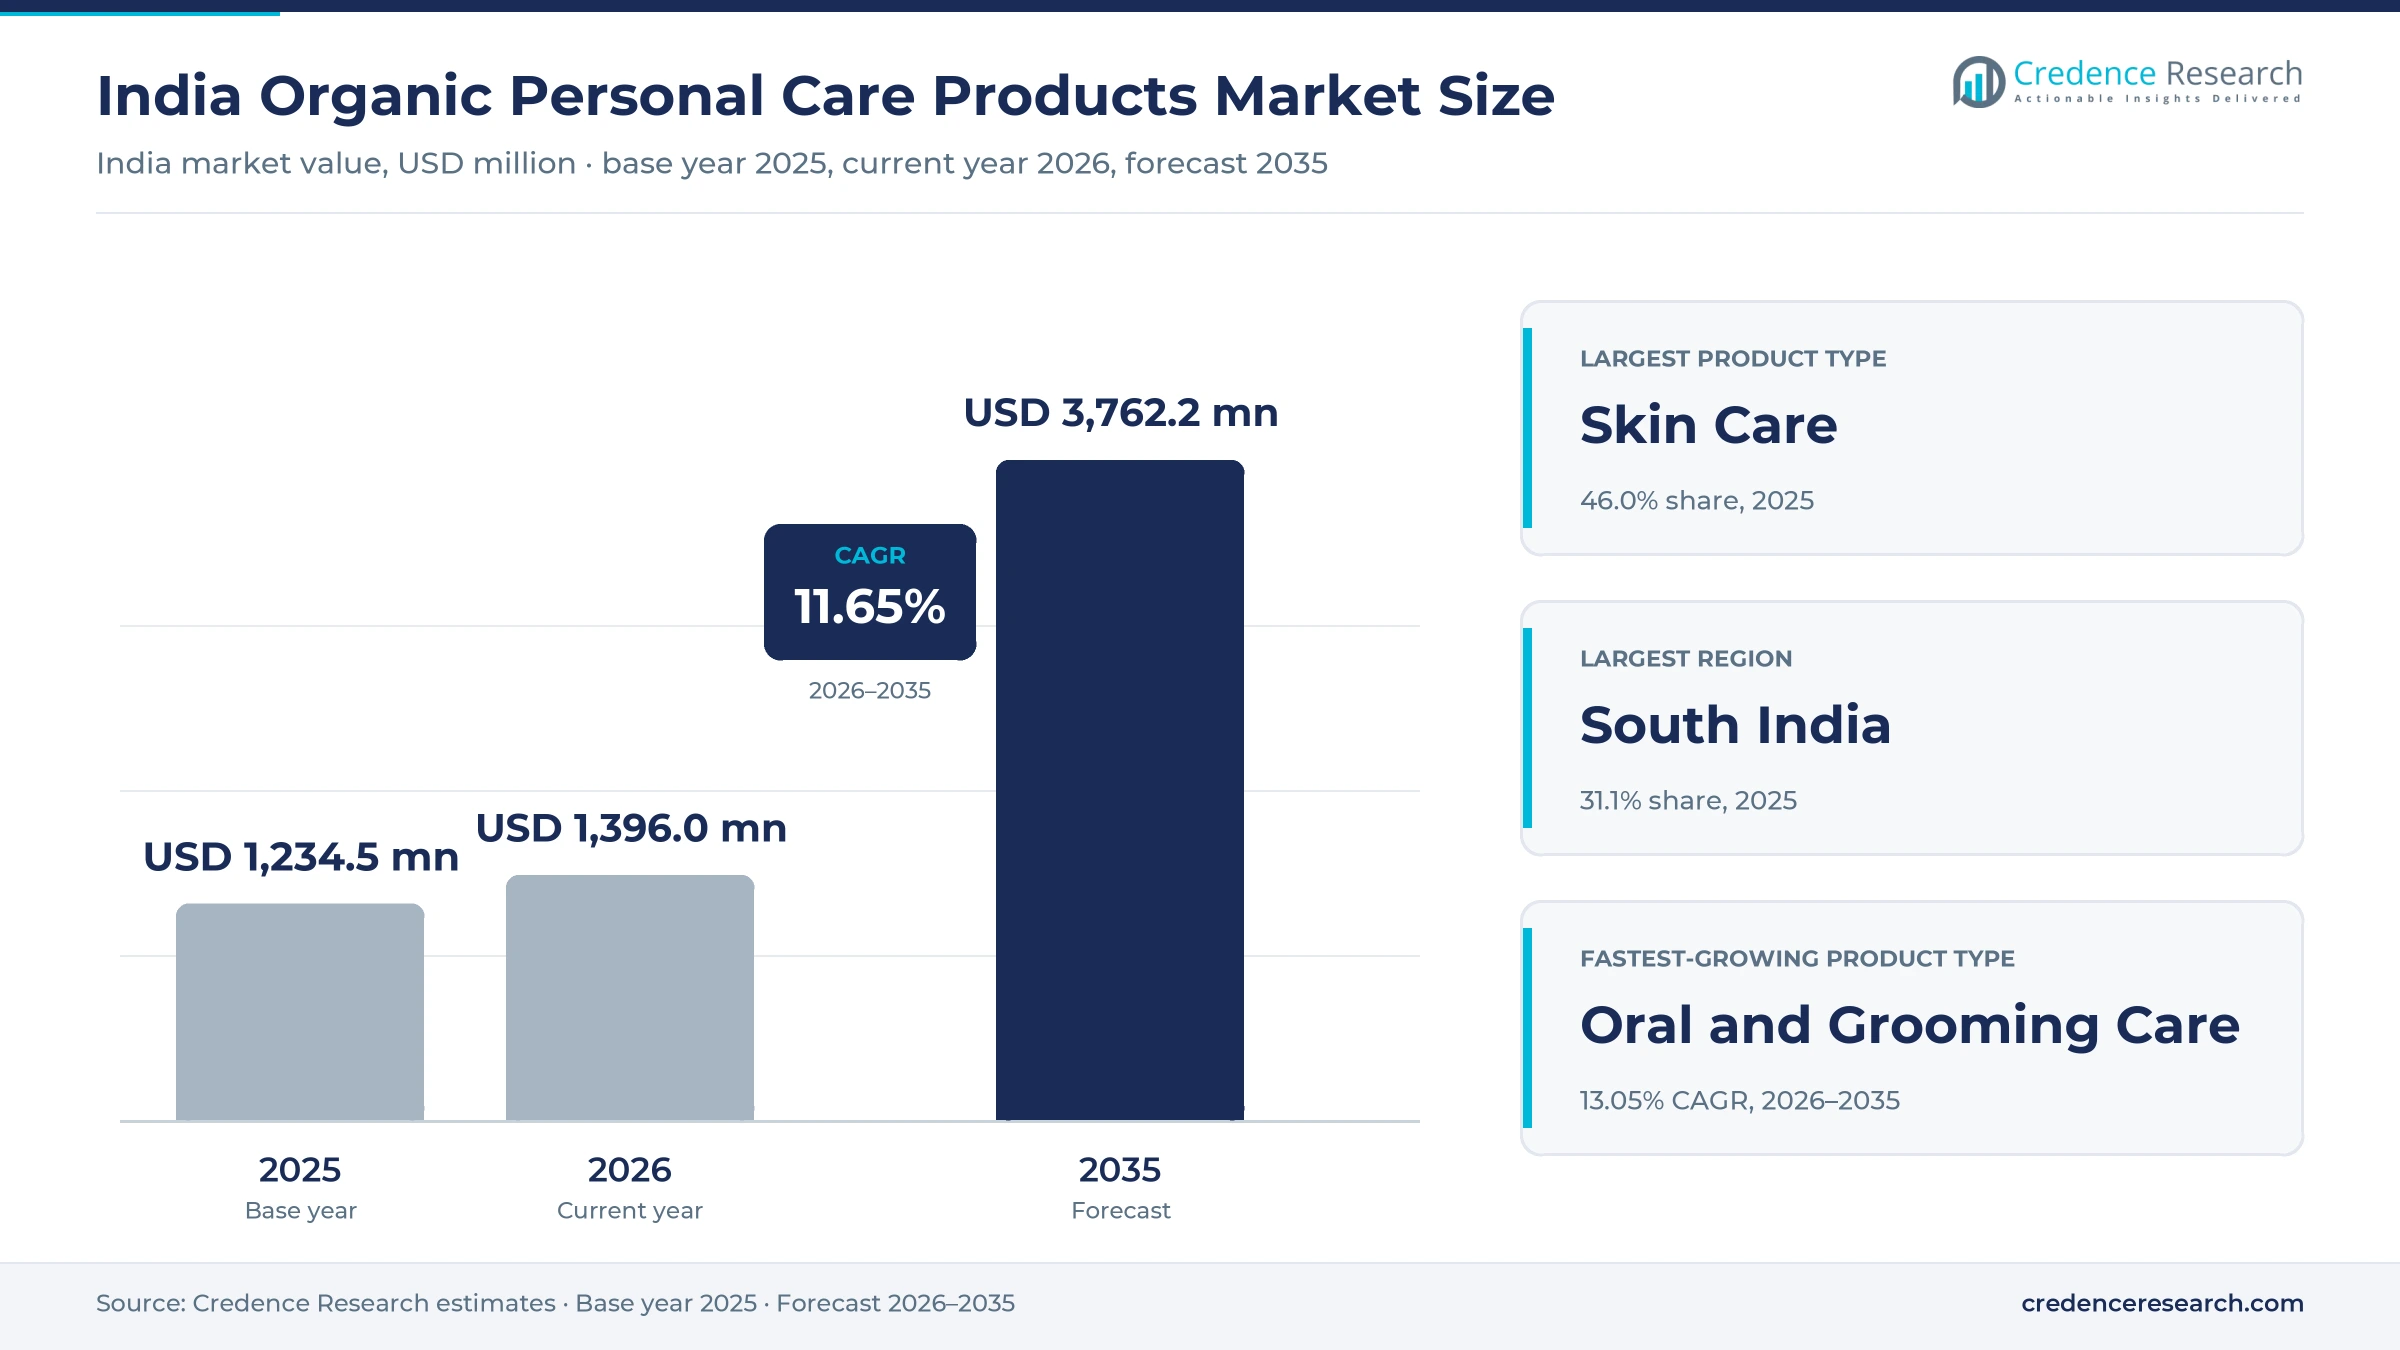
The India organic personal care products market was valued at USD 1.23 billion in 2025 and is projected to increase from USD 1.40 billion in 2026 to USD 3.76 billion by 2035, registering a CAGR of 11.65% during 2026–2035. Demand comes from households replacing conventional cleansers, oils and oral care with botanical alternatives, and from younger shoppers who compare ingredients on beauty apps before buying. South India held the largest regional share, 31.1% in 2025, supported by high household spending in Kerala and specific scalp care demand in Bengaluru. East and Central India is the fastest-growing region at 12.44% a year as branded distribution moves into lower-spending states. The goods and services tax on hair oil, shampoo and toothpaste fell from 18% to 5% on Sept. 22, 2025, narrowing the shelf price gap for everyday herbal lines. Larger groups are also buying in, and Estée Lauder agreed in March 2026 to acquire the rest of luxury Ayurveda brand Forest Essentials.
What does this market count, and how do Indian households buy?
The market counts organic, Ayurvedic and natural skin, hair, bath, oral and grooming lines sold to Indian consumers. Purchases range from small neighborhood store refills of herbal oils and toothpaste to serums ordered on beauty apps and gift sets bought in standalone luxury Ayurveda stores.
The estimate excludes classical Ayurvedic medicines, nutraceuticals, color cosmetics and bulk botanical ingredients sold to manufacturers. Its value chain runs from certified farms and wild collectors through extractors, contract formulators and brand owners to distributors, marketplaces and retailers.
India Organic Personal Care Products Market Insights
- The India organic personal care products market grows from USD 1.23 billion in 2025 to USD 3.76 billion by 2035, an 11.65% CAGR resting on app-led discovery and Ayurvedic trust.
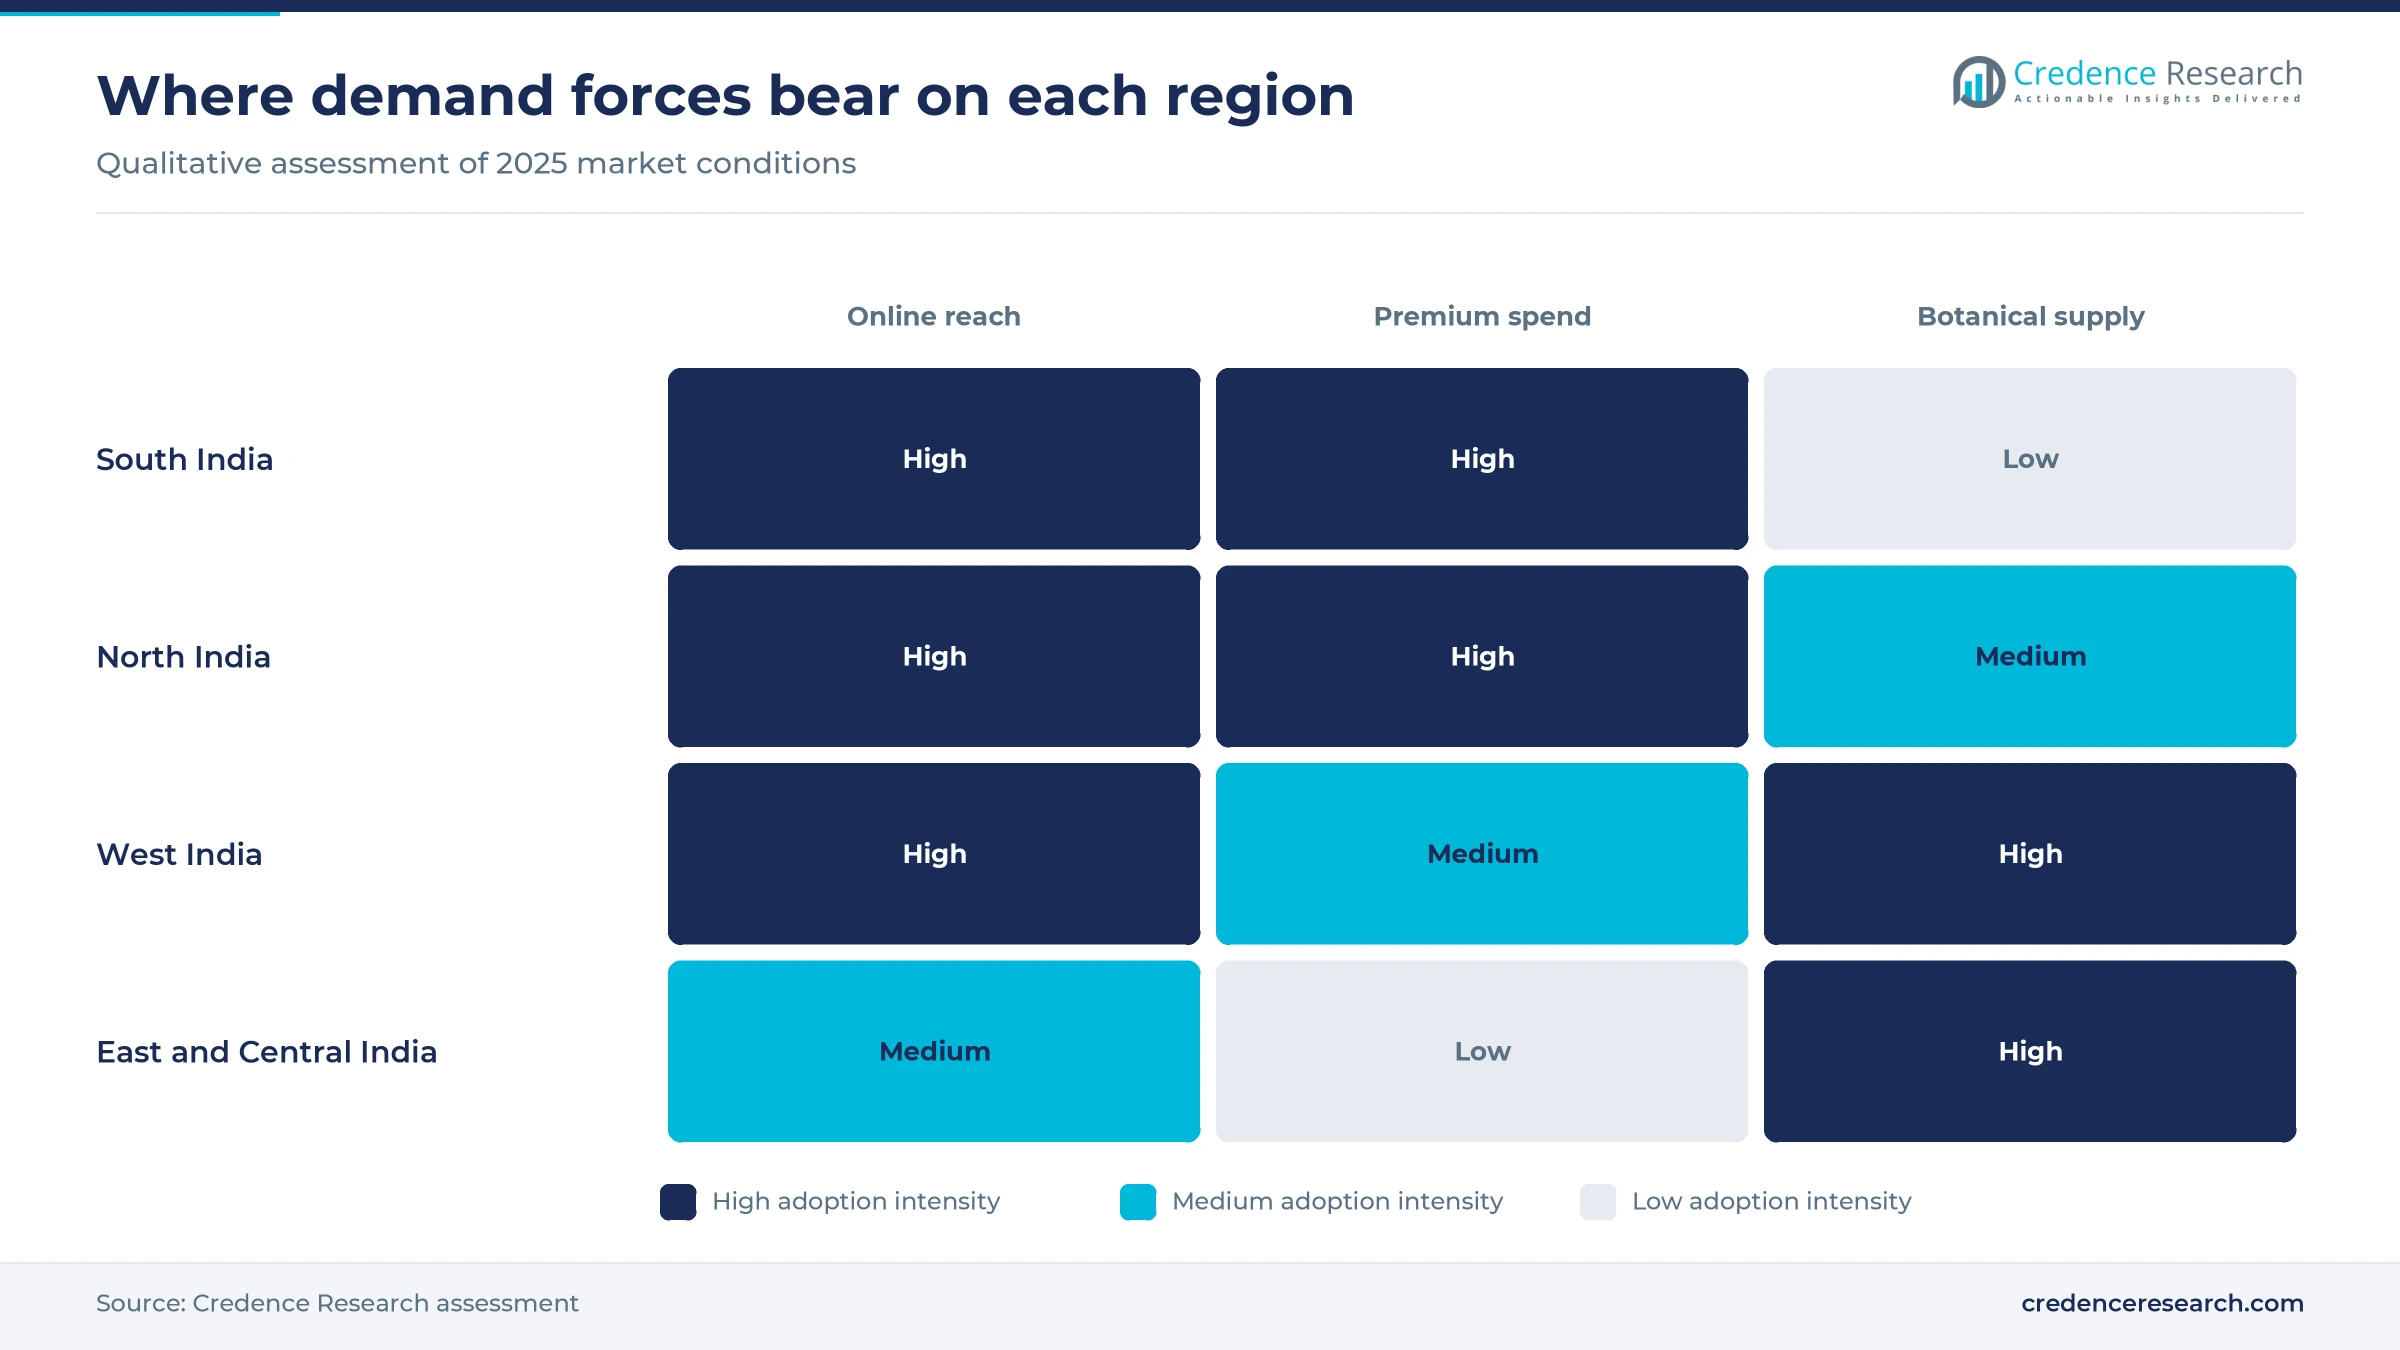
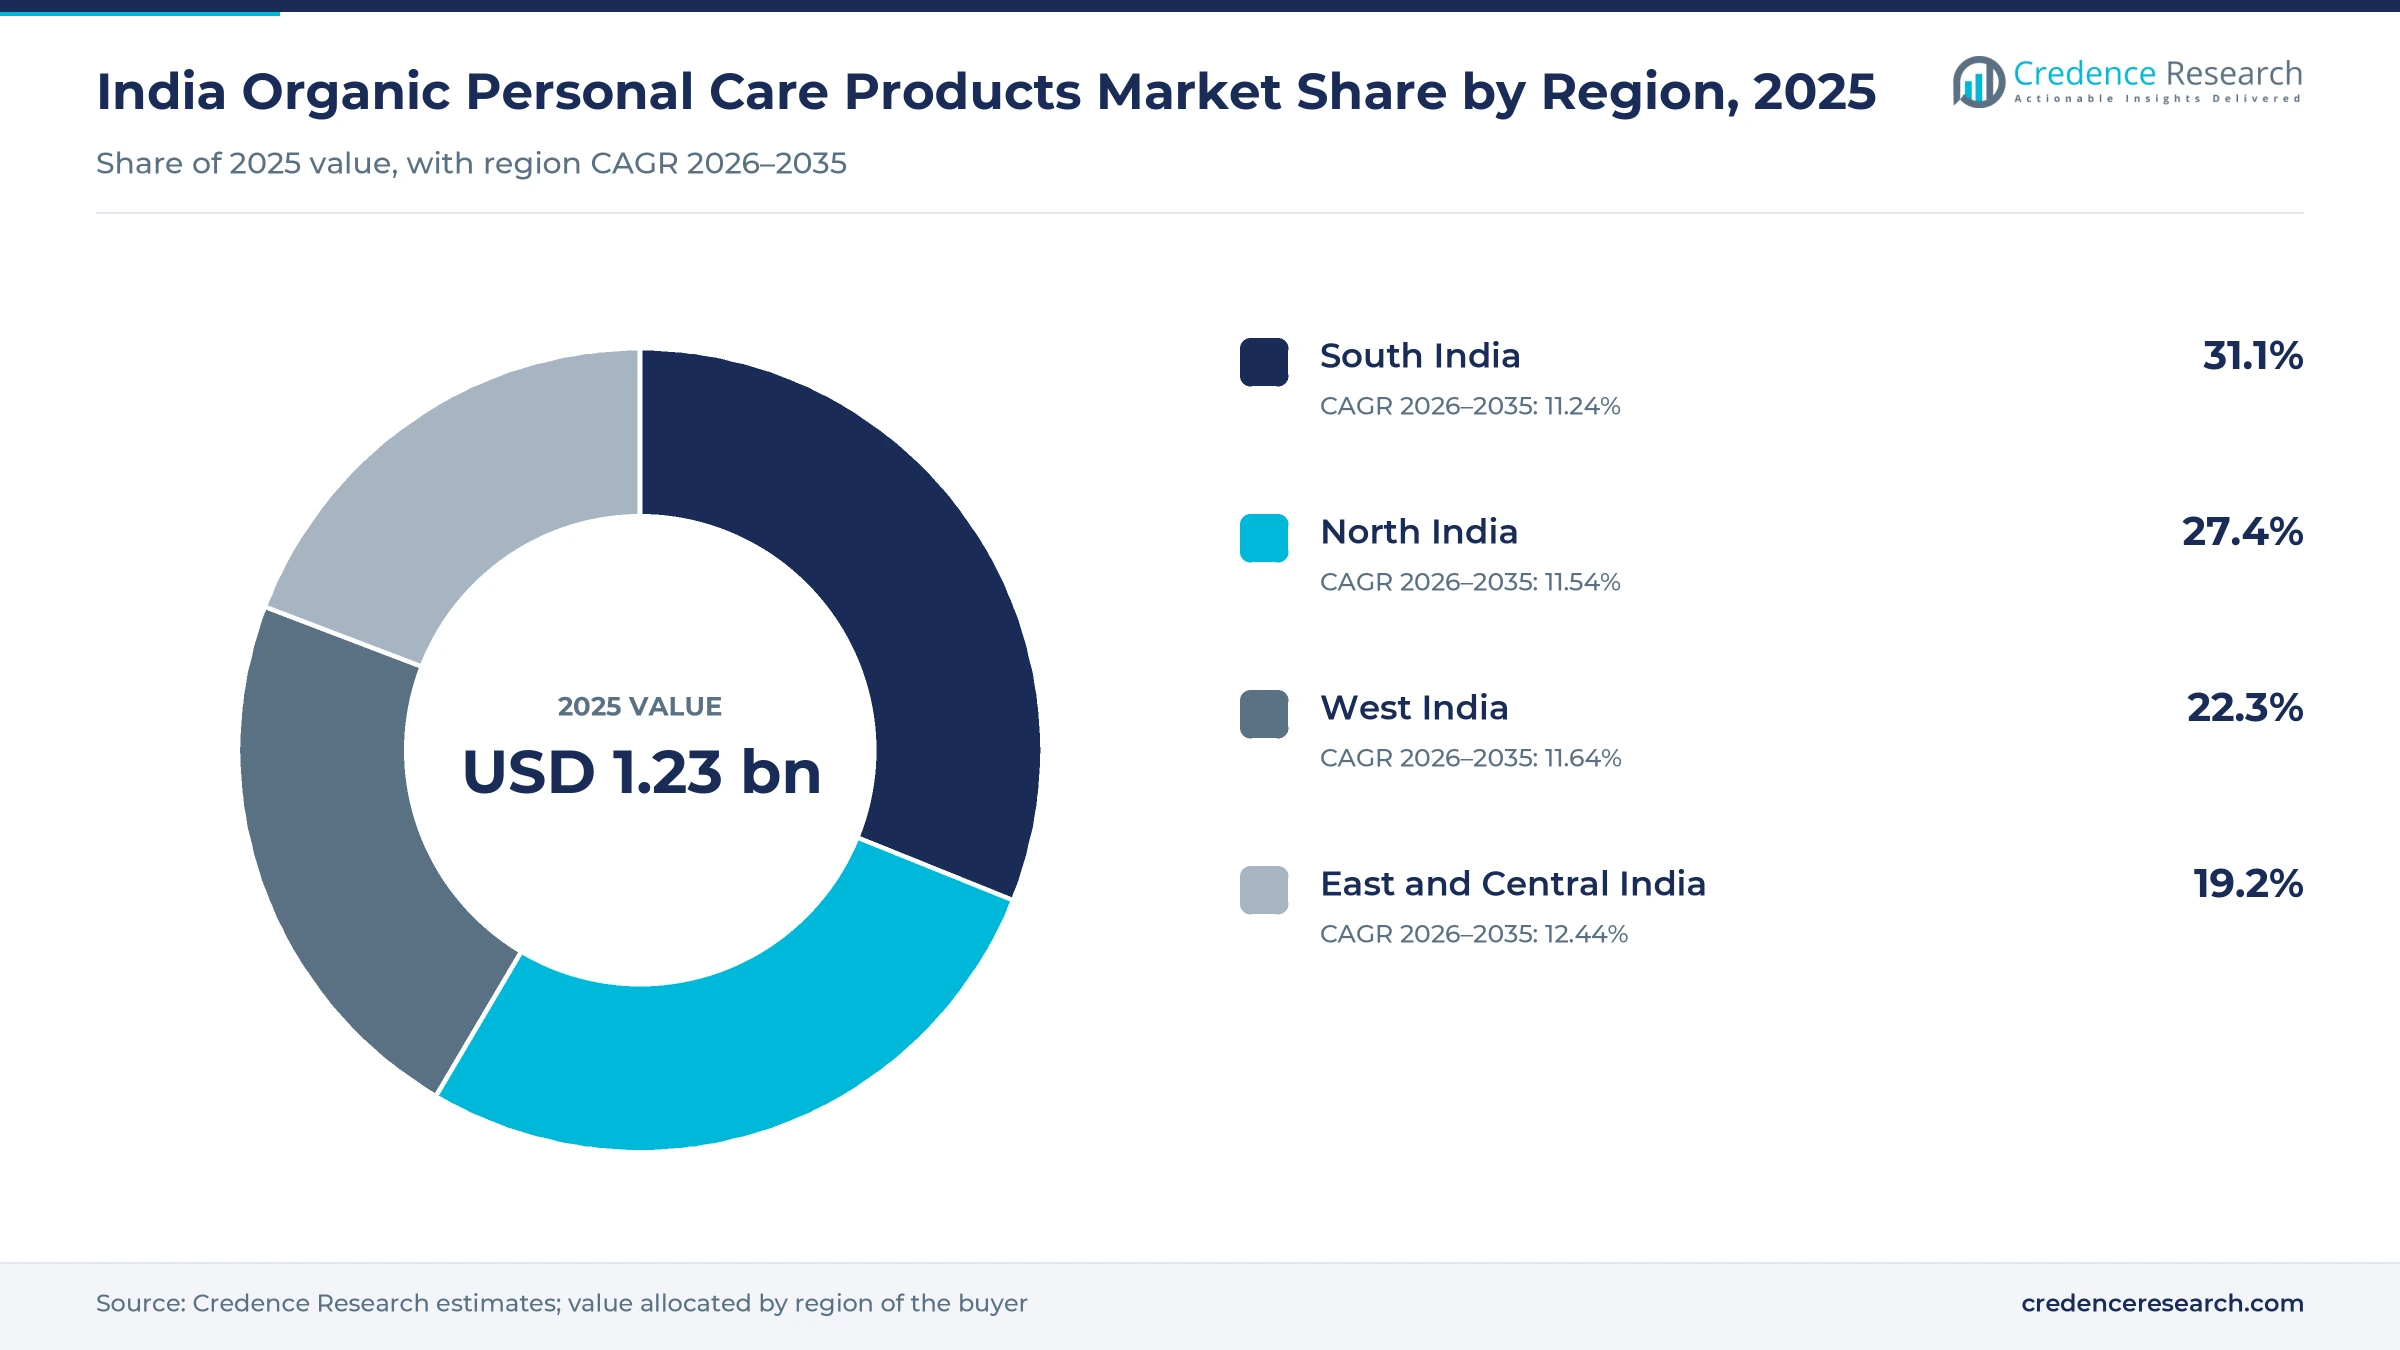
- South India held 31.1% of 2025 value, while East and Central India grows fastest at 12.44% a year as distribution moves deeper into lower-spending states.
- Skin Care held 46.0% of 2025 value, with Oral and Grooming Care the fastest-growing product group at 13.05% a year through 2035.
- Consumer authorities notified greenwashing guidelines on Oct. 15, 2024, so generic terms such as clean and green now need substantiation that brands can show to regulators.
- Estée Lauder, Emami and Nykaa all announced natural or dermocosmetic brand purchases during 2026, which brings larger balance sheets into a field once led by founders.
Skin care leads as oral and grooming lines gain the most
Why does skin care lead while oral and grooming lines grow fastest?
Based on product type, the market is categorized into skin care, hair care, bath and body care, and oral and grooming care. Skin Care led with 46.0% of 2025 value because cleansers and serums drive repeat purchases, and Honasa Consumer reported in August 2026 that Rice Dewy Bright had become the No. 1 face cleanser in its own Mamaearth range. Oral and Grooming Care grows fastest at 13.05% a year as larger groups buy their way in, since Storyboard18 reported an enterprise value of INR 195 crore for men’s brand Reginald Men in Honasa’s purchase. Investywise also reported in November 2025 that Honasa had taken a stake in oral brand Fang.
How do Ayurvedic and certified organic claims compare?
Based on certification positioning, the market is categorized into certified organic, organic-ingredient based, Ayurvedic natural and clean-label natural. Ayurvedic Natural led with 41.0% of 2025 value because Ayurveda is the established language of Indian herbal care, and Angel One reported in May 2026 that Emami paid INR 321 crore for 60% of IncNut, owner of Ayurveda-based Vedix. Certified Organic grows fastest at 13.10% a year as proof now carries commercial weight. Indian Retailer reported in May 2025 that all three Juicy Actives serums carry Ecocert COSMOS Organic certification, while IBEF notes that the national organic program has included cosmetics criteria since 2020.
Where does the price ladder gain the most value?
Based on price tier, the market is categorized into mass, masstige, premium and luxury. Mass led with 40.0% of 2025 value because household buyers respond to small price gaps, and The Week reported that Emami cut Kesh King Gold Ayurvedic Oil from INR 190 to INR 178 for 100 ml when the tax change began on Sept. 22, 2025. Premium grows fastest at 12.91% a year as mid-tier shoppers trade up. Honasa Consumer reported growth above 40% at its younger brands in the June 2026 quarter, with premium serums among the areas of traction, and Nykaa said in August 2026 it was buying 51% of premium dermocosmetic brand Aminu.
Which channels reach the most Indian households?
Based on distribution channel, the market is categorized into online retail, modern retail, pharmacies and traditional retail. Traditional Retail led with 33.0% of 2025 value because the neighborhood store still reaches most families, and Business Recorder reported in July 2025 that Dabur’s direct reach stood at 1.52 million outlets. Honasa Consumer’s coverage crossed about 300,000 outlets by August 2026, which shows digital-first brands now need general trade too. Online Retail grows fastest at 13.25% a year as apps extend past metro cities. According to Flipkart’s GlamUp report of June 2026, almost one-third of its beauty sales come from Tier-2 and smaller towns.
| Segment Group | Leading Sub-segment | Share, 2025 | Fastest-growing Sub-segment | CAGR, 2026–2035 |
|---|---|---|---|---|
| By Product Type | Skin Care | 46.0% | Oral and Grooming Care | 13.05% |
| By Certification Positioning | Ayurvedic Natural | 41.0% | Certified Organic | 13.10% |
| By Price Tier | Mass | 40.0% | Premium | 12.91% |
| By Distribution Channel | Traditional Retail | 33.0% | Online Retail | 13.25% |
Request a Free Sample
Fill in your details and we'll send you a free sample report.
- Sample data tables & charts
- Research methodology
Apps, actives, botanicals and tax relief lift demand
Digital beauty commerce expansion widens brand reach
Beauty apps on India’s e-commerce networks let small natural brands reach shoppers without a national store chain, which matters when ingredient claims need explaining. Nykaa reported beauty gross merchandise value growth of about 28% and more than 20 million annual beauty customers on its Aug. 4, 2026 earnings call. Flipkart’s GlamUp report said in June 2026 that two of three beauty searches on its platform came from non-metro markets, and that Gen Z formed more than half of its beauty buyers. Quick commerce adds a faster route, since IBEF puts beauty sales on Blinkit, Zepto and Swiggy Instamart near USD 1 billion a year across more than 30 million monthly shoppers. As a result, Online Retail grows at 13.25% a year through 2035.
Premiumization and ingredient awareness raise value per pack
Buyers increasingly pay for named actives and provenance rather than a general herbal promise, and that habit raises value per pack. Honasa Consumer’s August 2026 results release said its focus categories grew more than 35%, led by Rice Dewy Bright Face Wash and Rosemary Anti-Hair Fall Shampoo. Inside Retail Asia reported on March 6, 2026 that Estée Lauder was acquiring the remainder of Forest Essentials, a luxury Ayurveda brand with about 200 stores. Spending power is uneven but supportive, because official survey data put average monthly spending per person at INR 6,996 in cities and INR 4,122 in villages during 2023–24. In turn, Premium gains 12.91% a year as shoppers trade up.
Ayurvedic heritage and botanical supply anchor local brands
India’s Ayurvedic tradition gives domestic brands a credibility that imported labels struggle to copy, and state-backed supply supports it. IBEF data show a Ministry of AYUSH budget of INR 4,408.93 crore for FY27, up 20.1%, and a May 2026 agreement between the AYUSH export council and the Spices Board. Wild collection also matters for herbal extract sourcing, since APEDA records for 2024–25 list 2,258,859.50 certified hectares of wild harvest. Product work draws on the same base, and Impact reported in April 2026 that Himalaya BabyCare’s Soothing Baby Powder uses frankincense oil, wheat germ and Yashad Bhasma. Consequently, Ayurvedic Natural remains the largest positioning, at 41.0% of 2025 value.
Tax relief narrows the price gap on daily herbal lines
The 2025 tax reform lowered the entry price of everyday herbal lines, which makes switching from conventional packs easier for value-conscious families. Akashvani News reported that the goods and services tax on hair oil, shampoo, toothpaste and face powder would fall from 18% to 5%. The Week reported on Sept. 18, 2025 that Emami would cut Navratna Ayurvedic Oil Cool from INR 155 to INR 145 for 180 ml from Sept. 22. Store-led demand has responded well, and Honasa Consumer reported growth above 40% in both general and modern trade for the June 2026 quarter. Dabur’s chief executive also said in July 2025 that urban markets still lagged rural growth, according to Business Recorder, which favors lower-priced packs in smaller towns.
Brand buyouts and active-led Ayurveda reshape the field
Shift of founder-led natural brands into larger portfolios
Ownership is moving from founders to groups with distribution and capital, which changes how quickly a natural brand can scale. Storyboard18 reported on April 2, 2026 that Emami had closed a first tranche of about 36.7% in Axiom Ayurveda, making it a subsidiary in the Ayurvedic segment. Angel One reported in May 2026 that Emami also agreed to buy 60% of IncNut, owner of Vedix and SkinKraft. Nykaa said in August 2026 that it would buy 51% of Aminu, with the balance to follow over several years. Cosmetics Design reported that Estée Lauder held 49% of Forest Essentials from 2020 before moving to full control. Its founder and her son continue to run that business, according to the same report, although portfolio owners now set the wider pace.
Rise of active-led Ayurveda blurs herbal and derma lines
Herbal brands increasingly state percentages and clinical language on the pack, because younger buyers compare actives across brands. Indian Retailer reported in May 2025 that Juicy Actives pairs organic certification with a 10% vitamin C serum, a 2% alpha arbutin serum and a lactic acid serum, priced from INR 299 for 10 ml. Angel One described Vedix as customized hair care built on Ayurvedic principles and lifestyle data, while SkinKraft relies on clinically tested ingredients. Impact reported that Himalaya describes its April 2026 baby powder as clinically tested and dermatologically evaluated. This language suits Skin Care, which held 46.0% of 2025 value. As a result, the older line between a herbal label and a derma label is fading in product development.
Opportunity in store-led growth across tier-2 cities
Smaller cities offer an opening for natural brands that have built demand online and now need physical trial. Nykaa said on Aug. 4, 2026 that half of its 324 beauty stores sit in Tier-2 cities and beyond, and that its online Superstore serves about 1,200 cities. Flipkart’s GlamUp report describes “PIN code Beauty,” with hard-water scalp care selling in Bengaluru and barrier repair and hydration products selling in Rajasthan. Honasa Consumer said in August 2026 that BTM Ventures is expanding beyond South India into Maharashtra and new channels. Brands can therefore localize assortments by climate and water conditions rather than running one national range. Such tailoring also favors East and Central India, the fastest-growing region, where brands start from a smaller base.
Opportunity for certified Indian brands in export markets
Export demand gives an opening to Indian brands whose certification already meets foreign buyers’ expectations. IBEF reports AYUSH and herbal product exports of USD 638.71 million in FY26, which shows existing overseas appetite for the wider herbal category. Agrospectrum reported in December 2025 that the eighth edition of the national organic standard began in July 2025, with a mutual recognition arrangement with Australia in force from Sept. 24, 2025. BeautyMatter describes SoulTree, owned by Lotus Herbals since September 2020, as the first Indian brand certified by European agencies. Inside Retail Asia also reported that Forest Essentials plans international expansion through Estée Lauder’s network. Brands holding COSMOS or equivalent seals are best placed, and Certified Organic gains 13.10% a year as a result.
Claim scrutiny, fakes and copra costs test natural brands
Claim scrutiny raises the cost of loose natural labels
India’s consumer authority notified its greenwashing guidelines on Oct. 15, 2024, and Mondaq reports that generic terms such as clean and green now need accessible substantiation. Small founders face the largest burden, because a first offense can bring a fine near USD 11,600. Consequently, unsupported organic labels carry commercial and legal risk across online listings. Brands are responding by moving toward third-party certification and publishing ingredient evidence, although audits add time and expense to each launch.
Fake and contaminated goods weaken consumer trust
Unsafe products damage trust across the category, including brands that follow the rules. Siasat reported in April 2026 that Gujarat regulators seized counterfeit cosmetics worth INR 71.5 lakh in May 2025. Medical Dialogues separately reported in February 2026 that the drug regulator cancelled Kult App’s import registrations after labels on about 50 products failed to match approvals. As a result, marketplaces and brands are under pressure to tighten seller checks, and batch tracing is becoming a practical necessity.
Copra and botanical swings squeeze oil-based margins
Natural oils remain exposed to farm shocks, and large buyers have already felt the effect. Food Business MEA reported in November 2025 that Marico’s gross margin fell 810 basis points in the September quarter as copra prices swung after drought and pests. Parachute volume also fell 3% following price increases, which shows the limit of passing costs to households. Smaller natural brands have less buying power, so many must simplify packs, reformulate or contract supply earlier.
Thin certified supply limits organic scale
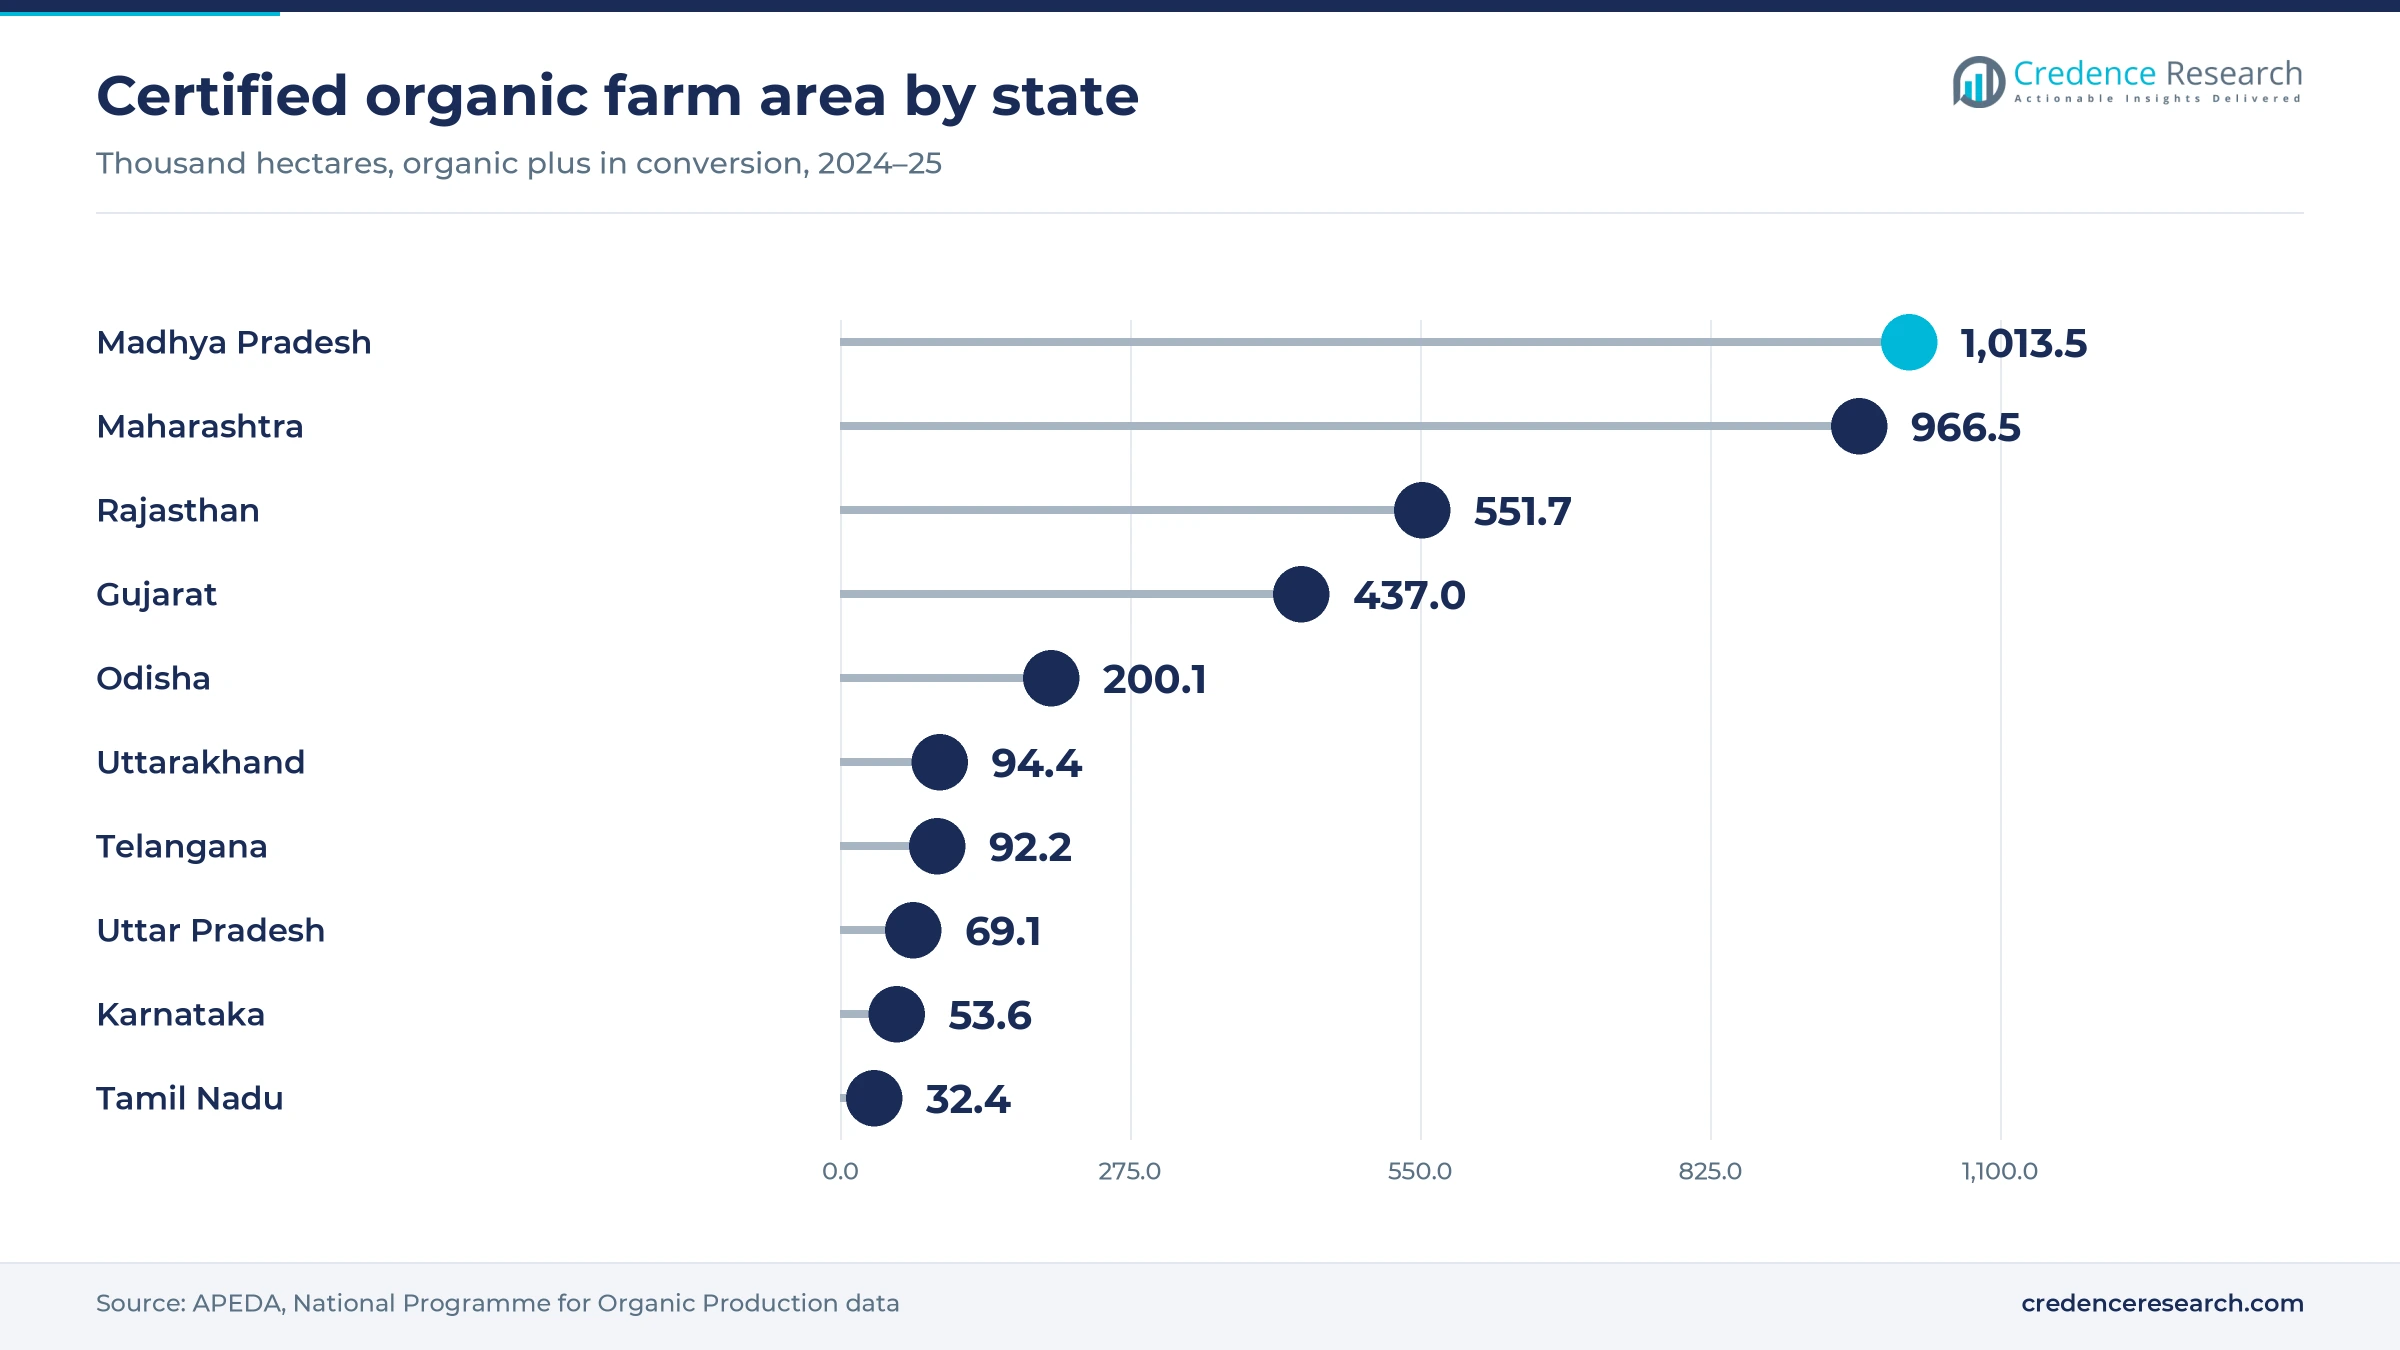
Certified raw material remains narrower than the headline farm figures imply for India organic personal care products. APEDA data for 2024–25 show 1,713,713.97 hectares of the certified farm area still in conversion, which means those crops cannot yet carry a full organic claim. Supply is also concentrated, with Madhya Pradesh and Maharashtra each near one million hectares while Tamil Nadu has 32,430. Brands chasing certified lines therefore face higher sourcing and logistics costs, and many blend certified and conventional ingredients until supply deepens.
East and Central India grow fastest behind South India
| Region | Value, 2025 (USD billion) | Share, 2025 | CAGR, 2026–2035 |
|---|---|---|---|
| South India | 0.38 | 31.1% | 11.24% |
| North India | 0.34 | 27.4% | 11.54% |
| West India | 0.28 | 22.3% | 11.64% |
| East and Central India | 0.24 | 19.2% | 12.44% |
South India leads on household spending and brand reach
South India held 31.1% of 2025 value and grows at 11.24% a year. Flipkart’s GlamUp report singled out Bengaluru for hard-water scalp care demand, while Honasa Consumer’s BTM Ventures built its base in the region before moving north. Certified farm supply is modest, since APEDA records 53,631.61 hectares in Karnataka and 42,903.65 in Kerala, so brands buy botanicals from other states. Kerala’s rural spending of INR 6,611 per person a month in 2023–24, the official survey figure, supports higher-priced lines.
North India pairs heritage brands with hill botanicals
North India held 27.4% of 2025 value and grows at 11.54% a year. Forest Essentials runs its luxury Ayurveda business from New Delhi, and Dabur lists its corporate office in Ghaziabad, so both heritage tiers are rooted here. Rajasthan adds 551,749.55 certified hectares, according to APEDA and Flipkart reports distinct demand there for barrier repair and hydration products. Uttarakhand also matters, with 94,424.76 certified hectares and the female farmer network that BeautyMatter says supplies herbs to SoulTree.
West India combines farm supply with store expansion
West India held 22.3% of 2025 value and grows at 11.64% a year. Maharashtra’s 966,544.71 certified hectares and Gujarat’s 437,033 give the region a large organic raw material base, according to APEDA. Maharashtra also attracts brands moving out of their home markets, and Honasa Consumer named it as the next step for BTM Ventures in August 2026. Enforcement is visible too, since Gujarat’s May 2025 seizure of counterfeit cosmetics shows why buyers increasingly favor recognized labels and authorized sellers.
East and Central India grow from the lowest spending base
East and Central India held 19.2% of 2025 value and grow fastest at 12.44% a year. Madhya Pradesh leads the country with 1,013,456.22 certified hectares, and Odisha adds 200,112.07, according to APEDA. Rural monthly spending of INR 3,441 per person in Madhya Pradesh and INR 3,357 in Odisha during 2023–24 keeps packs small, although lower tax rates now help. Dabur’s 63,000 added direct outlets nationwide in the year to July 2025 give branded herbal ranges more routes into towns like these.
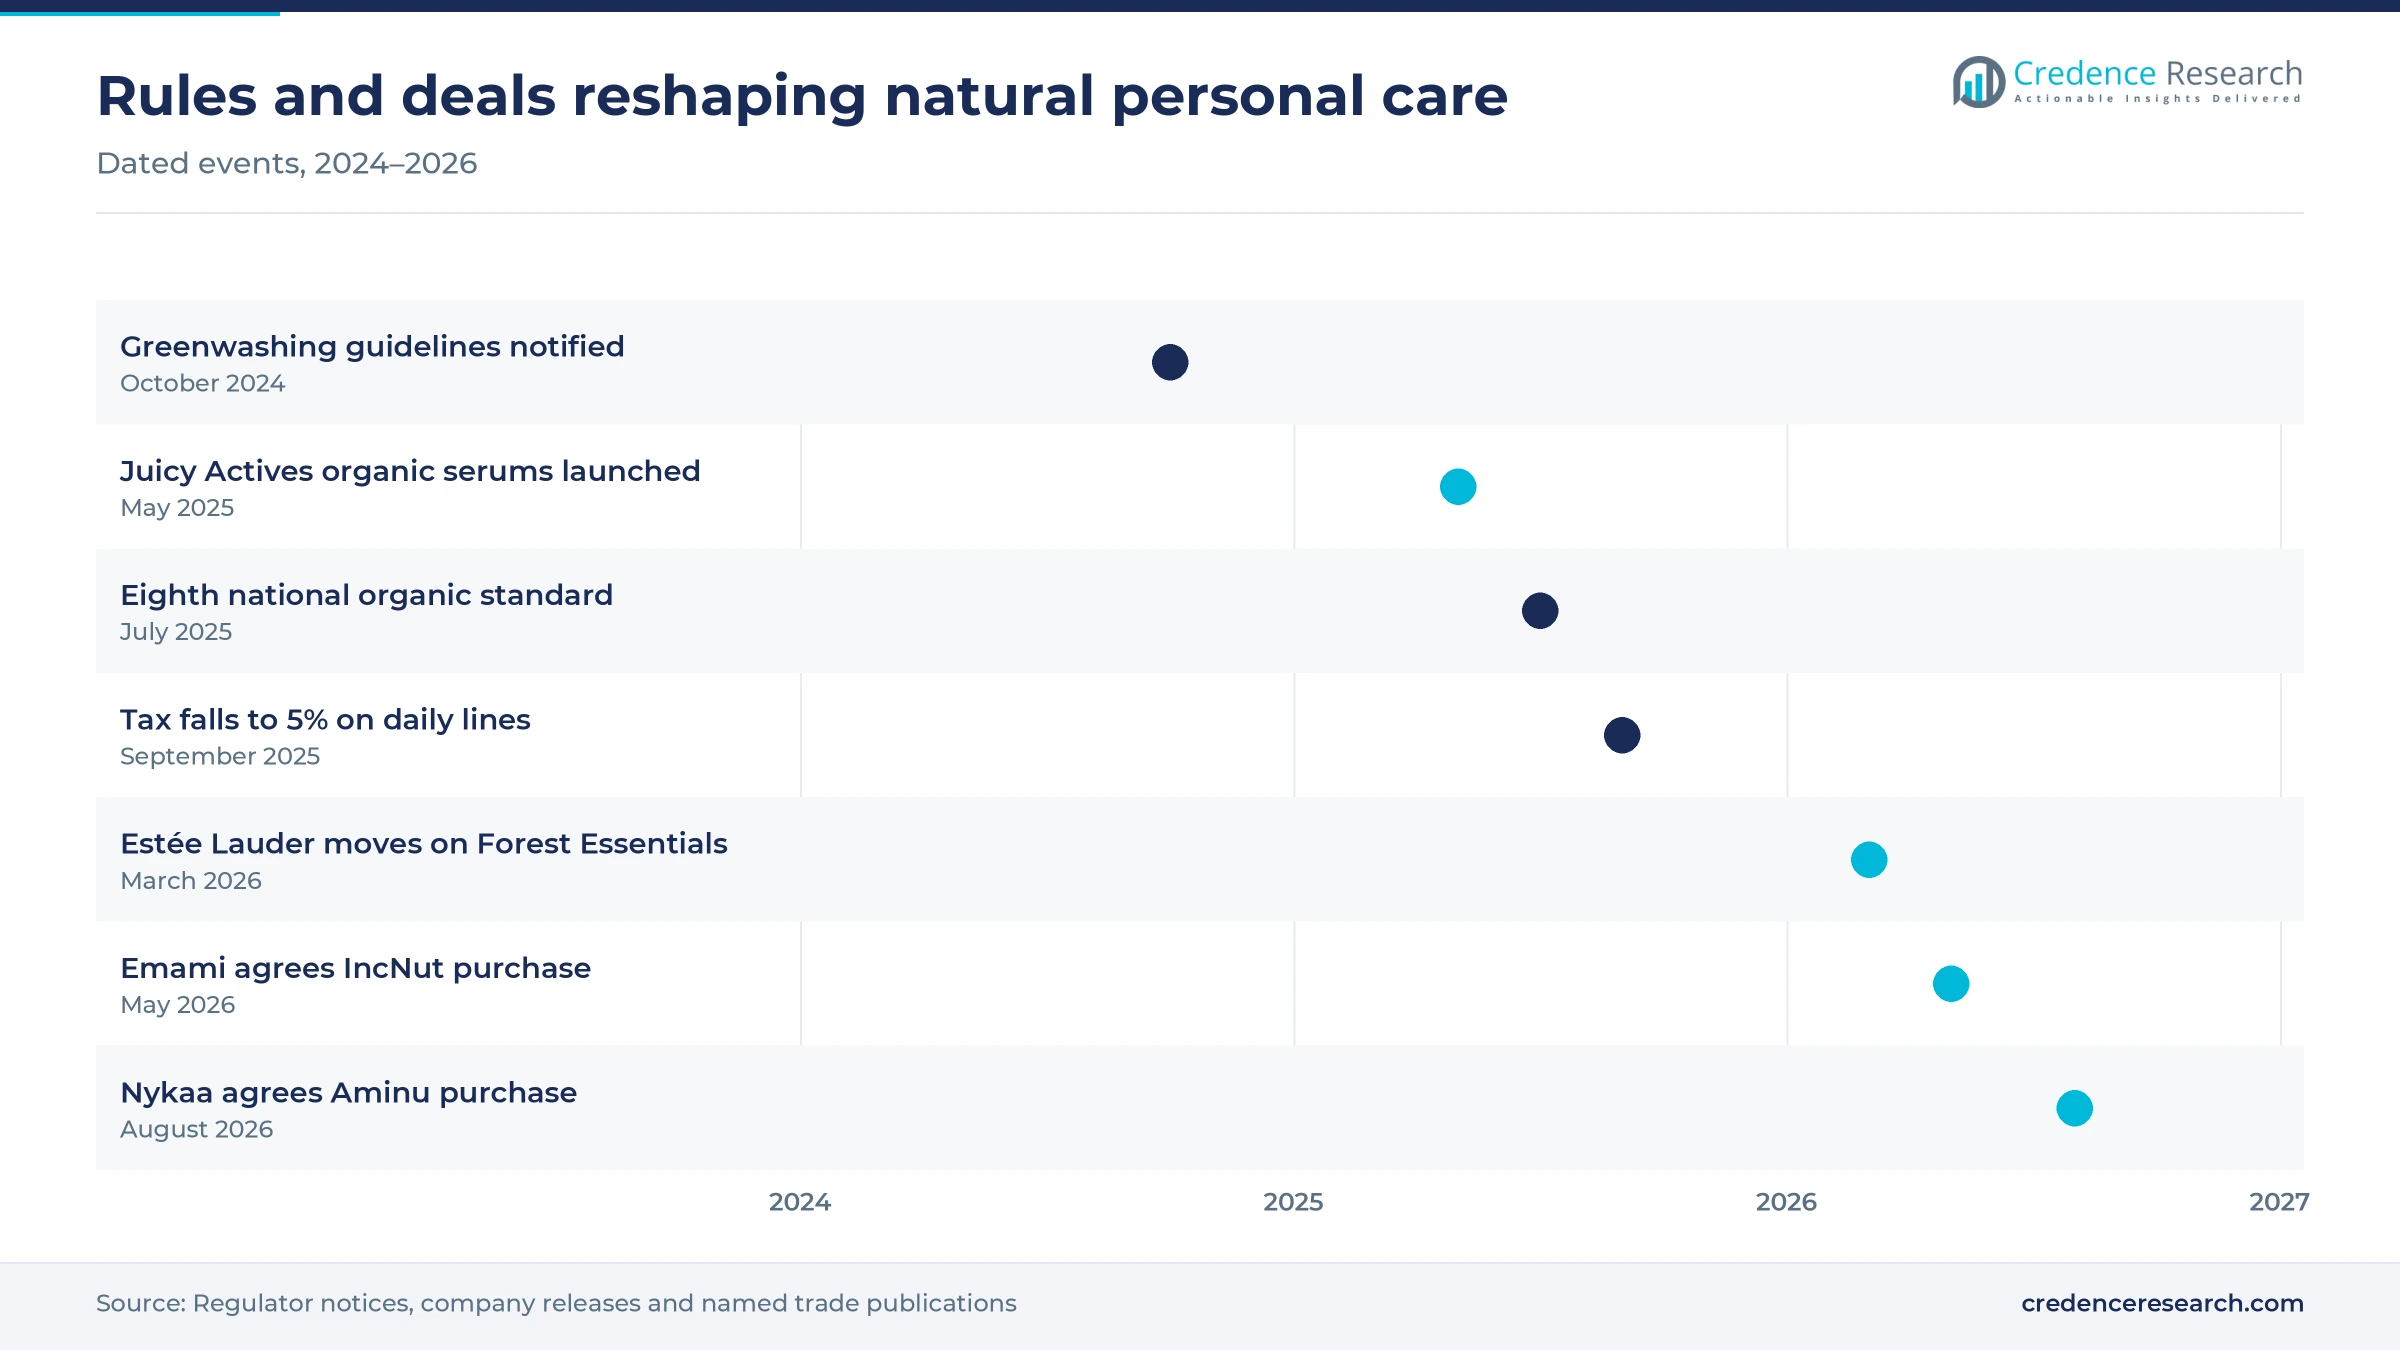
Deals and rule changes mark the last two years
| Development | Status and market relevance |
|---|---|
| In October 2024, India’s consumer authority notified guidelines on greenwashing and misleading environmental claims. | In force; generic green terms now need substantiation |
| In May 2025, Juicy Chemistry launched its Juicy Actives serums with Ecocert COSMOS Organic certification. | On sale; pairs organic proof with stated active percentages |
| In September 2025, the goods and services tax on hair oil, shampoo and toothpaste fell from 18% to 5%. | In force since Sept. 22; lowered shelf prices |
| In March 2026, Estée Lauder moved to acquire the remainder of Forest Essentials. | Subject to regulatory approvals when reported |
| In May 2026, Emami agreed to buy 60% of IncNut, owner of Vedix and SkinKraft. | Remaining stake planned in two phases over 4.5 years |
Proof of origin now carries the formulation story
- Certified formulation lets brands such as Juicy Chemistry pair Ecocert COSMOS Organic status with stated levels of vitamin C and alpha arbutin.
- Traceability systems such as APEDA’s Tracenet platform, which Agrospectrum says tracks 103 grower groups in Tamil Nadu, give buyers a record of certified origin.
- Personalized formulation at Vedix uses Ayurvedic principles with lifestyle data inputs to shape hair care regimens for individual customers, as Angel One describes.
- Clinical evaluation gives herbal products a language that parents can compare across brands, as Himalaya’s dermatologically evaluated baby powder shows.
Need a Custom Version of This Report?
Tailor the scope, geography, or segments to your exact requirements.
- Custom geography or segment scope
- Direct access to our analyst team
Heritage houses and digital groups contest the shelf
Competition splits into heritage Ayurvedic houses, digital-first groups, luxury Ayurveda specialists and certified organic founders. Dabur and Emami rely on reach and familiar names, and The Week reported that Emami passed the September 2025 tax cut into shelf prices. Honasa Consumer competes through ingredient-led launches and a fast-growing offline network that crossed about 300,000 outlets in 2026. Forest Essentials and Kama Ayurveda defend the top of the ladder through standalone stores and ritual-based ranges, with Estée Lauder and Puig now behind them. Juicy Chemistry and Organic Harvest lean on Ecocert credentials, while Lotus Herbals extended into certified Ayurveda by buying SoulTree in 2020. Himalaya Wellness Company holds a broad herbal range that spans babies and adults. IBEF also names Biotique among the organic and Ayurvedic brands gaining a loyal following.
Companies profiled and their roles in this market
| Company | Type | Role in the market |
|---|---|---|
| Himalaya Wellness Company | Heritage herbal house | Himalaya BabyCare launched Soothing Baby Powder with Yashad Bhasma in April 2026 |
| Dabur India Limited | Heritage Ayurvedic house | Direct reach of 1.52 million outlets at July 2025, with hair oils and toothpaste in personal care |
| Emami Limited | Ayurvedic consumer group | Took control of Axiom Ayurveda and agreed to buy 60% of IncNut during 2026 |
| Honasa Consumer Limited | Digital-first group | Owns Mamaearth and The Derma Co., with outlet coverage crossing about 300,000 in 2026 |
| Lotus Herbals Private Limited | Natural beauty house | Bought 100% of certified Ayurvedic brand SoulTree in September 2020 |
| Forest Essentials | Luxury Ayurveda brand | About 200 stores, with Estée Lauder moving to full ownership in March 2026 |
| Kama Ayurveda | Luxury Ayurveda brand | Majority owned by Puig since 2022, with an ayurvedic and natural store-led range |
| Organic Harvest | Certified organic brand | Described in 2022 as India’s largest Ecocert-certified brand; lenders moved in 2025 to sell Good Glamm brands individually, according to YourStory |
| Juicy Chemistry | Certified organic brand | Launched Ecocert COSMOS Organic Juicy Actives serums in May 2025 |
Verified claims will decide who keeps the premium
Credence Research’s view is that, in India organic personal care products, verification will matter more than heritage alone by the early 2030s. Greenwashing rules, sharper app comparison and global owners all reward brands able to show farm records, audit trails and stated active levels. Mass herbal lines will keep the largest volume, helped by the 2025 tax cut, but margin will sit with premium and certified ranges. The most exposed companies are mid-sized labels without certification or scale, which face both copra swings and rising audit costs. Consolidation is therefore likely to continue through the forecast period.
Filings and official statistics frame the model
The India organic personal care products report uses 2025 as the base year, with forecasts for 2026 through 2035. Market values come from the Credence Research model, and regional and segment splits are Credence Research estimates informed by public data on retail reach, household spending and certified farm area. Sources include government statistics, APEDA certification records, company filings and earnings calls, regulator notices and named trade publications. No interviews or surveys were conducted for this edition of the report.
Certified and premium lines set the course toward 2035
The India organic personal care products market should reach USD 3.76 billion by 2035, with growth of 11.65% a year built on steady switching rather than sudden mass conversion. Online retail and store expansion in Tier-2 cities will widen access, while certification will increasingly separate premium ranges from generic herbal labels. Larger owners should bring discipline to sourcing and distribution, and exports add a secondary source of demand. The main risks are a loss of trust after safety failures, farm-cost swings in copra and a certified supply base that grows more slowly than brand demand.
Frequently Asked Questions
How big is the India organic personal care products market?
Which product type leads the market?
Which region holds the largest share?
Which region is growing fastest?
How did the 2025 tax change affect the category?
Is organic certification mandatory for personal care brands in India?
Which companies compete in this market?
What are the main challenges facing brands?
Table of Content
Chapter 1 Market Segmentation
- 1.1 Segmentation Framework
- 1.1.1 Product and Service Classification
- 1.1.2 Application and End-Use Classification
- 1.1.3 Technology and Solution Classification
- 1.1.4 Customer and Distribution Channel Classification
- 1.1.5 Geographic Segmentation
- 1.1.6 Market Segment Definitions and Boundaries
- 1.2 By Product Type
- 1.2.1 Skin Care
- 1.2.2 Hair Care
- 1.2.3 Bath and Body Care
- 1.2.4 Oral and Grooming Care
- 1.3 By Certification Positioning
- 1.3.1 Ayurvedic Natural
- 1.3.2 Organic-Ingredient Based
- 1.3.3 Clean-Label Natural
- 1.3.4 Certified Organic
- 1.4 By Price Tier
- 1.4.1 Mass
- 1.4.2 Masstige
- 1.4.3 Premium
- 1.4.4 Luxury
Chapter 2 Introduction
- 2.1 Report Objectives and Scope
- 2.2 Product Definition and Industry Terminology
- 2.3 Market Inclusions and Exclusions
- 2.4 Research Process
- 2.4.1 Primary Research and Expert Interviews
- 2.4.2 Secondary Research and Source Review
- 2.4.3 Top-Down and Bottom-Up Estimation
- 2.4.4 Data Triangulation and Verification
- 2.5 Market Size Measurement Basis
- 2.5.1 2025: USD 1.23 billion → 2035: USD 3.76 billion
- 2.6 Historical and Forecast Reference Periods
- 2.6.1 Historical Period: 2018-2025
- 2.6.2 Base Year: 2025
- 2.6.3 Forecast Period: 2025-2035
- 2.7 Research Assumptions and Limitations
Chapter 3 Executive Summary
- 3.1 Market Snapshot and Key Findings
- 3.2 Base-Year Market Size, 2025
- 3.3 Forecast Market Size, 2035
- 3.4 Revenue and Volume Growth Outlook
- 3.5 Key Demand and Supply Indicators
- 3.6 Leading Market Segments
- 3.7 Fastest-Growing Market Opportunities
- 3.8 Regional Performance Highlights
- 3.9 Technology and Industry Transformation
- 3.10 Competitive Landscape Summary
- 3.11 Analyst View and Strategic Implications
Chapter 4 India Organic Personal Care Products Market Trends and Developments
- 4.1 Historical Industry Development, 2018-2025
- 4.2 Recent Market Trends and Developments
- 4.3 Demand and Customer Behavior Trends
- 4.4 Technology and Product Innovation
- 4.5 Artificial Intelligence, Automation and Digitalization
- 4.6 Local Manufacturing and Supply Chain Realignment
- 4.7 Industry Partnerships, Mergers and Acquisitions
- 4.8 Sustainability and Circular Economy Developments
- 4.9 Government and Private Sector Investment Trends
- 4.10 Emerging Business Models and Commercialization
- 4.11 Industry Developments and Announcements
Chapter 5 India Organic Personal Care Products Market Production, Supply and Demand Analysis
- 5.1 Demand Trend and Consumption Analysis, 2018-2025
- 5.2 Demand Forecast, 2025-2035
- 5.3 Production and Output Trend, 2018-2025
- 5.4 Production and Output Forecast, 2025-2035
- 5.5 Installed Capacity and Capacity Utilization
- 5.6 Company-Wise Production Plants and Statistics
- 5.6.1 Installed Production Capacity
- 5.6.2 Actual Production
- 5.6.3 Planned Capacity and Expansion Targets
- 5.7 Supply Chain Structure and Procurement Trends
- 5.8 Supply-Demand Gap and Bottlenecks
- 5.9 Import Dependence and Sourcing Structure
- 5.10 Contract Manufacturing and Outsourcing
- 5.11 Regional Supply and Demand Concentration
Chapter 6 India Organic Personal Care Products Market Pricing Analysis
- 6.1 Pricing Structure and Measurement
- 6.2 Historical Pricing Trends, 2018-2025
- 6.3 Pricing Outlook, 2025-2035
- 6.4 Average Selling Price and Unit Economics
- 6.5 Pricing by Product and Market Segment
- 6.6 Geographic Pricing Differences
- 6.7 Key Input, Energy, Labor and Logistics Costs
- 6.8 Contract Pricing and Purchasing Models
- 6.9 Pricing Sensitivity and Competitive Positioning
- 6.10 Price, Margin and Profitability Implications
Chapter 7 India Organic Personal Care Products Market Dynamics
- 7.1 Market Growth Drivers
- 7.1.1 Demand-Side Drivers
- 7.1.2 Technology and Innovation Drivers
- 7.1.3 Infrastructure and Investment Drivers
- 7.1.4 Regulatory and Policy Drivers
- 7.2 Market Restraints
- 7.2.1 Cost and Affordability Constraints
- 7.2.2 Technology and Adoption Barriers
- 7.2.3 Supply Chain and Operational Constraints
- 7.3 Market Challenges
- 7.3.1 Competitive Pressure and Margin Erosion
- 7.3.2 Skills, Infrastructure and Implementation Gaps
- 7.4 Emerging Market Opportunities
- 7.5 Market Dynamics Impact and Time-Horizon Assessment
Chapter 8 India Organic Personal Care Products Value Chain Analysis
- 8.1 Industry Value Chain Overview
- 8.2 Upstream Suppliers and Critical Inputs
- 8.3 Technology and Component Providers
- 8.4 Manufacturing or Service Delivery
- 8.5 Distribution, Channel Partners and Integrators
- 8.6 Downstream Applications and End Users
- 8.7 Value Addition and Profit Pools
- 8.8 Vertical Integration and Outsourcing
- 8.9 Supplier Concentration and Risk
- 8.10 Supply Chain Localization and Resilience
Chapter 9 India Organic Personal Care Products Market Regulations and Policies
- 9.1 Relevant Laws, Standards and Compliance Frameworks
- 9.2 Product, Service, Safety and Quality Requirements
- 9.3 Government Policies, Incentives and Subsidies
- 9.4 Imports, Exports and Trade Barriers
- 9.5 Public Procurement and Local Content Requirements
- 9.6 Environmental and Sustainability Compliance
- 9.7 Upcoming Policy Changes and Market Implications
Chapter 10 India Organic Personal Care Products Market Hotspots and Opportunities
- 10.1 Market Opportunity Mapping and Growth Hotspots
- 10.2 High-Growth Applications and Customer Groups
- 10.3 Underserved Markets and White-Space Opportunities
- 10.4 Emerging Technology and Product Opportunities
- 10.5 New Capacity and Investment Hotspots
- 10.6 Market Entry and Expansion Opportunities
- 10.7 Distribution and Partnership Opportunities
- 10.8 Near-Term and Long-Term Commercial Potential
- 10.9 Opportunity Attractiveness and Execution Risks
Chapter 11 India Organic Personal Care Products Market Outlook, 2025-2035
- 11.1 Market Size and Analysis
- 11.1.1 Revenue (Market Measurement: 2025: USD 1.23 billion → 2035: USD 3.76 billion)
- 11.1.2 Market Volume and Quantity Sold
- 11.1.3 Historical Market Size, 2018-2025
- 11.1.4 Base-Year Market Size, 2025
- 11.2 Market Forecast, 2025-2035
- 11.2.1 Revenue Forecast to 2035
- 11.2.2 Volume Forecast to 2035
- 11.2.3 CAGR and Year-on-Year Growth
- 11.2.4 Incremental Revenue Opportunity
- 11.3 Forecast Assumptions and Scenario Analysis
- 11.3.1 Base-Case Forecast
- 11.3.2 Optimistic and Conservative Scenarios
- 11.3.3 Technology, Pricing and Policy Sensitivities
- 11.4 Market Attractiveness and Growth Outlook
Chapter 12 India Organic Personal Care Products Market Segmentation and Outlook
- 12.1 Segmentation Summary and Market Shares, 2025
- 12.2 Largest and Fastest-Growing Segments
- 12.3 By Product Type - Market Size and Forecast, 2025-2035
- 12.3.1 Segment Definition and Scope
- 12.3.2 Historical Market Size, 2018-2025
- 12.3.3 Revenue Forecast, 2025-2035
- 12.3.4 Volume Forecast, 2025-2035
- 12.3.5 Base-Year Market Share, 2025
- 12.3.6 Segment CAGR and Growth Drivers
- 12.3.7 Subsegment Market Size and Forecast
- 12.3.7.1 Skin Care
- 12.3.7.2 Hair Care
- 12.3.7.3 Bath and Body Care
- 12.3.7.4 Oral and Grooming Care
- 12.3.8 Subsegment Pricing and Adoption Trends
- 12.3.9 Leading Suppliers and Competition
- 12.3.10 Regional Demand and Opportunities
- 12.4 By Certification Positioning - Market Size and Forecast, 2025-2035
- 12.4.1 Segment Definition and Scope
- 12.4.2 Historical Market Size, 2018-2025
- 12.4.3 Revenue Forecast, 2025-2035
- 12.4.4 Volume Forecast, 2025-2035
- 12.4.5 Base-Year Market Share, 2025
- 12.4.6 Segment CAGR and Growth Drivers
- 12.4.7 Subsegment Market Size and Forecast
- 12.4.7.1 Ayurvedic Natural
- 12.4.7.2 Organic-Ingredient Based
- 12.4.7.3 Clean-Label Natural
- 12.4.7.4 Certified Organic
- 12.4.8 Subsegment Pricing and Adoption Trends
- 12.4.9 Leading Suppliers and Competition
- 12.4.10 Regional Demand and Opportunities
- 12.5 By Price Tier - Market Size and Forecast, 2025-2035
- 12.5.1 Segment Definition and Scope
- 12.5.2 Historical Market Size, 2018-2025
- 12.5.3 Revenue Forecast, 2025-2035
- 12.5.4 Volume Forecast, 2025-2035
- 12.5.5 Base-Year Market Share, 2025
- 12.5.6 Segment CAGR and Growth Drivers
- 12.5.7 Subsegment Market Size and Forecast
- 12.5.7.1 Mass
- 12.5.7.2 Masstige
- 12.5.7.3 Premium
- 12.5.7.4 Luxury
- 12.5.8 Subsegment Pricing and Adoption Trends
- 12.5.9 Leading Suppliers and Competition
- 12.5.10 Regional Demand and Opportunities
- 12.6 Segment Growth Comparison
- 12.7 Segment Attractiveness and Priority Matrix
Chapter 13 India Organic Personal Care Products Geographic Market Outlook, 2025-2035
- 13.1 Domestic Market Distribution and Demand Clusters
- 13.2 State- or Province-Wise Market Size and Forecast, 2025-2035
- 13.3 City and Metropolitan Market Outlook
- 13.4 Industrial, Manufacturing and Commercial Clusters
- 13.5 Geographic Concentration of Key End Users
- 13.6 Local Pricing and Purchasing Differences
- 13.7 Domestic Production Facilities and Capacity Map
- 13.8 Local Infrastructure and Project Pipeline
- 13.9 State-Level Policy and Incentive Differences
- 13.10 Subnational Investment Hotspots and Opportunities
- 13.11 Distribution and Logistics Networks
- 13.12 Domestic Competitive Footprint
Chapter 14 India Organic Personal Care Products Technology, Innovation and Sustainability Outlook
- 14.1 Technology Landscape and Maturity
- 14.2 Product, Process and Service Innovation
- 14.3 AI, Automation and Digital Tools in the Industry
- 14.4 Technology Adoption and Performance Benchmarking
- 14.5 Innovation Pipeline and R&D Investment
- 14.6 Patent and Intellectual Property Trends
- 14.7 Energy Efficiency and Resource Management
- 14.8 Sustainability, Recycling and Circularity
- 14.9 Technology Roadmap, 2025-2035
- 14.10 Risks of Obsolescence and Technology Substitution
Chapter 15 India Organic Personal Care Products Market Key Strategic Imperatives
- 15.1 Growth and Market Entry Priorities
- 15.2 High-Return Products and Segments
- 15.3 Pricing, Profitability and Cost Optimization
- 15.4 Technology Investment and Product Differentiation
- 15.5 Supply Chain Localization and Resilience
- 15.6 Distribution and Customer Acquisition
- 15.7 Partnership, Acquisition and Capacity Strategy
- 15.8 Regional Expansion Priorities
- 15.9 Short-, Medium- and Long-Term Actions
Chapter 16 Competition Outlook
- 16.1 Industry Competition Characteristics
- 16.2 Market Structure and Concentration
- 16.3 Market Share and Competitive Positioning, 2025
- 16.4 Company-Wise Revenue and Product Benchmarking
- 16.5 Production and Service Capacity Benchmarking
- 16.6 Technology, Pricing and Differentiation
- 16.7 Regional Footprint and Distribution Strength
- 16.8 Mergers, Acquisitions and Strategic Alliances
- 16.9 New Entrants and Competitive Threats
- 16.10 Porter's Five Forces and Industry Attractiveness
- 16.11 Competitive Outlook, 2025-2035
Chapter 17 Company Profiles
- 17.1 Company Coverage and Selection Criteria
- 17.2 Himalaya Wellness Company
- 17.2.1 Business Description
- 17.2.2 Company Ownership and Geographic Presence
- 17.2.3 Product and Service Portfolio
- 17.2.4 Manufacturing and Operating Footprint
- 17.2.5 Production Capacity and Expansion Plans
- 17.2.6 Financial Performance and Investment
- 17.2.7 Market Share and Competitive Position
- 17.2.8 Technology and Innovation Capabilities
- 17.2.9 Strategic Alliances or Partnerships
- 17.2.10 Recent Developments
- 17.2.11 Growth Strategy and Outlook
- 17.3 Dabur India Limited
- 17.4 Emami Limited
- 17.5 Honasa Consumer Limited
- 17.6 Lotus Herbals Private Limited
- 17.7 Forest Essentials
- 17.8 Kama Ayurveda
- 17.9 Biotique
- 17.10 Organic Harvest
- 17.11 Juicy Chemistry
- 17.12 Other Relevant Market Participants
Note: Every listed company is profiled on the structure shown under the first company. The company list is preliminary and may change based on research findings, market developments, data availability and client requirements.
Chapter 18 Disclaimer
- 18.1 Research and Forecast Disclaimer
- 18.2 Data Source and Estimation Limitations
Note: The depth of individual sections depends on data availability for this market. Volume, capacity, trade and other unit-based metrics are included where applicable.