Vietnam branded baskets keep moving beyond street shops
The Vietnam consumer packaged goods (CPG) market was valued at USD 47.00 billion in 2025 and is projected to increase from USD 50.75 billion in 2026 to USD 101.28 billion by 2035, registering a CAGR of 7.98% during 2026–2035. Demand rests on rising household income, a fast-growing online channel and the spread of chain mini-marts into rural districts. Red River Delta held the largest regional share, 38.0% in 2025, helped by Hanoi, which recorded the country's highest per capita income in the 2025 household survey. Central Coast and Highlands is the fastest-growing region at 8.57% a year, as grocery chains direct new stores toward central provinces. A sugar-sweetened drinks excise starts Jan. 1, 2027, under the Special Consumption Tax Law passed June 14, 2025, so many carbonated and tea drinks face higher shelf costs. Household businesses also lost the flat tax method on Jan. 1, 2026, which narrows the cost gap between street shops and formal chains.
What counts as consumer packaged goods in Vietnam, and how do households buy them?
The market covers branded, factory-packed food, nutrition, non-alcoholic drinks, personal care, beauty, household cleaning and consumer health products sold to households for home use. Most purchases remain small and frequent, because neighborhood grocers and wet-market stalls sit close to homes and sell single packs. Larger stock-up trips take place at supermarkets, mini-marts and increasingly on online platforms.
The estimate excludes beer, wine, spirits, tobacco, fresh unbranded produce, restaurant meals and prescription medicines. The value chain runs from local and multinational manufacturers through regional distributors to retail outlets, while chains and platforms increasingly buy directly from brand owners and shorten that route.
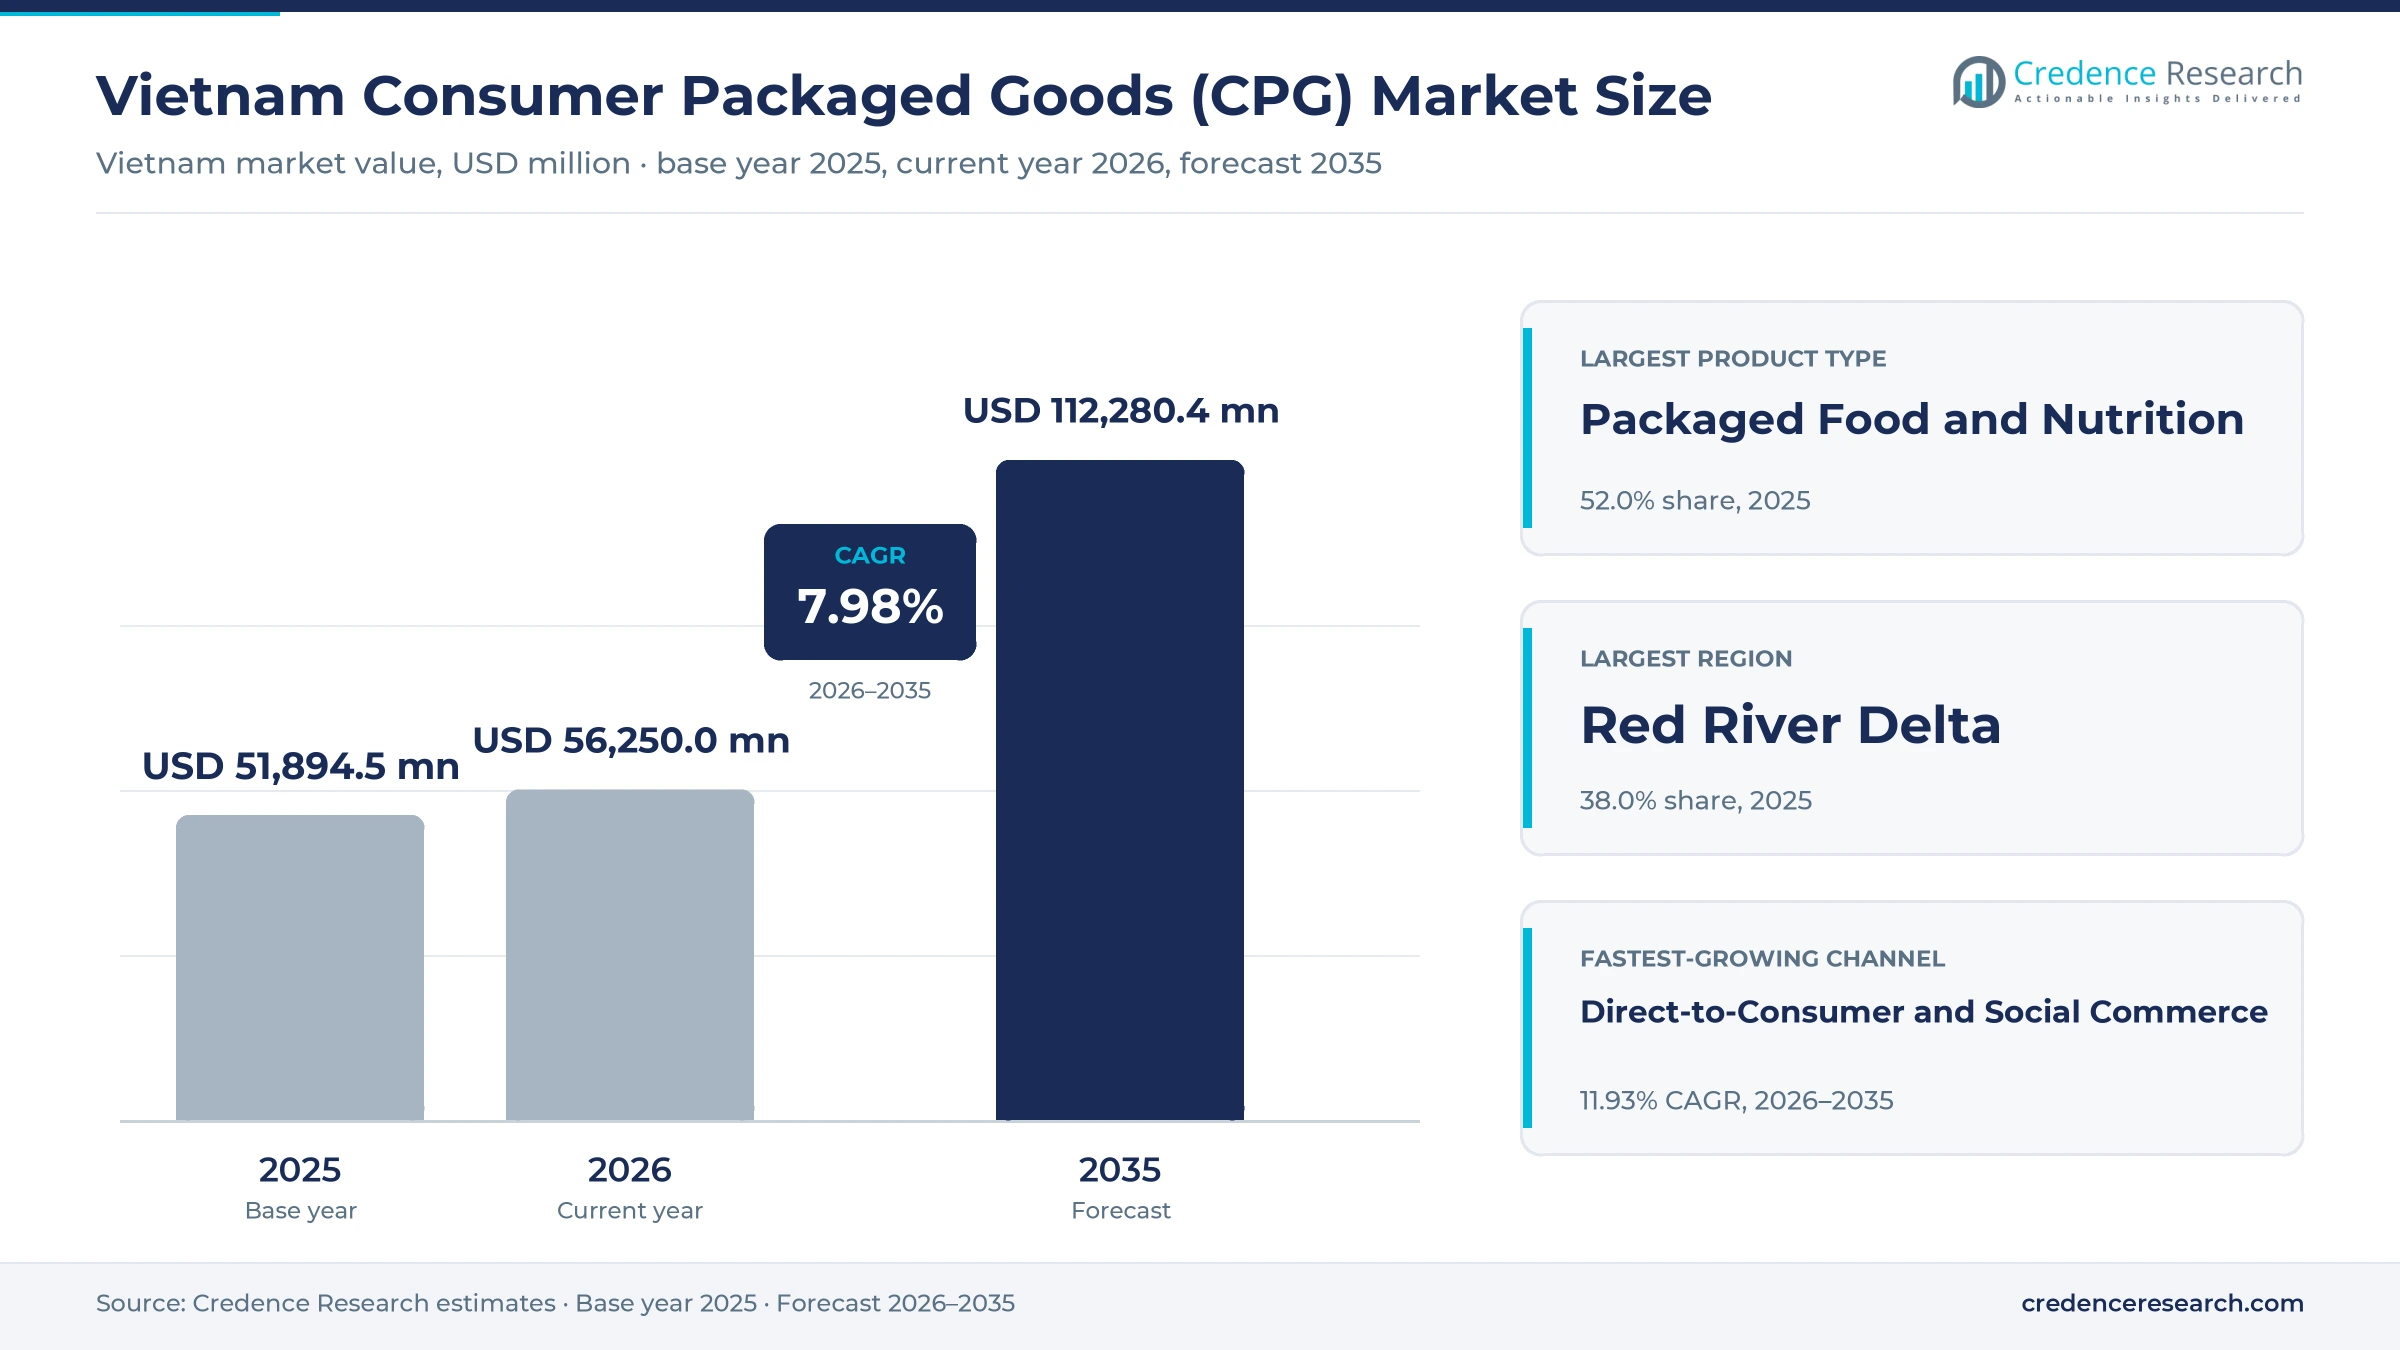
Vietnam Consumer Packaged Goods (CPG) Market Insights
- The market moves from USD 47.00 billion in 2025 to USD 101.28 billion by 2035 at a 7.98% CAGR, with income growth and retail formalization carrying most of the gain.
- Red River Delta led with 38.0% of 2025 value, ahead of Southeast Vietnam, because Hanoi and Haiphong combine high household income with dense store networks.
- Packaged Food and Nutrition held 50.0% of 2025 value, supported by staples such as instant noodles, where Vietnam consumed about 8.231 billion servings in 2025.
- Formal retail gained ground after household businesses lost the flat tax method on Jan. 1, 2026, while Decree 70 e-invoice rules began June 1, 2025.
- Manufacturers keep adding capacity, including a US$300 million Suntory PepsiCo plant in Tay Ninh and a US$228.2 million TH Group dairy plant begun in March 2026.
Food leads while beauty and social selling grow fastest
Why does packaged food dominate while beauty grows fastest?
Based on product type, the market is categorized into Packaged Food and Nutrition, Non-Alcoholic Beverages, Personal and Beauty Care, and Household and Consumer Health. Packaged Food and Nutrition led with 50.0% of 2025 value because staples are bought almost daily, and the World Instant Noodles Association counted about 8.231 billion servings in Vietnam in 2025, the highest per capita rate worldwide. Personal and Beauty Care grows fastest at 9.18% a year as online beauty sales, including natural skincare lines, rose nearly 30% to VND74.4 trillion in 2025, according to The Investor in March 2026.
How far has trading up moved beyond the mainstream shelf?
Based on price tier, the market is categorized into Economy, Mainstream, Premium and Super-Premium. Mainstream led with 43.0% of 2025 value because buyers stay cautious, and Vietnam Investment Review reported in February 2026 that 51% of in-home categories traded down during 2025. The VND100,000 to VND200,000 band was also the largest online band in 2025, at 25.3% of sales, according to The Investor. Super-Premium grows fastest at 9.77% a year as official beauty stores sold at an average VND235,000 per unit in late 2025, about 1.5 times other sellers.
Why do street shops still outsell every newer channel?
Based on distribution channel, the market is categorized into Traditional Trade, Modern Grocery, E-Commerce Marketplaces and Direct-to-Consumer and Social Commerce. Traditional Trade led with 61.0% of 2025 value because Saigon-Hanoi Securities put modern retail at only 19% of total sales in December 2025, and Masan Consumer alone reaches nearly 500,000 such outlets. Direct-to-Consumer and Social Commerce grows fastest at 11.93% a year as live selling pushed TikTok Shop to 41.31% of platform sales in 2025, up from 29% a year earlier, according to The Investor in January 2026.
Which pack sizes fit small baskets and new recycling duties?
Based on packaging format, the market is categorized into Single-Serve Flexible Packaging, Family and Multi-Pack Formats, Rigid Containers and Refill and Sustainable Formats. Single-Serve Flexible Packaging led with 41.0% of 2025 value because noodle packets, sachets and pouches fit daily shopping, with instant noodle use near 80 servings per person in 2025, according to Voice of Vietnam. Refill and Sustainable Formats grows fastest at 10.81% a year as Decree 05/2025 lets manufacturers that collect and reuse their own packaging at the mandatory rate avoid the obligation, according to Tilleke & Gibbins, while Mondelez Kinh Do reports recyclable packaging across its range and cosmetics packaging suppliers follow.
| Segment Group | Leading Sub-segment | Share, 2025 | Fastest-growing Sub-segment | CAGR, 2026–2035 |
|---|---|---|---|---|
| By Product Type | Packaged Food and Nutrition | 50.0% | Personal and Beauty Care | 9.18% |
| By Price Tier | Mainstream | 43.0% | Super-Premium | 9.77% |
| By Distribution Channel | Traditional Trade | 61.0% | Direct-to-Consumer and Social Commerce | 11.93% |
| By Packaging Format | Single-Serve Flexible Packaging | 41.0% | Refill and Sustainable Formats | 10.81% |
Request a Free Sample
Fill in your details and we'll send you a free sample report.
- Sample data tables & charts
- Research methodology
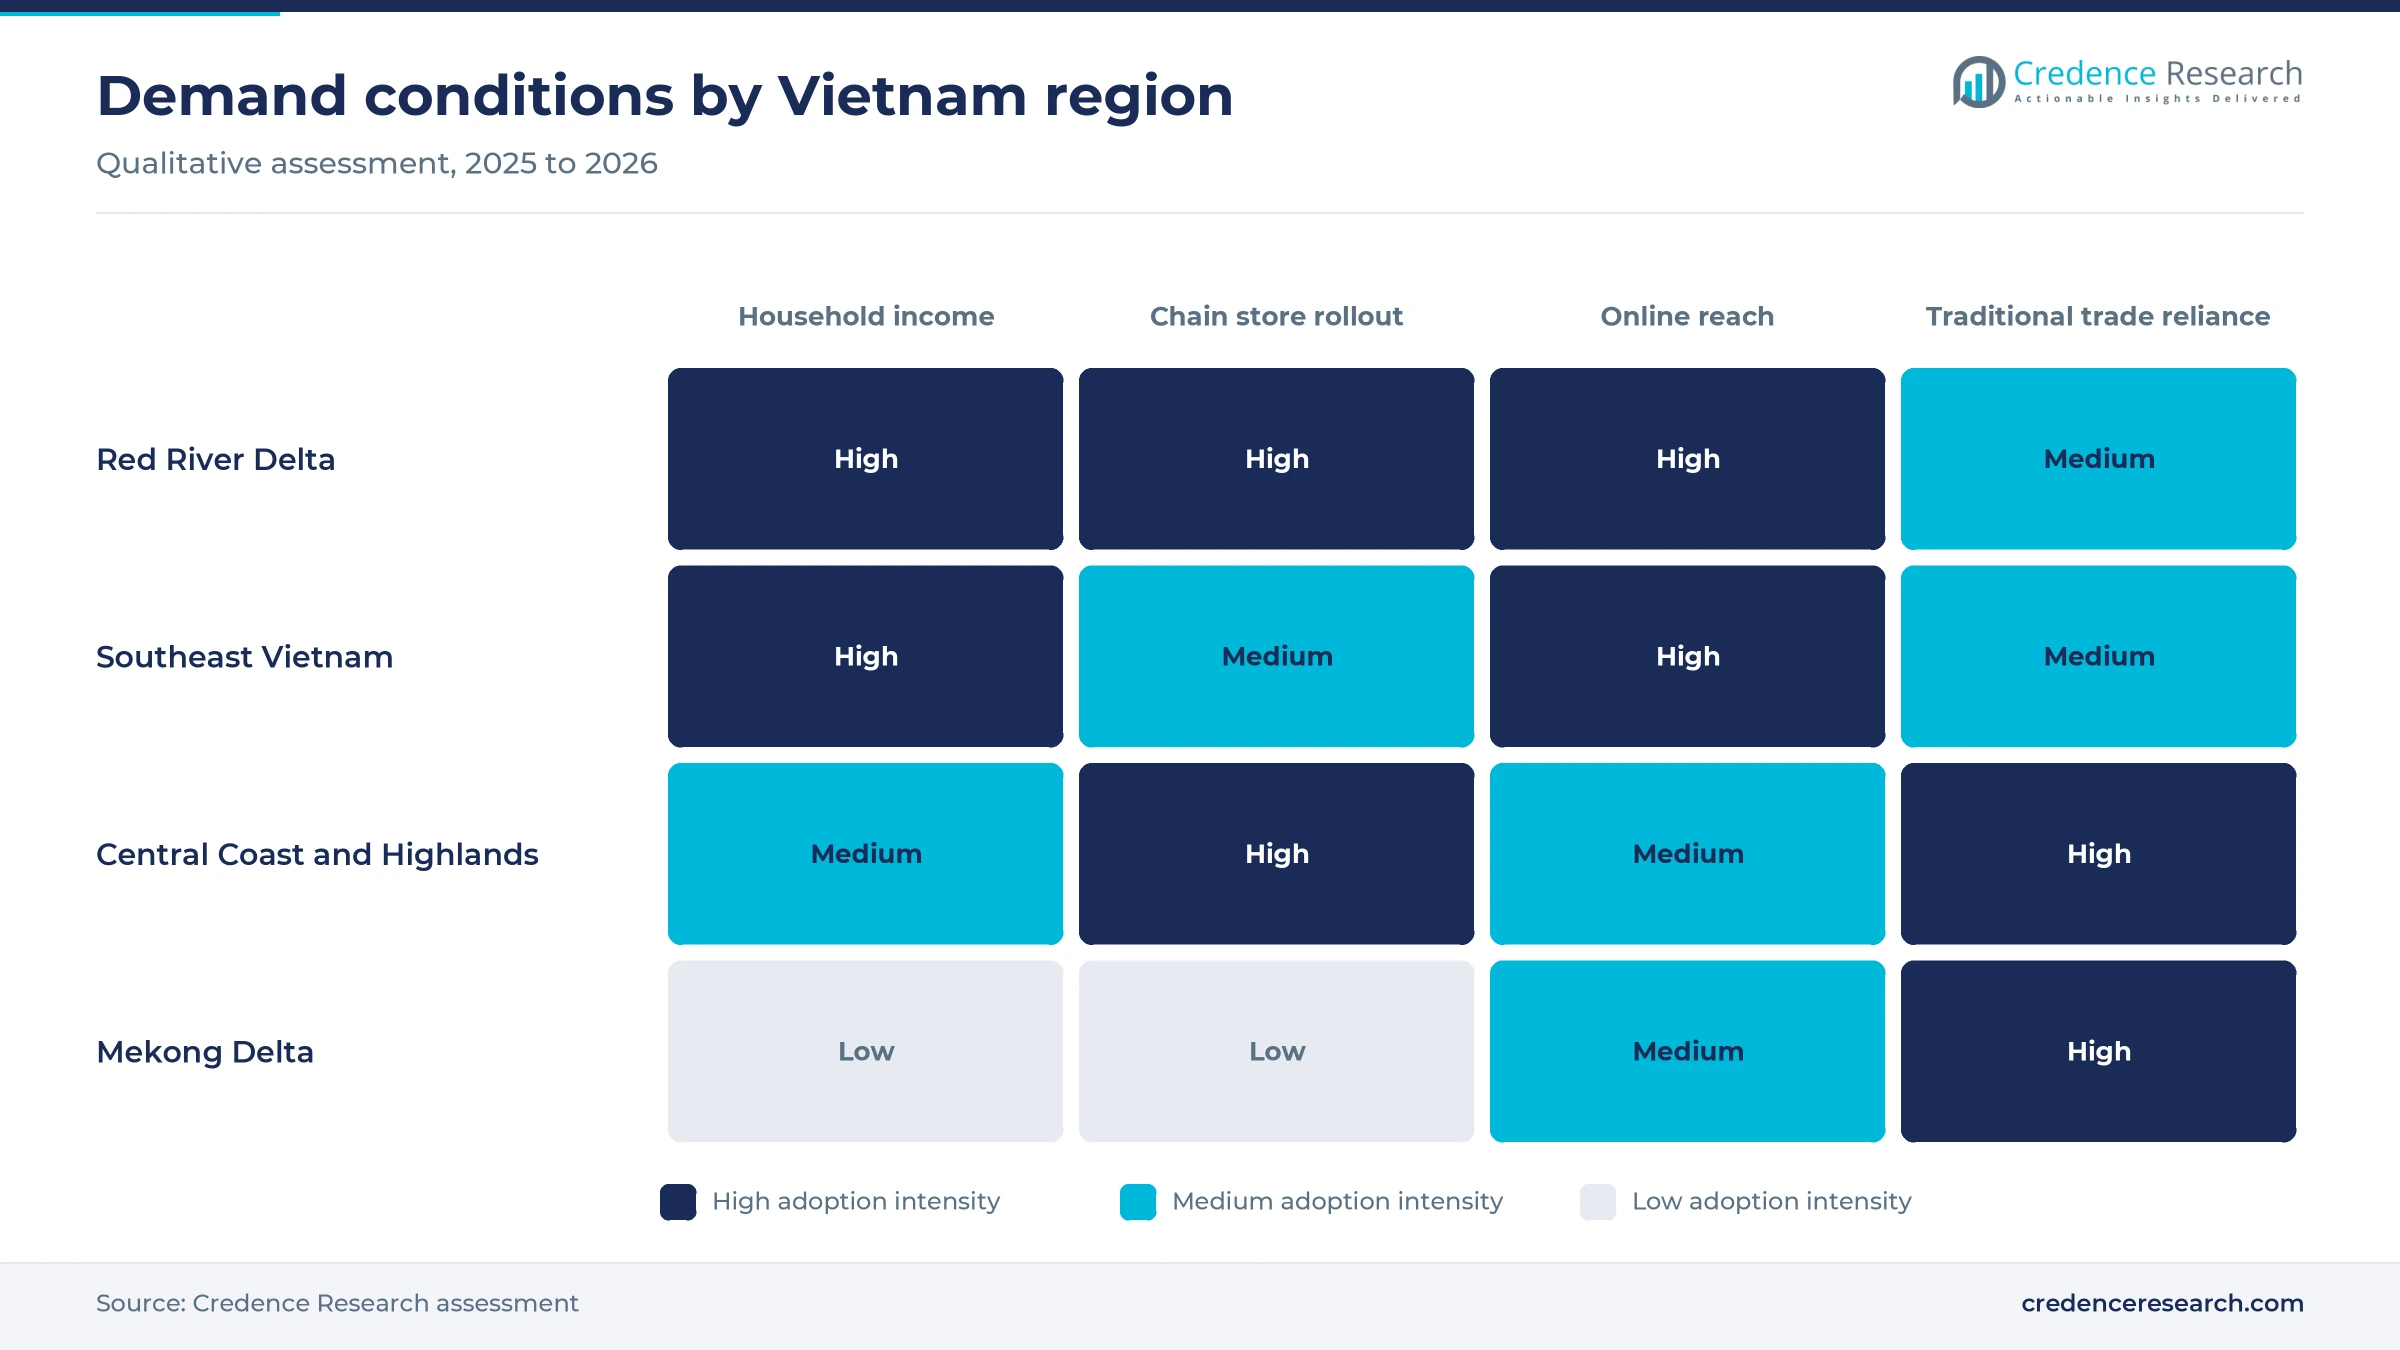
Income, online scale and store rollout lift branded demand
Household income and consumption expansion lift basket value
Higher household income remains the main reason branded goods keep taking basket share. Per capita income reached about VND5.9 million a month in 2025, up 9.3%, according to preliminary National Statistics Office results reported by VietNamNet in January 2026. The wider economy supports that gain, because the World Bank reports GDP per capita of $5,066 in 2025 after growth of 8 percent. In turn, food and foodstuffs sales rose 10% to about VND1,878 trillion in 2025, according to Ministry of Industry and Trade data. Saigon-Hanoi Securities also expects households earning above $22,000 outside the 15 largest cities to rise from 3.6 million to 8.4 million between 2020 and 2030. This wider income base sustains Packaged Food and Nutrition at 50.0% of value.
E-commerce and omnichannel scaling widen brand reach
Online platforms now give brands a national shelf without a local distributor in every province. Vietnam Investment Review reported that Shopee and TikTok Shop reached about 8% of the retail market in 2025, up from 6.5% in 2024. Four-platform sales climbed 34.75% to VND429.7 trillion in 2025, according to The Investor, with beauty as the largest category. Policy also favors further scaling, because the national retail strategy targets e-commerce at 15% to 20% of retail sales by 2030, according to Viet Nam News in October 2025. As a result, Direct-to-Consumer and Social Commerce grows at 11.93% a year, and brands increasingly plan online assortments, pack sizes and promotions separately from those sold through street shops.
Modern retail and convenience formalization shift the shelf
Formal store rollout is moving packaged goods toward chains that track prices and buy directly. WinCommerce ended 2025 with about 4,600 outlets after adding about 800, roughly 70% of them rural, according to The Investor in January 2026. Bach Hoa Xanh reached about 2,000 stores after nearly 400 openings in the same year. Tax rules reinforce the shift, because Decree 70 required e-invoices from larger household businesses on June 1, 2025, and the flat tax method ended Jan. 1, 2026, according to ACB Securities. The Ministry of Industry and Trade is also preparing a proposal to convert roughly 7,000 traditional markets, Tuoi Tre News reported in December 2025. Consequently, Traditional Trade loses share slowly, while chains gain bargaining power over assortment and listing terms.
Local plant investment shortens supply and supports new lines
Manufacturers are adding domestic capacity, which lowers import dependence and supports new product lines for Vietnamese buyers. Suntory PepsiCo opened a US$300 million plant at Huu Thanh Industrial Park in Tay Ninh with about 1.244 billion liters of annual capacity, Food Business MEA reported in July 2026. TH Group broke ground March 9, 2026, on a plant worth more than VND6 trillion at Song Than 3 Industrial Park, with operations due in the first quarter of 2027, according to Vietstock. Nestlé Vietnam announced nearly US$75 million more for its Tri An coffee factory on April 18, 2025, taking 2024 and 2025 spending there above US$175 million. This capacity gives Packaged Food and Nutrition and beverage brands a stronger domestic base for growth to 2035.
Official stores and rural mini-marts reshape the route
Shift toward official brand stores on concentrated platforms
Online selling is concentrating among authorized sellers, which gives brand owners more control over price and authenticity. Official brand stores took 64.4% of online beauty revenue in the fourth quarter of 2025, up 36% from a year earlier, according to The Investor in March 2026. Active online sellers fell 7.43% to about 601,800 in 2025 even as sales rose, and the publication described this as growing concentration among vendors. Average beauty unit prices also rose about 13%, which shows buyers paying more through trusted stores. This shift matters beyond cosmetics, because the 2025 fake milk cases involved 573 counterfeit brands in one network, according to VietNamNet. In turn, Super-Premium products benefit, growing at 9.77% a year through verified storefronts.
Rise of a split basket across smaller households
Shoppers are spending more selectively, so growth now depends on choosing which categories deserve a higher price. Vietnam Investment Review reported in February 2026 that 49% of in-home categories traded up and 51% traded down during 2025, while in-home volume contracted in several core sectors. Seasonal demand remains concentrated, because Tet accounts for around 20% of annual FMCG revenue, according to a December 2025 conference report published by Vietstock. Vinamilk also planned a selling price rise of about 2% to 3% in May 2026, according to Index.vn. As a result, Mainstream remains the volume anchor at 43.0% of value.
Opportunity in central provinces and rural mini-mart shelves
Central and rural districts offer the clearest distribution opening, because formal shelves are arriving there later than in the two largest cities. Modern channels held 35% to 40% of urban sales but under a fifth of rural sales, according to ACB Securities in February 2026. Bach Hoa Xanh placed around 70% of its 2025 openings in central Vietnam and the Central Highlands, and WinCommerce reached 1,185 central stores by April 2026, according to Vietstock. Convenience and mini-supermarket outlets outside the largest cities are forecast at 4,933 in 2026, The Investor reported in May. Brands that design smaller packs and regional flavors for these stores can gain early listings as Central Coast and Highlands outpaces the other three zones.
Opportunity in domestic recycled packaging and refill lines
Recycled packaging is an open commercial gap, because producers carry recycling duties while much local capability remains unfinished. Bottle-to-bottle plastic recycling is largely done overseas in Thailand and Singapore, according to Viet Nam News in September 2025, and some recycling industrial parks were expected only in 2026. Decree 05/2025 lets manufacturers that collect and reuse their own packaging at the mandatory rate avoid the obligation, according to Tilleke & Gibbins. That exemption creates a direct financial case for refill and return systems. Mondelez Kinh Do has also reported reaching recyclable packaging for its range, which raises the standard for rivals. Suppliers and brands that build local recycled content early can serve Refill and Sustainable Formats, which grows at 10.81% a year.
Sugar tax, food rules and online costs squeeze margins
Sugary drinks excise raises beverage shelf prices from 2027
The sugar excise will test price-sensitive drink buyers within months. The National Assembly passed the law June 14, 2025, and drinks above 5 grams of sugar per 100 milliliters face 8% from Jan. 1, 2027, and 10% in 2028, while dairy and pure juice are excluded. Carbonated and tea brands face the greatest pricing pressure, so volumes could soften if the tax passes through fully. Producers can limit that risk by reformulating recipes before the first rate applies.
Recycling duties arrive before local capacity is ready
Packaging compliance is a real cost pressure for packaged goods makers because local recycling routes remain thin for many formats. More than 80% of businesses in a 2023 Vietnam Beverage Association survey reported difficulty implementing producer responsibility, according to Viet Nam News in September 2025. Decree 05/2025 also requires a single payment by April 20 each year, which removes the earlier two-installment option. Smaller producers feel this cost most, and about 80% of small and medium-sized firms opted to contribute to the recycling fund in 2024-25, so shared schemes remain the practical mitigation.
Food rule changes and counterfeit cases disrupt supply
Food safety enforcement has become a supply risk, both tighter and less predictable for importers and manufacturers. Decree 46 took effect Jan. 26, 2026, and more than 1,800 containers remained stranded at Cat Lai Port by Feb. 4 before authorities paused it, Viet Nam News reported. Imported snacks, dairy and health supplement brands face the highest exposure to such delays. Companies are therefore keeping complete declaration files and larger safety stock, because rules may change again at short notice.
Platform fees and acquisition costs erode online margins
Online growth now carries margin pressure for smaller brands, even though sales continue to expand on the largest platforms. Shopee fees run between 15% and 18% per successful order, and customer acquisition costs are rising 25% to 30% a year, according to The Investor in March 2026. These costs weaken brands that depend on discounts, and they help explain the fall in active sellers. Stronger companies are responding by moving shoppers toward official stores, bundles and repeat purchases that require less paid promotion.
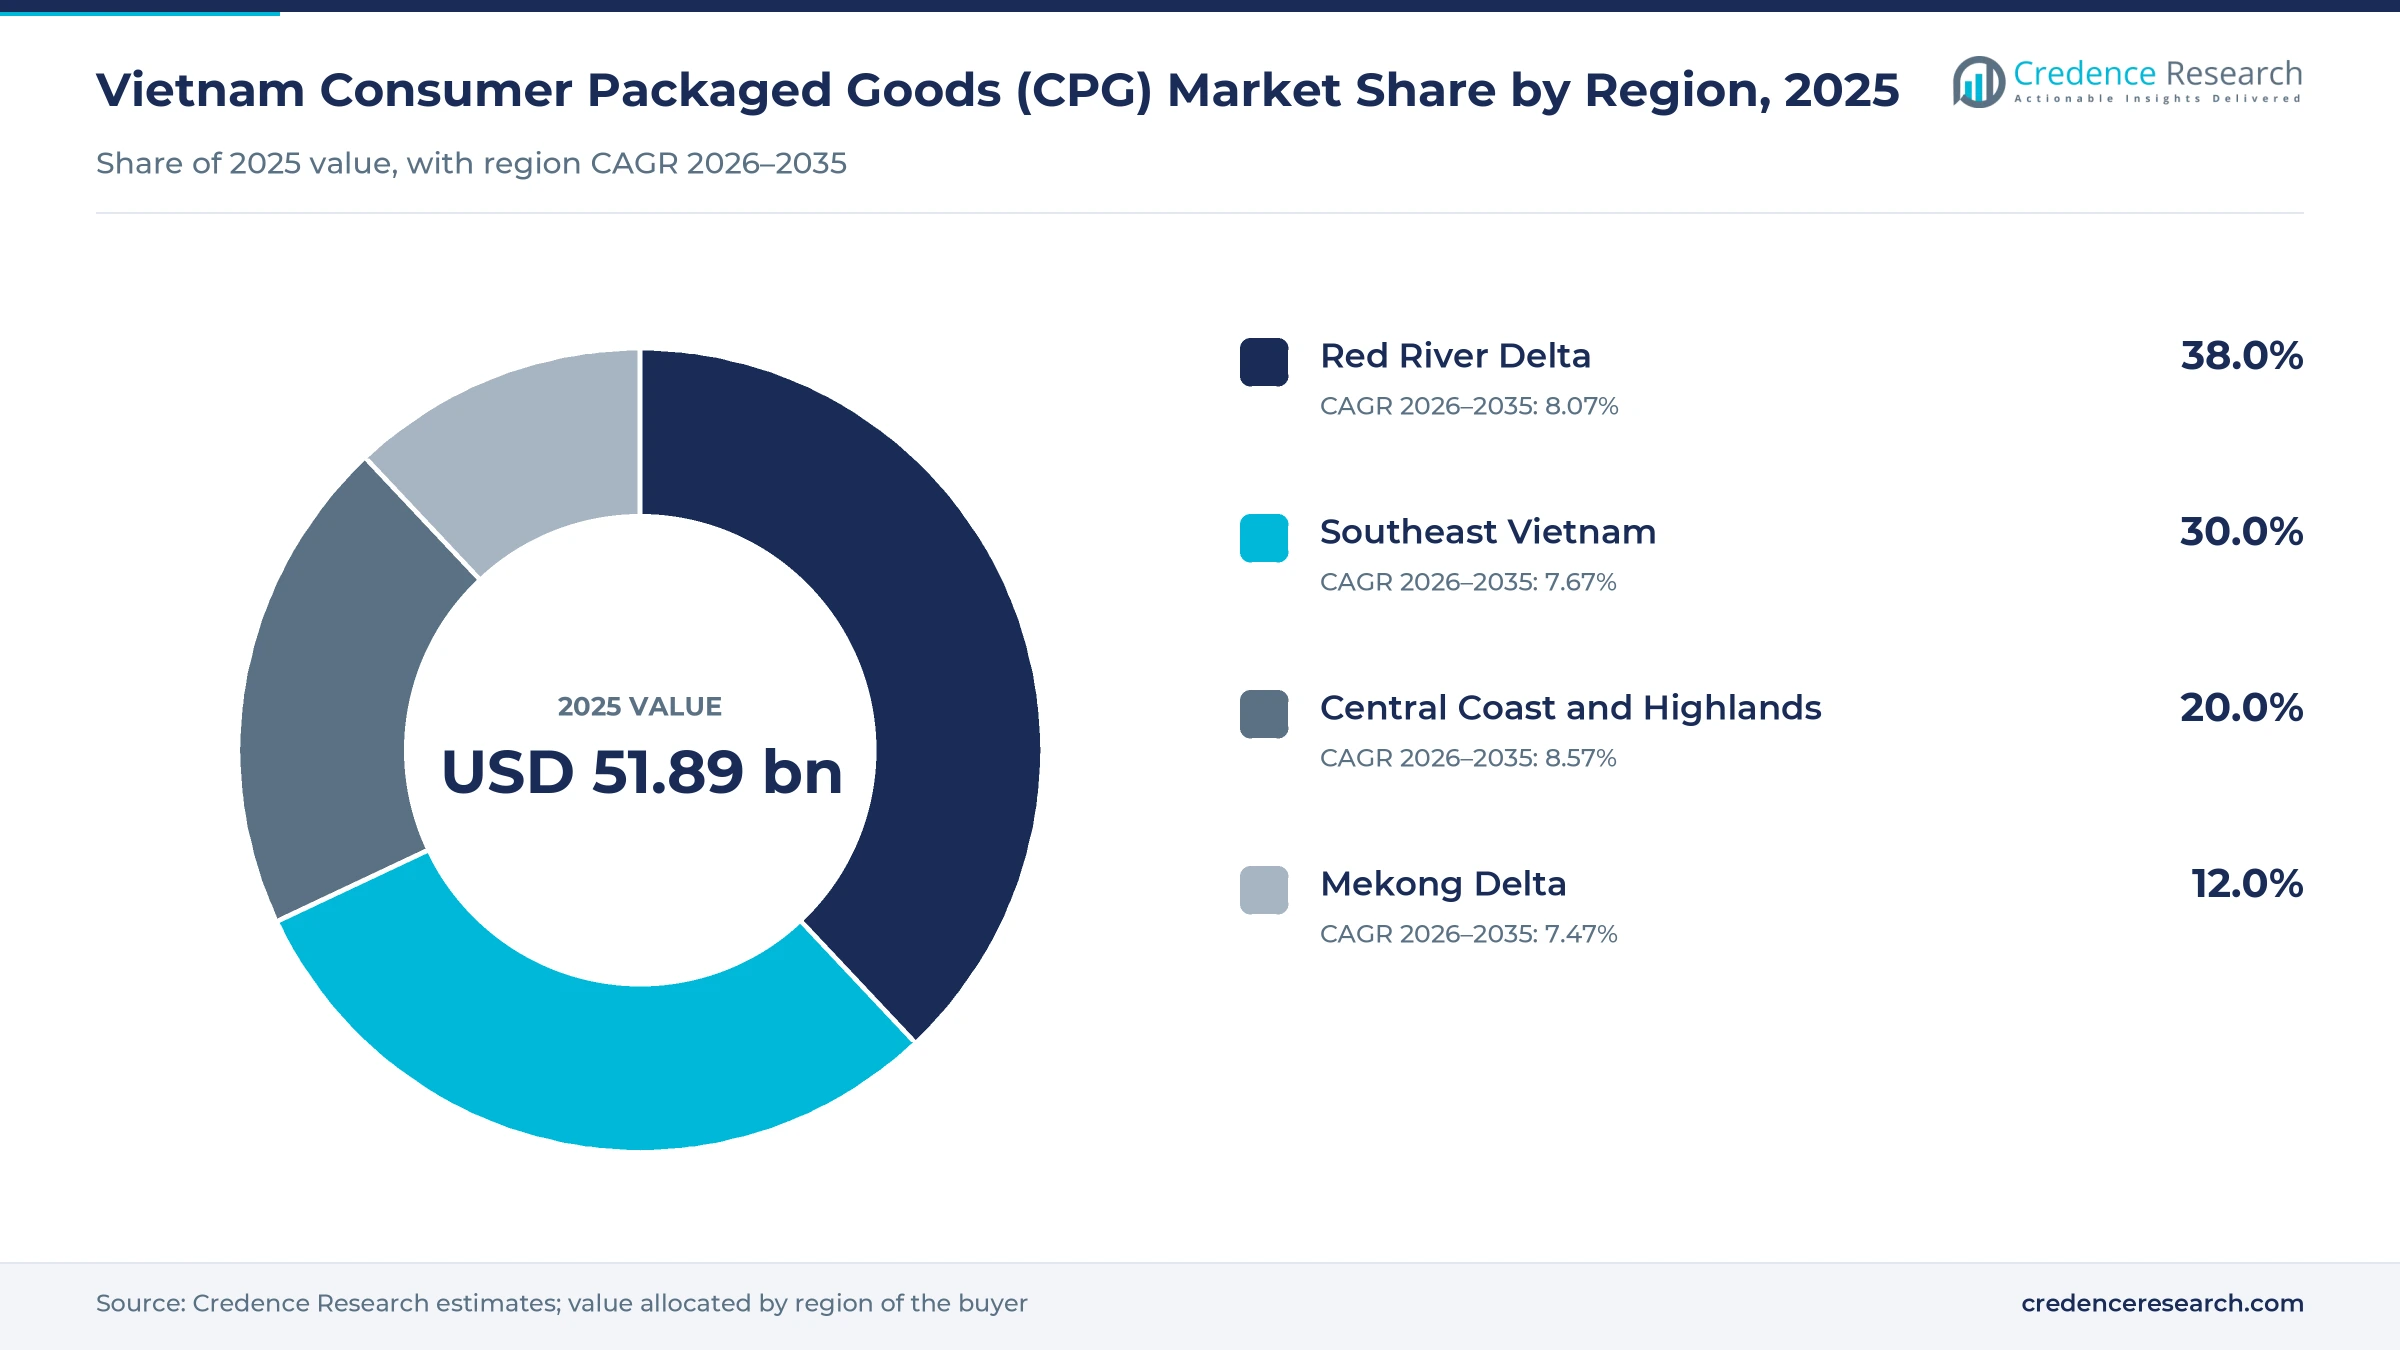
Red River Delta leads and central provinces gain ground
| Region | Value, 2025 (USD billion) | Share, 2025 | CAGR, 2026–2035 |
|---|---|---|---|
| Red River Delta | 17.86 | 38.0% | 8.07% |
| Southeast Vietnam | 14.10 | 30.0% | 7.67% |
| Central Coast and Highlands | 9.40 | 20.0% | 8.57% |
| Mekong Delta | 5.64 | 12.0% | 7.47% |
Red River Delta leads on Hanoi income and northern stores
Red River Delta held 38.0% of 2025 value and grows at 8.07% a year, making it the largest zone in this report. Hanoi recorded the highest monthly per capita income in the country at VND8.374 million in 2025, according to DTiNews, citing the General Statistics Office. The delta also grew 9.74% in 2025 and contributed more than 36% of national growth, VietnamPlus reported. WinCommerce added 271 northern stores in early 2026, reaching 2,696, and Acecook Vietnam plans Hung Yen operations from 2027.
Southeast Vietnam keeps the highest regional income
Southeast Vietnam held 30.0% of 2025 value and grows at 7.67% a year, slightly below the national pace because its store base is already dense. The zone recorded nearly VND7.5 million in monthly per capita income in 2025, the highest of any region, according to DTiNews. Ho Chi Minh City accounted for about 42% of Shopee sales and held 3,062 convenience outlets in the 2026 forecast, The Investor reported. Plants run by Nestlé Vietnam, Procter & Gamble Vietnam and Unilever Vietnam also sit in or near this zone.

Central Coast and Highlands gain from new store networks
Central Coast and Highlands held 20.0% of 2025 value and grows fastest at 8.57% a year because new grocery stores are arriving from a lower base. Combined growth in the South Central Coast and Central Highlands reached 7.74% in 2025, according to Vietstock, citing National Statistics Office estimates. Da Nang stood out at 9.18% in the same release. Bach Hoa Xanh directed most of its 2025 openings here, and WinCommerce added 77 central stores in the first four months of 2026.
Mekong delta remains the smallest and slowest-growing zone
Mekong Delta held 12.0% of 2025 value and grows at 7.47% a year, the slowest pace among the four zones in this report. The region grew 7.24% in 2025 and contributed 8.39% of national growth, according to Vietstock, citing National Statistics Office estimates, well behind the Red River Delta contribution. Coca-Cola Beverages Vietnam chose nearby Long An for a US$136 million factory licensed in 2022, which supports drink supply. Long An online sales rose 63.41% on Shopee in 2025, according to The Investor.
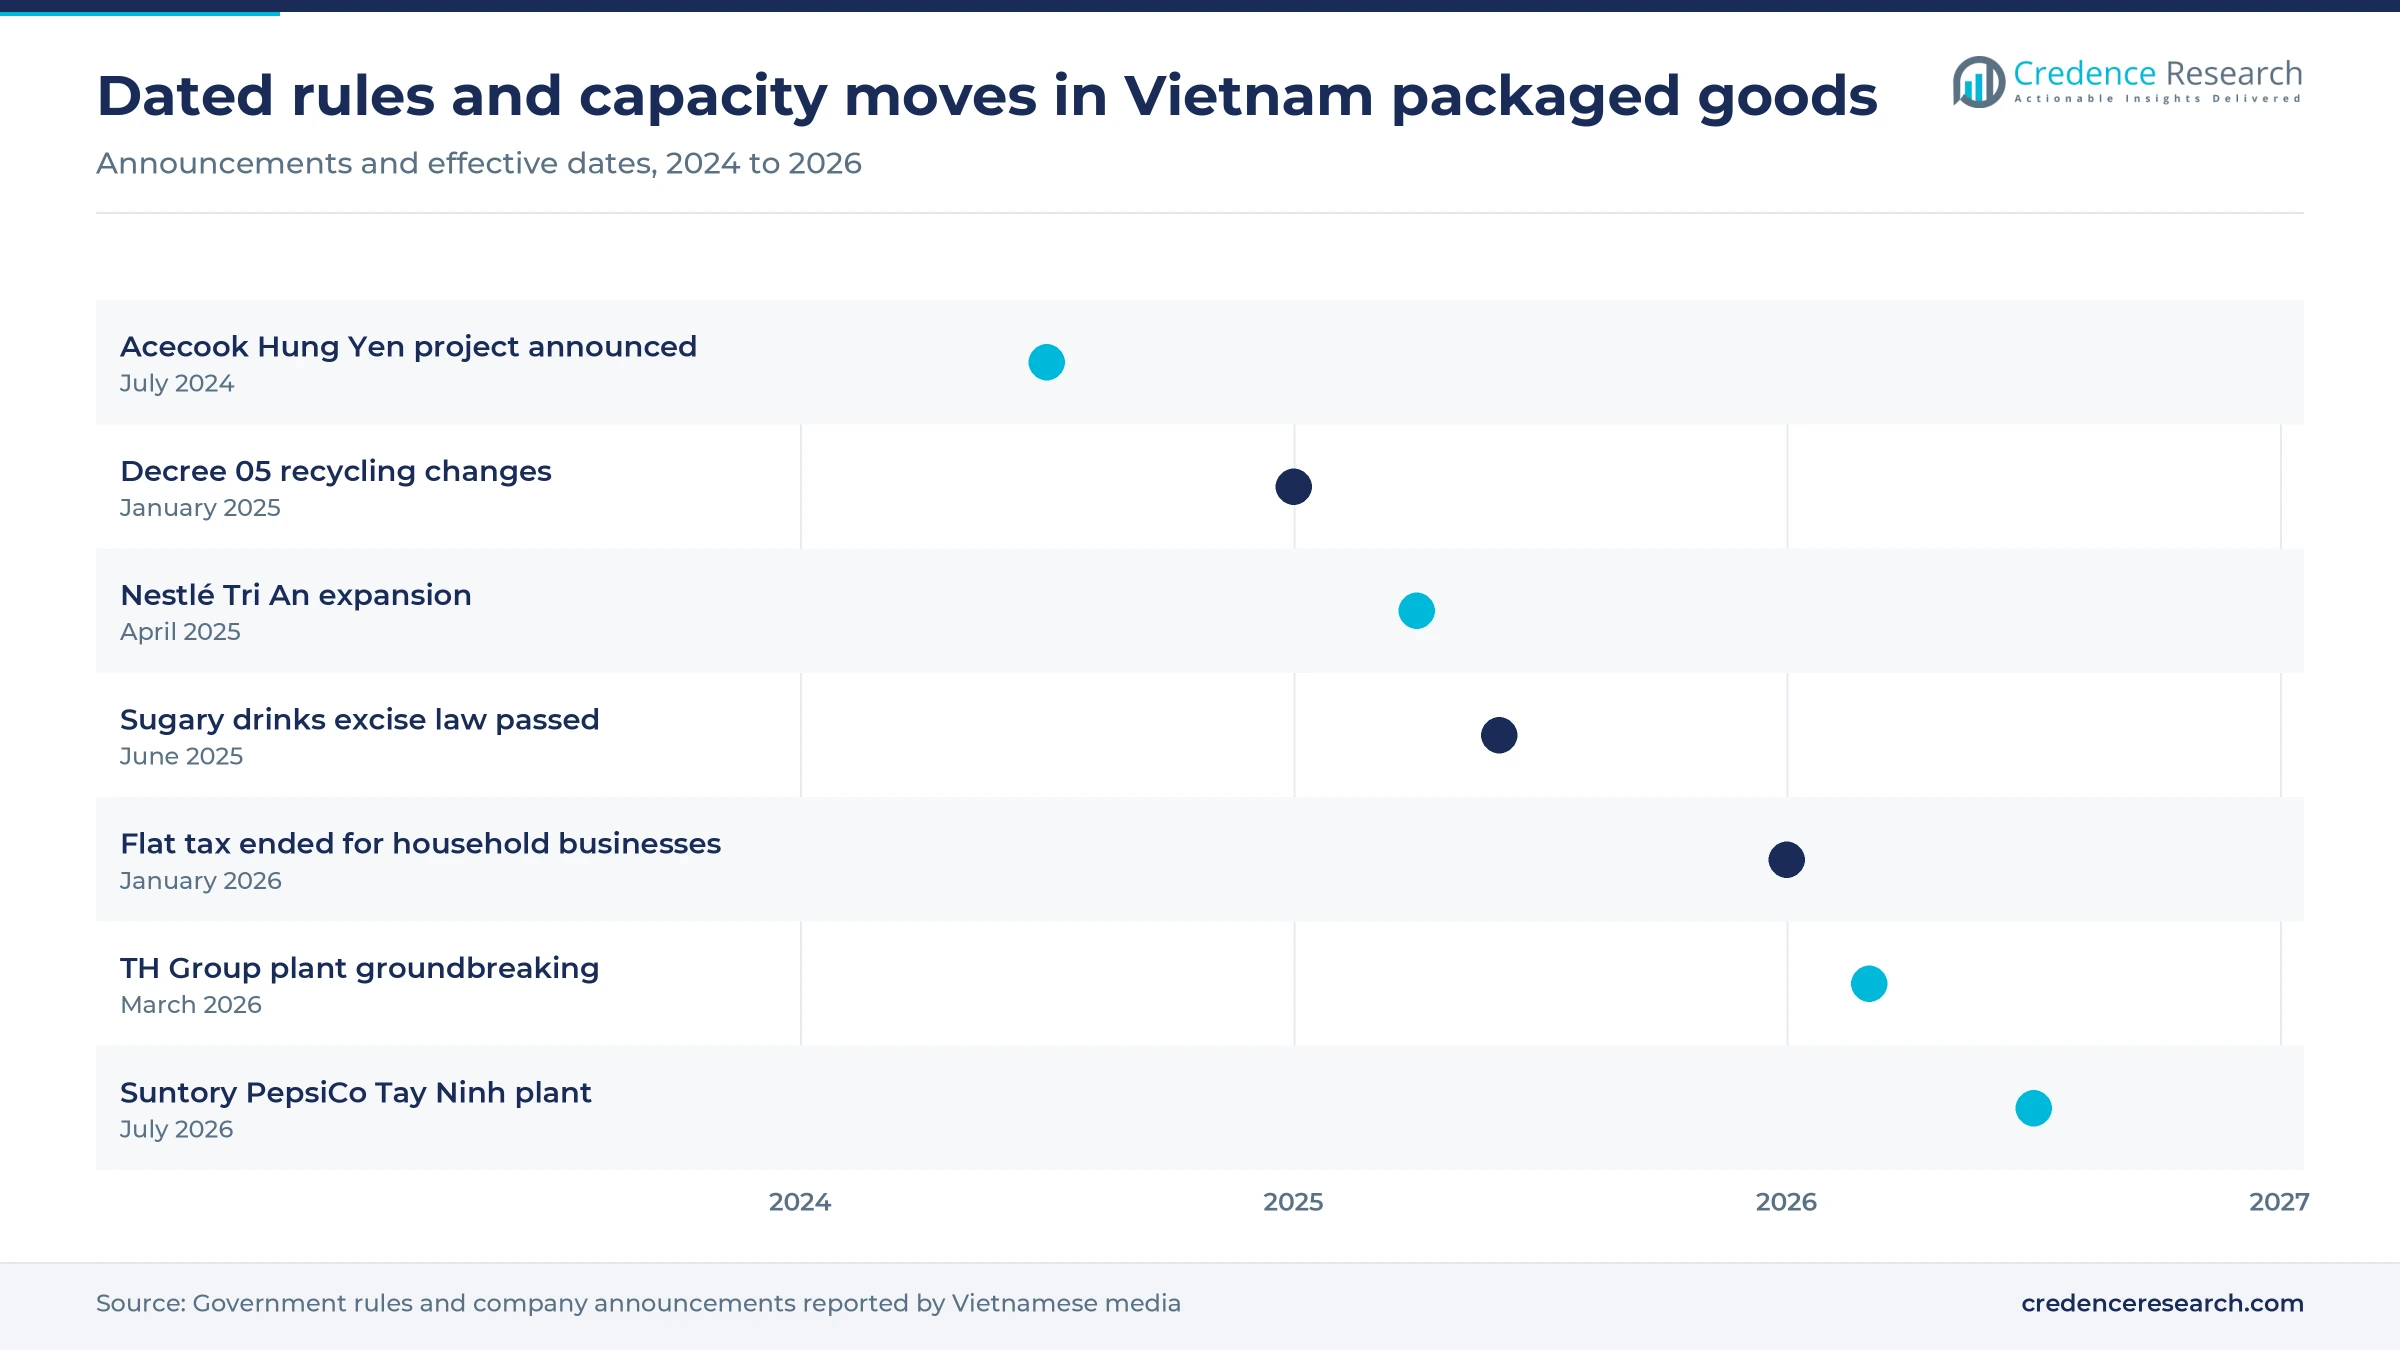
Plants, tax rules and listings set the 2024–2026 agenda
| Development | Status and market relevance |
|---|---|
| In July 2024, Acecook Vietnam announced a VND2,200 billion project in Hung Yen province. | Operations are due from the second quarter of 2027, adding northern noodle capacity. |
| In April 2025, Nestlé Vietnam announced nearly US$75 million more for its Tri An factory. | The Dong Nai plant makes the full Nestlé coffee portfolio. |
| In June 2025, the National Assembly passed the amended Special Consumption Tax Law. | Drinks above 5 grams of sugar per 100 milliliters face excise from Jan. 1, 2027. |
| In December 2025, Masan Consumer announced its migration roadmap to the Ho Chi Minh City Stock Exchange. | The move raises the listed profile of a leading domestic food and drink group. |
| In March 2026, TH Group began a dairy and beverage plant at Song Than 3 Industrial Park. | Operations are planned from the first quarter of 2027, with capacity ramping over about 10 years. |
Plant lines and shelf data change how brands compete
- Smart factory design shapes the Coca-Cola Beverages Vietnam site in Long An, where a 19-hectare plant was licensed for US$136 million.
- In-house raw material lines reduce import reliance, as with the 14,000-ton sorbitol line Unilever Vietnam planned for its Cu Chi toothpaste factory.
- Tax-connected cash registers give authorities invoice data from larger household businesses under Decree 70, which took effect June 1, 2025.
- Livestream storefronts give brand owners direct sales data, and TikTok Shop took about half of online beauty sales in the fourth quarter of 2025, according to Vietstock.
Need a Custom Version of This Report?
Tailor the scope, geography, or segments to your exact requirements.
- Custom geography or segment scope
- Direct access to our analyst team
Local champions and multinationals chase the same outlets
Competition turns on outlet coverage, category breadth and the ability to fund both street-shop and online programs at the same time. Vinamilk and TH Group anchor dairy, with TH adding capacity at Song Than 3 and Vinamilk adjusting prices in 2026 to offset raw material and logistics costs. Masan Consumer reaches nearly 500,000 traditional outlets and announced its Ho Chi Minh City Stock Exchange migration in December 2025, while sister chain WinCommerce gives it a test shelf for new products. Mondelez Kinh Do reports more than 450,000 retail outlets in this market for snacks and seasonal gifts. Acecook Vietnam competes on noodles, and Unilever Vietnam and Procter & Gamble Vietnam contest personal and home care through local plants. Suntory PepsiCo Vietnam Beverage, Coca-Cola Beverages Vietnam and Nestlé Vietnam compete on beverage and coffee capacity built inside the country.
Companies profiled and their roles in this market
| Company | Type | Role in the market |
|---|---|---|
| Vietnam Dairy Products JSC (Vinamilk) | Domestic leader | Dairy and nutrition supplier that planned selling price rises of about 2% to 3% in May 2026 |
| Masan Consumer Corporation | Domestic leader | Sauces, noodles and drinks through nearly 500,000 traditional outlets, with a HoSE migration roadmap announced Dec. 4, 2025 |
| Unilever Vietnam | Multinational | Personal and home care, with a Cu Chi expansion for toothpaste raw material valued at about VND2.7 trillion |
| Nestlé Vietnam | Multinational | Coffee and nutrition, with Tri An factory investment above US$175 million across 2024 and 2025 |
| Suntory PepsiCo Vietnam Beverage | Joint venture | Beverages, with a US$300 million Tay Ninh plant reported open in July 2026 |
| Acecook Vietnam | Japanese-owned producer | Instant noodles, with a Hung Yen project of about VND2,200 billion due in the second quarter of 2027 |
| Mondelez Kinh Do Vietnam | Multinational | Biscuits, snacks and seasonal gifts through more than 450,000 retail outlets |
| Coca-Cola Beverages Vietnam | Multinational | Soft drinks, with a US$136 million Long An factory licensed in 2022 |
| Procter & Gamble Vietnam | Multinational | Fabric and dish care, with Binh Duong output planned to rise 48.7% to 487,431 tons, as reported in January 2024 |
| TH Group | Domestic challenger | Dairy and non-alcoholic drinks, with a plant begun March 9, 2026, at Song Than 3 Industrial Park |
Distribution depth matters more than headline growth
Credence Research's view is that the growth rate alone tells buyers little in this market, because in-home volume is soft while mix and channel change carry value. Companies with both deep street-shop coverage and strong official online stores are best placed, since neither route can be dropped before 2035. The most assumption-heavy estimate is the regional split, which places Red River Delta ahead of Southeast Vietnam even though the Southeast records the higher average income. Buyers should therefore test zone plans against their own sell-out data before committing large budgets.
Evidence and limits behind these shelf estimates
The report uses 2025 as the base year and forecasts 2026 through 2035. Market values come from the Credence Research model, and segment and regional splits are Credence Research estimates. Evidence comes from public sources only, including National Statistics Office and Ministry of Industry and Trade data reported in Vietnamese media, World Bank data, company announcements, legal commentary and national business press. No primary interviews or surveys were conducted for this edition, and category boundaries differ among public sources, so the splits should be read as informed estimates.
Premium mix and rural reach shape the path to 2035
The market is forecast to reach USD 101.28 billion by 2035, and the route depends on mix as much as volume. With about 101.6 million residents in 2025, according to the World Bank, daily demand keeps a broad base of shoppers. The sugar excise will reshape beverages from 2027 onward, while the national target for e-commerce gives online sales further room through 2030. Chains will keep spreading into rural districts, although street shops should remain the largest channel throughout the period. Companies that hold rural distribution and earn trust through official stores should capture a disproportionate share of the added value.
Frequently Asked Questions
How big is the Vietnam consumer packaged goods market?
Which product type leads the market?
Which region holds the largest share?
Which channel is growing fastest?
How will the sugar excise affect beverage brands?
Why does traditional trade still lead distribution?
Which companies compete in this market?
What are the main challenges for suppliers?
Table of Content
Chapter 1 Market Segmentation
- 1.1 Segmentation Framework
- 1.1.1 Product and Service Classification
- 1.1.2 Application and End-Use Classification
- 1.1.3 Technology and Solution Classification
- 1.1.4 Customer and Distribution Channel Classification
- 1.1.5 Geographic Segmentation
- 1.1.6 Market Segment Definitions and Boundaries
- 1.2 By Product Type
- 1.2.1 Packaged Food and Nutrition
- 1.2.2 Non-Alcoholic Beverages
- 1.2.3 Personal and Beauty Care
- 1.2.4 Household and Consumer Health
- 1.3 By Price Tier
- 1.3.1 Economy
- 1.3.2 Mainstream
- 1.3.3 Premium
- 1.3.4 Super-Premium
- 1.4 By Packaging Format
- 1.4.1 Single-Serve Flexible Packaging
- 1.4.2 Family and Multi-Pack Formats
- 1.4.3 Rigid Containers
- 1.4.4 Refill and Sustainable Formats
Chapter 2 Introduction
- 2.1 Report Objectives and Scope
- 2.2 Product Definition and Industry Terminology
- 2.3 Market Inclusions and Exclusions
- 2.4 Research Process
- 2.4.1 Primary Research and Expert Interviews
- 2.4.2 Secondary Research and Source Review
- 2.4.3 Top-Down and Bottom-Up Estimation
- 2.4.4 Data Triangulation and Verification
- 2.5 Market Size Measurement Basis
- 2.5.1 2025: USD 47.00 billion → 2035: USD 101.28 billion
- 2.6 Historical and Forecast Reference Periods
- 2.6.1 Historical Period: 2018-2025
- 2.6.2 Base Year: 2025
- 2.6.3 Forecast Period: 2025-2035
- 2.7 Research Assumptions and Limitations
Chapter 3 Executive Summary
- 3.1 Market Snapshot and Key Findings
- 3.2 Base-Year Market Size, 2025
- 3.3 Forecast Market Size, 2035
- 3.4 Revenue and Volume Growth Outlook
- 3.5 Key Demand and Supply Indicators
- 3.6 Leading Market Segments
- 3.7 Fastest-Growing Market Opportunities
- 3.8 Regional Performance Highlights
- 3.9 Technology and Industry Transformation
- 3.10 Competitive Landscape Summary
- 3.11 Analyst View and Strategic Implications
Chapter 4 Vietnam Consumer Packaged Goods (CPG) Market Trends and Developments
- 4.1 Historical Industry Development, 2018-2025
- 4.2 Recent Market Trends and Developments
- 4.3 Demand and Customer Behavior Trends
- 4.4 Technology and Product Innovation
- 4.5 Artificial Intelligence, Automation and Digitalization
- 4.6 Local Manufacturing and Supply Chain Realignment
- 4.7 Industry Partnerships, Mergers and Acquisitions
- 4.8 Sustainability and Circular Economy Developments
- 4.9 Government and Private Sector Investment Trends
- 4.10 Emerging Business Models and Commercialization
- 4.11 Industry Developments and Announcements
Chapter 5 Vietnam Consumer Packaged Goods (CPG) Market Production, Supply and Demand Analysis
- 5.1 Demand Trend and Consumption Analysis, 2018-2025
- 5.2 Demand Forecast, 2025-2035
- 5.3 Production and Output Trend, 2018-2025
- 5.4 Production and Output Forecast, 2025-2035
- 5.5 Installed Capacity and Capacity Utilization
- 5.6 Company-Wise Production Plants and Statistics
- 5.6.1 Installed Production Capacity
- 5.6.2 Actual Production
- 5.6.3 Planned Capacity and Expansion Targets
- 5.7 Supply Chain Structure and Procurement Trends
- 5.8 Supply-Demand Gap and Bottlenecks
- 5.9 Import Dependence and Sourcing Structure
- 5.10 Contract Manufacturing and Outsourcing
- 5.11 Regional Supply and Demand Concentration
Chapter 6 Vietnam Consumer Packaged Goods (CPG) Market Pricing Analysis
- 6.1 Pricing Structure and Measurement
- 6.2 Historical Pricing Trends, 2018-2025
- 6.3 Pricing Outlook, 2025-2035
- 6.4 Average Selling Price and Unit Economics
- 6.5 Pricing by Product and Market Segment
- 6.6 Geographic Pricing Differences
- 6.7 Key Input, Energy, Labor and Logistics Costs
- 6.8 Contract Pricing and Purchasing Models
- 6.9 Pricing Sensitivity and Competitive Positioning
- 6.10 Price, Margin and Profitability Implications
Chapter 7 Vietnam Consumer Packaged Goods (CPG) Market Dynamics
- 7.1 Market Growth Drivers
- 7.1.1 Demand-Side Drivers
- 7.1.2 Technology and Innovation Drivers
- 7.1.3 Infrastructure and Investment Drivers
- 7.1.4 Regulatory and Policy Drivers
- 7.2 Market Restraints
- 7.2.1 Cost and Affordability Constraints
- 7.2.2 Technology and Adoption Barriers
- 7.2.3 Supply Chain and Operational Constraints
- 7.3 Market Challenges
- 7.3.1 Competitive Pressure and Margin Erosion
- 7.3.2 Skills, Infrastructure and Implementation Gaps
- 7.4 Emerging Market Opportunities
- 7.5 Market Dynamics Impact and Time-Horizon Assessment
Chapter 8 Vietnam Consumer Packaged Goods (CPG) Value Chain Analysis
- 8.1 Industry Value Chain Overview
- 8.2 Upstream Suppliers and Critical Inputs
- 8.3 Technology and Component Providers
- 8.4 Manufacturing or Service Delivery
- 8.5 Distribution, Channel Partners and Integrators
- 8.6 Downstream Applications and End Users
- 8.7 Value Addition and Profit Pools
- 8.8 Vertical Integration and Outsourcing
- 8.9 Supplier Concentration and Risk
- 8.10 Supply Chain Localization and Resilience
Chapter 9 Vietnam Consumer Packaged Goods (CPG) Market Regulations and Policies
- 9.1 Relevant Laws, Standards and Compliance Frameworks
- 9.2 Product, Service, Safety and Quality Requirements
- 9.3 Government Policies, Incentives and Subsidies
- 9.4 Imports, Exports and Trade Barriers
- 9.5 Public Procurement and Local Content Requirements
- 9.6 Environmental and Sustainability Compliance
- 9.7 Upcoming Policy Changes and Market Implications
Chapter 10 Vietnam Consumer Packaged Goods (CPG) Market Hotspots and Opportunities
- 10.1 Market Opportunity Mapping and Growth Hotspots
- 10.2 High-Growth Applications and Customer Groups
- 10.3 Underserved Markets and White-Space Opportunities
- 10.4 Emerging Technology and Product Opportunities
- 10.5 New Capacity and Investment Hotspots
- 10.6 Market Entry and Expansion Opportunities
- 10.7 Distribution and Partnership Opportunities
- 10.8 Near-Term and Long-Term Commercial Potential
- 10.9 Opportunity Attractiveness and Execution Risks
Chapter 11 Vietnam Consumer Packaged Goods (CPG) Market Outlook, 2025-2035
- 11.1 Market Size and Analysis
- 11.1.1 Revenue (Market Measurement: 2025: USD 47.00 billion → 2035: USD 101.28 billion)
- 11.1.2 Market Volume and Quantity Sold
- 11.1.3 Historical Market Size, 2018-2025
- 11.1.4 Base-Year Market Size, 2025
- 11.2 Market Forecast, 2025-2035
- 11.2.1 Revenue Forecast to 2035
- 11.2.2 Volume Forecast to 2035
- 11.2.3 CAGR and Year-on-Year Growth
- 11.2.4 Incremental Revenue Opportunity
- 11.3 Forecast Assumptions and Scenario Analysis
- 11.3.1 Base-Case Forecast
- 11.3.2 Optimistic and Conservative Scenarios
- 11.3.3 Technology, Pricing and Policy Sensitivities
- 11.4 Market Attractiveness and Growth Outlook
Chapter 12 Vietnam Consumer Packaged Goods (CPG) Market Segmentation and Outlook
- 12.1 Segmentation Summary and Market Shares, 2025
- 12.2 Largest and Fastest-Growing Segments
- 12.3 By Product Type - Market Size and Forecast, 2025-2035
- 12.3.1 Segment Definition and Scope
- 12.3.2 Historical Market Size, 2018-2025
- 12.3.3 Revenue Forecast, 2025-2035
- 12.3.4 Volume Forecast, 2025-2035
- 12.3.5 Base-Year Market Share, 2025
- 12.3.6 Segment CAGR and Growth Drivers
- 12.3.7 Subsegment Market Size and Forecast
- 12.3.7.1 Packaged Food and Nutrition
- 12.3.7.2 Non-Alcoholic Beverages
- 12.3.7.3 Personal and Beauty Care
- 12.3.7.4 Household and Consumer Health
- 12.3.8 Subsegment Pricing and Adoption Trends
- 12.3.9 Leading Suppliers and Competition
- 12.3.10 Regional Demand and Opportunities
- 12.4 By Price Tier - Market Size and Forecast, 2025-2035
- 12.4.1 Segment Definition and Scope
- 12.4.2 Historical Market Size, 2018-2025
- 12.4.3 Revenue Forecast, 2025-2035
- 12.4.4 Volume Forecast, 2025-2035
- 12.4.5 Base-Year Market Share, 2025
- 12.4.6 Segment CAGR and Growth Drivers
- 12.4.7 Subsegment Market Size and Forecast
- 12.4.7.1 Economy
- 12.4.7.2 Mainstream
- 12.4.7.3 Premium
- 12.4.7.4 Super-Premium
- 12.4.8 Subsegment Pricing and Adoption Trends
- 12.4.9 Leading Suppliers and Competition
- 12.4.10 Regional Demand and Opportunities
- 12.5 By Packaging Format - Market Size and Forecast, 2025-2035
- 12.5.1 Segment Definition and Scope
- 12.5.2 Historical Market Size, 2018-2025
- 12.5.3 Revenue Forecast, 2025-2035
- 12.5.4 Volume Forecast, 2025-2035
- 12.5.5 Base-Year Market Share, 2025
- 12.5.6 Segment CAGR and Growth Drivers
- 12.5.7 Subsegment Market Size and Forecast
- 12.5.7.1 Single-Serve Flexible Packaging
- 12.5.7.2 Family and Multi-Pack Formats
- 12.5.7.3 Rigid Containers
- 12.5.7.4 Refill and Sustainable Formats
- 12.5.8 Subsegment Pricing and Adoption Trends
- 12.5.9 Leading Suppliers and Competition
- 12.5.10 Regional Demand and Opportunities
- 12.6 Segment Growth Comparison
- 12.7 Segment Attractiveness and Priority Matrix
Chapter 13 Vietnam Consumer Packaged Goods (CPG) Geographic Market Outlook, 2025-2035
- 13.1 Domestic Market Distribution and Demand Clusters
- 13.2 State- or Province-Wise Market Size and Forecast, 2025-2035
- 13.3 City and Metropolitan Market Outlook
- 13.4 Industrial, Manufacturing and Commercial Clusters
- 13.5 Geographic Concentration of Key End Users
- 13.6 Local Pricing and Purchasing Differences
- 13.7 Domestic Production Facilities and Capacity Map
- 13.8 Local Infrastructure and Project Pipeline
- 13.9 State-Level Policy and Incentive Differences
- 13.10 Subnational Investment Hotspots and Opportunities
- 13.11 Distribution and Logistics Networks
- 13.12 Domestic Competitive Footprint
Chapter 14 Vietnam Consumer Packaged Goods (CPG) Technology, Innovation and Sustainability Outlook
- 14.1 Technology Landscape and Maturity
- 14.2 Product, Process and Service Innovation
- 14.3 AI, Automation and Digital Tools in the Industry
- 14.4 Technology Adoption and Performance Benchmarking
- 14.5 Innovation Pipeline and R&D Investment
- 14.6 Patent and Intellectual Property Trends
- 14.7 Energy Efficiency and Resource Management
- 14.8 Sustainability, Recycling and Circularity
- 14.9 Technology Roadmap, 2025-2035
- 14.10 Risks of Obsolescence and Technology Substitution
Chapter 15 Vietnam Consumer Packaged Goods (CPG) Market Key Strategic Imperatives
- 15.1 Growth and Market Entry Priorities
- 15.2 High-Return Products and Segments
- 15.3 Pricing, Profitability and Cost Optimization
- 15.4 Technology Investment and Product Differentiation
- 15.5 Supply Chain Localization and Resilience
- 15.6 Distribution and Customer Acquisition
- 15.7 Partnership, Acquisition and Capacity Strategy
- 15.8 Regional Expansion Priorities
- 15.9 Short-, Medium- and Long-Term Actions
Chapter 16 Competition Outlook
- 16.1 Industry Competition Characteristics
- 16.2 Market Structure and Concentration
- 16.3 Market Share and Competitive Positioning, 2025
- 16.4 Company-Wise Revenue and Product Benchmarking
- 16.5 Production and Service Capacity Benchmarking
- 16.6 Technology, Pricing and Differentiation
- 16.7 Regional Footprint and Distribution Strength
- 16.8 Mergers, Acquisitions and Strategic Alliances
- 16.9 New Entrants and Competitive Threats
- 16.10 Porter's Five Forces and Industry Attractiveness
- 16.11 Competitive Outlook, 2025-2035
Chapter 17 Company Profiles
- 17.1 Company Coverage and Selection Criteria
- 17.2 Vietnam Dairy Products JSC (Vinamilk)
- 17.2.1 Business Description
- 17.2.2 Company Ownership and Geographic Presence
- 17.2.3 Product and Service Portfolio
- 17.2.4 Manufacturing and Operating Footprint
- 17.2.5 Production Capacity and Expansion Plans
- 17.2.6 Financial Performance and Investment
- 17.2.7 Market Share and Competitive Position
- 17.2.8 Technology and Innovation Capabilities
- 17.2.9 Strategic Alliances or Partnerships
- 17.2.10 Recent Developments
- 17.2.11 Growth Strategy and Outlook
- 17.3 Masan Consumer Corporation
- 17.4 Unilever Vietnam
- 17.5 Nestlé Vietnam
- 17.6 Suntory PepsiCo Vietnam Beverage
- 17.7 Acecook Vietnam
- 17.8 Mondelez Kinh Do Vietnam
- 17.9 Coca-Cola Beverages Vietnam
- 17.10 Procter & Gamble Vietnam
- 17.11 TH Group
- 17.12 Other Relevant Market Participants
Note: Every listed company is profiled on the structure shown under the first company. The company list is preliminary and may change based on research findings, market developments, data availability and client requirements.
Chapter 18 Disclaimer
- 18.1 Research and Forecast Disclaimer
- 18.2 Data Source and Estimation Limitations
Note: The depth of individual sections depends on data availability for this market. Volume, capacity, trade and other unit-based metrics are included where applicable.