
Coal revenue still outweighs a fast renewable build
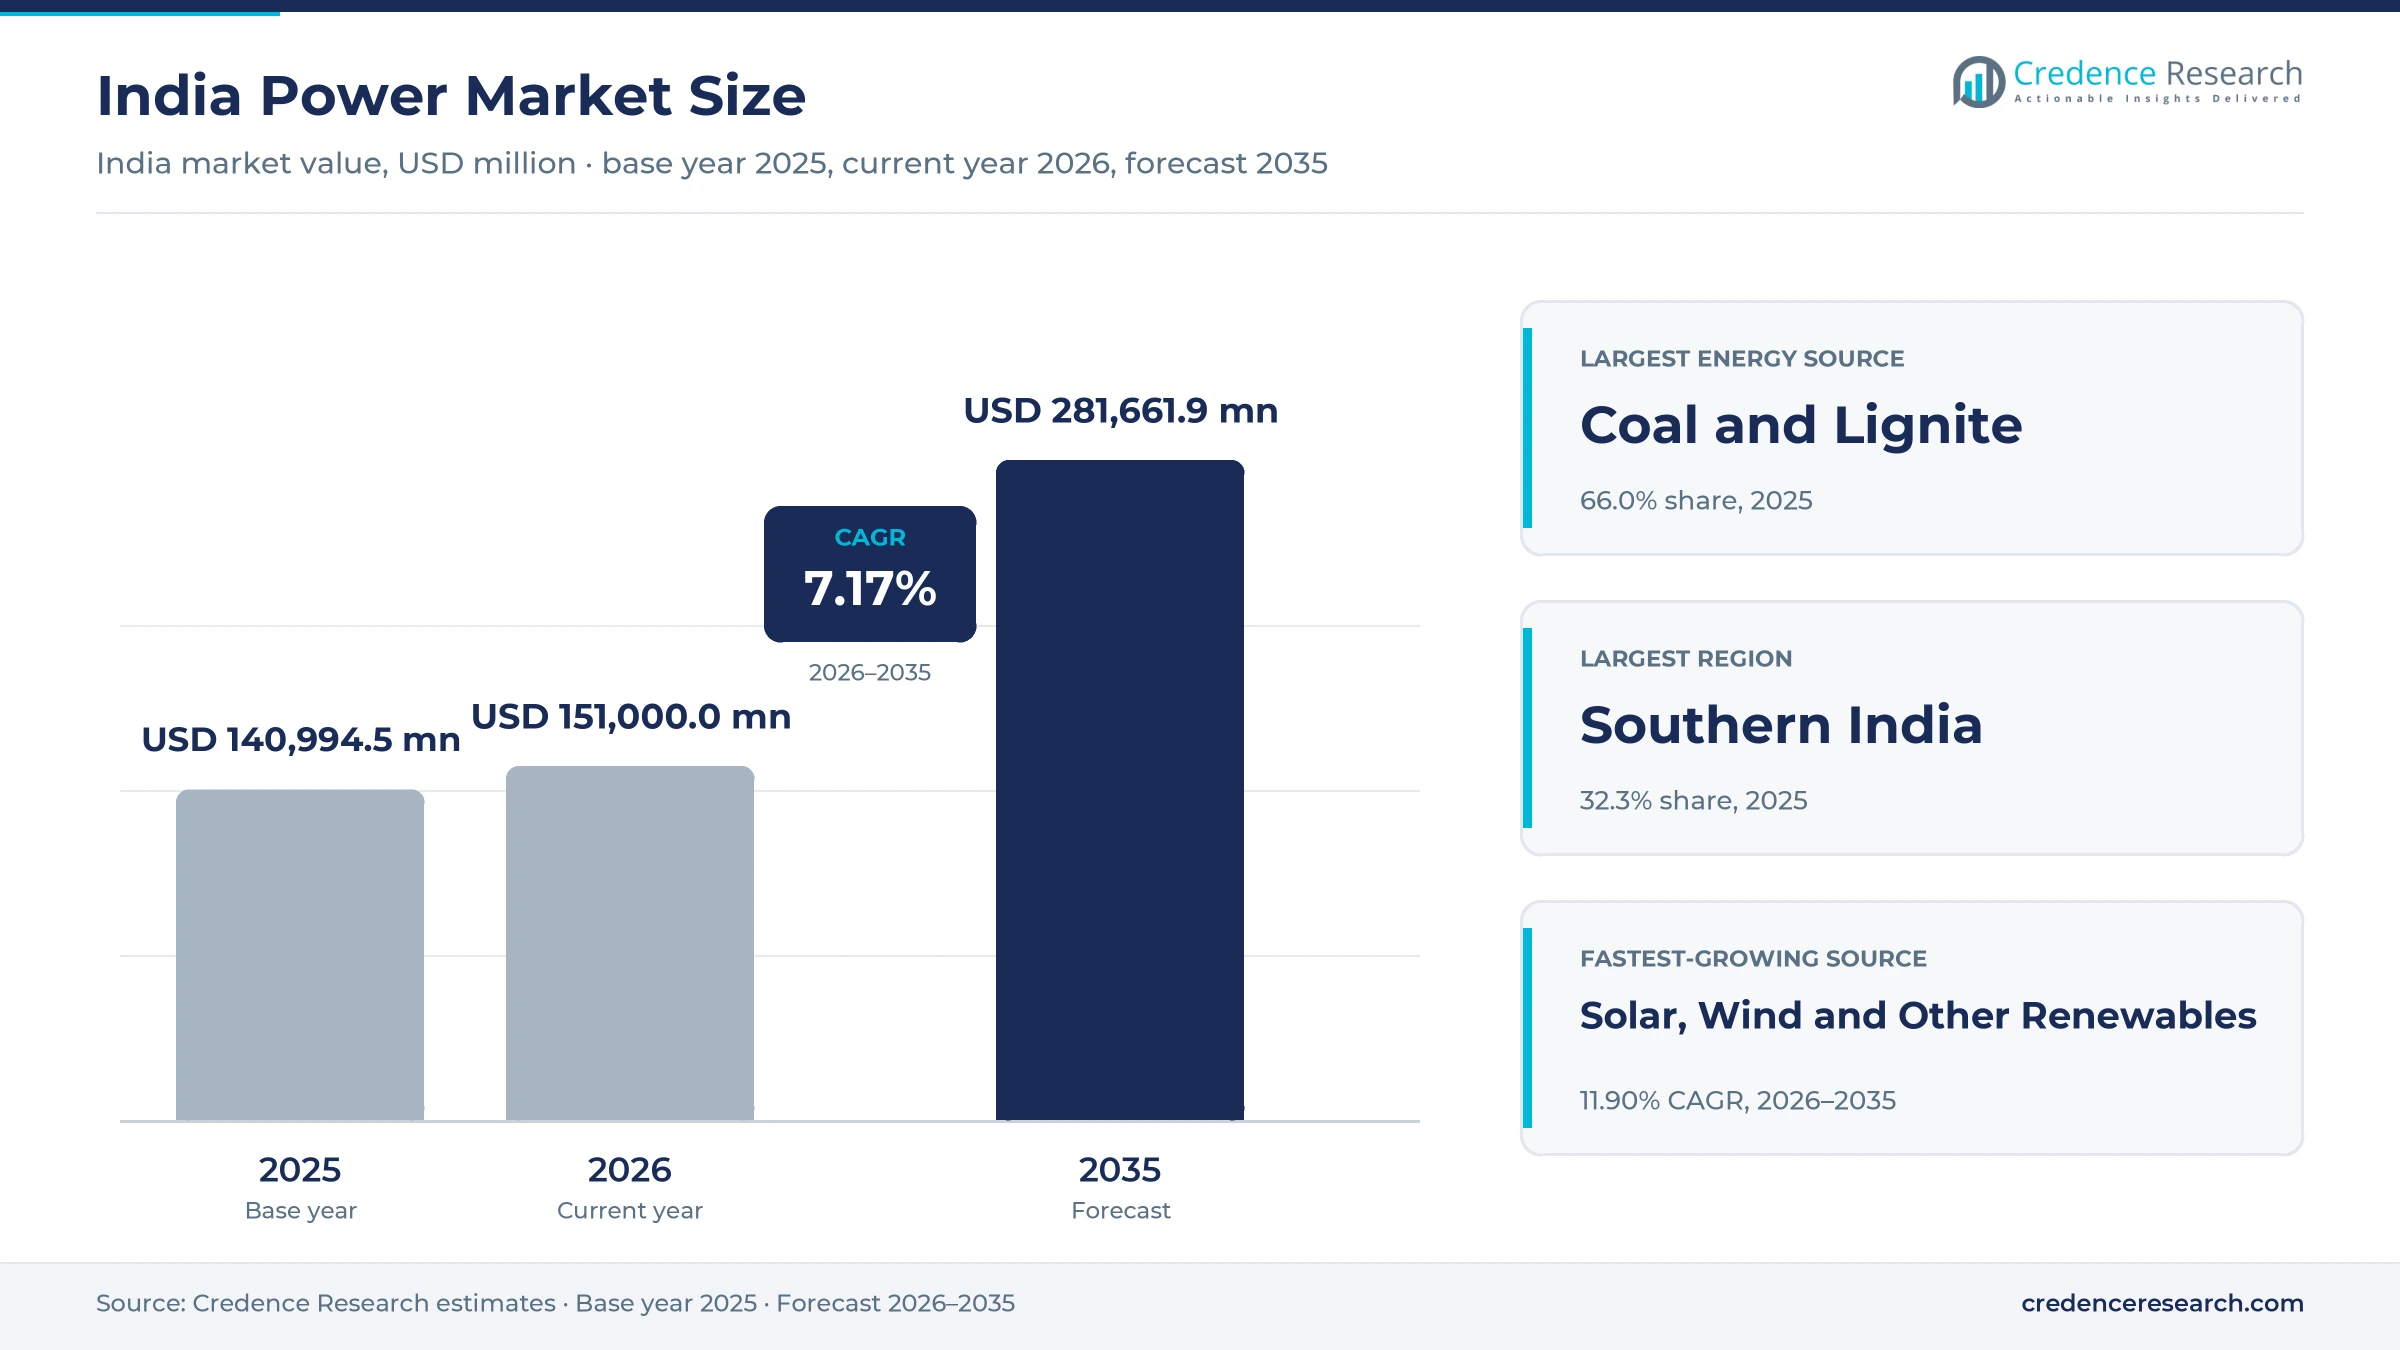
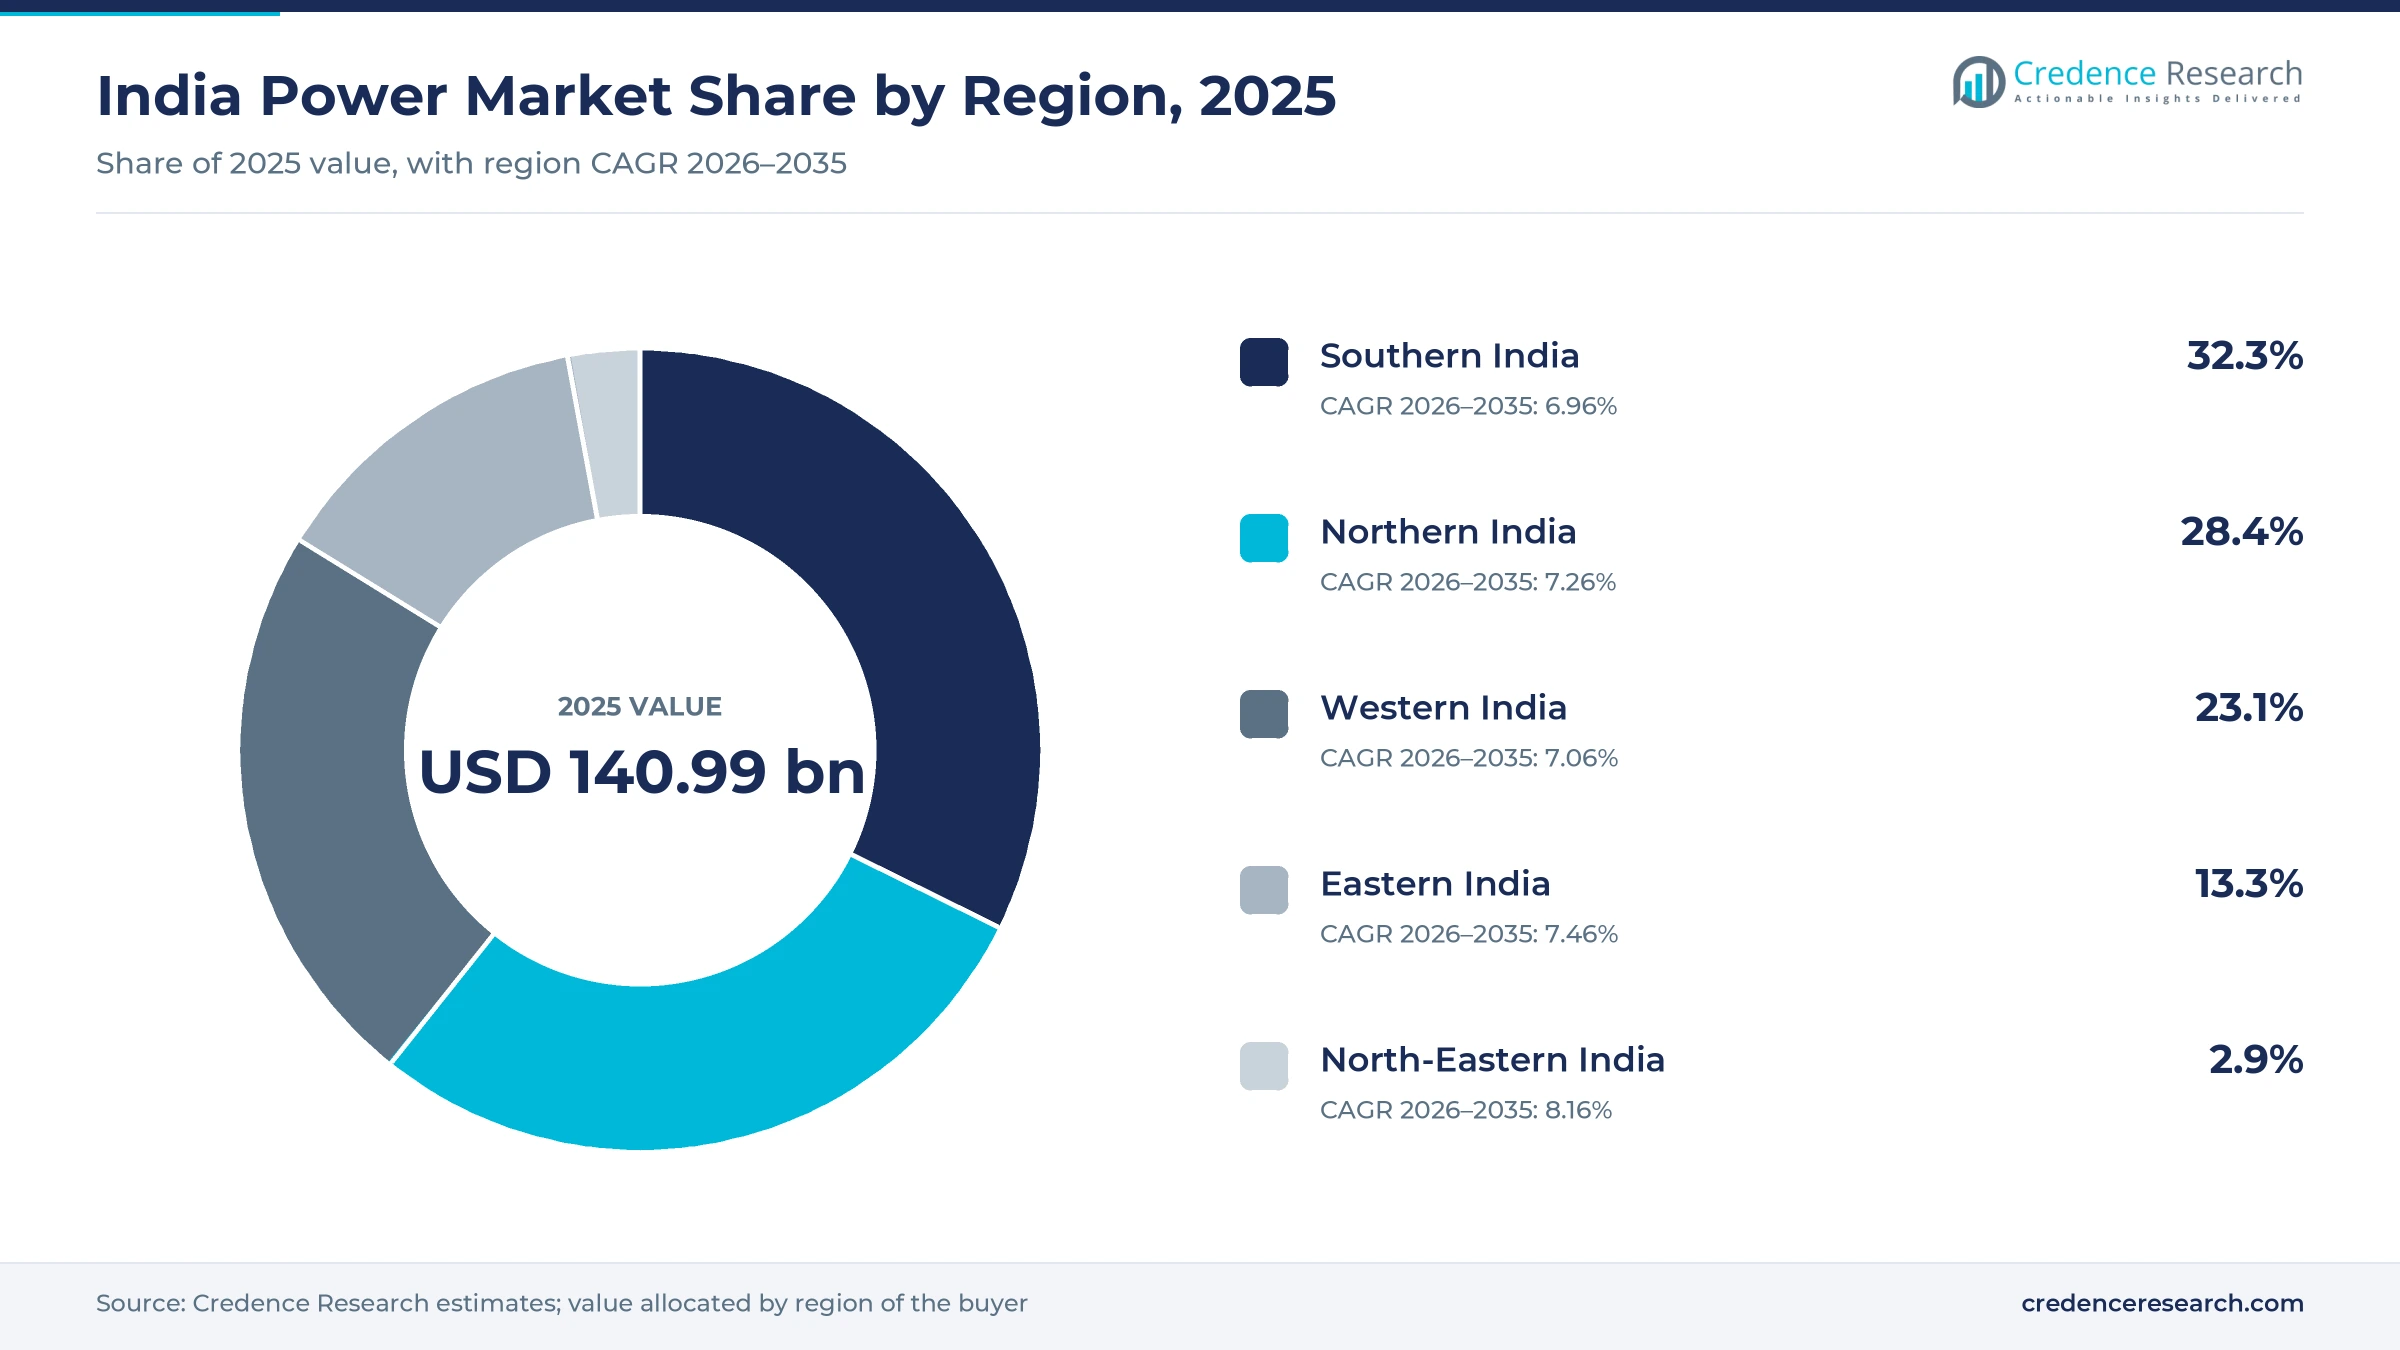
The India power market was valued at USD 140.99 billion in 2025 and is projected to increase from USD 151.00 billion in 2026 to USD 281.66 billion by 2035, registering a CAGR of 7.17% during 2026–2035. Demand comes from factories, households buying cooling equipment, irrigation pumps and an almost fully electrified rail network. Southern India held the largest regional share, 32.3% in 2025, and North-Eastern India is the fastest-growing zone at 8.16% a year as new hydro units enter service. Spending is moving toward non-fossil plants after the country added a record 55.3 GW of such capacity in 2025-26, while coal stations continue to carry most generation and evening load. Distribution finances also improved in 2024-25, when utilities reported a combined profit after years of losses, and that recovery supports payment discipline across the value chain as smart metering spreads to tens of millions of connections.
What the India power market counts and how power is bought
The market counts the value of electricity generated and supplied to end users, including utility sales, captive and open access supply, distributed systems and the related transmission, trading and flexibility services. Most buyers purchase through state distribution utilities on regulated tariffs, while large users increasingly contract directly with generators or through power exchanges.
Equipment sales, plant construction contracts and fuel trading are excluded because they represent inputs rather than delivered electricity. The value chain runs from generators and national and state transmission companies to distribution licensees, exchanges and storage operators, and the report sizes each part within a single delivered value.
India Power Market Insights
- The market rises from USD 140.99 billion in 2025 to USD 281.66 billion by 2035, a 7.17% CAGR that reflects higher consumption and a larger delivered value per connection.
- Southern India led with 32.3% of 2025 value, while the North-Eastern zone grows fastest at 8.16% a year as the Subansiri Lower units begin commercial operation.
- Coal and Lignite led with 66.0% of 2025 value, even though non-fossil plants reached half of cumulative installed capacity in June 2025.
- The national peak reached a record 270.8 GW on May 21, 2026, and dispatchable plants ran at about 90% of available capacity that day, which raises the value of firm evening supply.
- NTPC Group crossed 90 GW in May 2026, while private groups including Adani Power, Tata Power and JSW Energy have all announced nuclear plans after the December 2025 SHANTI Act.
Coal, baseload and private generators hold top shares
Why does coal still lead while renewables grow fastest?
Based on energy source, the market is categorized into coal and lignite, gas and liquid fuel, hydro and pumped storage, nuclear power and solar, wind and other renewables. Coal and Lignite led with 66.0% of 2025 value because non-fossil plants produced only 539 TWh of the 1,846 TWh generated in 2025-26, according to Enerdata in April 2026. Solar, Wind and Other Renewables grow fastest at 11.90% a year as record non-fossil additions reached 55.3 GW in that fiscal year, up from 29.5 GW a year earlier. Output from these newer plants is therefore rising much faster than their current revenue share suggests.
How do baseload contracts and rooftop supply compare?
Based on application, the market is categorized into baseload supply, peak and balancing, captive and open access, and distributed and behind-the-meter supply. Baseload Supply led with 62.0% of 2025 value because the Central Electricity Authority still expects coal to deliver about 51% of gross generation in 2035-36, according to Down To Earth in March 2026. Distributed and Behind-the-Meter grows fastest at 10.68% a year as more than 2.62 million rooftop systems had been deployed under PM Surya Ghar by March 20, 2026, according to PV Tech. Buyers of this supply reduce their utility purchases during daylight hours and shift utility sales toward evenings.
Which customers buy most power and whose bills grow fastest?
Based on end user, the market is categorized into industrial, residential, commercial and services, agriculture and railways and public infrastructure. Industrial led with 41.6% of 2025 value because factories were the largest consuming group in the Central Electricity Authority general review covering 2023-24, as reported by Down To Earth in January 2026, and that review counted over 60 BU of captive steel output. Residential grows fastest at 8.03% a year as air-conditioning capacity is rising 20% to 25% annually, according to Down To Earth in May 2026. Cooling devices already make up 40% of household electricity use, which adds to summer evening load.
Who owns the plants, and where is ownership moving?
Based on ownership model, the market is categorized into central public sector, state utilities, private independent power producers, municipal and cooperative, and consumer-owned assets. Private Independent Power Producers led with 38.0% of 2025 value because private companies held 278.6 GW of the 532.7 GW installed on March 31, 2026, in the Central Electricity Authority capacity table. Consumer-Owned assets grow fastest at 9.85% a year as the Electricity (Amendment) Rules notified on March 13, 2026, widened captive status to subsidiaries and fellow subsidiaries, according to the law firm Khaitan & Co. Corporate groups can therefore structure shared captive plants with less compliance risk.
| Segment Group | Leading Sub-segment | Share, 2025 | Fastest-growing Sub-segment | CAGR, 2026–2035 |
|---|---|---|---|---|
| By Energy Source | Coal and Lignite | 66.0% | Solar, Wind and Other Renewables | 11.90% |
| By Application | Baseload Supply | 62.0% | Distributed and Behind-the-Meter | 10.68% |
| By End User | Industrial | 41.6% | Residential | 8.03% |
| By Ownership Model | Private Independent Power Producers | 38.0% | Consumer-Owned | 9.85% |
Request a Free Sample
Fill in your details and we'll send you a free sample report.
- Sample data tables & charts
- Research methodology
Record peaks and clean capacity additions lift spending
Electricity demand expansion across productive loads
Productive loads are lifting both energy sales and the firm capacity that utilities must contract. Energy requirement rose from about 1,276 BU in 2020-21 to about 1,694 BU in 2024-25, a 7.35% annual rate, and the record peak reached 270.8 GW on May 21, 2026, according to Power Line in July 2026. Growth is not smooth, because the International Energy Agency put 2025 demand growth at only 1.6% before forecasting 7% for 2026, in its Electricity Mid-Year Update 2026, as reported by Down To Earth. Planners still expect expansion, since the Central Electricity Authority mid-term review projects a 459 GW peak and 3,365 BU by 2035-36. As a result, Industrial buyers remain the anchor at 41.6% of 2025 value.
Accelerating non-fossil capacity build-out
Non-fossil additions are changing where new generation spending goes, even though coal still dominates output. India added a record 55.3 GW of non-fossil capacity in 2025-26, and the total reached 283 GW on March 31, 2026, including 150 GW of solar and 56 GW of wind, according to Enerdata citing the renewable energy ministry. Renewable sources excluding large hydro now hold 223.3 GW of the 532.7 GW in the Central Electricity Authority capacity table. Supply of photovoltaic modules feeds this pipeline, which the national plan extends to about 1,121 GW by 2035-36, including 509 GW of solar, according to Down To Earth.
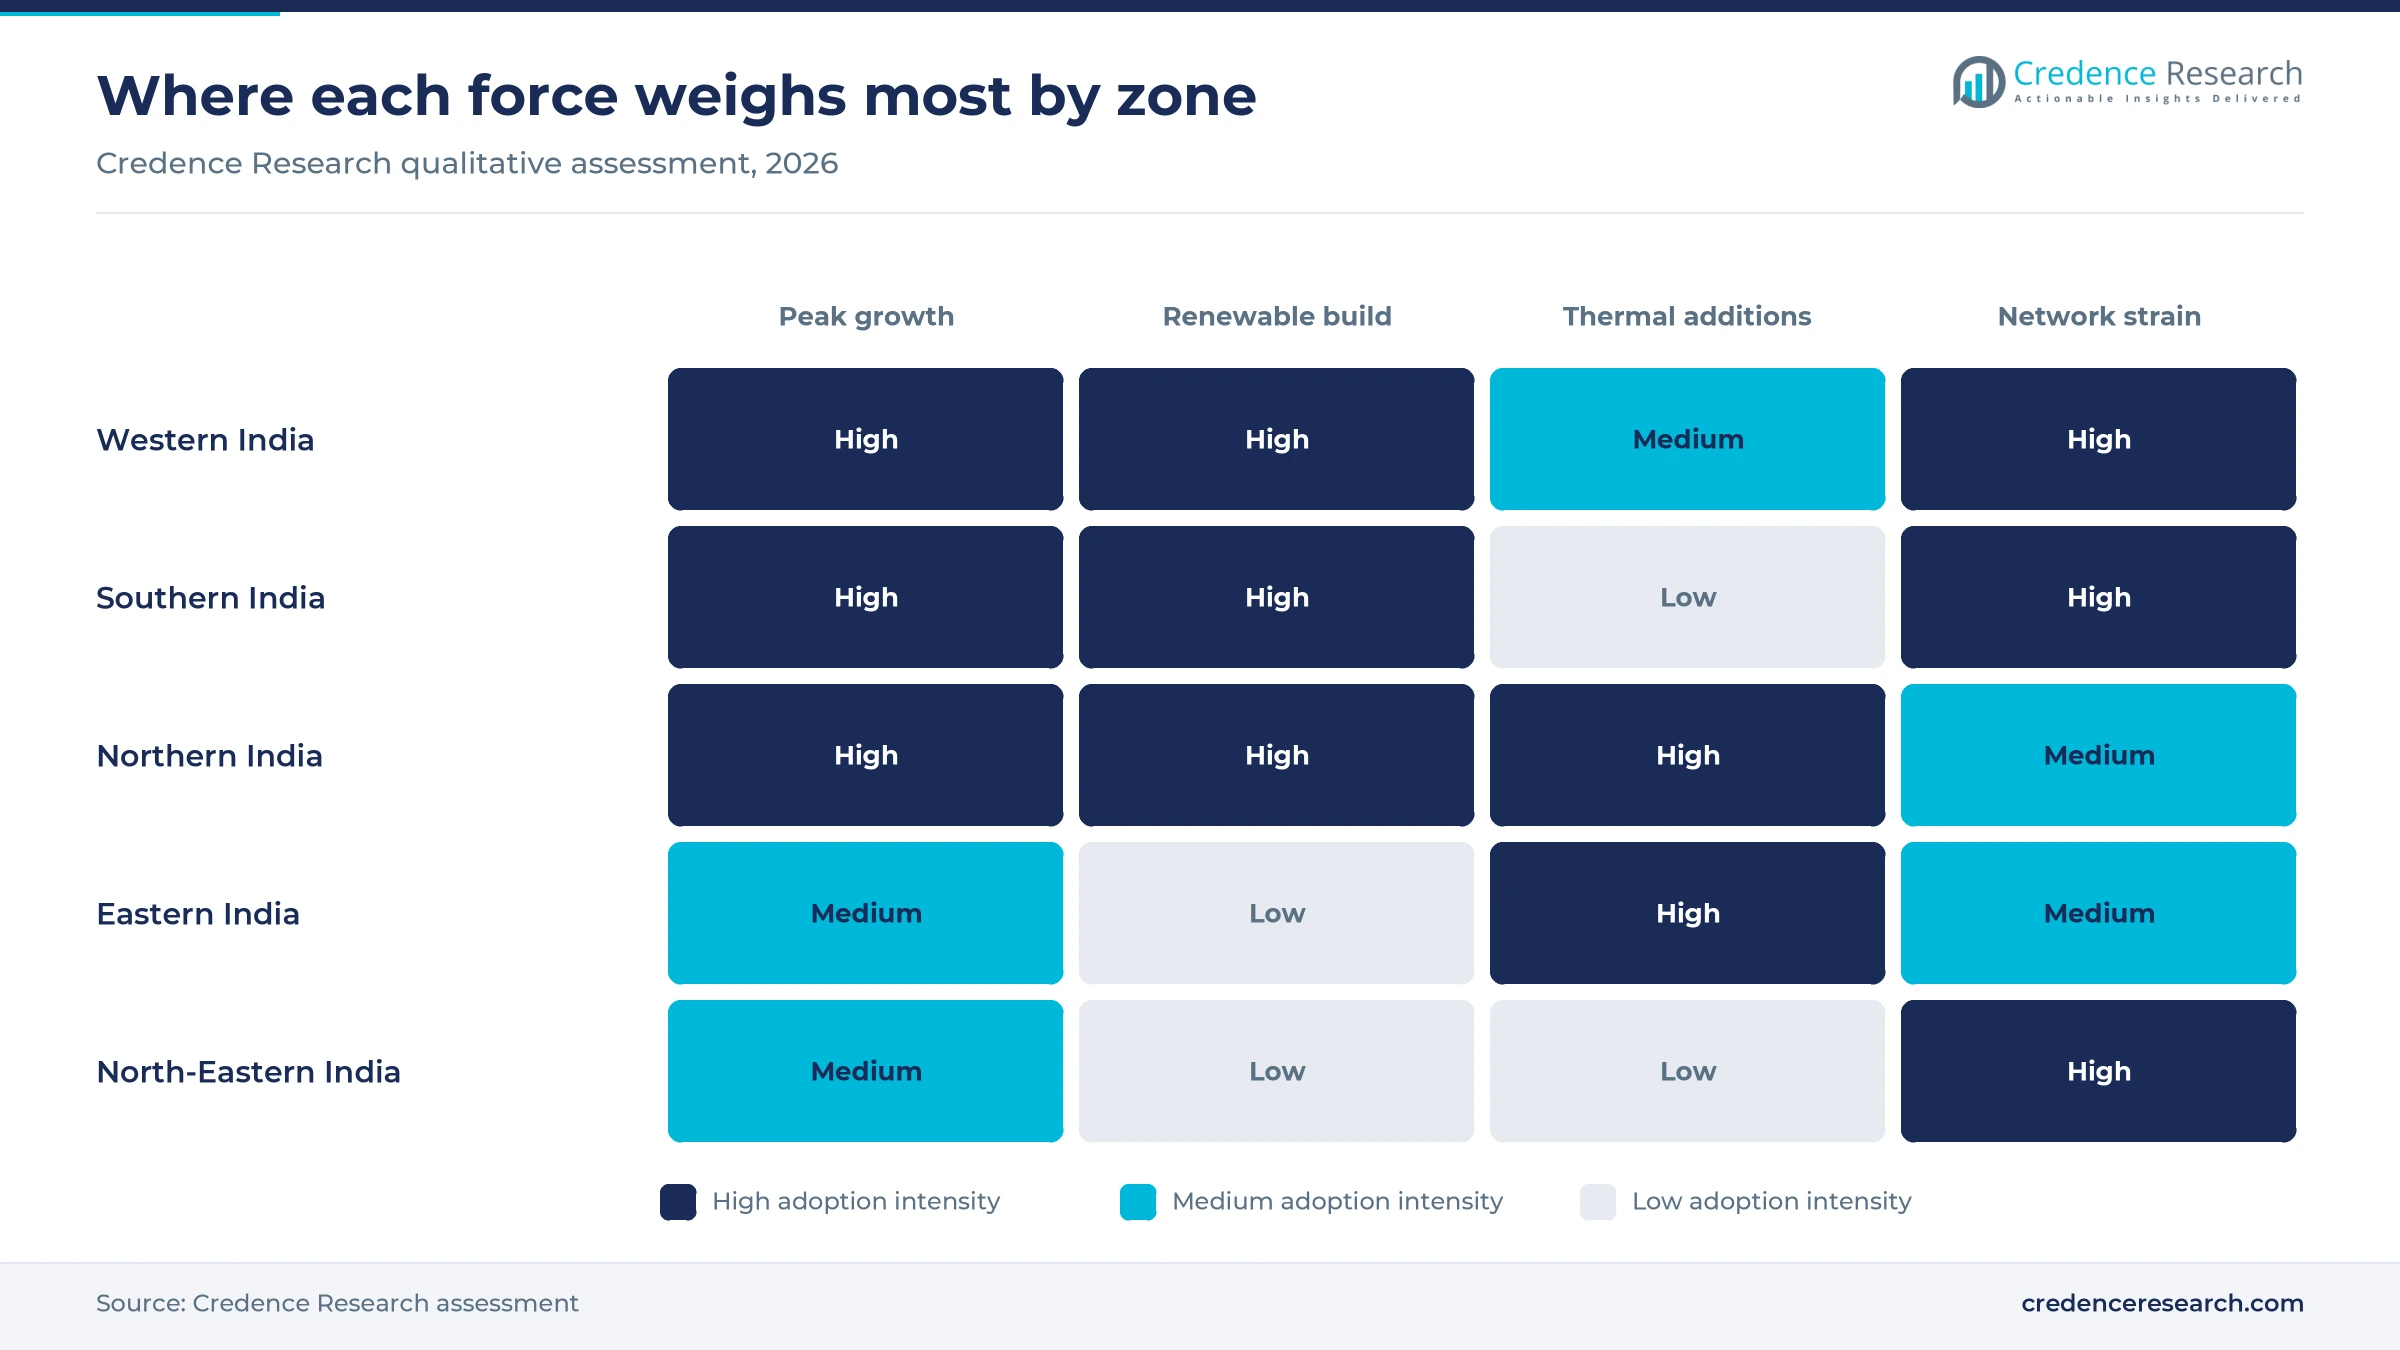
Distribution reform and digital metering
Reform of distribution utilities matters because they buy most of the electricity generated and their payments fund the rest of the chain. Total network losses fell from about 22% in 2015-16 to about 17% in 2024-25, according to the National Statistics Office in March 2026. Aggregate technical and commercial losses fell from 21.91% in 2020-21 to 15.04% in 2024-25, and the gap between supply cost and revenue narrowed from Rs 0.69 to Rs 0.06 per kWh, according to SolarQuarter in March 2026. About 59.7 million smart meters were installed nationally by then, including 45.5 million under the Revamped Distribution Sector Scheme launched in July 2021. Utilities also reported a combined profit of Rs 2,701 crore for 2024-25, according to Down To Earth.
New coal units secure firm evening supply
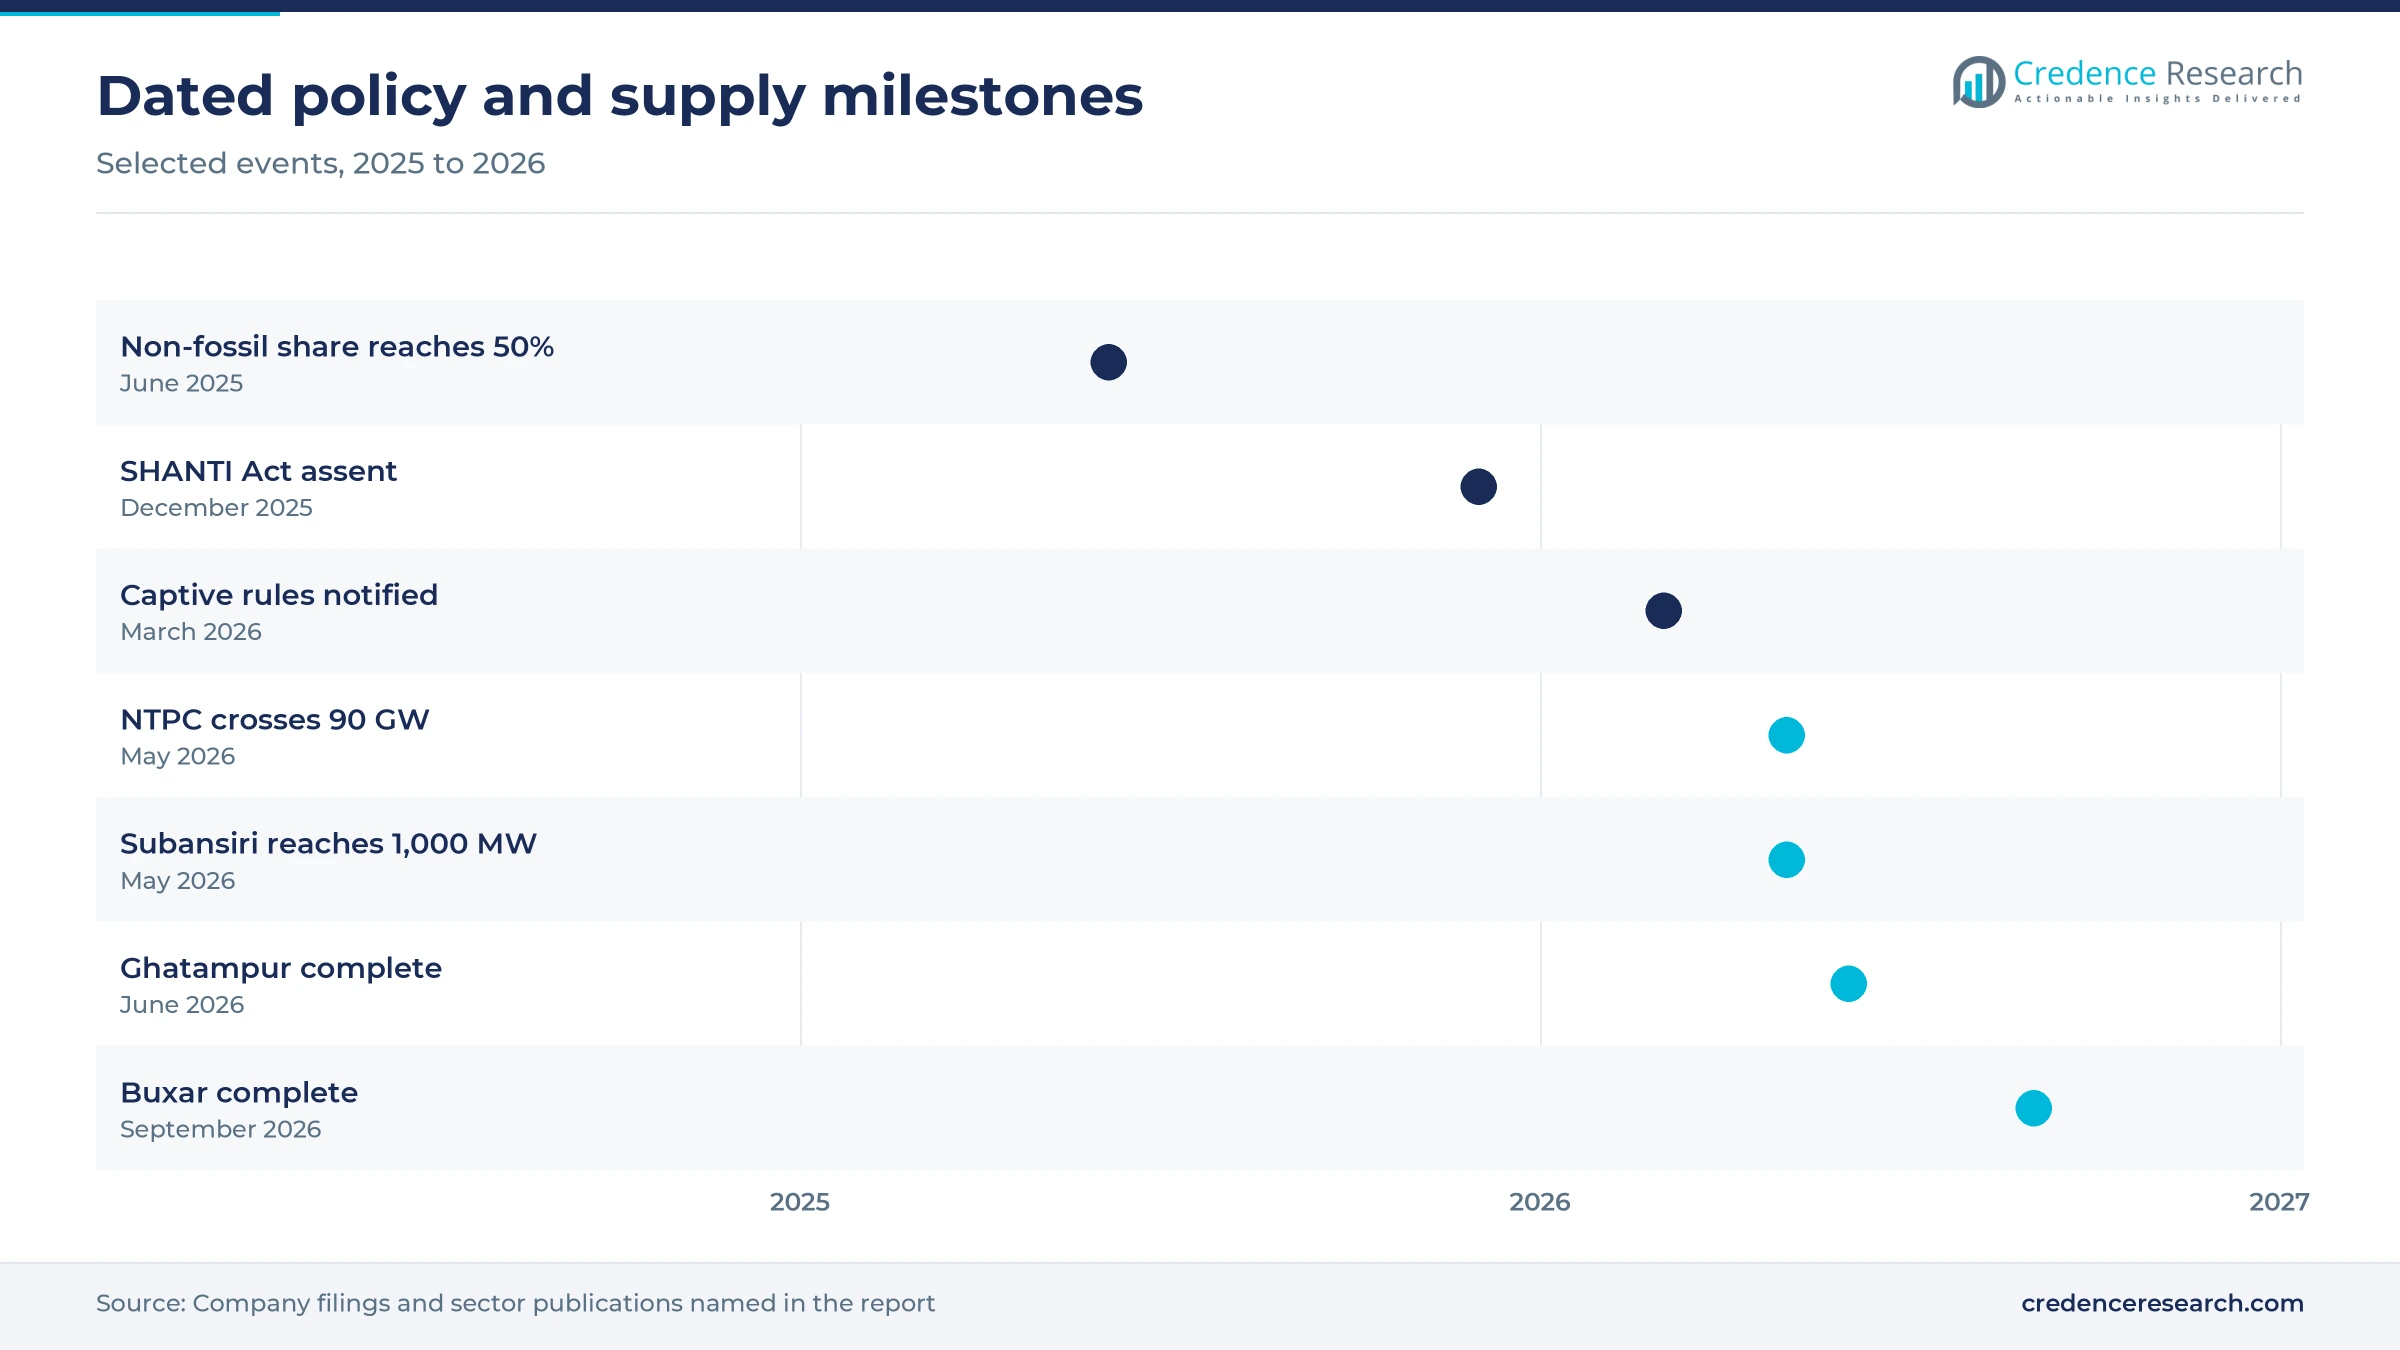
Long-term coal contracts are expanding again because solar output cannot serve the evening peak on its own. NTPC added a record 9.6 GW in 2025-26, has 32 GW under construction and targets 149 GW by 2032, according to Enerdata in April 2026. NLC India completed the 1,980 MW Ghatampur station in Uttar Pradesh when Unit 3 began commercial operation on June 13, 2026, according to Power Peak Digest. SJVN then commissioned the second 660 MW unit at Buxar in September 2026, with 85% of output allocated to Bihar, according to Power Line. Torrent Power also holds a September 2025 award for 1,600 MW under a 25-year agreement with Madhya Pradesh Power Management Company.
Exchange trading, storage and nuclear reshape supply
Shift toward real-time and green exchange trading
Procurement is moving closer to delivery as buyers manage solar swings through exchanges. The Indian Energy Exchange traded a record 141 BU in 2025-26, up 17%, according to Mercom India in April 2026. Its Real-Time Market grew fastest among core segments, up 41% to 54.85 BU, while its Green Market volume rose 23% to 10.78 BU. Prices also fell, with the day-ahead average down 13.7% to Rs 3.86 per kWh and the real-time average down 16% to Rs 3.59 per kWh. This pattern helps Distributed and Behind-the-Meter and open access buyers compare self-supply with spot prices, while utilities use the same markets to balance contracted positions. Exchange volume nevertheless remains a small part of the roughly 1,846 TWh generated that year.
Rise of contracted battery storage
Storage is emerging as a contracted grid resource, although awards are running well ahead of construction. Commissioned battery systems reached 9.6 GWh by August 2026, and utility-contracted projects made up only 1.3% of the roughly 54 GW awarded pipeline, according to the September 2026 IEEFA storage update. Tenders are also moving to longer durations, since four-hour systems made up about 87% of August 2026 tender capacity. National planning points to a much larger fleet, with about 174 GW and 888 GWh of storage in the base case for 2035-36, including 94 GW of pumped hydro, according to Down To Earth. This shift gradually lifts the value of peak and balancing supply.
Opportunity in private nuclear generation
The opening of nuclear generation gives private groups a route into firm, low-carbon supply for the first time. The SHANTI Act received presidential assent on Dec. 20, 2025, and permits private companies to participate in plant operations and power generation, according to World Nuclear News. Adani plans up to 10 GW by 2035, Tata Power is studying a 440 MW small reactor with the national nuclear operator, and JSW Energy targets its first plant by 2030. Agreements signed in Maharashtra in May 2026 cover 25.4 GW and Rs 6.5 trillion of projected investment. Installed nuclear capacity stands at only 8.8 GW against a national goal of 100 GW by 2047, which leaves wide room for developers.
Opportunity in rooftop and farm solar
Rooftop and farm systems offer an opening for installers, financiers and utilities that can aggregate small customers. PM Surya Ghar had benefited about 3.24 million households with 9.56 GW of rooftop capacity by March 2026, against a target of ten million households, according to PV Tech. Demand for grid-tied inverters follows this rollout across Gujarat, Maharashtra and other leading states. PM-KUSUM had reached 2.18 million farmers by December 2025, yet only 720.91 MW of its 10,000 MW sanctioned for farm-based solar plants was installed, according to SolarQuarter citing the Rajya Sabha. That gap of more than 9 GW marks the clearest unserved opening for developers that can finance small plants.
Curtailment, night peaks and utility dues restrain returns
Why are solar plants being curtailed?
Network capacity is lagging generation, and solar operators are absorbing the cost. India curtailed 2.3 TWh of solar output from May to December 2025, and the grid operator reportedly told some projects to cut up to 48% of daily generation, according to Down To Earth in February 2026. Transmission timelines may stretch from about two years to three, which leaves plants in Rajasthan, Gujarat, Maharashtra and Tamil Nadu on temporary access. The Central Electricity Authority chairperson pointed to about 100 GW of planned pumped storage as one remedy.
How serious is the night-time supply gap?
Evening hours carry the tightest supply, and buyers pay sharply higher prices when solar output fades. Night-hour market prices can reach the Rs 10 per unit cap, against about Rs 1.5 per unit in solar hours, according to Down To Earth in May 2026. Dispatchable plants ran at about 90% of available capacity on May 21, 2026, which left little reserve for outages during record demand. Utilities without firm contracts carry the highest exposure, and they are now seeking storage and new thermal supply.
Can utility finances hold after the recent profit?
The recent return to profit does not remove the structural weakness in state utilities. The Supreme Court on Aug. 6, 2025, directed states and union territories to clear more than Rs 1.5 trillion of long-pending dues to distribution companies within four years, according to Informist. Bar and Bench reported that regulatory assets cannot exceed 3% of annual revenue from now on, which limits how far tariff increases can be deferred. Generators selling to weak buyers therefore face payment risk, which tariff redesign and timely state budget support would reduce.
Are low battery tariffs viable for developers?
Aggressive storage bidding has created completion risk in a segment the grid increasingly needs. The lowest two-hour standalone tariff in 2025 was Rs 148,000 per MW per month against a Rs 230,000 benchmark, and nearly 75% of allocated two-hour capacity falls in an at-risk category, according to Business Today in May 2026. Delays of up to 18 months may persist as a result. Some correction is visible, since an August 2026 Gujarat tender cleared about 10.5% above a comparable February award, according to IEEFA.
Southern zone leads value as the northeast grows fastest
| Region | Value, 2025 (USD billion) | Share, 2025 | CAGR, 2026–2035 |
|---|---|---|---|
| Southern India | 45.54 | 32.3% | 6.96% |
| Northern India | 40.04 | 28.4% | 7.26% |
| Western India | 32.57 | 23.1% | 7.06% |
| Eastern India | 18.75 | 13.3% | 7.46% |
| North-Eastern India | 4.09 | 2.9% | 8.16% |
Southern India leads delivered value
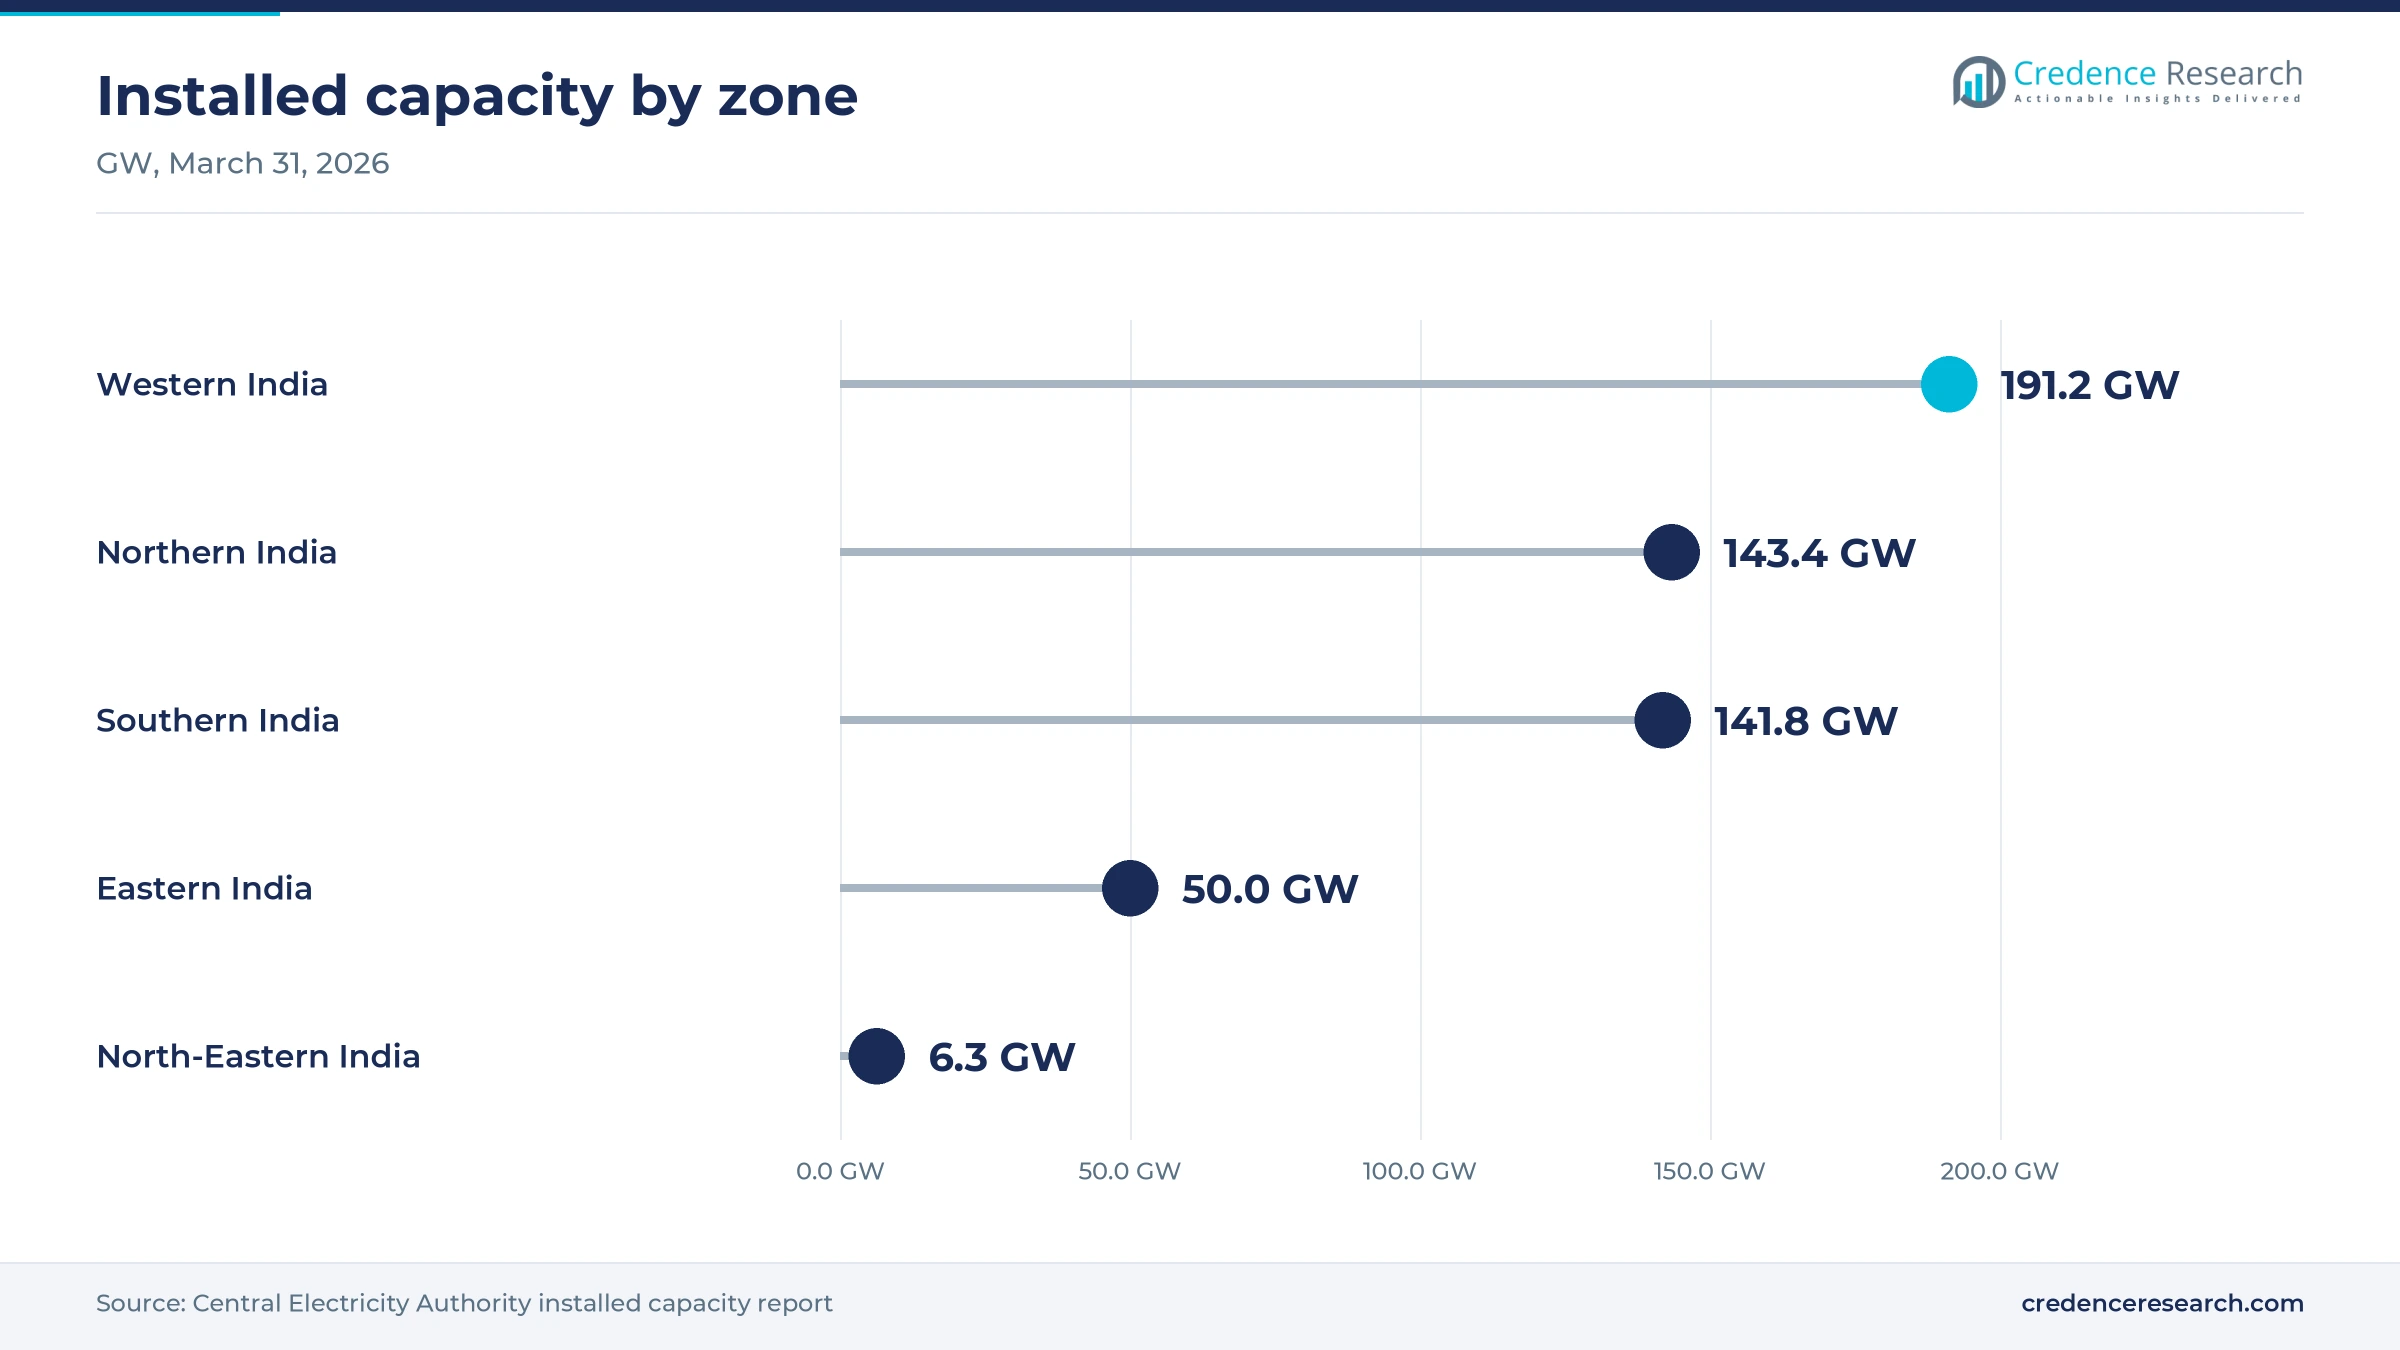
Southern India held 32.3% of 2025 value in the Credence Research regional model and grows at 6.96% a year, although the Central Electricity Authority recorded a 2025-26 energy requirement of 431 BU there, below Western India at 536 BU and Northern India at 512 BU. The zone had 141.8 GW installed on March 31, 2026, including 67.3 GW of private renewables, in the Central Electricity Authority table. Tamil Nadu set a 21,724 MW state demand peak in July 2026, according to Construction World, and its planners assess a need for about 13,581 MW of storage by 2034-35, according to DT Next.
Northern India adds coal for rising summer peaks
Northern India held 28.4% of 2025 value and grows at 7.26% a year as heat-driven load climbs in Uttar Pradesh and neighboring states. Uttar Pradesh set a state demand benchmark of 32,673 MW on June 24, 2026, according to Power Line, surpassing Maharashtra and Gujarat. The zone had 143.4 GW installed at the end of March 2026, and NLC India added further firm capacity through the completed 1,980 MW Ghatampur station that June.
Western India has the largest installed fleet
Western India held 23.1% of 2025 value and grows at 7.06% a year, with 191.2 GW installed on March 31, 2026, the largest zonal fleet in the Central Electricity Authority table. Gujarat and Maharashtra lead rooftop capacity at 6.67 GW and 5.22 GW, according to PV Tech. Adani Power also expanded in the zone by acquiring the 600 MW Butibori plant in Maharashtra in July 2025, while Tata Power runs the 4,000 MW Coastal Gujarat plant.
Eastern India relies on central coal stations
Eastern India held 13.3% of 2025 value and grows at 7.46% a year, with 50.0 GW installed, of which 26.2 GW is centrally owned coal capacity. Recent additions are large thermal units rather than renewables, since private renewables total only 2.4 GW in the zone. SJVN completed the 1,320 MW Buxar station in Bihar in September 2026, and an NTPC subsidiary added an 800 MW unit at Patratu in Jharkhand in May 2026.
North-Eastern India gains from Subansiri hydro units
North-Eastern India held 2.9% of 2025 value and grows fastest at 8.16% a year from a small base of 6.3 GW installed. NHPC brought the fourth 250 MW Subansiri Lower unit into commercial operation on May 8, 2026, reaching 1,000 MW of the planned 2,000 MW, according to Water Power Magazine. Network losses remain a concern, because the zone recorded the highest regional rate at 20.1% in 2023-24, according to the Central Electricity Authority general review.
Large coal, hydro and nuclear decisions set the pipeline
| Development | Status and market relevance |
|---|---|
| In March 2026, the Ministry of Power notified the Electricity (Amendment) Rules, 2026, widening who qualifies as a captive user. | In force from March 13, 2026, with individual consumption caps from April 1, 2026; supports consumer-owned plants. |
| In May 2026, NTPC Group crossed 90 GW of installed capacity after adding an 800 MW Patratu unit. | Group capacity stood at 90,668 MW; confirms the largest generator is still adding coal alongside renewables. |
| In May 2026, NHPC began commercial operation of Unit 4 at the 2,000 MW Subansiri Lower hydro project. | Operating capacity reached 1,000 MW; adds firm hydro supply for the northeastern grid. |
| In June 2026, NLC India brought Unit 3 of the Ghatampur station in Uttar Pradesh into commercial operation. | Completes the 1,980 MW plant; adds baseload supply for the northern grid. |
| In September 2026, SJVN commissioned Unit 2 of its Buxar thermal project in Bihar. | Completes the 1,320 MW station, with 85% of output allocated to Bihar under a long-term agreement. |
Storage, metering and flexible plants change grid operations
- Four-hour battery systems now dominate storage tendering and made up about 87% of August 2026 tender capacity, which shifts batteries from short balancing toward evening supply.
- Smart prepaid metering reached about 59.7 million installed units by March 2026, and the Ministry of Power credits metering for part of the fall in losses.
- Flexible coal operation remains limited by the 55% minimum technical load, so coal units struggle to ramp down when solar output is high.
- Small modular reactors are entering planning through a 440 MW Tata Power study with the national nuclear operator, which could place firm supply closer to industrial loads.
Need a Custom Version of This Report?
Tailor the scope, geography, or segments to your exact requirements.
- Custom geography or segment scope
- Direct access to our analyst team
Public generators face private portfolios in every segment
Competition differs across the chain, because generation is national while distribution licenses remain regional. In generation, NTPC holds the largest fleet, with more than 90 GW, while Adani Power is expanding through acquisitions such as Butibori and targets 30,670 MW. JSW Energy has followed a similar route by winning the insolvency process for the 3.6 GW KSK Mahanadi plant in Chhattisgarh. Public developers NHPC, SJVN and NLC India are completing Subansiri Lower, Buxar and Ghatampur respectively. In distribution, the field is narrow, so CESC grew by acquiring the Chandigarh utility in February 2025, alongside its Noida and Rajasthan operations. Firm-supply bids are also getting cheaper, as a 1,500 MW Solar Energy Corporation of India tender set a record low of Rs 5.99 per kWh, according to IEEFA.
Companies profiled and their roles in this market
| Company | Type | Role in the market |
|---|---|---|
| NTPC Limited | Central public sector generator | Largest fleet at 90,668 MW in May 2026; 32 GW under construction; nuclear site studies under way |
| Adani Power Limited | Private thermal generator | Acquired the 600 MW Butibori plant in July 2025; targets 30,670 MW by 2030; part of Maharashtra nuclear agreements in May 2026 |
| Tata Power Company Limited | Private generator | Coastal Gujarat 4,000 MW plant under Section 11 directions from April 2026; studying a 440 MW small reactor |
| JSW Energy Limited | Private generator | Selected for the 3.6 GW KSK Mahanadi plant in January 2025; plans a first nuclear plant by 2030 |
| NHPC Limited | Central hydro developer | Subansiri Lower reached 1,000 MW of 2,000 MW in May 2026 |
| NLC India Limited | Central lignite and coal generator | Completed the 1,980 MW Ghatampur station in June 2026 |
| SJVN Limited | Central hydro and thermal developer | Completed the 1,320 MW Buxar station in September 2026 |
| Torrent Power Limited | Private generator | Holds a 1,600 MW award in Madhya Pradesh under a 25-year agreement, reported September 2025 |
| CESC Limited | Private distributor and generator | Acquired the Chandigarh utility in February 2025; building 3.2 GW of hybrid projects through Purvah Green Power |
| Reliance Power Limited | Private generator and storage bidder | Bid in a June 2024 Solar Energy Corporation of India battery tender that was later cancelled, and a related bidding bar was withdrawn on Dec. 3, 2024 |
Evening reliability will decide which assets earn most
Credence Research's view is that the India power market will reward firm evening supply more than headline capacity through 2035. Solar additions have pushed daytime prices down, and exchange averages fell in 2025-26, while night-hour prices still reach the cap. Coal units, pumped storage and four-hour batteries therefore hold the strongest pricing position, provided the buyer can pay. Utility health remains the main variable, because more than Rs 1.5 trillion of court-ordered dues must clear within four years. Investors should compare contract terms and buyer quality first, then treat capacity growth as a secondary measure of a project's value.
How the Credence Research estimates were built
The report uses 2025 as the base year, 2026 as the first forecast year and 2035 as the final year. Market values come from the Credence Research model, and a top-down check compared them with electricity sold, average supply cost and captive output. Regional and segment shares and growth rates are Credence Research estimates informed by public data. Sources include Central Electricity Authority capacity tables and reviews, the National Statistics Office, company filings and exchange statements, and sector publications named in the text. No interviews or surveys were conducted for this edition of the report.
Generation doubles in value while the fuel mix shifts
The India power market is expected to expand from USD 151.00 billion in 2026 to USD 281.66 billion by 2035, at a 7.17% CAGR during 2026–2035. The national plan points to about 1,121 GW of capacity and a 459 GW peak by 2035-36, with non-fossil sources near 70% of capacity and coal still delivering about half of generation. Southern India should stay the largest zone, while North-Eastern India grows fastest from a small base. Further progress depends on transmission delivery, storage completion and the ability of state utilities to clear regulatory assets on schedule.
Frequently Asked Questions
How big is the India power market?
What is the growth rate of the market?
Which energy source leads the market?
Which zone holds the largest share?
What was the highest recorded peak demand?
How much non-fossil capacity has India installed?
What are the main challenges for the market?
Who are the leading companies in the market?
Table of Content
Chapter 1 Market Segmentation
- 1.1 Segmentation Framework
- 1.1.1 Product and Service Classification
- 1.1.2 Application and End-Use Classification
- 1.1.3 Technology and Solution Classification
- 1.1.4 Customer and Distribution Channel Classification
- 1.1.5 Geographic Segmentation
- 1.1.6 Market Segment Definitions and Boundaries
- 1.2 By Energy Source
- 1.2.1 Coal and Lignite
- 1.2.2 Gas and Liquid Fuel
- 1.2.3 Hydro and Pumped Storage
- 1.2.4 Nuclear Power
- 1.2.5 Solar, Wind and Other Renewables
- 1.3 By Application
- 1.3.1 Baseload Supply
- 1.3.2 Peak and Balancing
- 1.3.3 Captive and Open Access
- 1.3.4 Distributed and Behind-the-Meter
- 1.4 By End User
- 1.4.1 Industrial
- 1.4.2 Residential
- 1.4.3 Commercial and Services
- 1.4.4 Agriculture
- 1.4.5 Railways and Public Infrastructure
- 1.5 By Ownership Model
- 1.5.1 Central Public Sector
- 1.5.2 State Utilities
- 1.5.3 Private Independent Power Producers
- 1.5.4 Municipal and Cooperative
- 1.5.5 Consumer-Owned
Chapter 2 Introduction
- 2.1 Report Objectives and Scope
- 2.2 Product Definition and Industry Terminology
- 2.3 Market Inclusions and Exclusions
- 2.4 Research Process
- 2.4.1 Primary Research and Expert Interviews
- 2.4.2 Secondary Research and Source Review
- 2.4.3 Top-Down and Bottom-Up Estimation
- 2.4.4 Data Triangulation and Verification
- 2.5 Market Size Measurement Basis
- 2.5.1 2025: USD 140.99 billion → 2035: USD 281.66 billion
- 2.6 Historical and Forecast Reference Periods
- 2.6.1 Historical Period: 2018-2025
- 2.6.2 Base Year: 2025
- 2.6.3 Forecast Period: 2025-2035
- 2.7 Research Assumptions and Limitations
Chapter 3 Executive Summary
- 3.1 Market Snapshot and Key Findings
- 3.2 Base-Year Market Size, 2025
- 3.3 Forecast Market Size, 2035
- 3.4 Revenue and Volume Growth Outlook
- 3.5 Key Demand and Supply Indicators
- 3.6 Leading Market Segments
- 3.7 Fastest-Growing Market Opportunities
- 3.8 Regional Performance Highlights
- 3.9 Technology and Industry Transformation
- 3.10 Competitive Landscape Summary
- 3.11 Analyst View and Strategic Implications
Chapter 4 India Power Market Trends and Developments
- 4.1 Historical Industry Development, 2018-2025
- 4.2 Recent Market Trends and Developments
- 4.3 Demand and Customer Behavior Trends
- 4.4 Technology and Product Innovation
- 4.5 Artificial Intelligence, Automation and Digitalization
- 4.6 Local Manufacturing and Supply Chain Realignment
- 4.7 Industry Partnerships, Mergers and Acquisitions
- 4.8 Sustainability and Circular Economy Developments
- 4.9 Government and Private Sector Investment Trends
- 4.10 Emerging Business Models and Commercialization
- 4.11 Industry Developments and Announcements
Chapter 5 India Power Market Production, Supply and Demand Analysis
- 5.1 Demand Trend and Consumption Analysis, 2018-2025
- 5.2 Demand Forecast, 2025-2035
- 5.3 Production and Output Trend, 2018-2025
- 5.4 Production and Output Forecast, 2025-2035
- 5.5 Installed Capacity and Capacity Utilization
- 5.6 Company-Wise Production Plants and Statistics
- 5.6.1 Installed Production Capacity
- 5.6.2 Actual Production
- 5.6.3 Planned Capacity and Expansion Targets
- 5.7 Supply Chain Structure and Procurement Trends
- 5.8 Supply-Demand Gap and Bottlenecks
- 5.9 Import Dependence and Sourcing Structure
- 5.10 Contract Manufacturing and Outsourcing
- 5.11 Regional Supply and Demand Concentration
Chapter 6 India Power Market Pricing Analysis
- 6.1 Pricing Structure and Measurement
- 6.2 Historical Pricing Trends, 2018-2025
- 6.3 Pricing Outlook, 2025-2035
- 6.4 Average Selling Price and Unit Economics
- 6.5 Pricing by Product and Market Segment
- 6.6 Geographic Pricing Differences
- 6.7 Key Input, Energy, Labor and Logistics Costs
- 6.8 Contract Pricing and Purchasing Models
- 6.9 Pricing Sensitivity and Competitive Positioning
- 6.10 Price, Margin and Profitability Implications
Chapter 7 India Power Market Dynamics
- 7.1 Market Growth Drivers
- 7.1.1 Demand-Side Drivers
- 7.1.2 Technology and Innovation Drivers
- 7.1.3 Infrastructure and Investment Drivers
- 7.1.4 Regulatory and Policy Drivers
- 7.2 Market Restraints
- 7.2.1 Cost and Affordability Constraints
- 7.2.2 Technology and Adoption Barriers
- 7.2.3 Supply Chain and Operational Constraints
- 7.3 Market Challenges
- 7.3.1 Competitive Pressure and Margin Erosion
- 7.3.2 Skills, Infrastructure and Implementation Gaps
- 7.4 Emerging Market Opportunities
- 7.5 Market Dynamics Impact and Time-Horizon Assessment
Chapter 8 India Power Value Chain Analysis
- 8.1 Industry Value Chain Overview
- 8.2 Upstream Suppliers and Critical Inputs
- 8.3 Technology and Component Providers
- 8.4 Manufacturing or Service Delivery
- 8.5 Distribution, Channel Partners and Integrators
- 8.6 Downstream Applications and End Users
- 8.7 Value Addition and Profit Pools
- 8.8 Vertical Integration and Outsourcing
- 8.9 Supplier Concentration and Risk
- 8.10 Supply Chain Localization and Resilience
Chapter 9 India Power Market Regulations and Policies
- 9.1 Relevant Laws, Standards and Compliance Frameworks
- 9.2 Product, Service, Safety and Quality Requirements
- 9.3 Government Policies, Incentives and Subsidies
- 9.4 Imports, Exports and Trade Barriers
- 9.5 Public Procurement and Local Content Requirements
- 9.6 Environmental and Sustainability Compliance
- 9.7 Upcoming Policy Changes and Market Implications
Chapter 10 India Power Market Hotspots and Opportunities
- 10.1 Market Opportunity Mapping and Growth Hotspots
- 10.2 High-Growth Applications and Customer Groups
- 10.3 Underserved Markets and White-Space Opportunities
- 10.4 Emerging Technology and Product Opportunities
- 10.5 New Capacity and Investment Hotspots
- 10.6 Market Entry and Expansion Opportunities
- 10.7 Distribution and Partnership Opportunities
- 10.8 Near-Term and Long-Term Commercial Potential
- 10.9 Opportunity Attractiveness and Execution Risks
Chapter 11 India Power Market Outlook, 2025-2035
- 11.1 Market Size and Analysis
- 11.1.1 Revenue (Market Measurement: 2025: USD 140.99 billion → 2035: USD 281.66 billion)
- 11.1.2 Market Volume and Quantity Sold
- 11.1.3 Historical Market Size, 2018-2025
- 11.1.4 Base-Year Market Size, 2025
- 11.2 Market Forecast, 2025-2035
- 11.2.1 Revenue Forecast to 2035
- 11.2.2 Volume Forecast to 2035
- 11.2.3 CAGR and Year-on-Year Growth
- 11.2.4 Incremental Revenue Opportunity
- 11.3 Forecast Assumptions and Scenario Analysis
- 11.3.1 Base-Case Forecast
- 11.3.2 Optimistic and Conservative Scenarios
- 11.3.3 Technology, Pricing and Policy Sensitivities
- 11.4 Market Attractiveness and Growth Outlook
Chapter 12 India Power Market Segmentation and Outlook
- 12.1 Segmentation Summary and Market Shares, 2025
- 12.2 Largest and Fastest-Growing Segments
- 12.3 By Energy Source - Market Size and Forecast, 2025-2035
- 12.3.1 Segment Definition and Scope
- 12.3.2 Historical Market Size, 2018-2025
- 12.3.3 Revenue Forecast, 2025-2035
- 12.3.4 Volume Forecast, 2025-2035
- 12.3.5 Base-Year Market Share, 2025
- 12.3.6 Segment CAGR and Growth Drivers
- 12.3.7 Subsegment Market Size and Forecast
- 12.3.7.1 Coal and Lignite
- 12.3.7.2 Gas and Liquid Fuel
- 12.3.7.3 Hydro and Pumped Storage
- 12.3.7.4 Nuclear Power
- 12.3.7.5 Solar, Wind and Other Renewables
- 12.3.8 Subsegment Pricing and Adoption Trends
- 12.3.9 Leading Suppliers and Competition
- 12.3.10 Regional Demand and Opportunities
- 12.4 By Application - Market Size and Forecast, 2025-2035
- 12.4.1 Segment Definition and Scope
- 12.4.2 Historical Market Size, 2018-2025
- 12.4.3 Revenue Forecast, 2025-2035
- 12.4.4 Volume Forecast, 2025-2035
- 12.4.5 Base-Year Market Share, 2025
- 12.4.6 Segment CAGR and Growth Drivers
- 12.4.7 Subsegment Market Size and Forecast
- 12.4.7.1 Baseload Supply
- 12.4.7.2 Peak and Balancing
- 12.4.7.3 Captive and Open Access
- 12.4.7.4 Distributed and Behind-the-Meter
- 12.4.8 Subsegment Pricing and Adoption Trends
- 12.4.9 Leading Suppliers and Competition
- 12.4.10 Regional Demand and Opportunities
- 12.5 By End User - Market Size and Forecast, 2025-2035
- 12.5.1 Segment Definition and Scope
- 12.5.2 Historical Market Size, 2018-2025
- 12.5.3 Revenue Forecast, 2025-2035
- 12.5.4 Volume Forecast, 2025-2035
- 12.5.5 Base-Year Market Share, 2025
- 12.5.6 Segment CAGR and Growth Drivers
- 12.5.7 Subsegment Market Size and Forecast
- 12.5.7.1 Industrial
- 12.5.7.2 Residential
- 12.5.7.3 Commercial and Services
- 12.5.7.4 Agriculture
- 12.5.7.5 Railways and Public Infrastructure
- 12.5.8 Subsegment Pricing and Adoption Trends
- 12.5.9 Leading Suppliers and Competition
- 12.5.10 Regional Demand and Opportunities
- 12.6 By Ownership Model - Market Size and Forecast, 2025-2035
- 12.6.1 Segment Definition and Scope
- 12.6.2 Historical Market Size, 2018-2025
- 12.6.3 Revenue Forecast, 2025-2035
- 12.6.4 Volume Forecast, 2025-2035
- 12.6.5 Base-Year Market Share, 2025
- 12.6.6 Segment CAGR and Growth Drivers
- 12.6.7 Subsegment Market Size and Forecast
- 12.6.7.1 Central Public Sector
- 12.6.7.2 State Utilities
- 12.6.7.3 Private Independent Power Producers
- 12.6.7.4 Municipal and Cooperative
- 12.6.7.5 Consumer-Owned
- 12.6.8 Subsegment Pricing and Adoption Trends
- 12.6.9 Leading Suppliers and Competition
- 12.6.10 Regional Demand and Opportunities
- 12.7 Segment Growth Comparison
- 12.8 Segment Attractiveness and Priority Matrix
Chapter 13 India Power End-Use and Application Market Outlook
- 13.1 End-Use Industry and Customer Demand Structure
- 13.2 Leading Applications and Customer Groups
- 13.3 End-Use Market Size, Share and Forecast
- 13.4 Major End-Use Industry Deep Dives
- 13.4.1 Customer Requirements and Use Cases
- 13.4.2 Demand and Replacement Cycles
- 13.4.3 Technical and Regulatory Considerations
- 13.4.4 Purchasing and Procurement Models
- 13.4.5 Leading Vendors and Distribution Channels
- 13.4.6 Forecast and Commercial Opportunities
- 13.5 Emerging Applications and Cross-Segment Demand
- 13.6 End-Use Industry Investment Priorities
Chapter 14 India Power Geographic Market Outlook, 2025-2035
- 14.1 Domestic Market Distribution and Demand Clusters
- 14.2 State- or Province-Wise Market Size and Forecast, 2025-2035
- 14.3 City and Metropolitan Market Outlook
- 14.4 Industrial, Manufacturing and Commercial Clusters
- 14.5 Geographic Concentration of Key End Users
- 14.6 Local Pricing and Purchasing Differences
- 14.7 Domestic Production Facilities and Capacity Map
- 14.8 Local Infrastructure and Project Pipeline
- 14.9 State-Level Policy and Incentive Differences
- 14.10 Subnational Investment Hotspots and Opportunities
- 14.11 Distribution and Logistics Networks
- 14.12 Domestic Competitive Footprint
Chapter 15 India Power Technology, Innovation and Sustainability Outlook
- 15.1 Technology Landscape and Maturity
- 15.2 Product, Process and Service Innovation
- 15.3 AI, Automation and Digital Tools in the Industry
- 15.4 Technology Adoption and Performance Benchmarking
- 15.5 Innovation Pipeline and R&D Investment
- 15.6 Patent and Intellectual Property Trends
- 15.7 Energy Efficiency and Resource Management
- 15.8 Sustainability, Recycling and Circularity
- 15.9 Technology Roadmap, 2025-2035
- 15.10 Risks of Obsolescence and Technology Substitution
Chapter 16 India Power Market Key Strategic Imperatives
- 16.1 Growth and Market Entry Priorities
- 16.2 High-Return Products and Segments
- 16.3 Pricing, Profitability and Cost Optimization
- 16.4 Technology Investment and Product Differentiation
- 16.5 Supply Chain Localization and Resilience
- 16.6 Distribution and Customer Acquisition
- 16.7 Partnership, Acquisition and Capacity Strategy
- 16.8 Regional Expansion Priorities
- 16.9 Short-, Medium- and Long-Term Actions
Chapter 17 Competition Outlook
- 17.1 Industry Competition Characteristics
- 17.2 Market Structure and Concentration
- 17.3 Market Share and Competitive Positioning, 2025
- 17.4 Company-Wise Revenue and Product Benchmarking
- 17.5 Production and Service Capacity Benchmarking
- 17.6 Technology, Pricing and Differentiation
- 17.7 Regional Footprint and Distribution Strength
- 17.8 Mergers, Acquisitions and Strategic Alliances
- 17.9 New Entrants and Competitive Threats
- 17.10 Porter's Five Forces and Industry Attractiveness
- 17.11 Competitive Outlook, 2025-2035
Chapter 18 Company Profiles
- 18.1 Company Coverage and Selection Criteria
- 18.2 NTPC Limited
- 18.2.1 Business Description
- 18.2.2 Company Ownership and Geographic Presence
- 18.2.3 Product and Service Portfolio
- 18.2.4 Manufacturing and Operating Footprint
- 18.2.5 Production Capacity and Expansion Plans
- 18.2.6 Financial Performance and Investment
- 18.2.7 Market Share and Competitive Position
- 18.2.8 Technology and Innovation Capabilities
- 18.2.9 Strategic Alliances or Partnerships
- 18.2.10 Recent Developments
- 18.2.11 Growth Strategy and Outlook
- 18.3 Adani Power Limited
- 18.4 Tata Power Company Limited
- 18.5 JSW Energy Limited
- 18.6 NHPC Limited
- 18.7 NLC India Limited
- 18.8 SJVN Limited
- 18.9 Torrent Power Limited
- 18.10 CESC Limited
- 18.11 Reliance Power Limited
- 18.12 Other Relevant Market Participants
Note: Every listed company is profiled on the structure shown under the first company. The company list is preliminary and may change based on research findings, market developments, data availability and client requirements.
Chapter 19 Disclaimer
- 19.1 Research and Forecast Disclaimer
- 19.2 Data Source and Estimation Limitations
Note: The depth of individual sections depends on data availability for this market. Volume, capacity, trade and other unit-based metrics are included where applicable.

