
A sanctioned 203 million meter base sets the work program
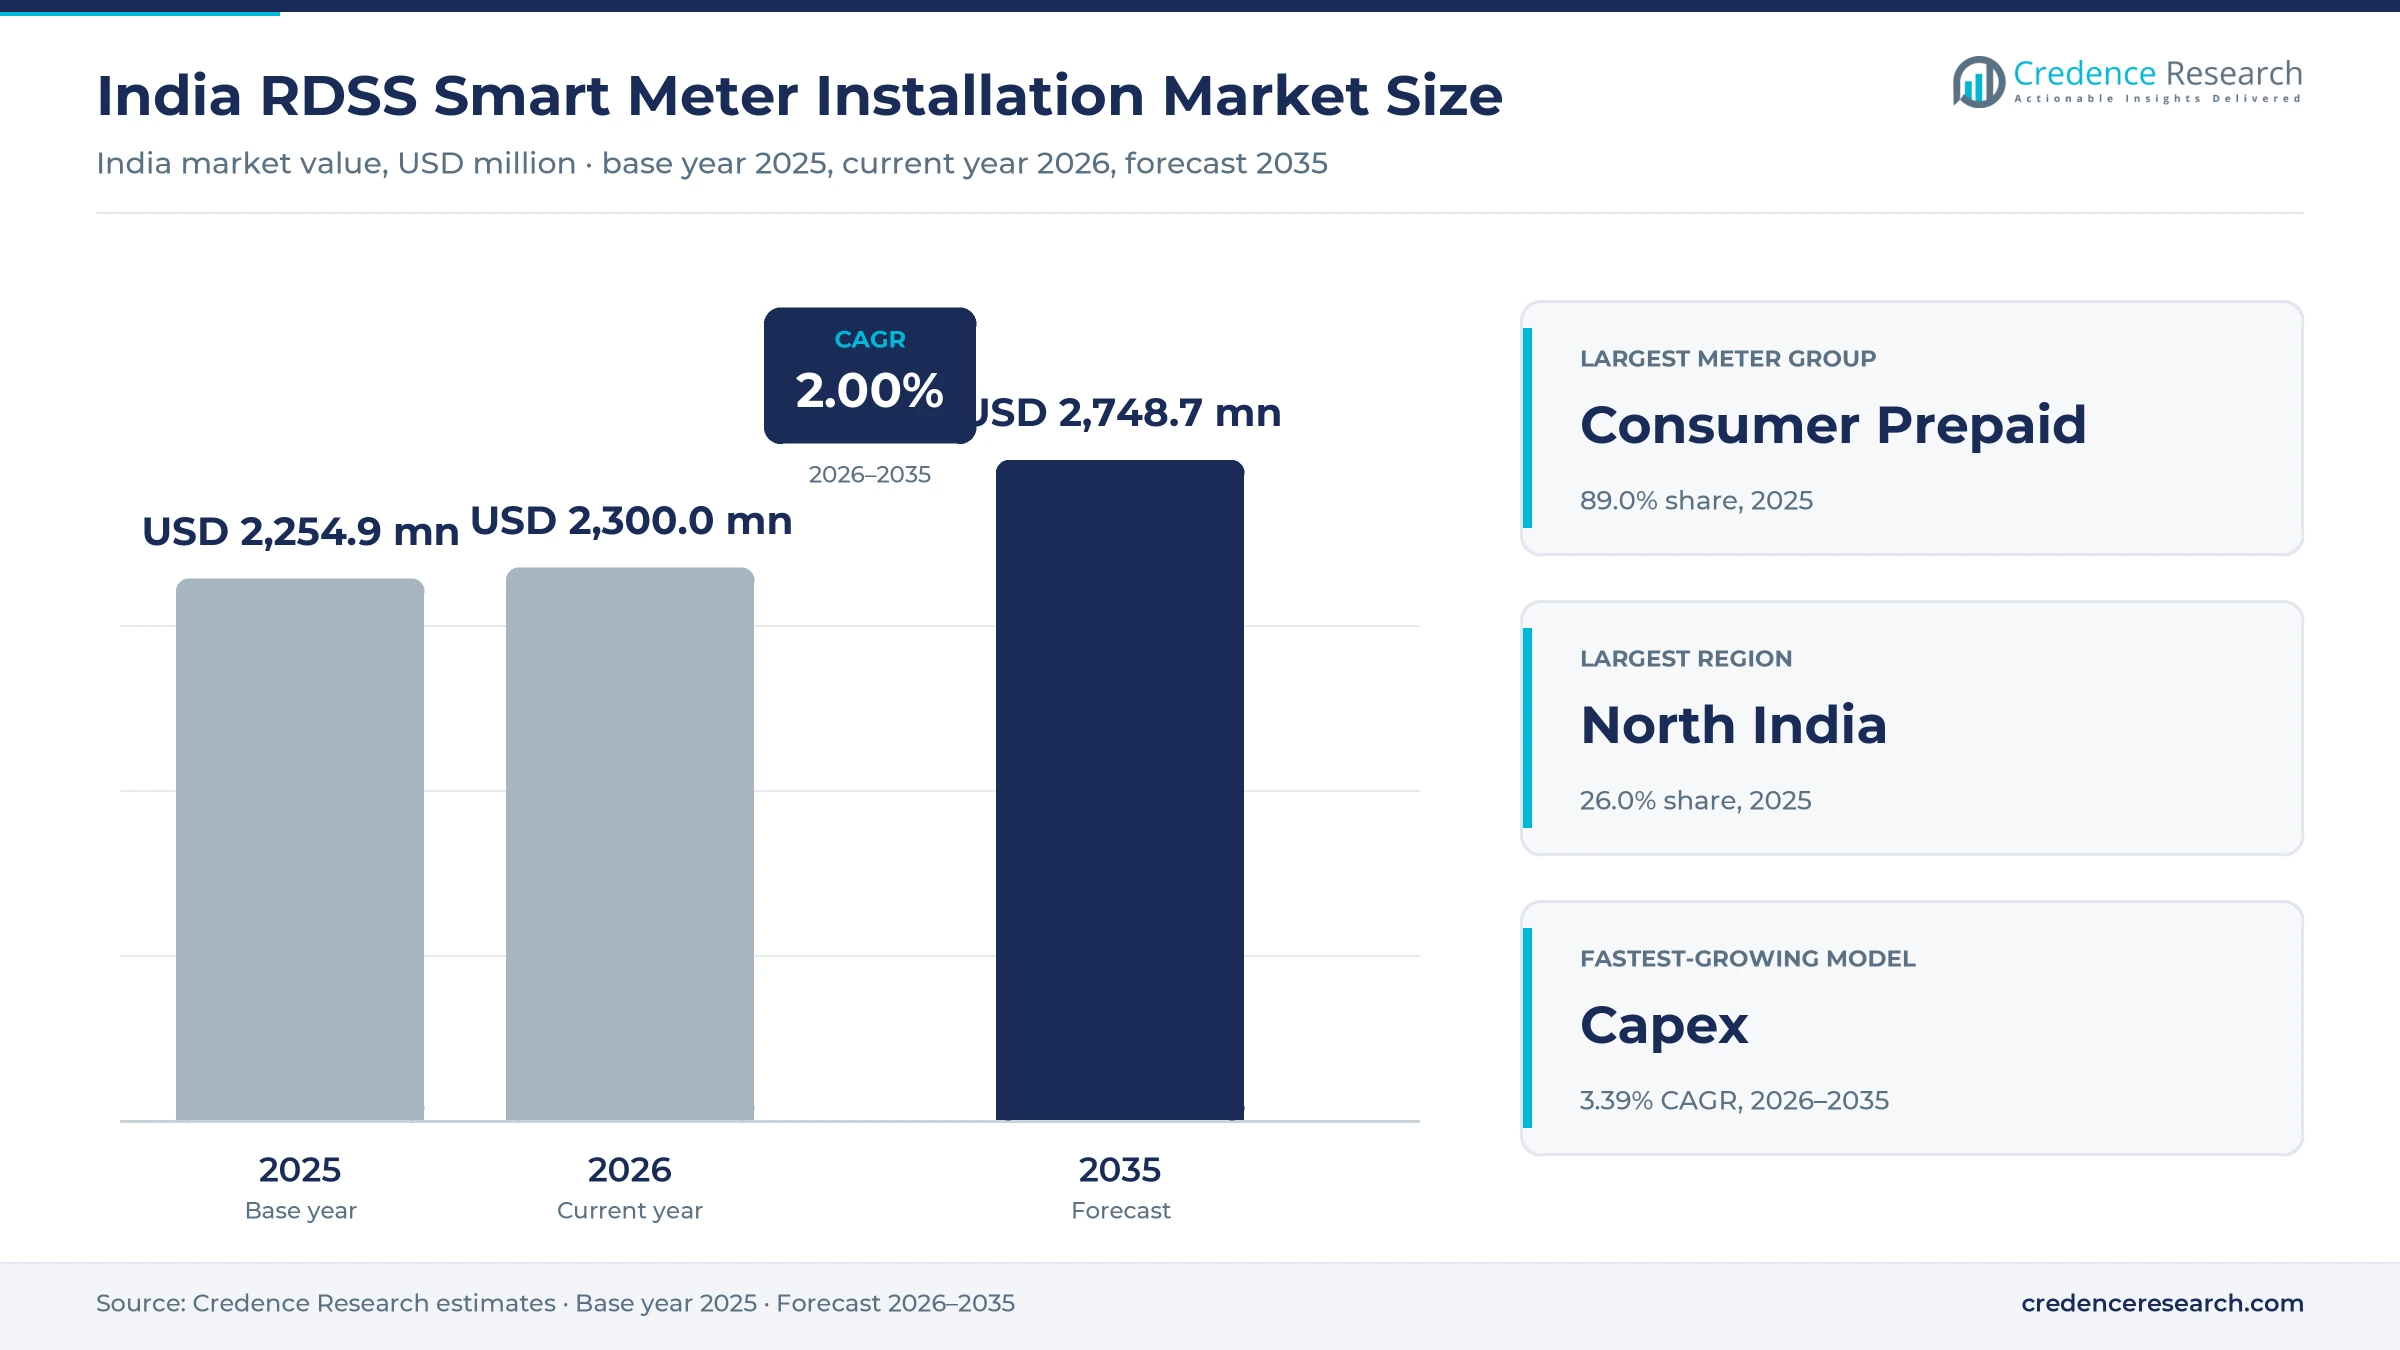
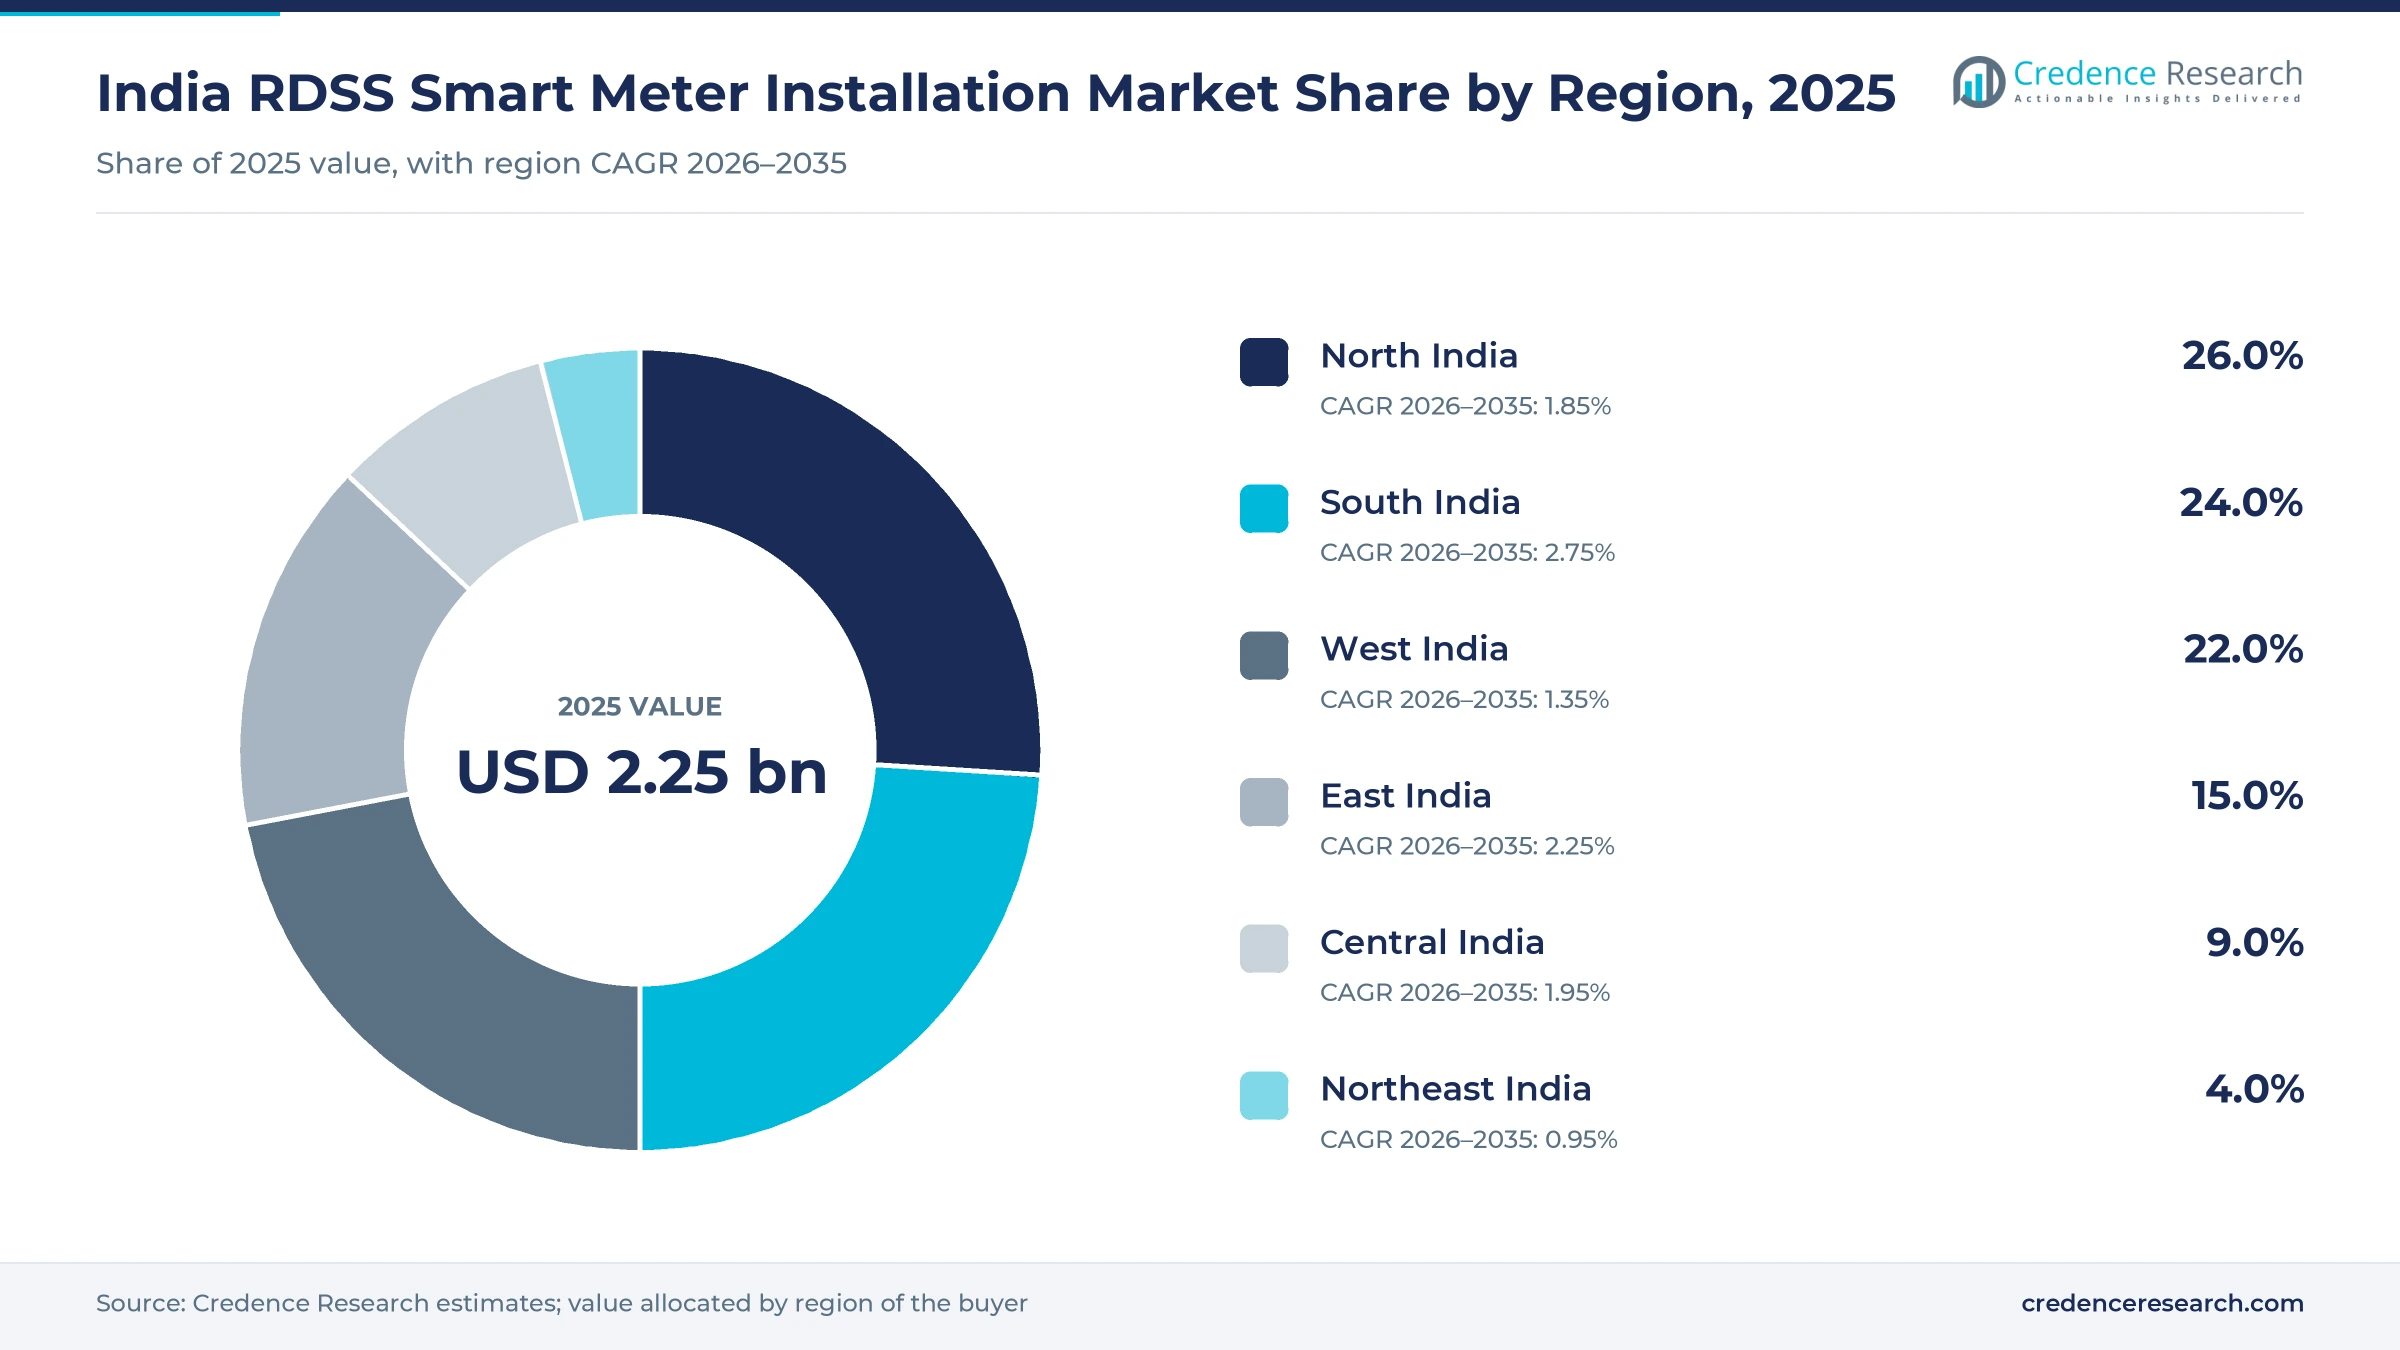
The India RDSS smart meter installation market was valued at USD 2.25 billion in 2025 and is projected to increase from USD 2.30 billion in 2026 to USD 2.75 billion by 2035, registering a CAGR of 2.00% during 2026–2035. Demand comes from state distribution utilities that must fit consumer, distribution transformer and feeder meters under the Revamped Distribution Sector Scheme, which runs to March 31, 2028. A government reply to Parliament dated July 27, 2026 counted 57.3 million meters fitted against 203.3 million sanctioned, which leaves most of the field work ahead. North India held the largest regional share, 26.0% in 2025, because Uttar Pradesh and Rajasthan carry large sanctioned programs. South India is the fastest-growing region as Tamil Nadu and Kerala move from tendering to field work. Billing rules have also changed, since an April 2026 regulatory amendment made prepaid mode optional and Uttar Pradesh returned its consumers to postpaid bills.
What does smart meter installation under RDSS include?
The market counts the contract value of consumer, distribution transformer and feeder meters fitted in a year under the Revamped Distribution Sector Scheme and linked state programs. That value covers the meter, field installation, commissioning, communications, head-end and data systems, and the long-term service bundled into the contract. Utilities buy mainly through advanced metering infrastructure service providers paid a monthly charge per meter.
Meters sold for retail, commercial submetering, water and gas are excluded, as are loss-reduction works such as feeder separation and new lines. The value chain runs from meter and module makers through service providers, field crews and telecom networks to utility billing systems.
India RDSS Smart Meter Installation Market Insights
- The market grows from USD 2.25 billion in 2025 to USD 2.75 billion by 2035, a 2.00% CAGR over 2026–2035, as installation peaks before the 2028 sunset and replacement follows.
- North India led with 26.0% of 2025 value, in line with the 58.2 million meters sanctioned across its states and union territories under the scheme.
- TOTEX/AMISP contracts led with 93.0% of 2025 value, because scheme rules tie central support to service provider contracts rather than direct utility purchases.
- An April 1, 2026 regulatory amendment made prepaid billing optional, and Uttar Pradesh moved its prepaid consumers, about 8.3 million by a consumer leader’s count in Outlook Business, back to postpaid bills that May.
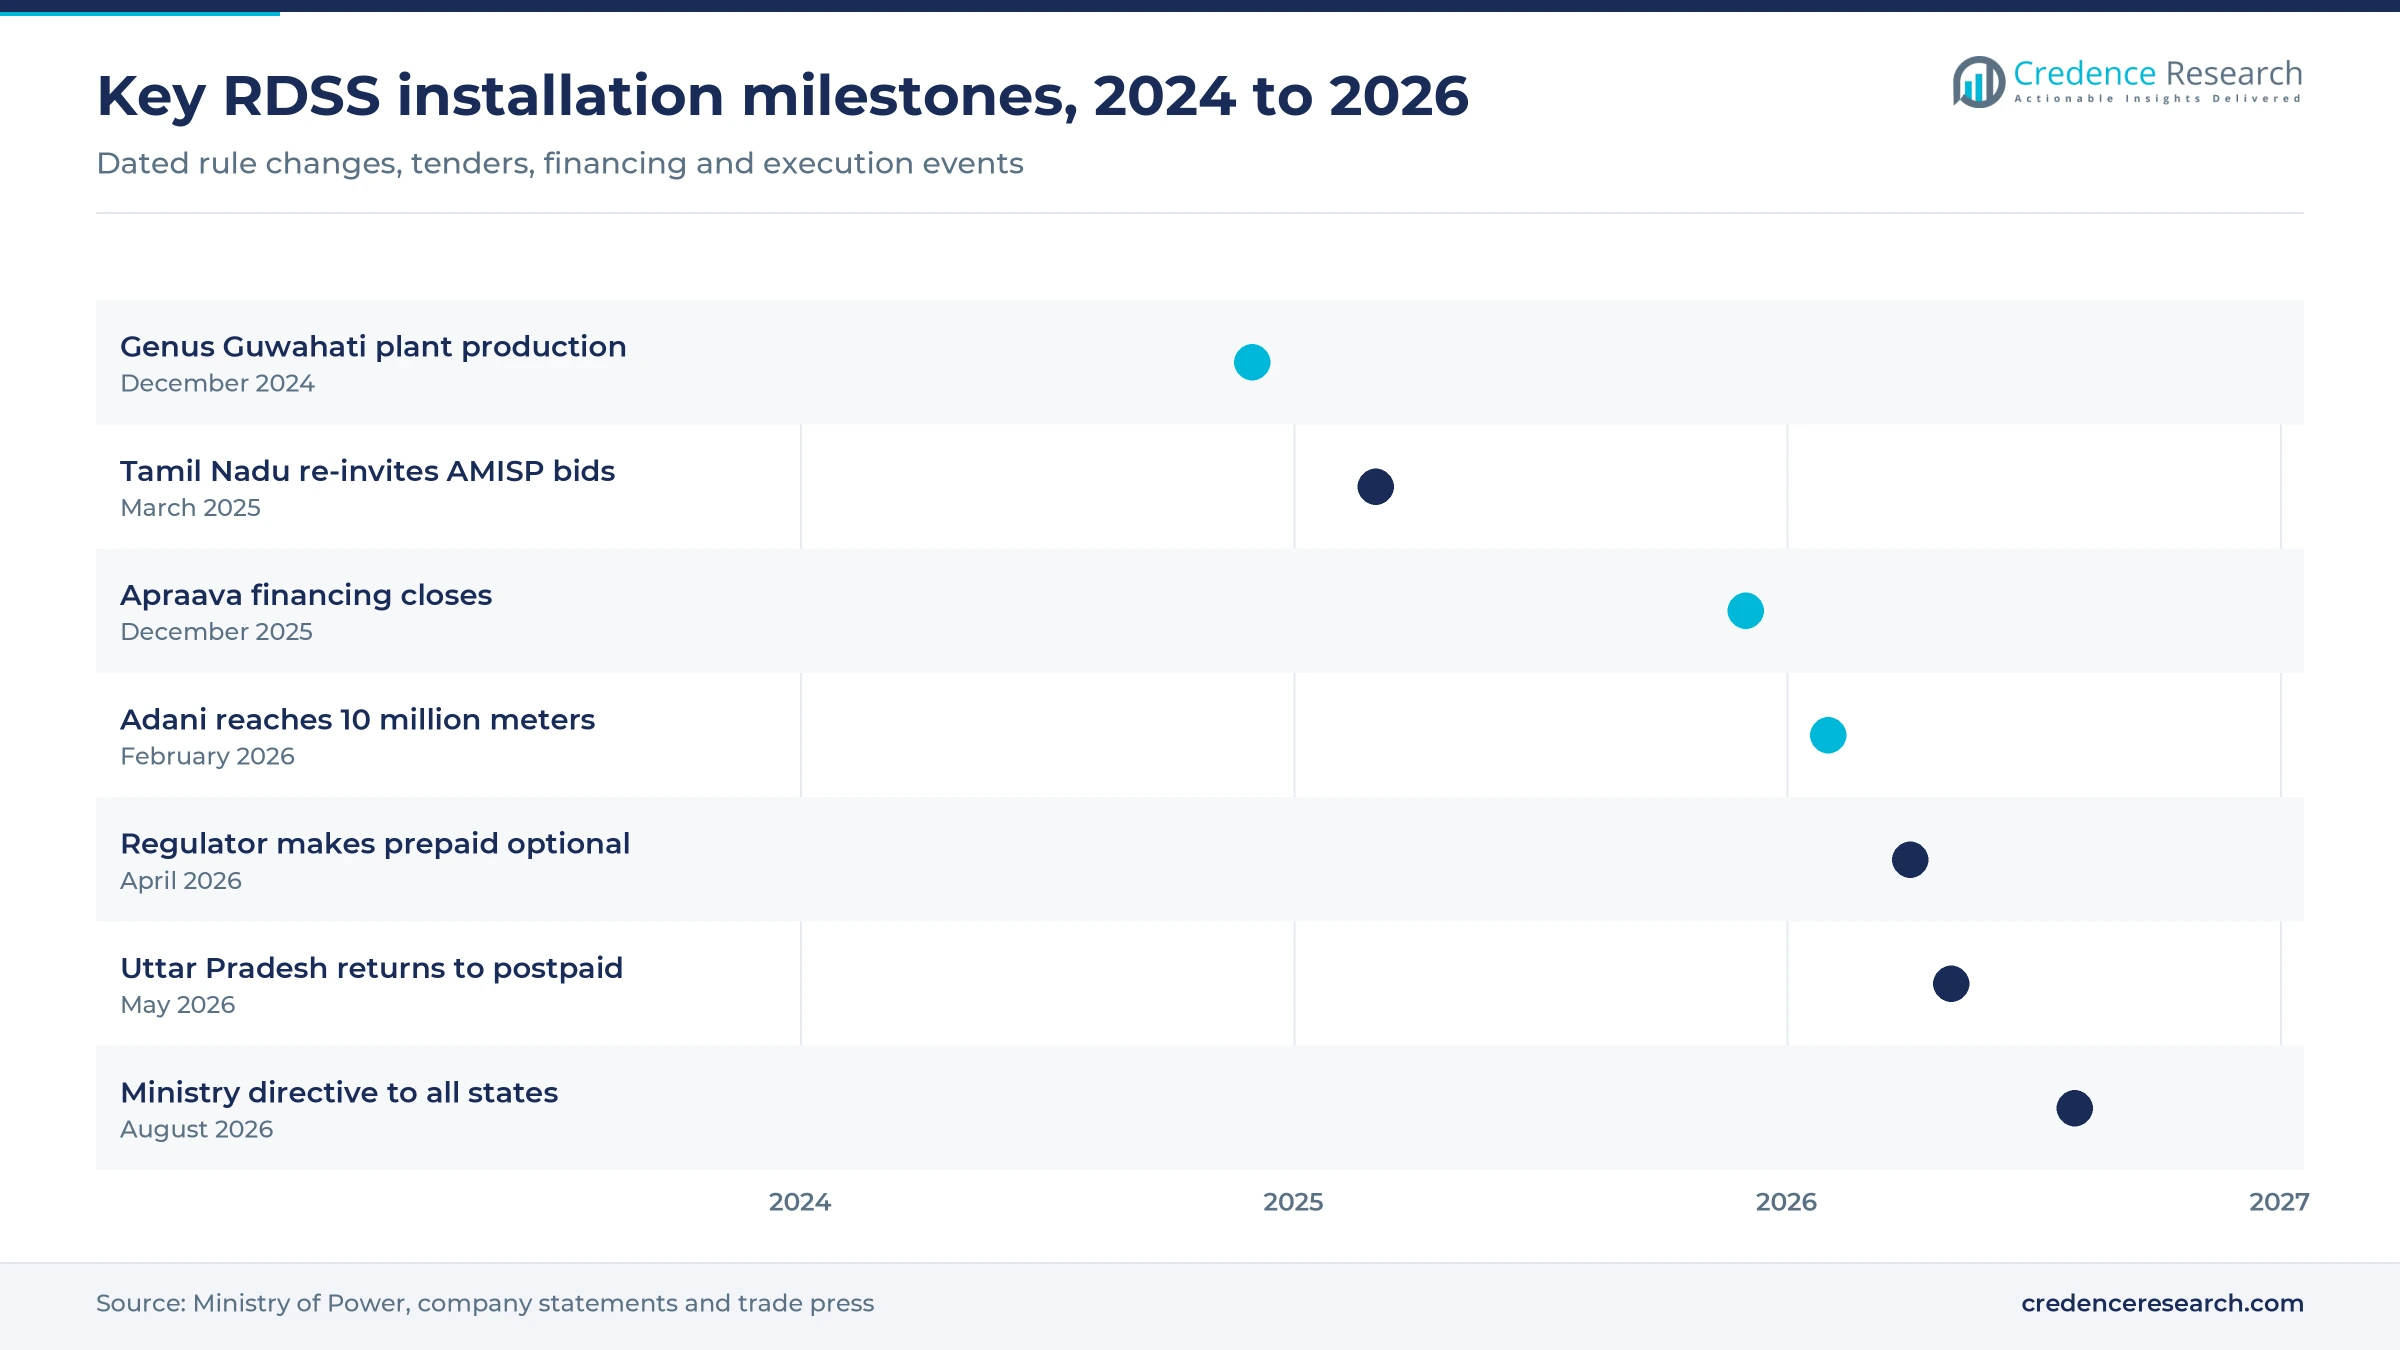
- Adani Energy Solutions reached 10 million installed meters on Feb. 5, 2026, which shows how much execution scale now decides who wins and keeps utility contracts.
Consumer meters and TOTEX contracts dominate project value
Consumer meters carry almost all sanctioned volume
Based on meter, the market is categorized into consumer prepaid, DT and feeder meters. Consumer Prepaid led with 89.0% of 2025 value because consumer units make up 197.9 million of the 203.3 million meters sanctioned, according to a Rajya Sabha reply dated July 27, 2026. The group counts prepaid-capable consumer meters whatever billing mode a utility selects afterward. DT meters grow fastest at 3.21% a year as only 1.85 million of 5.25 million sanctioned units had been fitted by June 30, 2026. Feeder work is nearly finished by comparison, with 185,000 of 205,000 sanctioned units already in place, which limits its future contribution.
Service provider contracts set the buying model
Based on model, the market is categorized into TOTEX/AMISP and capex. TOTEX/AMISP led with 93.0% of 2025 value because IntelliSmart reports that all its projects use the totex model that scheme guidelines require, according to Enlit. Under this structure the provider funds and maintains meters while a utility pays monthly, and Tamil Nadu specified 93 months of maintenance in its March 2025 tender. Capex grows fastest at 3.39% a year as Kerala plans 5 million second-phase meters at an estimated Rs 32.6 billion, according to Onmanorama in January 2026, after fitting about 175,000 in its first phase.
Uttar Pradesh and Maharashtra anchor the large programs
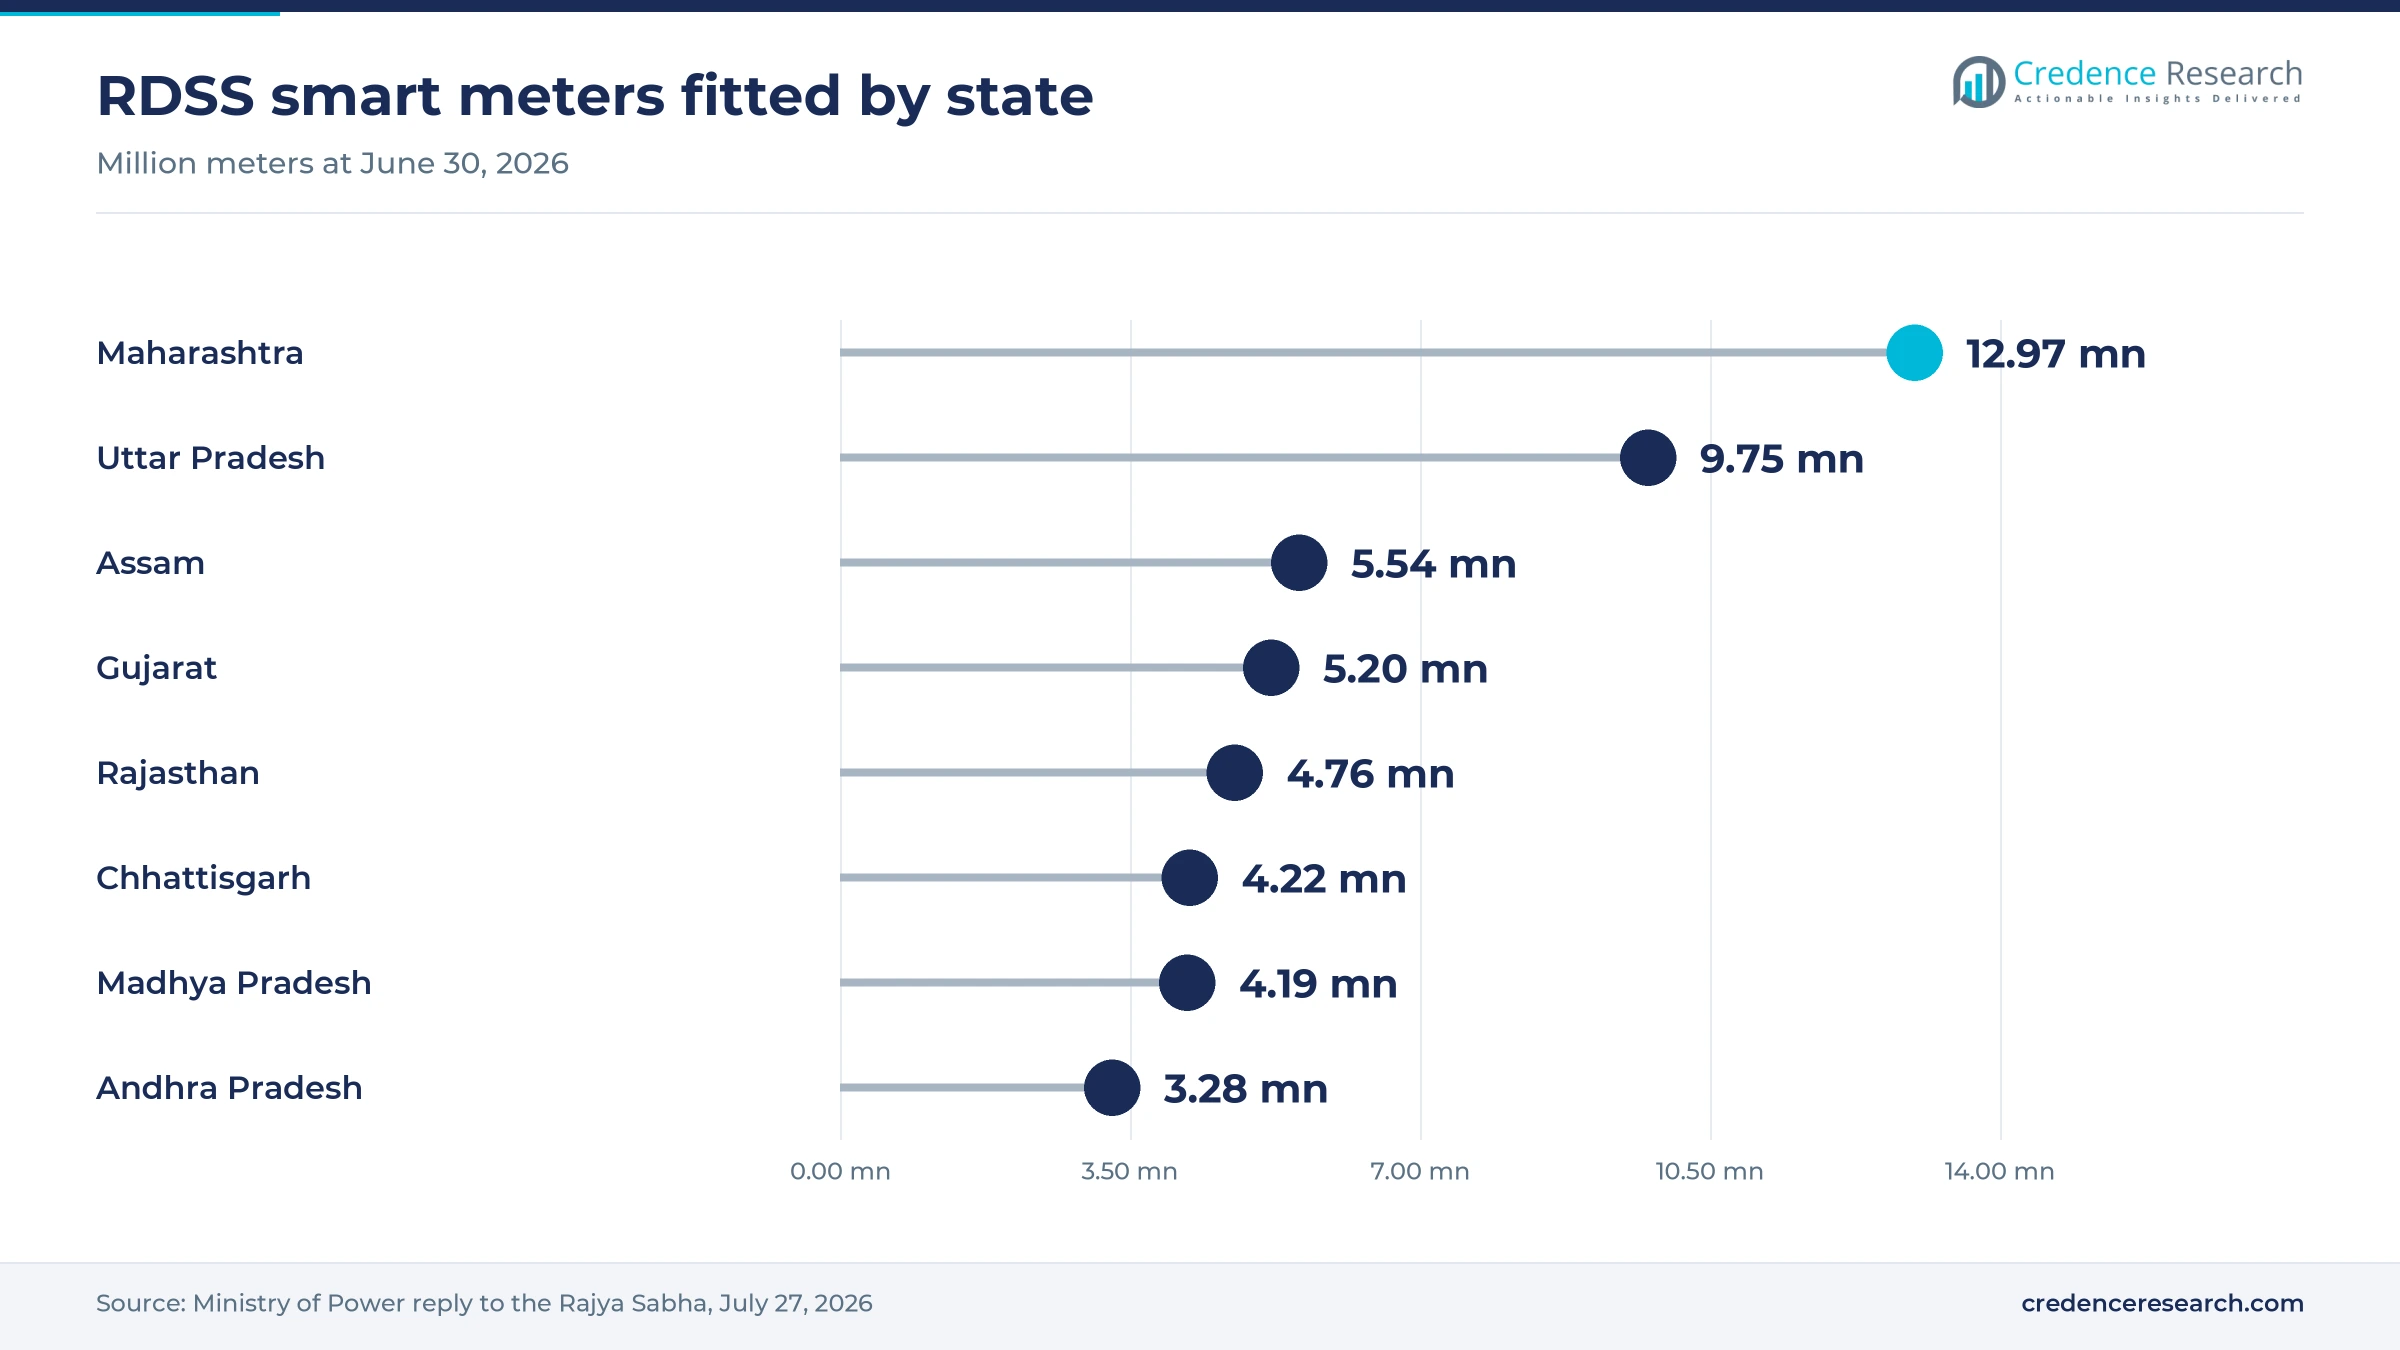
Based on state, the market is categorized into Uttar Pradesh, Bihar, Madhya Pradesh, Assam, Maharashtra and others. Others led with 55.0% of 2025 value because Gujarat, Rajasthan, Tamil Nadu, West Bengal and Kerala together hold 96.4 million sanctioned meters in the July 2026 Rajya Sabha reply. Among named states, Maharashtra had fitted 12.97 million meters by June 30, 2026, ahead of Uttar Pradesh at 9.75 million. Madhya Pradesh grows fastest at 2.75% a year as only 4.19 million of its 13.43 million sanctioned meters were in place, whereas Assam and Bihar have completed about 86% and 88% of theirs.
| Segment Group | Leading Sub-segment | Share, 2025 | Fastest-growing Sub-segment | CAGR, 2026–2035 |
|---|---|---|---|---|
| By Meter | Consumer Prepaid | 89.0% | DT | 3.21% |
| By Model | TOTEX/AMISP | 93.0% | Capex | 3.39% |
| By State | Others | 55.0% | Madhya Pradesh | 2.75% |
Request a Free Sample
Fill in your details and we'll send you a free sample report.
- Sample data tables & charts
- Research methodology
Sanctions, field crews and service contracts lift orders
RDSS procurement and rollout schedules lift field work
Scheme sanctions and rollout dates within the power sector create most of the installation demand because utilities need the meters in place before central support ends. A Ministry of Power reply to the Rajya Sabha dated July 27, 2026 listed 203.3 million sanctioned meters, 57.3 million fitted by June 30 and Rs 1.31 trillion of sanctioned metering works. The same reply set the scheme sunset at March 31, 2028, so about 146 million meters remain for roughly 21 months of work. Brokerage Angel One expected 80 million to 90 million meters to reach tender in fiscal 2027, which extends the pipeline beyond current awards. In the Credence Research model this adds about 0.90 percentage points to annual growth to 2035.
Advanced metering projects need commissioning crews
Advanced metering contracts pay for working systems rather than delivered boxes, so field installation and commissioning drive spending on each project. Adani Energy Solutions said it reached 10 million installed meters on Feb. 5, 2026, at a pace of about 25,000 meters a day, according to Multibagg. Genus Power told T&D India in January 2026 that it had a 15,500-strong execution team and 14 projects covering about 22 million meters with operational go-live status. That company also reported that invoices begin after go-live and then depend on monthly site acceptance tests, which keeps crews engaged after a meter is fitted. In the Credence Research model this adds about 0.50 percentage points to annual growth to 2035.
Prepaid integration and service contracts bring repeat orders
Billing integration and long service terms turn a one-time installation into a recurring revenue contract for each provider. Tamil Nadu asked bidders to install meters within 27 months and maintain them for 93 months, with repayment through a monthly rental over 10 years, according to DT Next in March 2025. Prepaid capability still has to be built into metering systems after the April 2026 regulatory change, Angel One reported, even where a utility bills consumers afterward. India had 16 million smart meters in prepaid mode at Dec. 11, 2025, according to All India Radio News, so utilities must support both billing streams. In the Credence Research model this adds about 0.32 percentage points to annual growth to 2035.
Loss targets and a central directive keep states moving
Utility finances give states a commercial reason to continue, because accurate metering supports billing and collection efforts that scheme funding also monitors. SolarQuarter reported in March 2026 that aggregate technical and commercial losses fell to 15.04% in fiscal 2025 from 21.91% in fiscal 2021, while billing efficiency rose to 87.59% from 84.08%. The Ministry of Power then directed all states and union territories in August 2026 to continue installations for prepaid and postpaid consumers alike, according to SolarQuarter. That directive required action plans and compliance reports from utilities, and metering data also feeds wider grid modernization spending by the same buyers. As a result, the push continues under an older national aim of replacing 250 million conventional meters, listed in an IEA policy record last updated in June 2021.
Billing choice and southern tenders reshape the rollout
Shift from mandatory prepaid to optional billing mode
Billing mode has become a utility and state choice, which changes how providers configure systems and how they speak to consumers. The Central Electricity Authority amended its metering regulations on April 1, 2026, making prepaid billing optional while keeping the function within metering systems, Angel One reported. Uttar Pradesh then announced on May 8, 2026 that it would discontinue its smart prepaid system and issue new connections only in postpaid mode. ET EnergyWorld reported in June 2026 that 8.56 million Uttar Pradesh consumers received postpaid bills for that month. Providers therefore need meter and billing systems that switch modes through software without another field visit.
Rise of long-term capital in metering platforms
Service provider contracts demand heavy upfront spending, so sovereign and development investors have become regular partners in Indian metering platforms. Apraava Energy secured Rs 8.01 billion from British International Investment and Standard Chartered in December 2025, Mercom India reported, to help fit more than 2 million meters. Its goal is 7.8 million meters across projects in states including Assam, Gujarat, West Bengal and Madhya Pradesh, which gives lenders a multi-state exposure. Genus Power partnered with Singapore sovereign fund GIC in 2023 on a platform that now funds projects, according to T&D India. Monthly payments backed by a direct debit facility make these long-duration assets easier to finance than one-off supply orders.
Opening in Tamil Nadu and Kerala field programs
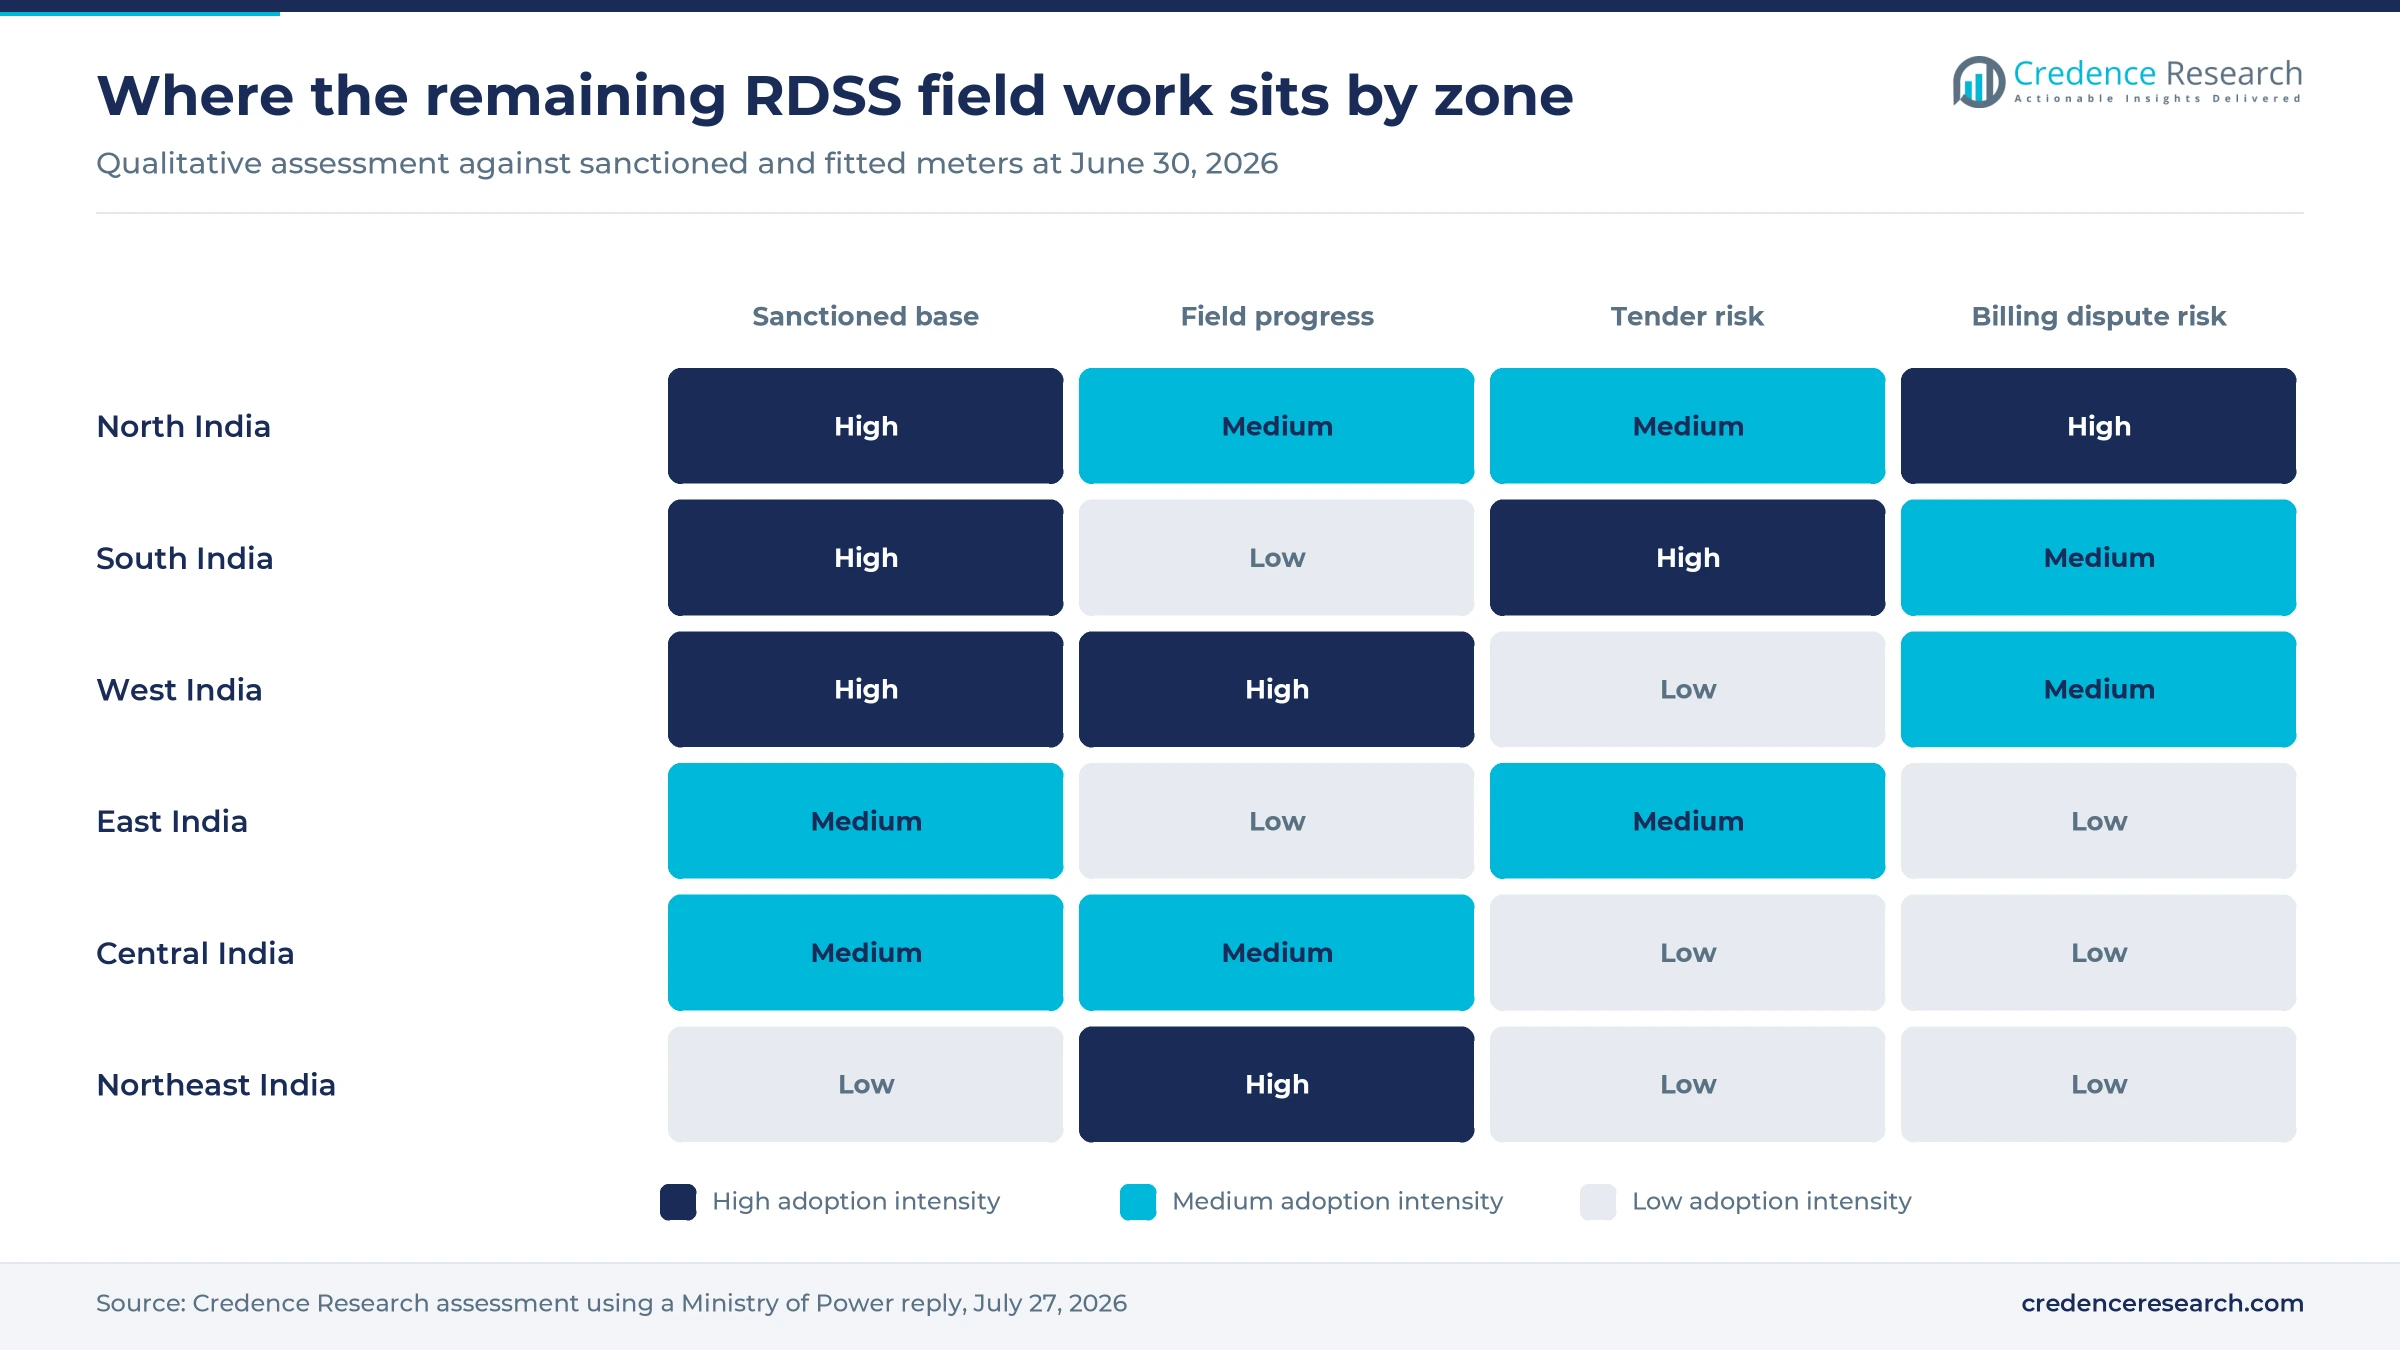
Southern states offer the largest untouched opening because their sanctioned base is large and their fitted count is still very small. Tamil Nadu had 30.5 million sanctioned meters and only 9,746 fitted at June 30, 2026, while Kerala had 13.4 million sanctioned and 192,942 fitted, according to the Rajya Sabha reply. T&D India reported in March 2026 that PFC Consulting sought financial bids from seven empaneled agencies for 125,000 Tamil Nadu meters in Chennai-area regions. Providers with local crews can therefore position early for the larger re-bid packages. This opening explains why South India is the fastest-growing zone in the Credence Research model.
Opportunity in transformer metering and non-RDSS utilities
Transformer metering and utilities outside the central scheme give providers work that does not depend on the 2028 sunset. Distribution transformer units stood at 1.85 million fitted against 5.25 million sanctioned at June 30, 2026, which leaves about 3.4 million sites where energy audits can begin. Tamil Nadu alone listed 472,000 transformers in its March 2025 tender, and those sites need three-phase work with current transformers rather than simple swaps. Karnataka had about 290,000 smart meters and charged new connections from Rs 4,800, The Goan reported in May 2026, while Telangana cabinet approval opened another program. New connections at these utilities also need service cables, and homes with rooftop solar inverters need meters that record exported power.
Billing disputes and bid prices slow several state programs
Consumer disputes over charges slow state programs
Consumer trust is the most visible risk, because billing complaints can halt installation across an entire state. Free Press Journal reported on May 11, 2026 that Uttar Pradesh planned refunds of nearly Rs 2 billion to more than 500,000 consumers charged up to Rs 6,016 for meters costing about Rs 2,800. Goa village assemblies in Siolim-Marna and Assagao also opposed the rollout, according to The Goan. Providers respond with clearer bill explanations, app support and consumer camps before crews arrive in new districts.
High bid prices force tender cancellations
Tender pricing has delayed some of the largest programs because utilities compare quoted monthly charges with what their tariffs can recover. Tamil Nadu cancelled a roughly Rs 190 billion tender for 8.2 million meters in early 2025 over high costs, according to T&D India, and it then re-tendered the work. BSES tenders in Delhi were also called off and expected to return, Genus Power said in January 2026. These delays hurt suppliers that reserved capacity, so providers now stagger plant commitments until awards are firm.
Go-live gaps delay service provider cash flow
Payment timing strains providers, because meters fitted in the field do not earn until a project clears its go-live event. Genus Power had about 4.5 million meters installed at June 30, 2025, yet only about 2.1 million had reached go-live, according to T&D India. HPL Electric also cited lower execution and delayed dispatch clearances on some large projects in the same quarter, T&D India reported. Providers and lenders therefore plan for working capital cover, and they add acceptance test staff early in each package.
Data and software gaps keep manual reading alive
Incomplete system integration reduces the value of installed meters, since utilities cannot bill from data they do not receive. Uttar Pradesh had about 362,000 meters with data gaps that required manual readings in June 2026, ET EnergyWorld reported, and Kerala still relied on manual billing in January 2026 because software was not integrated, according to Onmanorama. These gaps push out savings for utilities, so newer contracts place more weight on head-end performance and on communication coverage tests.
North India leads while South India holds the backlog
| Region | Value, 2025 (USD billion) | Share, 2025 | CAGR, 2026–2035 |
|---|---|---|---|
| North India | 0.59 | 26.0% | 1.85% |
| South India | 0.54 | 24.0% | 2.75% |
| West India | 0.50 | 22.0% | 1.35% |
| East India | 0.34 | 15.0% | 2.25% |
| Central India | 0.20 | 9.0% | 1.95% |
| Northeast India | 0.09 | 4.0% | 0.95% |
North India leads on Uttar Pradesh and Rajasthan volume
North India held 26.0% of 2025 value and grows at 1.85% a year, supported by 58.2 million sanctioned meters across its states and union territories. Uttar Pradesh accounts for 28.5 million of that base and Rajasthan for 14.7 million, according to the July 2026 Rajya Sabha reply. Punjab remains the clear gap, with 14,662 meters fitted against 9 million sanctioned, so the zone still has a large field program ahead of it even after billing changes in Uttar Pradesh.
South India holds the largest unfilled backlog
South India held 24.0% of 2025 value and grows at 2.75% a year, the fastest pace among zones in the model. Its share reflects a sanctioned base of 50.2 million meters rather than current field progress, because only about 3.6 million had been fitted by June 30, 2026. Andhra Pradesh supplied most of that work with 3.28 million meters, whereas Tamil Nadu and Kerala remained at an early stage, which leaves the zone exposed to any further tender delay.
West India has the most meters already in place
West India held 22.0% of 2025 value and grows at 1.35% a year, slower than the national rate because its program is further along. The zone had 18.2 million meters fitted against 41.5 million sanctioned at June 30, 2026, led by Maharashtra at 12.97 million and Gujarat at 5.2 million. Goa is the exception with 32,231 fitted against 750,356 sanctioned, while local opposition has drawn political debate over that smaller program.
East India depends on West Bengal awards
East India held 15.0% of 2025 value and grows at 2.25% a year, with West Bengal as the main source of remaining work. West Bengal had 700,182 meters fitted against 21 million sanctioned at June 30, 2026, according to the Rajya Sabha reply. Bihar is largely finished under the scheme at 2.3 million of 2.6 million, and The Goan reported its total at more than 6.18 million when earlier programs are included.
Central India advances on Chhattisgarh and Madhya Pradesh
Central India held 9.0% of 2025 value and grows at 1.95% a year, supported by two mid-sized state programs at different stages. Chhattisgarh had fitted 4.22 million of 6.18 million sanctioned meters at June 30, 2026, whereas Madhya Pradesh had fitted 4.19 million of 13.43 million. Tata Power won a Rs 17.44 billion Chhattisgarh contract in 2023, according to T&D India, and Apraava Energy also lists Madhya Pradesh among its project states.
Northeast India nears completion under Assam contracts
Northeast India held 4.0% of 2025 value and grows at 0.95% a year, the slowest pace among zones because its largest program is nearly done. Assam had fitted 5.54 million of 6.45 million sanctioned meters at June 30, 2026, which leaves about 900,000 units there. Meghalaya had reported no installations against 472,743 sanctioned meters at that date, so the smaller hill states now hold much of the remaining work in the zone.
Rule changes and milestones marked 2025 and 2026
| Development | Status and market relevance |
|---|---|
| In December 2025, Apraava Energy secured Rs 8.01 billion from British International Investment and Standard Chartered to fit more than 2 million meters. | Financing closed; supports a stated 7.8 million meter goal across seven states and territories |
| In February 2026, Adani Energy Solutions said it had installed 10 million smart meters across several distribution utilities. | Milestone reached ahead of its internal March 2026 target at about 25,000 meters a day |
| In April 2026, the Central Electricity Authority amended its metering regulations and made prepaid billing optional. | In force; meters keep prepaid function while the billing mode becomes a utility choice |
| In May 2026, Uttar Pradesh discontinued its smart prepaid system and moved consumers to postpaid billing. | Implemented; postpaid bills issued for June 2026 and installation continues under new terms |
| In August 2026, the Ministry of Power directed all states and union territories to continue meter installation for every consumer category. | Active; utilities must prepare action plans and submit compliance reports |
Standards, head-end systems and tests decide who gets paid
- IS 16444 compliance requires bidirectional communication and a remote connect switch, and a C-DOT notice said suppliers must hold valid Bureau of Indian Standards certification before delivery.
- Head-end systems collect and manage meter data at scale, and CyanConnode says its Omnimesh platform supports more than 1.2 million meters on one system in Jabalpur.
- Site acceptance tests determine the meters that qualify for monthly invoices after go-live, according to Genus Power, so test results directly affect provider income.
- Billing mode software lets a utility configure one meter for prepaid or postpaid accounts, and the Ministry of Power described payment mode in August 2026 as only a functional configuration.
Need a Custom Version of This Report?
Tailor the scope, geography, or segments to your exact requirements.
- Custom geography or segment scope
- Direct access to our analyst team
Service providers compete on crews, capital and go-live
Competition centers on who can finance, fit and commission meters fastest under long service contracts, and scale has become the main advantage. Adani Energy Solutions and Genus Power run the largest visible programs, each past 10 million installed meters by fiscal 2026. IntelliSmart built its position through large awards in Uttar Pradesh, Bihar, Assam and Gujarat, while Apraava Energy has spread projects across seven states and territories with backing from long-term investors. Tata Power combines its own distribution experience in Odisha, Delhi and Mumbai with a service provider contract in Chhattisgarh. HPL Electric competes mainly as a meter maker with 11 million units of annual capacity and a metering order book above Rs 30 billion in August 2025. Seven agencies qualified for the small Tamil Nadu packages in the March 2025 empanelment, which shows the field is wider than the largest names.
Companies profiled and their roles in this market
| Company | Type | Role in the market |
|---|---|---|
| Adani Energy Solutions | Service provider | Installed 10 million meters by Feb. 5, 2026, under an RDSS mandate of about 25 million across five states |
| Genus Power | Meter maker and service provider | Crossed 10 million installations in fiscal 2026 with about 18 million meters of yearly capacity |
| IntelliSmart | Service provider | Holds Uttar Pradesh, Bihar, Assam and Gujarat awards under totex contracts |
| Apraava Energy | Service provider | Targets 7.8 million meters in states including Assam, Gujarat and Madhya Pradesh |
| Tata Power | Utility and service provider | Won a Rs 17.44 billion Chhattisgarh contract and runs distribution in Odisha, Delhi and Mumbai |
| HPL Electric | Meter maker | Supplies smart meters from Gurugram and Jabli with 11 million units of yearly capacity |
Go-live speed will separate the contract winners
Credence Research's view is that execution rather than awards will now decide returns in this market. Even strong crews will struggle to finish before March 2028, and an extension or a slower exit looks more likely than a sudden stop. Demand for field crews stays high because about 146 million sanctioned meters remained unfitted at June 30, 2026. Providers that shorten the gap between fitting and go-live gain cash and bidding room. Buyers gain most from contracts that price communication performance and clearly explain charges, since Uttar Pradesh showed how quickly consumer complaints can change state policy.
Sanction counts and contract value anchor the estimates
The report uses 2025 as the base year and 2035 as the forecast year. Market values come from the Credence Research model and count contract value for meters fitted in a year, including bundled service, so they differ from device-only measures. Meter, model, state and zone splits are Credence Research estimates weighted to sanctioned program size in a Ministry of Power reply to Parliament rather than to meters fitted in the year, so South India’s share runs well ahead of its field count. Other sources are government notices, regulator amendments, company statements and trade press, and no interviews or surveys were used.
Replacement cycles take over after the 2028 sunset
Installation spending should remain near current levels through the March 2028 sunset, while the heavy backlog in Tamil Nadu, Kerala, West Bengal and Punjab keeps crews busy. The market reaches USD 2.75 billion by 2035 at a 2.00% CAGR because later volume depends on replacing an installed base that Angel One put at 310 million to 320 million meters. Consumer meters should keep the largest segment share, since 197.9 million of the 203.3 million sanctioned units serve that group. Service terms of about 93 months mean the first large contracts come up for renewal around 2030 to 2033, and that should turn today's installers into repeat bidders.
Frequently Asked Questions
How big is the India RDSS smart meter installation market?
How many meters are sanctioned and fitted under RDSS?
When does the scheme end?
Which region leads the market?
Which contract model is most common?
Are smart prepaid meters still mandatory in India?
What slows smart meter installation in India?
Who are the main companies in this market?
Table of Content
Chapter 1 Market Segmentation
- 1.1 Segmentation Framework
- 1.1.1 Product and Service Classification
- 1.1.2 Application and End-Use Classification
- 1.1.3 Technology and Solution Classification
- 1.1.4 Customer and Distribution Channel Classification
- 1.1.5 Geographic Segmentation
- 1.1.6 Market Segment Definitions and Boundaries
- 1.2 By Meter
- 1.2.1 Consumer Prepaid
- 1.2.2 DT
- 1.2.3 Feeder
- 1.3 By Model
- 1.3.1 TOTEX/AMISP
- 1.3.2 Capex
- 1.4 By State
- 1.4.1 Others
- 1.4.2 Maharashtra
- 1.4.3 Uttar Pradesh
- 1.4.4 Madhya Pradesh
- 1.4.5 Assam
- 1.4.6 Bihar
Chapter 2 Introduction
- 2.1 Report Objectives and Scope
- 2.2 Product Definition and Industry Terminology
- 2.3 Market Inclusions and Exclusions
- 2.4 Research Process
- 2.4.1 Primary Research and Expert Interviews
- 2.4.2 Secondary Research and Source Review
- 2.4.3 Top-Down and Bottom-Up Estimation
- 2.4.4 Data Triangulation and Verification
- 2.5 Market Size Measurement Basis
- 2.5.1 2025: USD 2.25 billion → 2035: USD 2.75 billion
- 2.6 Historical and Forecast Reference Periods
- 2.6.1 Historical Period: 2018-2025
- 2.6.2 Base Year: 2025
- 2.6.3 Forecast Period: 2025-2035
- 2.7 Research Assumptions and Limitations
Chapter 3 Executive Summary
- 3.1 Market Snapshot and Key Findings
- 3.2 Base-Year Market Size, 2025
- 3.3 Forecast Market Size, 2035
- 3.4 Revenue and Volume Growth Outlook
- 3.5 Key Demand and Supply Indicators
- 3.6 Leading Market Segments
- 3.7 Fastest-Growing Market Opportunities
- 3.8 Regional Performance Highlights
- 3.9 Technology and Industry Transformation
- 3.10 Competitive Landscape Summary
- 3.11 Analyst View and Strategic Implications
Chapter 4 India RDSS Smart Meter Installation Market Trends and Developments
- 4.1 Historical Industry Development, 2018-2025
- 4.2 Recent Market Trends and Developments
- 4.3 Demand and Customer Behavior Trends
- 4.4 Technology and Product Innovation
- 4.5 Artificial Intelligence, Automation and Digitalization
- 4.6 Local Manufacturing and Supply Chain Realignment
- 4.7 Industry Partnerships, Mergers and Acquisitions
- 4.8 Sustainability and Circular Economy Developments
- 4.9 Government and Private Sector Investment Trends
- 4.10 Emerging Business Models and Commercialization
- 4.11 Industry Developments and Announcements
Chapter 5 India RDSS Smart Meter Installation Market Production, Supply and Demand Analysis
- 5.1 Demand Trend and Consumption Analysis, 2018-2025
- 5.2 Demand Forecast, 2025-2035
- 5.3 Production and Output Trend, 2018-2025
- 5.4 Production and Output Forecast, 2025-2035
- 5.5 Installed Capacity and Capacity Utilization
- 5.6 Company-Wise Production Plants and Statistics
- 5.6.1 Installed Production Capacity
- 5.6.2 Actual Production
- 5.6.3 Planned Capacity and Expansion Targets
- 5.7 Supply Chain Structure and Procurement Trends
- 5.8 Supply-Demand Gap and Bottlenecks
- 5.9 Import Dependence and Sourcing Structure
- 5.10 Contract Manufacturing and Outsourcing
- 5.11 Regional Supply and Demand Concentration
Chapter 6 India RDSS Smart Meter Installation Market Pricing Analysis
- 6.1 Pricing Structure and Measurement
- 6.2 Historical Pricing Trends, 2018-2025
- 6.3 Pricing Outlook, 2025-2035
- 6.4 Average Selling Price and Unit Economics
- 6.5 Pricing by Product and Market Segment
- 6.6 Geographic Pricing Differences
- 6.7 Key Input, Energy, Labor and Logistics Costs
- 6.8 Contract Pricing and Purchasing Models
- 6.9 Pricing Sensitivity and Competitive Positioning
- 6.10 Price, Margin and Profitability Implications
Chapter 7 India RDSS Smart Meter Installation Market Dynamics
- 7.1 Market Growth Drivers
- 7.1.1 Demand-Side Drivers
- 7.1.2 Technology and Innovation Drivers
- 7.1.3 Infrastructure and Investment Drivers
- 7.1.4 Regulatory and Policy Drivers
- 7.2 Market Restraints
- 7.2.1 Cost and Affordability Constraints
- 7.2.2 Technology and Adoption Barriers
- 7.2.3 Supply Chain and Operational Constraints
- 7.3 Market Challenges
- 7.3.1 Competitive Pressure and Margin Erosion
- 7.3.2 Skills, Infrastructure and Implementation Gaps
- 7.4 Emerging Market Opportunities
- 7.5 Market Dynamics Impact and Time-Horizon Assessment
Chapter 8 India RDSS Smart Meter Installation Value Chain Analysis
- 8.1 Industry Value Chain Overview
- 8.2 Upstream Suppliers and Critical Inputs
- 8.3 Technology and Component Providers
- 8.4 Manufacturing or Service Delivery
- 8.5 Distribution, Channel Partners and Integrators
- 8.6 Downstream Applications and End Users
- 8.7 Value Addition and Profit Pools
- 8.8 Vertical Integration and Outsourcing
- 8.9 Supplier Concentration and Risk
- 8.10 Supply Chain Localization and Resilience
Chapter 9 India RDSS Smart Meter Installation Market Regulations and Policies
- 9.1 Relevant Laws, Standards and Compliance Frameworks
- 9.2 Product, Service, Safety and Quality Requirements
- 9.3 Government Policies, Incentives and Subsidies
- 9.4 Imports, Exports and Trade Barriers
- 9.5 Public Procurement and Local Content Requirements
- 9.6 Environmental and Sustainability Compliance
- 9.7 Upcoming Policy Changes and Market Implications
Chapter 10 India RDSS Smart Meter Installation Market Hotspots and Opportunities
- 10.1 Market Opportunity Mapping and Growth Hotspots
- 10.2 High-Growth Applications and Customer Groups
- 10.3 Underserved Markets and White-Space Opportunities
- 10.4 Emerging Technology and Product Opportunities
- 10.5 New Capacity and Investment Hotspots
- 10.6 Market Entry and Expansion Opportunities
- 10.7 Distribution and Partnership Opportunities
- 10.8 Near-Term and Long-Term Commercial Potential
- 10.9 Opportunity Attractiveness and Execution Risks
Chapter 11 India RDSS Smart Meter Installation Market Outlook, 2025-2035
- 11.1 Market Size and Analysis
- 11.1.1 Revenue (Market Measurement: 2025: USD 2.25 billion → 2035: USD 2.75 billion)
- 11.1.2 Market Volume and Quantity Sold
- 11.1.3 Historical Market Size, 2018-2025
- 11.1.4 Base-Year Market Size, 2025
- 11.2 Market Forecast, 2025-2035
- 11.2.1 Revenue Forecast to 2035
- 11.2.2 Volume Forecast to 2035
- 11.2.3 CAGR and Year-on-Year Growth
- 11.2.4 Incremental Revenue Opportunity
- 11.3 Forecast Assumptions and Scenario Analysis
- 11.3.1 Base-Case Forecast
- 11.3.2 Optimistic and Conservative Scenarios
- 11.3.3 Technology, Pricing and Policy Sensitivities
- 11.4 Market Attractiveness and Growth Outlook
Chapter 12 India RDSS Smart Meter Installation Market Segmentation and Outlook
- 12.1 Segmentation Summary and Market Shares, 2025
- 12.2 Largest and Fastest-Growing Segments
- 12.3 By Meter - Market Size and Forecast, 2025-2035
- 12.3.1 Segment Definition and Scope
- 12.3.2 Historical Market Size, 2018-2025
- 12.3.3 Revenue Forecast, 2025-2035
- 12.3.4 Volume Forecast, 2025-2035
- 12.3.5 Base-Year Market Share, 2025
- 12.3.6 Segment CAGR and Growth Drivers
- 12.3.7 Subsegment Market Size and Forecast
- 12.3.7.1 Consumer Prepaid
- 12.3.7.2 DT
- 12.3.7.3 Feeder
- 12.3.8 Subsegment Pricing and Adoption Trends
- 12.3.9 Leading Suppliers and Competition
- 12.3.10 Regional Demand and Opportunities
- 12.4 By Model - Market Size and Forecast, 2025-2035
- 12.4.1 Segment Definition and Scope
- 12.4.2 Historical Market Size, 2018-2025
- 12.4.3 Revenue Forecast, 2025-2035
- 12.4.4 Volume Forecast, 2025-2035
- 12.4.5 Base-Year Market Share, 2025
- 12.4.6 Segment CAGR and Growth Drivers
- 12.4.7 Subsegment Market Size and Forecast
- 12.4.7.1 TOTEX/AMISP
- 12.4.7.2 Capex
- 12.4.8 Subsegment Pricing and Adoption Trends
- 12.4.9 Leading Suppliers and Competition
- 12.4.10 Regional Demand and Opportunities
- 12.5 By State - Market Size and Forecast, 2025-2035
- 12.5.1 Segment Definition and Scope
- 12.5.2 Historical Market Size, 2018-2025
- 12.5.3 Revenue Forecast, 2025-2035
- 12.5.4 Volume Forecast, 2025-2035
- 12.5.5 Base-Year Market Share, 2025
- 12.5.6 Segment CAGR and Growth Drivers
- 12.5.7 Subsegment Market Size and Forecast
- 12.5.7.1 Others
- 12.5.7.2 Maharashtra
- 12.5.7.3 Uttar Pradesh
- 12.5.7.4 Madhya Pradesh
- 12.5.7.5 Assam
- 12.5.7.6 Bihar
- 12.5.8 Subsegment Pricing and Adoption Trends
- 12.5.9 Leading Suppliers and Competition
- 12.5.10 Regional Demand and Opportunities
- 12.6 Segment Growth Comparison
- 12.7 Segment Attractiveness and Priority Matrix
Chapter 13 India RDSS Smart Meter Installation Geographic Market Outlook, 2025-2035
- 13.1 Domestic Market Distribution and Demand Clusters
- 13.2 State- or Province-Wise Market Size and Forecast, 2025-2035
- 13.3 City and Metropolitan Market Outlook
- 13.4 Industrial, Manufacturing and Commercial Clusters
- 13.5 Geographic Concentration of Key End Users
- 13.6 Local Pricing and Purchasing Differences
- 13.7 Domestic Production Facilities and Capacity Map
- 13.8 Local Infrastructure and Project Pipeline
- 13.9 State-Level Policy and Incentive Differences
- 13.10 Subnational Investment Hotspots and Opportunities
- 13.11 Distribution and Logistics Networks
- 13.12 Domestic Competitive Footprint
Chapter 14 India RDSS Smart Meter Installation Technology, Innovation and Sustainability Outlook
- 14.1 Technology Landscape and Maturity
- 14.2 Product, Process and Service Innovation
- 14.3 AI, Automation and Digital Tools in the Industry
- 14.4 Technology Adoption and Performance Benchmarking
- 14.5 Innovation Pipeline and R&D Investment
- 14.6 Patent and Intellectual Property Trends
- 14.7 Energy Efficiency and Resource Management
- 14.8 Sustainability, Recycling and Circularity
- 14.9 Technology Roadmap, 2025-2035
- 14.10 Risks of Obsolescence and Technology Substitution
Chapter 15 India RDSS Smart Meter Installation Market Key Strategic Imperatives
- 15.1 Growth and Market Entry Priorities
- 15.2 High-Return Products and Segments
- 15.3 Pricing, Profitability and Cost Optimization
- 15.4 Technology Investment and Product Differentiation
- 15.5 Supply Chain Localization and Resilience
- 15.6 Distribution and Customer Acquisition
- 15.7 Partnership, Acquisition and Capacity Strategy
- 15.8 Regional Expansion Priorities
- 15.9 Short-, Medium- and Long-Term Actions
Chapter 16 Competition Outlook
- 16.1 Industry Competition Characteristics
- 16.2 Market Structure and Concentration
- 16.3 Market Share and Competitive Positioning, 2025
- 16.4 Company-Wise Revenue and Product Benchmarking
- 16.5 Production and Service Capacity Benchmarking
- 16.6 Technology, Pricing and Differentiation
- 16.7 Regional Footprint and Distribution Strength
- 16.8 Mergers, Acquisitions and Strategic Alliances
- 16.9 New Entrants and Competitive Threats
- 16.10 Porter's Five Forces and Industry Attractiveness
- 16.11 Competitive Outlook, 2025-2035
Chapter 17 Company Profiles
- 17.1 Company Coverage and Selection Criteria
- 17.2 Adani Energy Solutions
- 17.2.1 Business Description
- 17.2.2 Company Ownership and Geographic Presence
- 17.2.3 Product and Service Portfolio
- 17.2.4 Manufacturing and Operating Footprint
- 17.2.5 Production Capacity and Expansion Plans
- 17.2.6 Financial Performance and Investment
- 17.2.7 Market Share and Competitive Position
- 17.2.8 Technology and Innovation Capabilities
- 17.2.9 Strategic Alliances or Partnerships
- 17.2.10 Recent Developments
- 17.2.11 Growth Strategy and Outlook
- 17.3 Genus Power
- 17.4 Tata Power
- 17.5 IntelliSmart
- 17.6 Apraava Energy
- 17.7 HPL Electric
- 17.8 Other Relevant Market Participants
Note: Every listed company is profiled on the structure shown under the first company. The company list is preliminary and may change based on research findings, market developments, data availability and client requirements.
Chapter 18 Disclaimer
- 18.1 Research and Forecast Disclaimer
- 18.2 Data Source and Estimation Limitations
Note: The depth of individual sections depends on data availability for this market. Volume, capacity, trade and other unit-based metrics are included where applicable.

