
Blending mandates turn CBG plant orders into a build cycle
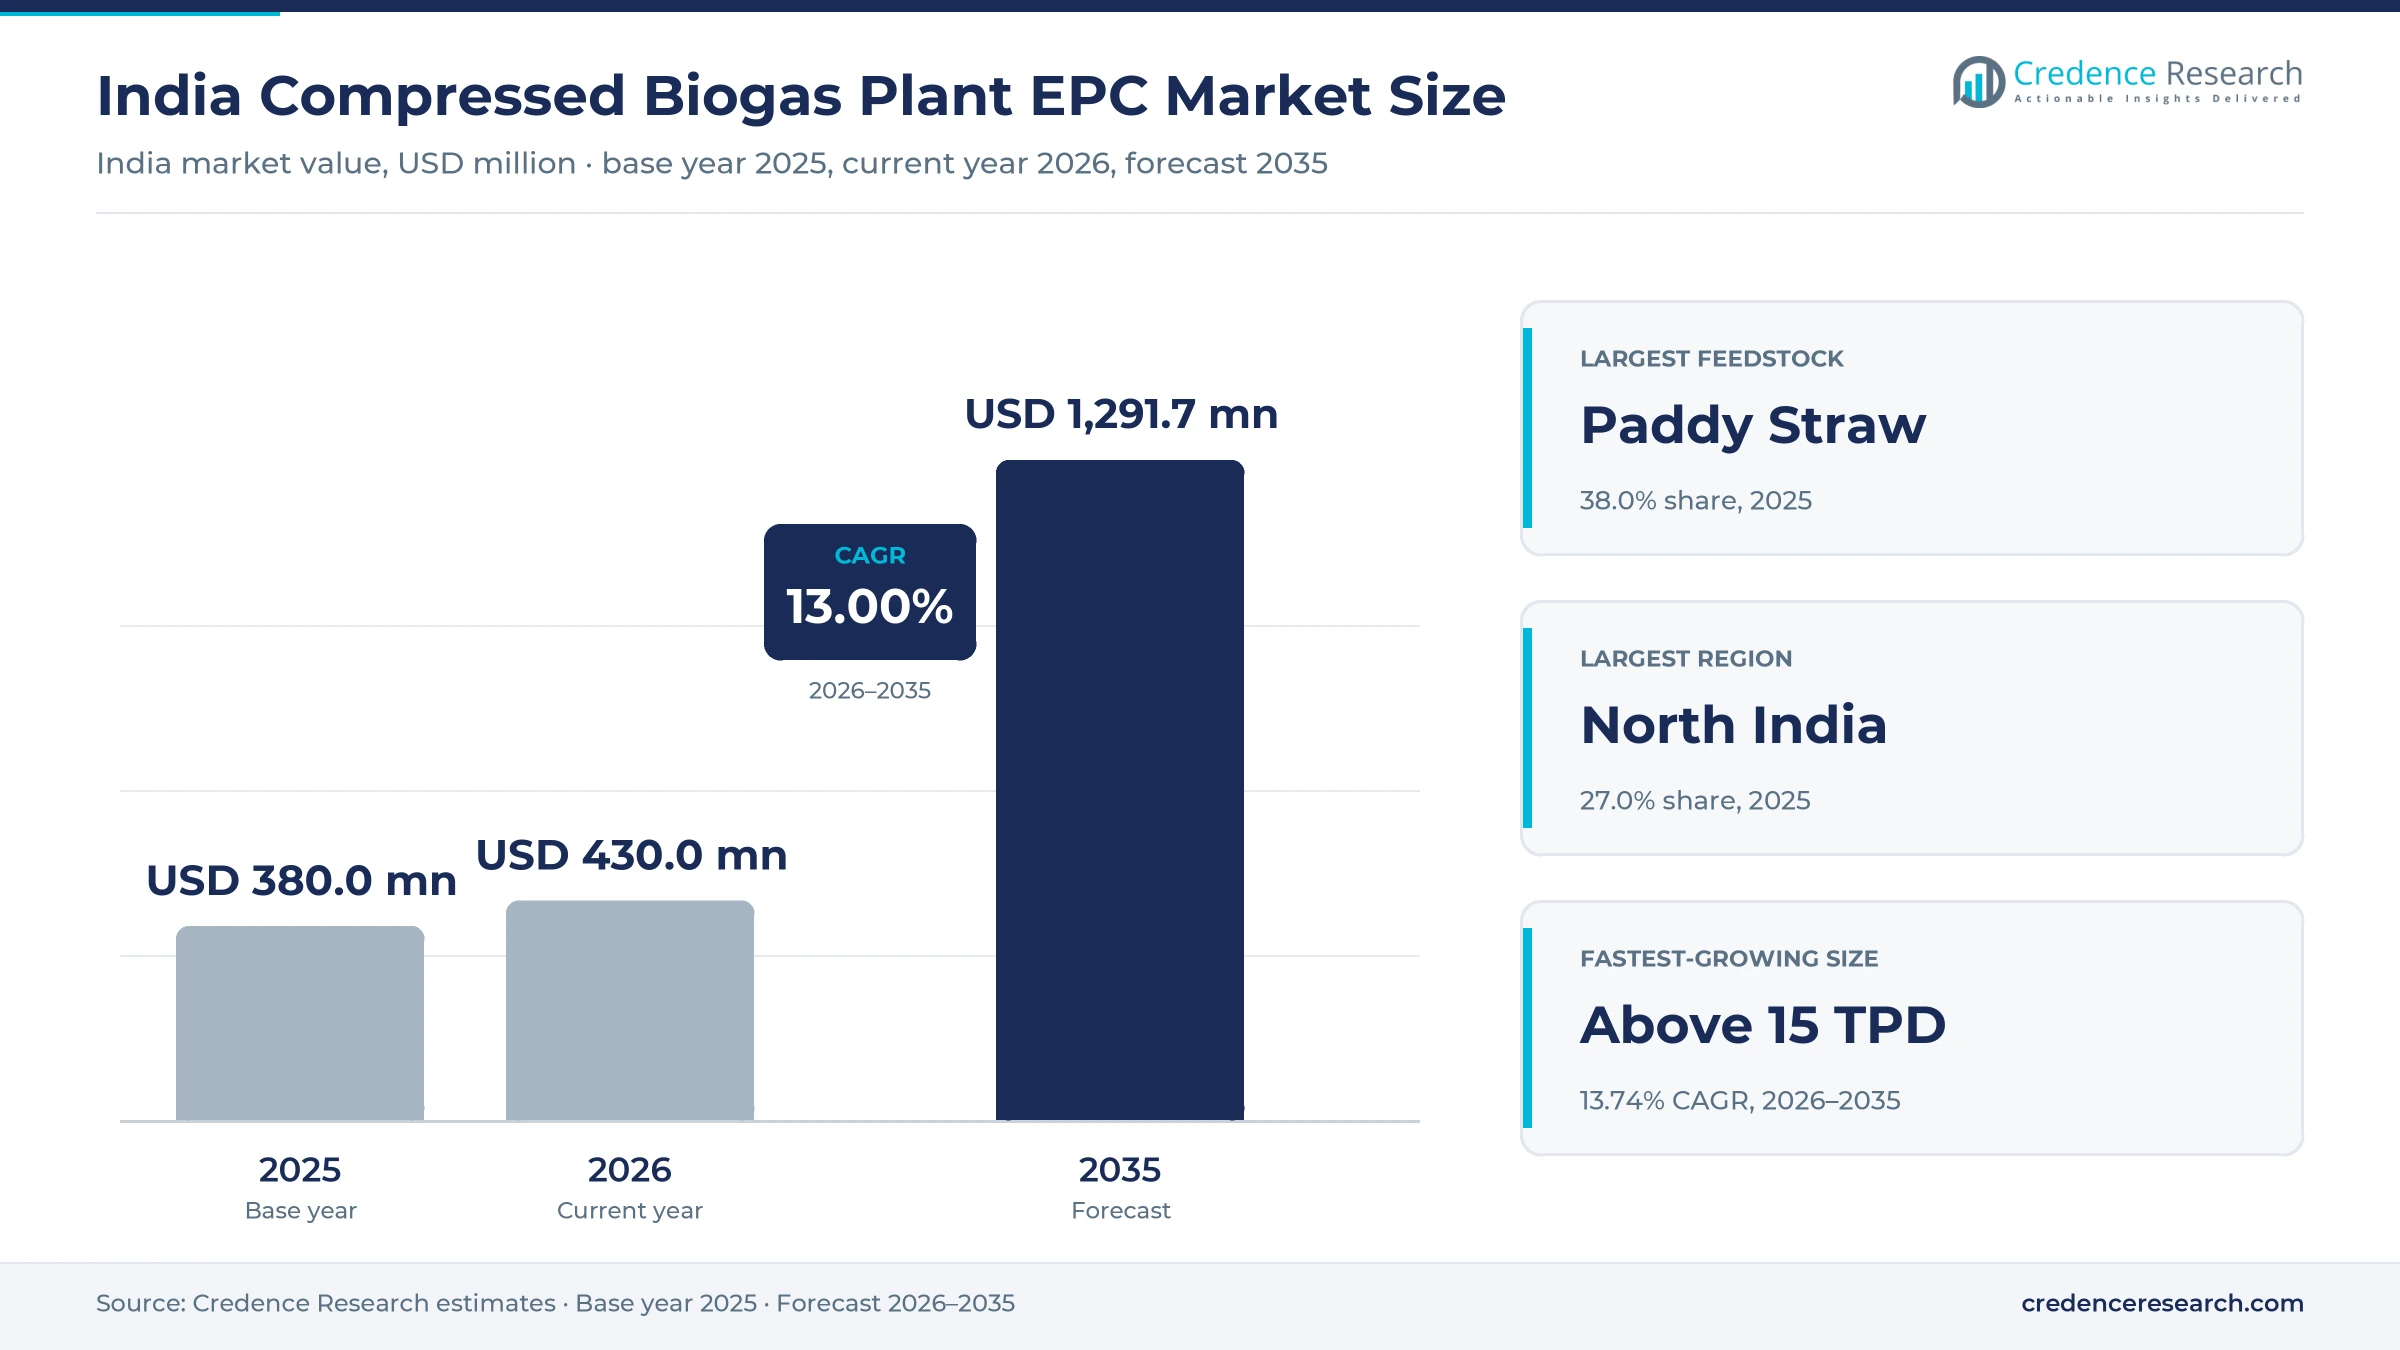
The India compressed biogas plant EPC market was valued at USD 380.0 million in 2025 and is projected to increase from USD 430.0 million in 2026 to USD 1.29 billion by 2035, registering a CAGR of 13.00% during 2026–2035. Demand comes from fuel retailers, gas distributors and developers that must add capacity as the compressed biogas obligation on city gas consumption climbs each year through fiscal 2028-29. North India held the largest regional share, 27.0% in 2025, because Uttar Pradesh, Haryana and Punjab combine straw, sugar mills and dense gas networks. Northeast India is the fastest-growing region at 13.62% a year from a small base, as Oil India and Numaligarh Refinery open municipal waste projects there. The main commercial change came on Aug. 6, 2026, when the Union Cabinet approved a ten-year national scheme with capital assistance per ton of daily capacity, which shifts contract awards toward larger, bankable plants and gives contractors a longer order horizon.
What does compressed biogas plant EPC work include in India?
The market counts engineering, procurement, construction and commissioning contracts for plants that turn crop residue, press mud, municipal organic waste and cattle dung into compressed biogas. Contract scope usually covers feedstock handling, digesters, gas upgrading, compression, manure processing and plant controls. Buyers are oil marketing companies, GAIL, listed conglomerates and independent developers, which award lump-sum or technology-plus-construction packages.
The estimate excludes fuel sales, feedstock purchases, land and long-term operating fees unless they are bundled into the construction price. Household digesters and small rural biogas units also fall outside the market. In the value chain, technology owners license digester designs, contractors build the plant, and fuel retailers or gas distributors buy the output under offtake terms.
India Compressed Biogas Plant EPC Market Insights
- The India compressed biogas plant EPC market rises from USD 380.0 million in 2025 to USD 1.29 billion by 2035, a 13.00% CAGR during 2026–2035.
- North India held 27.0% of 2025 value, supported by Uttar Pradesh, which led the country on built plants according to BioEnergy Times in September 2025.
- Paddy Straw led feedstocks with 38.0% of 2025 value, because straw plants carry large handling and digester packages per ton of daily output.
- The GOBARdhan portal listed 1,908 registered plants, 217 commissioned and 339 under construction on Aug. 6, 2026, which frames the contract pipeline for builders.
- Oil company ventures are widening the buyer base, with an IOCL joint venture raising Rs 836 crore in September 2025 for nine paddy straw plants.
Paddy straw and mid-sized plants anchor contract value
Why does paddy straw hold the largest contract value?
Based on feedstock, the market is categorized into paddy straw, press mud, municipal solid waste and cattle dung. Paddy Straw led with 38.0% of 2025 value because straw plants need heavy handling and long digestion, and Power Line put capital cost at Rs 75-80 million per ton of daily output in August 2025. Municipal Solid Waste grows fastest at 13.77% a year as city contracts reach construction, with BPCL inaugurating a 150-ton-per-day Brahmapuram plant by April 2026, according to Indian Infrastructure. Press mud follows through sugar mill clusters, and Indian Infrastructure reported 125 tons a day feeding a 5 TPD plant at Halkarni in February 2026.
Which plant sizes attract the most contract spending?
Based on capacity, the market is categorized into below 5 TPD, 5-15 TPD and above 15 TPD plants. 5-15 TPD led with 48.0% of 2025 value because the installed base is mid-sized, with 132 SATAT plants averaging about seven tons a day at the 920 TPD reported by Energetica India in January 2026. Above 15 TPD grows fastest at 13.74% a year as developers told Power Line in August 2025 that viability starts near 15 TPD, and Verbio already runs a 33 TPD straw plant in Punjab, according to an ANI report of September 2025. Smaller units persist through dairy projects such as the 1.5-ton Banas plant.
Why do private developers still award most plants?
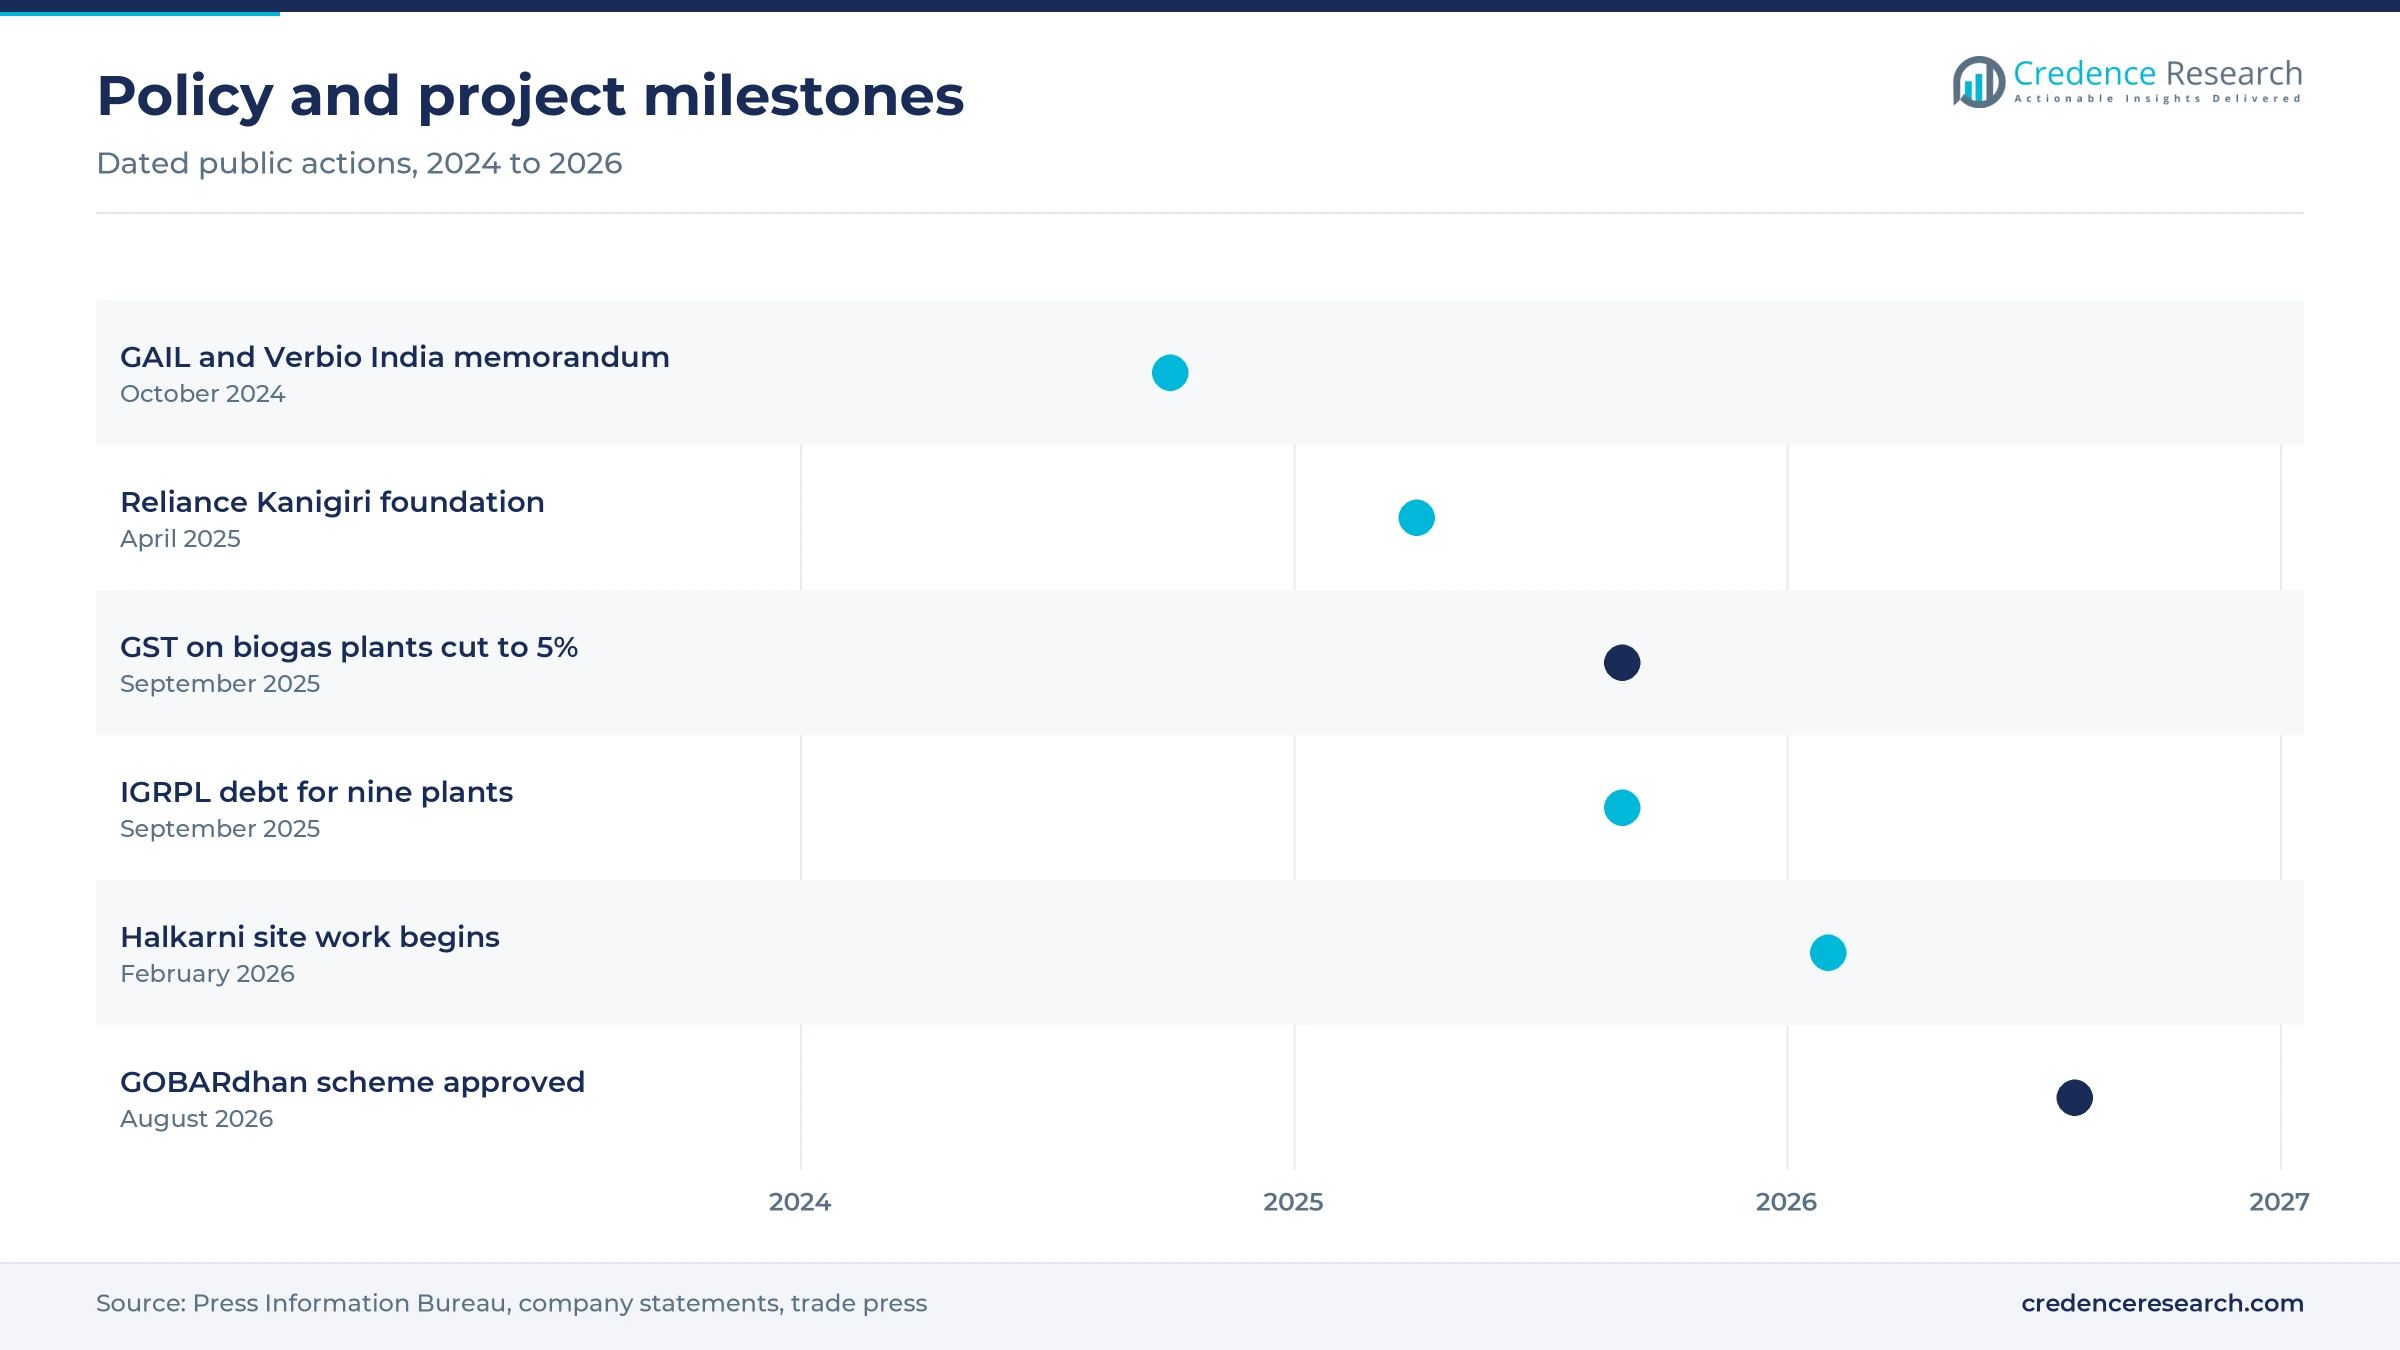
Based on developer, the market is categorized into OMCs and GAIL and private developers. Private Developers led with 68.0% of 2025 value because independent and conglomerate sponsors hold the largest programs, including the Rs 65,000 crore plan for 500 Reliance plants in Andhra Pradesh reported by Free Press Journal in April 2025. OMCs and GAIL grows fastest at 13.67% a year as state companies move from buying gas to owning plants. BPCL formed an 8-to-10-plant venture with GPS Renewables in April 2025, according to Indian Chemical News, while GAIL signed a greenfield memorandum with Verbio India in October 2024, as Power Line reported that month.
| Segment Group | Leading Sub-segment | Share, 2025 | Fastest-growing Sub-segment | CAGR, 2026–2035 |
|---|---|---|---|---|
| By Feedstock | Paddy Straw | 38.0% | Municipal Solid Waste | 13.77% |
| By Capacity | 5-15 TPD | 48.0% | Above 15 TPD | 13.74% |
| By Developer | Private Developers | 68.0% | OMCs and GAIL | 13.67% |
Request a Free Sample
Fill in your details and we'll send you a free sample report.
- Sample data tables & charts
- Research methodology
Mandates, waste contracts and offtake lift plant orders
Compressed biogas mandates support new plants
Compressed biogas mandates and feedstock monetization lift construction demand because gas distributors must now source a rising share of renewable gas. The Press Information Bureau reported that the obligation stands at 3% in fiscal 2026-27, 4% in fiscal 2027-28 and 5% from fiscal 2028-29. BioEnergy Times, citing the Petroleum and Natural Gas Regulatory Board in August 2026, put the implied requirement at 1.03 million standard cubic meters a day in fiscal 2027 and 2.07 million by fiscal 2029. Commissioned plants produced only 0.4 million in August 2026, so the gap has to be filled by new construction. In the Credence Research model this adds about 5.85 percentage points to annual growth to 2035.
Waste supply agreements create project pipelines
Municipal and agricultural waste supply agreements create project pipelines because a signed feedstock source makes a plant financeable and ready for tender. HPCL plans Rs 159 crore at Bhagalpur under a 25-year arrangement with the municipal corporation, according to Indian Masterminds in October 2026, using 135 tons of wet waste a day. EverEnviro processes 550 tons of segregated organic waste daily with Indore Municipal Corporation for 20 TPD of output, as Energetica India reported in July 2025. Bihar is also giving four oil and gas companies free land for 25 years, according to Quantum Commodity Intelligence in August 2026. In the Credence Research model this adds about 3.25 percentage points to annual growth to 2035.
Offtake contracts and standard designs cut risk
Offtake contracts and EPC standardization reduce execution risk because lenders can price a repeatable plant against a known gas buyer. The August 2026 scheme set an administered price of Rs 2,110 per million British thermal units, or Rs 105 a kilogram, for at least ten years. Repetition is also visible in contract packaging, since IGRPL is financing nine identical 15 TPD plants, as Entrepreneur India reported in October 2025. REnergy Dynamics said in February 2026 that it handled technology, EPC and operations for a Nagothane plant that exceeded its 21 TPD design output. In the Credence Research model this adds about 2.08 percentage points to annual growth to 2035.
Capital assistance and lower tax improve budgets
Capital assistance and lower tax improve plant budgets, which brings marginal projects to the point of a construction award. The new scheme pays up to Rs 2 crore per TPD for eligible greenfield plants, compared with Rs 4 crore per 4.8 TPD and a Rs 10 crore project cap that the Indian Biogas Association described in January 2026. Goods and services tax on biogas plants and devices fell from 12% to 5% on Sept. 22, 2025, according to a report in The Week. The scheme also offers credit guarantees of up to 85% on eligible loans for smaller business sponsors, which widens the pool of developers able to sign contracts with builders.
Bundled contracts and energy crops reshape plant scope
Shift toward bundled design, build and operate contracts
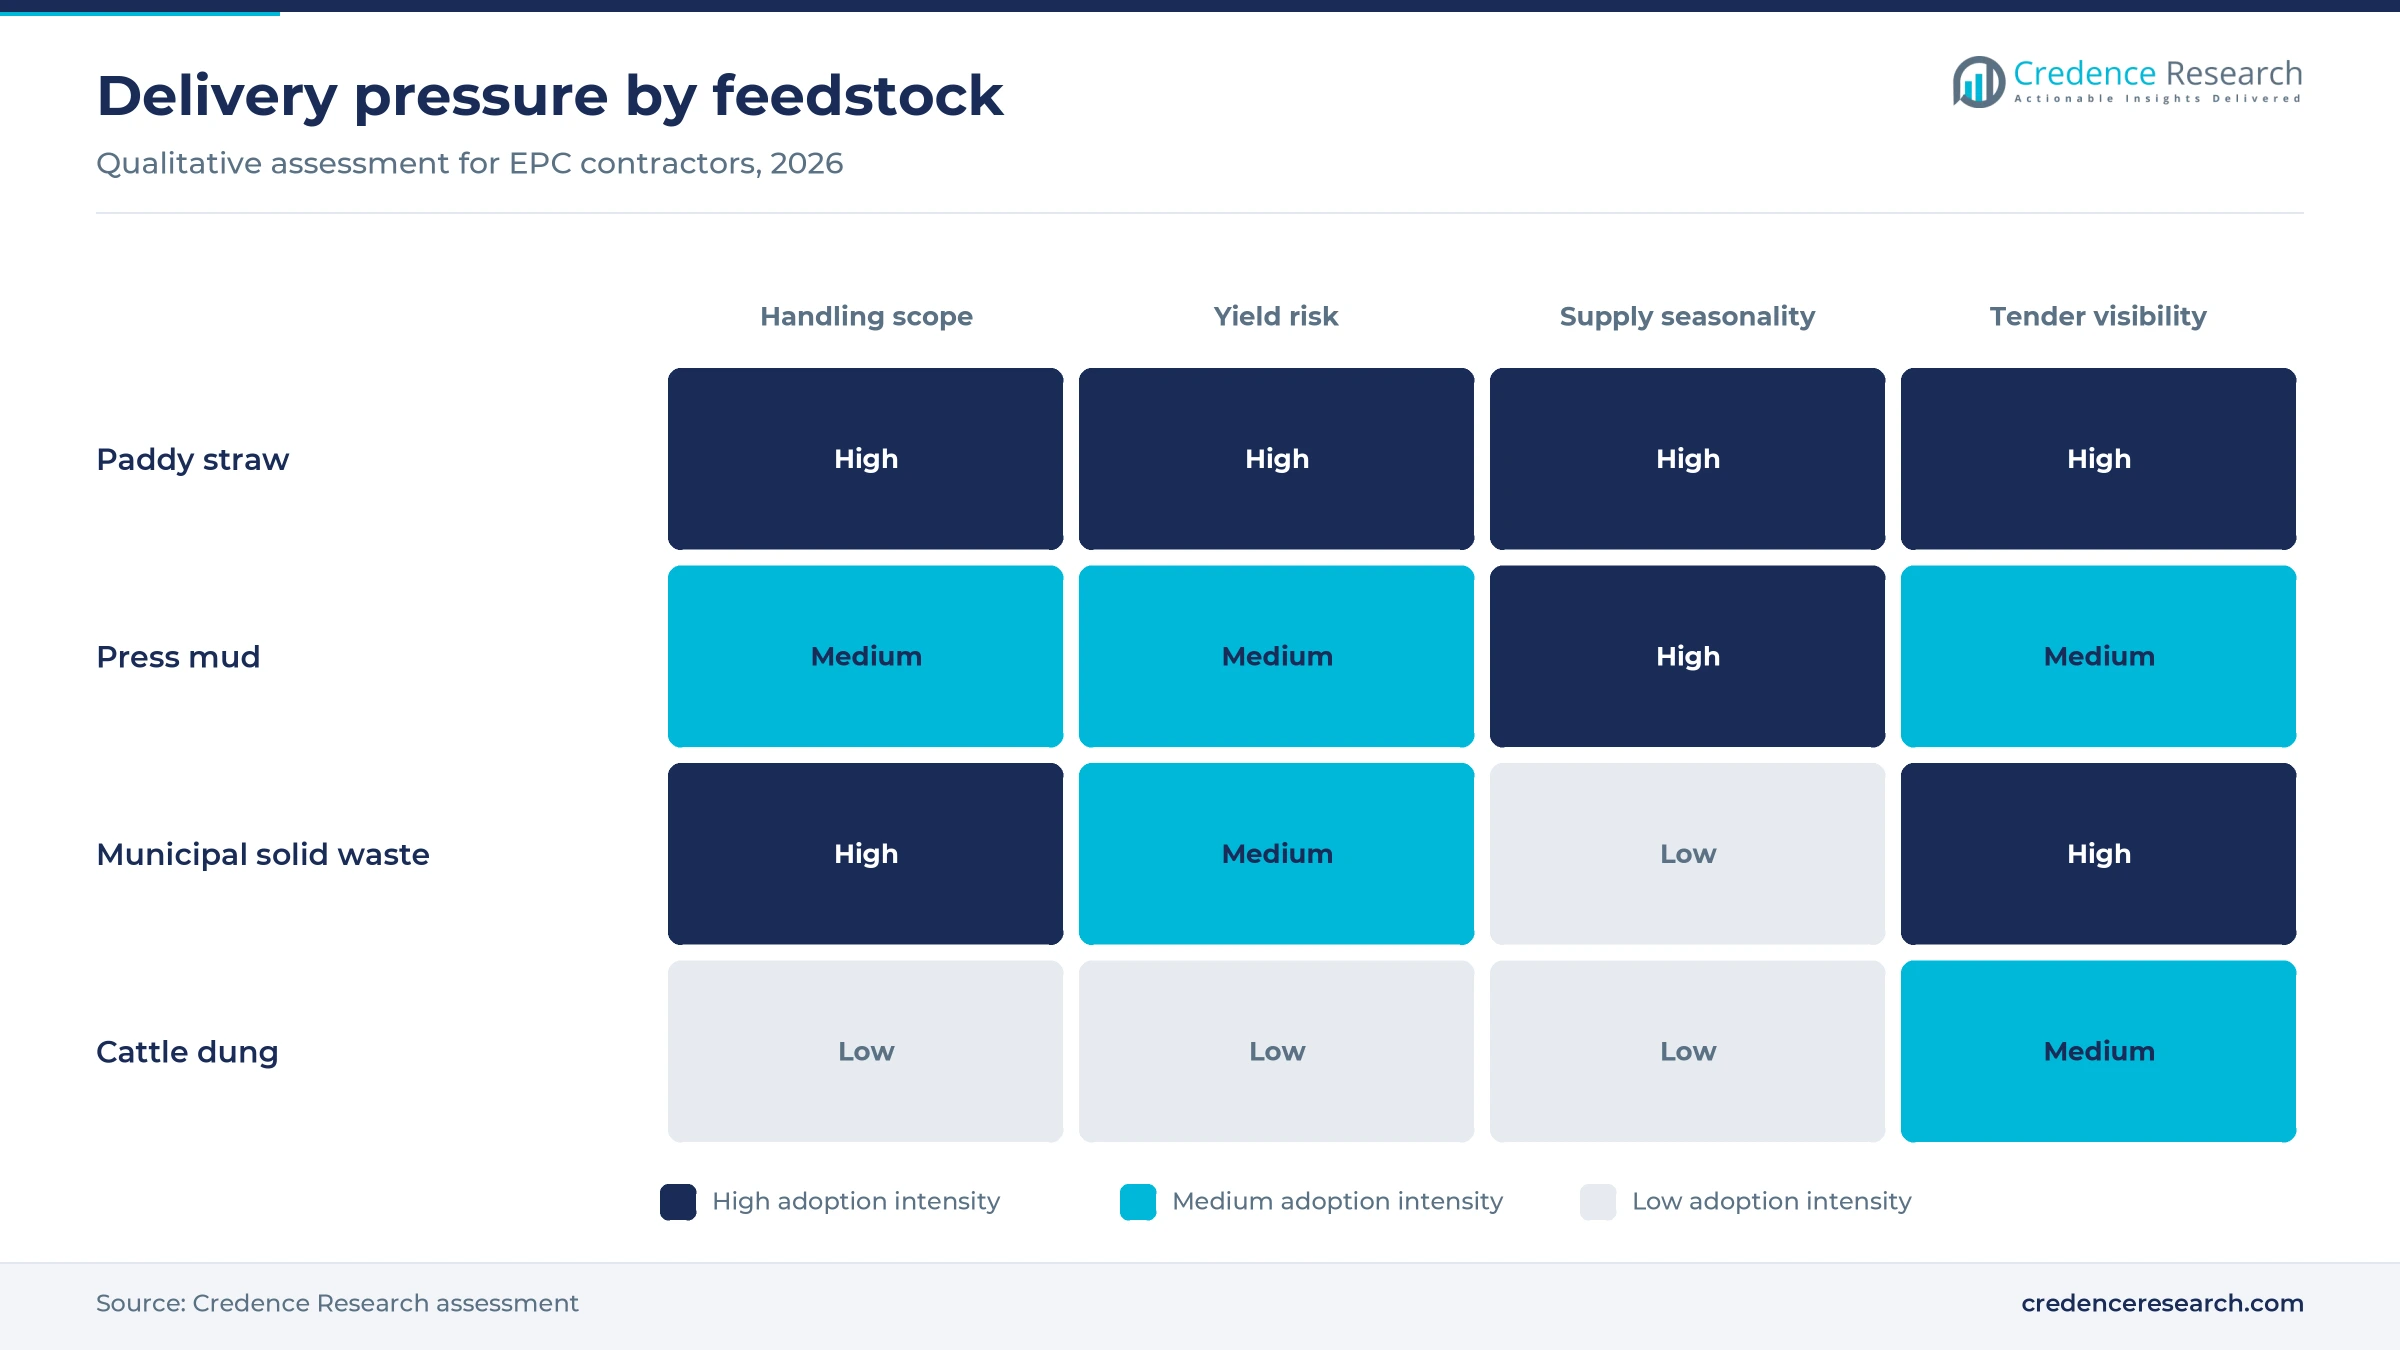
Buyers are shifting from separate equipment orders toward bundled contracts that place delivery and performance with one party. Adani Total Gas sought EPC bids in May 2024 for a 500-ton-per-day municipal waste plant at Pirana, covering design, construction and operation with a 12-month build period, according to IamRenew. Thermax won an order above USD 60 million for five bio-CNG plants across four states in December 2023, as Natural Gas World reported. REnergy Dynamics also took on operations at Nagothane alongside its construction role. This shift favors contractors with process guarantees, because a sponsor can then show lenders a single accountable party and a defined output level.
Rise of Napier grass and mixed feedstock designs
Developers are moving beyond single residues as seasonal supply pushes plants toward mixed feedstock and purpose-grown crops. Reliance Bio Energy laid the foundation for a Rs 139 crore plant at Kanigiri in April 2025 on 497 acres, using Napier grass grown on dryland, according to Free Press Journal. The Nagothane plant takes Napier grass, press mud cake, cow dung, paddy straw, bagasse and cane trash, based on the REnergy Dynamics statement. Paddy straw prices also ranged from Rs 2,800 a ton in Punjab to Rs 3,600 a ton in Chhattisgarh in Power Line data from August 2025. Mixed designs therefore raise pretreatment scope and require more flexible digesters from contractors.
Opening in grid connection and injection packages
Pipeline connection is an opening for contractors that can add gas conditioning, metering and spur lines to the plant package. The central pipeline infrastructure scheme carries Rs 994.5 crore, yet only about Rs 56.31 crore had been sanctioned by August 2026, according to the Press Information Bureau. Cascades still carried 65.7% of reported offtake against 8.9% through pipelines in the regulator data published by BioEnergy Times, which leaves ample room for grid injection work. Support under the scheme reaches Rs 287.5 million per project for up to 75 km, as Power Line reported. Sponsors seeking grid-quality biomethane supply would therefore pay for integrated connection scopes.
Opening in manure processing and value-added units
Manure processing is a second opening because co-products now receive direct support and improve plant returns. Market development assistance pays Rs 1,500 per ton on fermented organic manure, with Rs 111.72 crore released up to February 2026, according to the Press Information Bureau. Verbio produces 650 tons of bio-manure a day alongside its 33 TPD of gas in Punjab, and BPCL expects 28 tons a day at Brahmapuram, which shows the handling volume involved. As organic fertilizers gain policy support, contractors can sell drying, enrichment and packaging units with the plant. The scheme also counts manure processing assets within eligible capital support, which strengthens that sales case.
Grid links, capex and feedstock handling delay projects
Plants without planned pipeline connectivity
BioEnergy Times reported in August 2026 that 405 plants have no pipeline link planned, including 257 under construction. This matters to contractors because cascade logistics limit how much gas a site can sell, which delays later phases and final payments. Actual blending in fiscal 2026 also reached 0.9% against the 1% target, showing the supply shortfall. Sponsors can reduce this risk by adding connection surveys and evacuation plans before any EPC notice to proceed.
Rising capital costs and lender caution
Capital costs have risen by more than 50% since the 2014 launch of central assistance, the Indian Biogas Association said in January 2026. Higher budgets make small and first-time sponsors harder to finance, and TKIL Industries wrote in EPC World in August 2025 that banks remain wary of untested models. Contractors can face slower financial closure and renegotiated prices as a result. Standard plant designs and the new 85% credit guarantee can reduce this exposure for smaller borrowers over time.
Paddy straw handling and seasonal supply
Paddy straw is hard to process because its moisture varies widely, and poor segregation of organic waste can damage digesters, according to the EPC World article by TKIL Industries in August 2025. Rice straw plants also need about 12.5 tons of feedstock per ton of gas, as BioEnergy Times noted in September 2025. Builders therefore carry performance risk when yields fall short of design. Pretreatment trials, larger storage yards and supply contracts signed before construction help limit that risk.
Partial offtake guarantees and small plant economics
Offtake guarantees of 50% are inadequate for many mid-sized plants, TKIL Industries argued in EPC World in August 2025, and developers want full cover in early years. The same article said a retail-model plant below 5 TPD costs nearly twice as much as a direct injection design. Developers told Power Line that plants under 10 TPD are largely unviable without heavy subsidy, which shrinks that order pool. Contractors can respond by steering clients toward clustered sites and larger standard units.
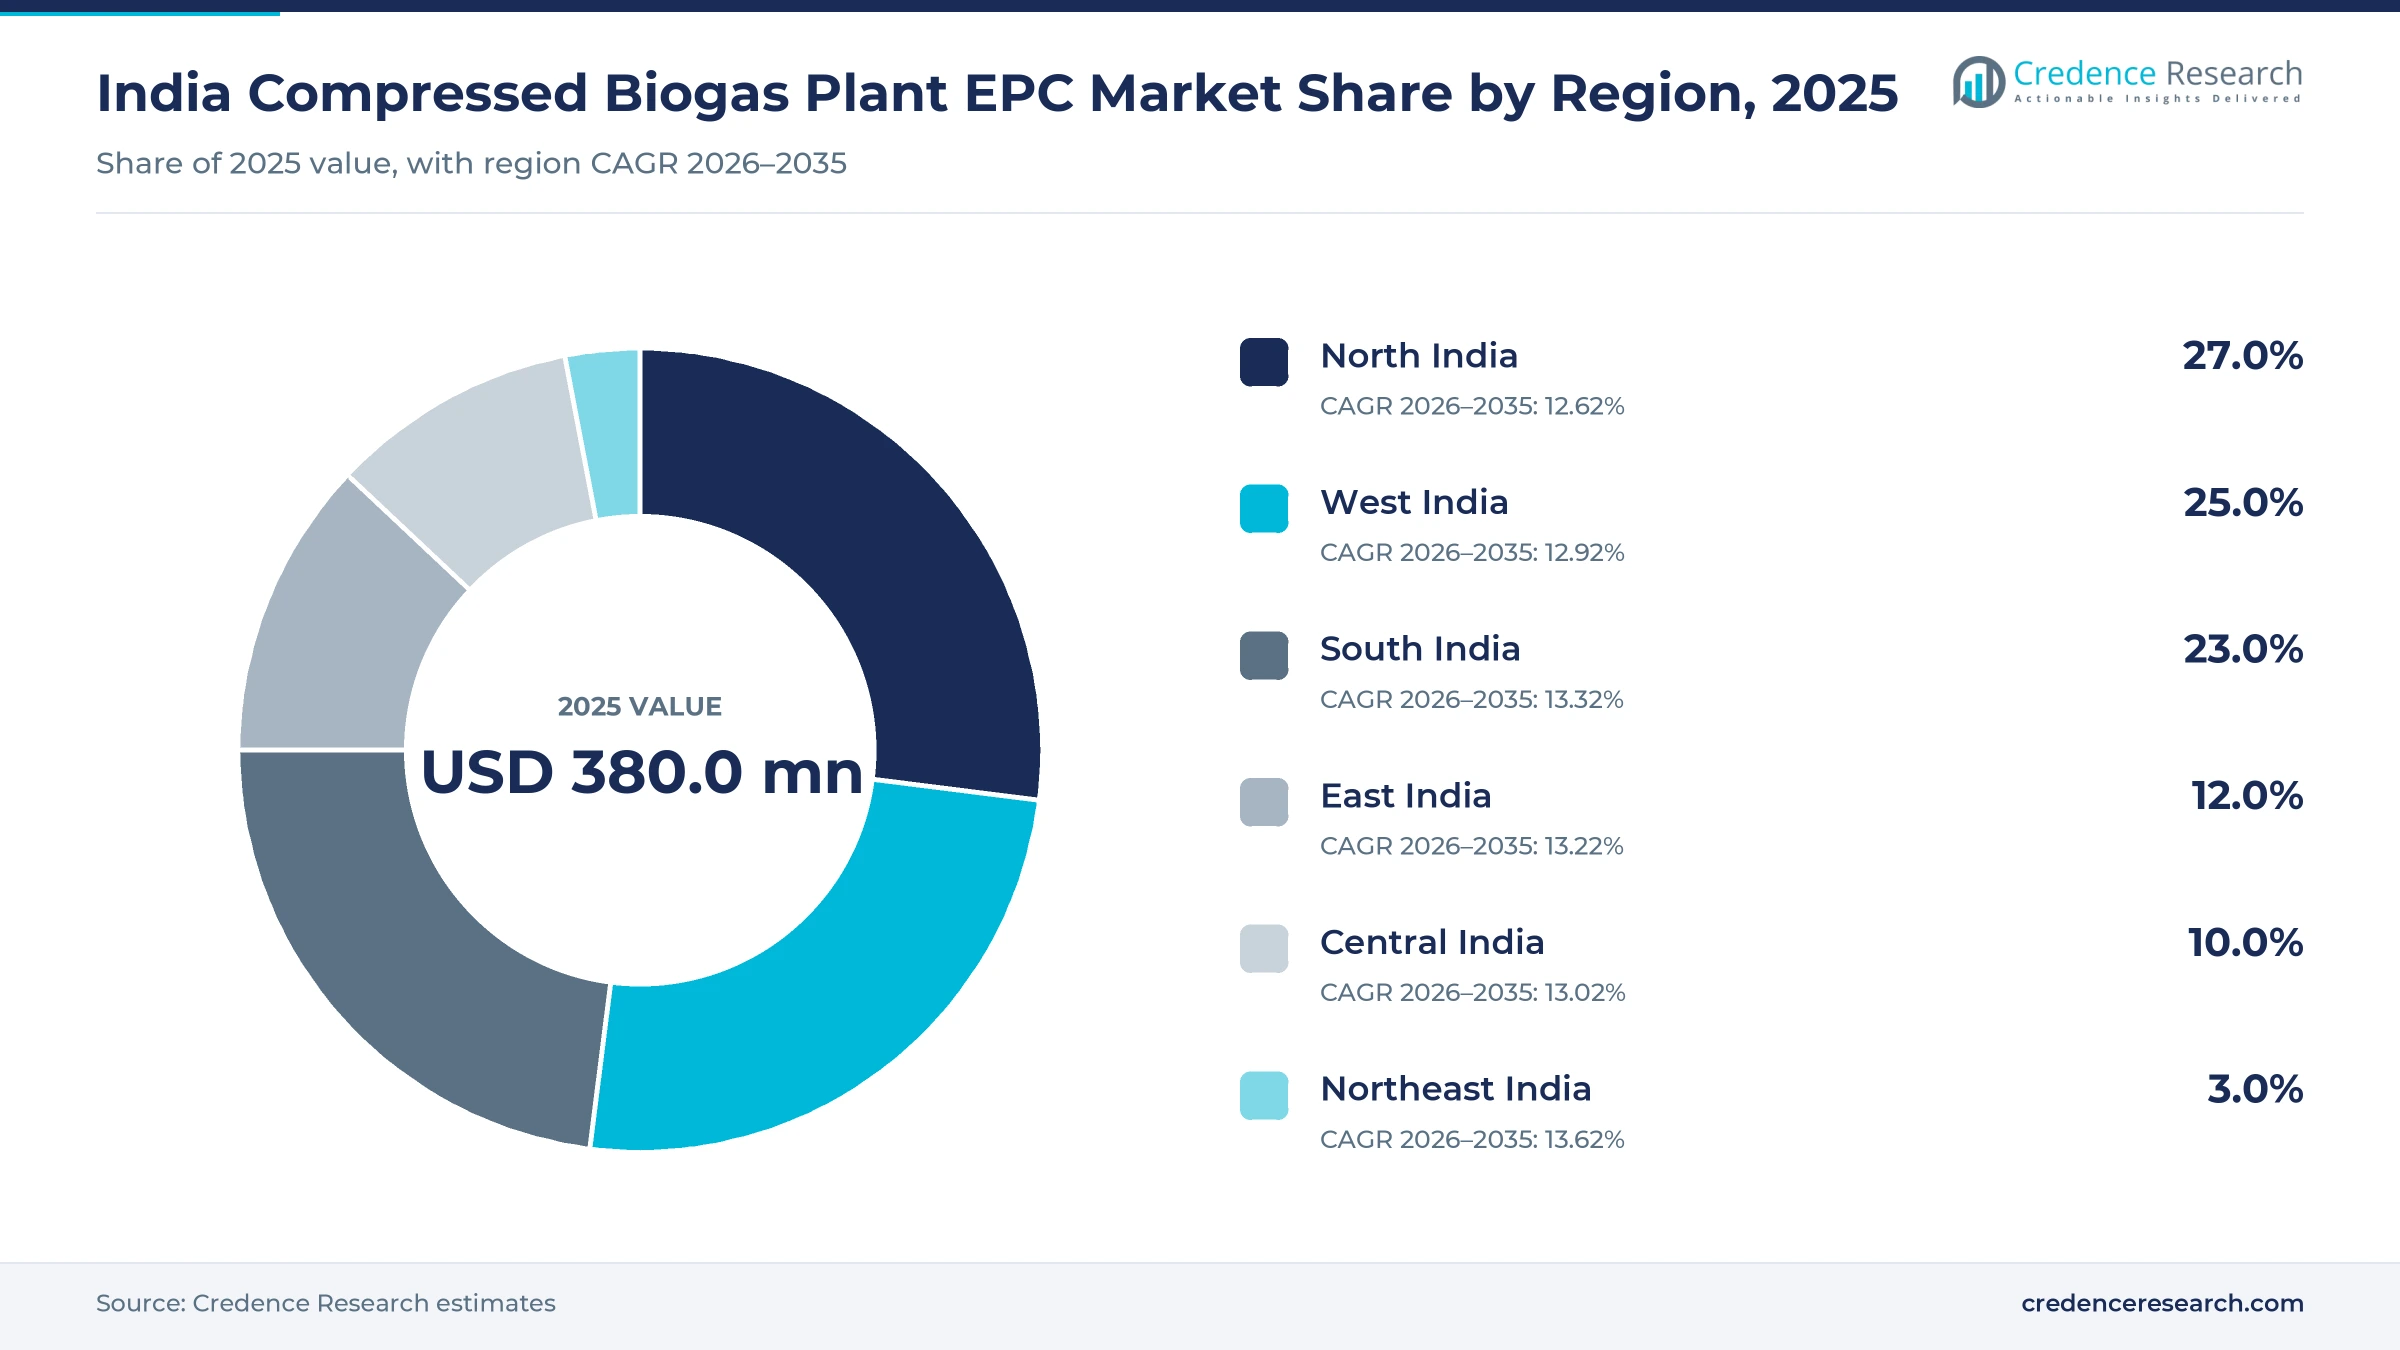
North India leads as southern programs gather pace
| Region | Value, 2025 (USD million) | Share, 2025 | CAGR, 2026–2035 |
|---|---|---|---|
| North India | 102.6 | 27.0% | 12.62% |
| West India | 95.0 | 25.0% | 12.92% |
| South India | 87.4 | 23.0% | 13.32% |
| East India | 45.6 | 12.0% | 13.22% |
| Central India | 38.0 | 10.0% | 13.02% |
| Northeast India | 11.4 | 3.0% | 13.62% |
North India leads on straw, press mud and dense gas networks
North India held 27.0% of 2025 value and grows at 12.62% a year, supported by Uttar Pradesh, Haryana and Punjab. Uttar Pradesh had 251 registered projects, 37 built plants and 61 under construction, according to BioEnergy Times in September 2025. EverEnviro also runs two 10 TPD press mud plants at Balrampur and Lakhimpur Kheri, as IamRenew reported in April 2024. Four of the nine IGRPL plants are planned for Haryana and three for Uttar Pradesh, which keeps straw contracts concentrated here.
West India gains from Gujarat dairy and Maharashtra press mud
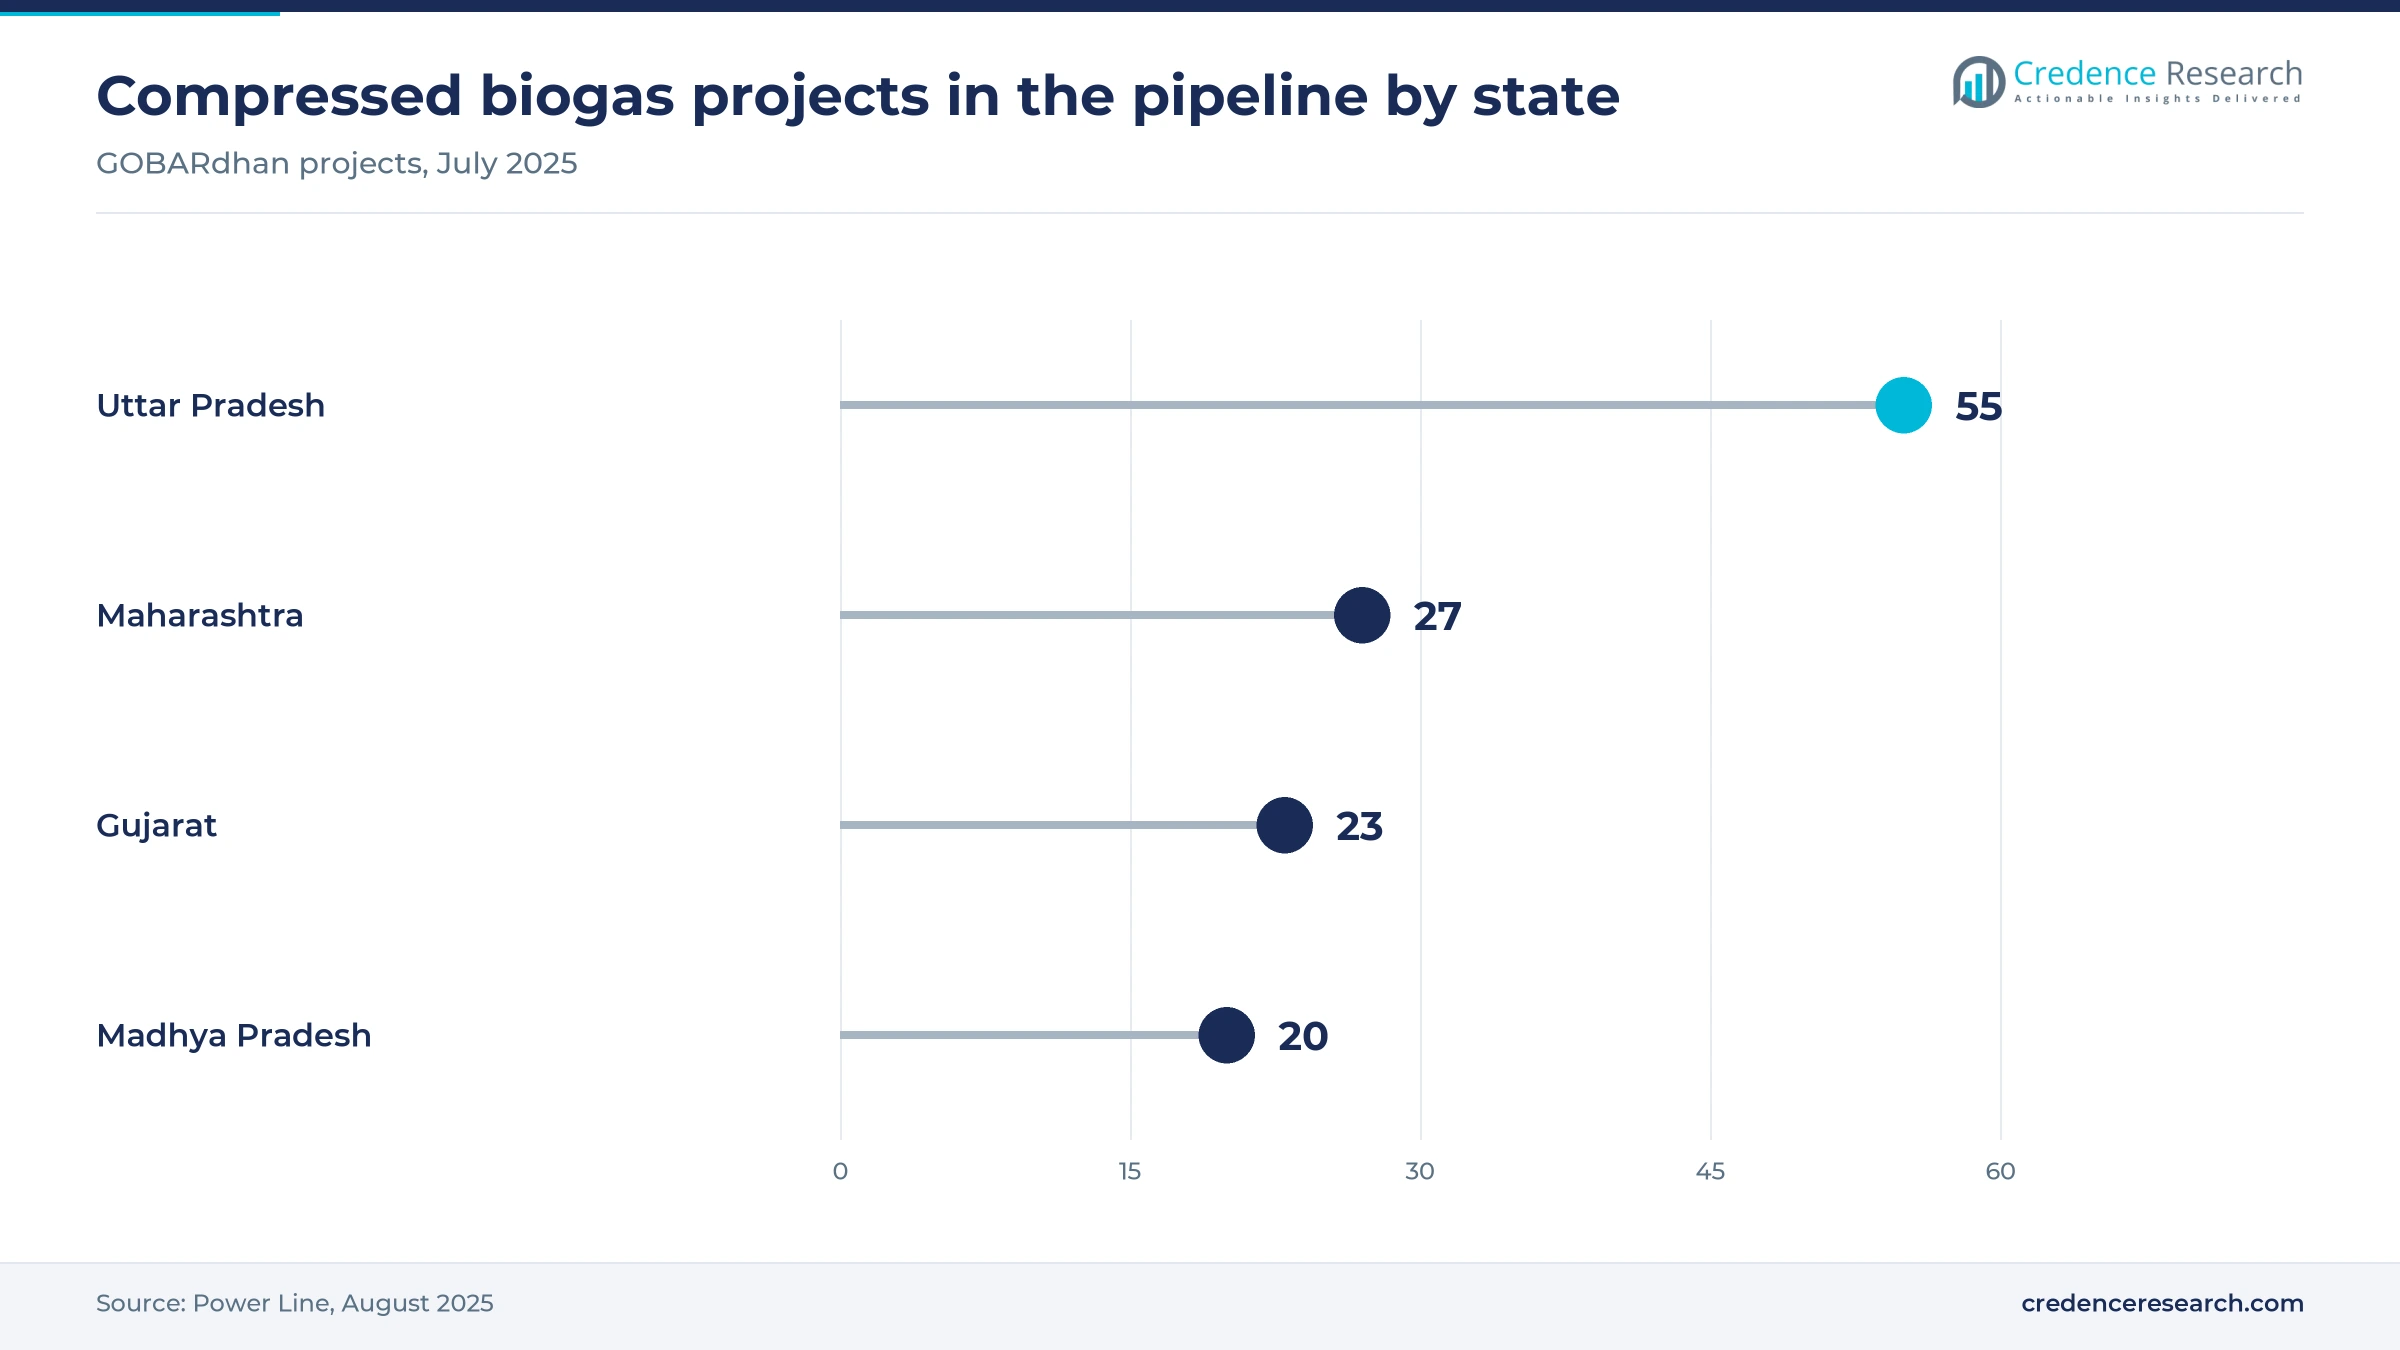
West India held 25.0% of 2025 value and grows at 12.92% a year, helped by Gujarat and Maharashtra. Power Line counted 27 pipeline projects in Maharashtra and 23 in Gujarat in July 2025, with Gujarat second on operating plants at 20. Suzuki opened a Banaskantha plant using up to 100 tons of cow dung on Dec. 6, 2025, based on its company release. Sugar belts add press mud work, including the Halkarni project in Kolhapur district, while Pirana adds city waste scope.
South India grows through large Andhra Pradesh commitments
South India held 23.0% of 2025 value and grows at 13.32% a year, the result of large private commitments and municipal plants. Andhra Pradesh hosts the first Reliance site at Kanigiri and one of the IGRPL plants, while BPCL built the Brahmapuram plant in Kerala to produce about 5.6 tons of gas a day. Contract flow here depends heavily on the pace of the Reliance program, which makes South India the zone with the widest range of outcomes.
East India builds on Bihar waste and residue programs
East India held 12.0% of 2025 value and grows at 13.22% a year, built on a growing list of municipal and residue projects. Bihar approved four plants in four cities in August 2026, and HPCL is preparing its Bhagalpur project on municipal waste. BPCL and GPS Renewables also named Bihar, Odisha and West Bengal among the sites for their venture, according to Indian Chemical News in April 2025, citing agricultural biomass and fit with BPCL gas distribution areas.
Central India pairs municipal scale with straw supply
Central India held 10.0% of 2025 value and grows at 13.02% a year, led by Madhya Pradesh and Chhattisgarh. Power Line counted 20 pipeline projects in Madhya Pradesh in July 2025, and the Indore plant remains the reference for large municipal waste contracts. One IGRPL straw plant is planned for Chhattisgarh, although delivered straw there is the costliest in the Power Line comparison, so plants in this zone need careful feedstock planning before construction begins.
Northeast India starts small with oil company projects
Northeast India held 3.0% of 2025 value and grows at 13.62% a year, the fastest rate from the smallest base. Oil India and Numaligarh Refinery are setting up about 8 to 10 plants across Assam and neighboring states, IamRenew reported in May 2024, with municipal waste collection partnerships underway. Hedge5 also signed a memorandum with Assam in March 2025 for five 5 TPD plants, as Indian Infrastructure reported, which would give contractors a small regional reference base.
Scheme approvals and oil company ventures set the pace
| Development | Status and market relevance |
|---|---|
| In August 2026, the Union Cabinet approved GOBARdhan with a Rs 23,731 crore outlay for fiscal 2026-27 to fiscal 2035-36. | Approved, sets capital assistance and an administered price |
| In July 2026, Oil India said it would deploy up to Rs 4,000 crore to build 25 compressed biogas plants, according to Business Today. | Announced, adds a state-owned buyer of construction work |
| In February 2026, Engineers India started site activities for a 5 TPD press mud plant at Halkarni in Maharashtra, according to Indian Infrastructure. | Under way, with output going to HPOIL Gas |
| In September 2025, IGRPL, the IOCL and GPS Renewables venture, signed Rs 836 crore of debt with Indian Bank for nine plants. | Financed, spanning Haryana, Uttar Pradesh, Chhattisgarh and Andhra Pradesh |
| In April 2025, Reliance Bio Energy began work on the Kanigiri plant, the first of 500 planned in Andhra Pradesh. | Foundation laid, Napier grass feedstock |
Digester design and gas upgrading decide plant returns
- Digester design sets the straw and press mud limits, and Praj Industries offered its dual plug flow design for the HPCL Badaun rice straw project reported in March 2021.
- Pretreatment protects yield from mixed residue, which matters because the Adani Total Gas tender at Pirana specified waste pretreatment and hydrolysis tanks.
- Gas upgrading separates methane from carbon dioxide through pressure swing adsorption, water scrubbing or gas separation membranes, and the choice sets power use.
- Carbon dioxide capture creates a further sales stream, and the Pirana tender included liquefaction and storage within its contract scope in May 2024.
Need a Custom Version of This Report?
Tailor the scope, geography, or segments to your exact requirements.
- Custom geography or segment scope
- Direct access to our analyst team
Technology owners and oil companies shape contracting
Competition splits between technology owners that sell process guarantees and engineering groups that deliver civil, mechanical and electrical scope. Praj Industries won a rice straw order from HPCL at Badaun, reported in March 2021, that covered 35,000 tons of feedstock a year. Thermax competes on multi-plant packages, as its five-plant order showed in December 2023. Verbio India and EverEnviro integrate design with plant ownership, which gives them operating data that contractors without their own sites lack. IOCL and BPCL act mainly through joint ventures with GPS Renewables, so vendors must qualify with the venture as well as the parent company. GAIL shapes demand through its Verbio memorandum and through the synchronization scheme, under which it reported 249 producers and 39 distribution entities in November 2025. Buyers compare guaranteed gas yield, delivery time and references on the same feedstock more closely than headline price.
Companies profiled and their roles in this market
| Company | Type | Role in the market |
|---|---|---|
| Praj Industries | Technology and EPC supplier | Won the HPCL Badaun rice straw order with its RenGas technology, reported March 2021 |
| Thermax | Plant supplier | Won an order above USD 60 million for five bio-CNG plants in December 2023 |
| Verbio India | Developer and technology owner | Runs a 33 TPD plant in Punjab and reports about 10 more plants in its pipeline |
| EverEnviro | Developer and operator | Operates the Indore plant and two press mud plants in Uttar Pradesh |
| IOCL | Oil marketing company | Partner in IGRPL, which is financing nine 15 TPD paddy straw plants |
| BPCL | Oil marketing company | Formed an 8-to-10-plant venture with GPS Renewables and built the Brahmapuram plant |
| GAIL | Gas utility | Signed a greenfield memorandum with Verbio India in October 2024 |
Contractors with feedstock skills hold the advantage
Credence Research's view is that the 2026 scheme changes India compressed biogas plant EPC from a subsidy-driven series of small projects into a longer build cycle, although delivery will decide who benefits. Contractors with proven performance on paddy straw and mixed waste should win a premium, because yield shortfalls have been the main concern for lenders and sponsors. Oil company ventures will likely widen the qualified buyer pool over the next three years. The largest uncertainty is pace, since the registered pipeline of 1,908 plants is far above commissioning so far, and grid links remain thin. Bidders should therefore prioritize sponsors with signed feedstock and a confirmed evacuation route.
How the plant construction estimate was built
The report uses 2025 as the base year and 2026 to 2035 as the forecast period. Market values come from the Credence Research model, which applies plant completions, average capacity and capital cost per unit of capacity to an estimated construction share of project spending. Regional, feedstock, capacity and developer splits are Credence Research estimates informed by public plant records and announced projects. Sources include Press Information Bureau releases, regulator data as reported in the trade press, International Energy Agency analysis, company statements and trade publications. No interviews or surveys were conducted for this edition, and company order values appear only where publicly reported.
A ten-year scheme supports steady plant awards to 2035
From 2026 to 2035 the India compressed biogas plant EPC market should expand steadily as the top obligation tier takes effect and the ten-year scheme keeps capital support available. The International Energy Agency expects combined Indian biogas and compressed biogas output to rise 21% from 2024 to 2030, citing a fast-growing project pipeline despite slower-than-expected progress. Contract awards should move toward larger plants and repeat designs, while municipal waste projects gain share. Spending would slow if grid links or feedstock supply lag, but the administered price and credit guarantee should keep sponsors committed to plant construction through the forecast period.
Frequently Asked Questions
How big is the India compressed biogas plant EPC market?
What is driving plant construction in India?
Which feedstock leads the market?
Which plant size is largest by value?
Which region holds the largest share?
What does the 2026 GOBARdhan scheme offer plant sponsors?
What are the main execution risks for contractors?
Who are the main companies in this market?
Table of Content
Chapter 1 Market Segmentation
- 1.1 Segmentation Framework
- 1.1.1 Product and Service Classification
- 1.1.2 Application and End-Use Classification
- 1.1.3 Technology and Solution Classification
- 1.1.4 Customer and Distribution Channel Classification
- 1.1.5 Geographic Segmentation
- 1.1.6 Market Segment Definitions and Boundaries
- 1.2 By Feedstock
- 1.2.1 Paddy Straw
- 1.2.2 Press Mud
- 1.2.3 Municipal Solid Waste
- 1.2.4 Cattle Dung
- 1.3 By Capacity
- 1.3.1 Below 5 TPD
- 1.3.2 5-15 TPD
- 1.3.3 Above 15 TPD
- 1.4 By Developer
- 1.4.1 OMCs and GAIL
- 1.4.2 Private Developers
Chapter 2 Introduction
- 2.1 Report Objectives and Scope
- 2.2 Product Definition and Industry Terminology
- 2.3 Market Inclusions and Exclusions
- 2.4 Research Process
- 2.4.1 Primary Research and Expert Interviews
- 2.4.2 Secondary Research and Source Review
- 2.4.3 Top-Down and Bottom-Up Estimation
- 2.4.4 Data Triangulation and Verification
- 2.5 Market Size Measurement Basis
- 2.5.1 2025: USD 380.0 million → 2035: USD 1.29 billion
- 2.6 Historical and Forecast Reference Periods
- 2.6.1 Historical Period: 2018-2025
- 2.6.2 Base Year: 2025
- 2.6.3 Forecast Period: 2025-2035
- 2.7 Research Assumptions and Limitations
Chapter 3 Executive Summary
- 3.1 Market Snapshot and Key Findings
- 3.2 Base-Year Market Size, 2025
- 3.3 Forecast Market Size, 2035
- 3.4 Revenue and Volume Growth Outlook
- 3.5 Key Demand and Supply Indicators
- 3.6 Leading Market Segments
- 3.7 Fastest-Growing Market Opportunities
- 3.8 Regional Performance Highlights
- 3.9 Technology and Industry Transformation
- 3.10 Competitive Landscape Summary
- 3.11 Analyst View and Strategic Implications
Chapter 4 India Compressed Biogas Plant EPC Market Trends and Developments
- 4.1 Historical Industry Development, 2018-2025
- 4.2 Recent Market Trends and Developments
- 4.3 Demand and Customer Behavior Trends
- 4.4 Technology and Product Innovation
- 4.5 Artificial Intelligence, Automation and Digitalization
- 4.6 Local Manufacturing and Supply Chain Realignment
- 4.7 Industry Partnerships, Mergers and Acquisitions
- 4.8 Sustainability and Circular Economy Developments
- 4.9 Government and Private Sector Investment Trends
- 4.10 Emerging Business Models and Commercialization
- 4.11 Industry Developments and Announcements
Chapter 5 India Compressed Biogas Plant EPC Market Production, Supply and Demand Analysis
- 5.1 Demand Trend and Consumption Analysis, 2018-2025
- 5.2 Demand Forecast, 2025-2035
- 5.3 Production and Output Trend, 2018-2025
- 5.4 Production and Output Forecast, 2025-2035
- 5.5 Installed Capacity and Capacity Utilization
- 5.6 Company-Wise Production Plants and Statistics
- 5.6.1 Installed Production Capacity
- 5.6.2 Actual Production
- 5.6.3 Planned Capacity and Expansion Targets
- 5.7 Supply Chain Structure and Procurement Trends
- 5.8 Supply-Demand Gap and Bottlenecks
- 5.9 Import Dependence and Sourcing Structure
- 5.10 Contract Manufacturing and Outsourcing
- 5.11 Regional Supply and Demand Concentration
Chapter 6 India Compressed Biogas Plant EPC Market Pricing Analysis
- 6.1 Pricing Structure and Measurement
- 6.2 Historical Pricing Trends, 2018-2025
- 6.3 Pricing Outlook, 2025-2035
- 6.4 Average Selling Price and Unit Economics
- 6.5 Pricing by Product and Market Segment
- 6.6 Geographic Pricing Differences
- 6.7 Key Input, Energy, Labor and Logistics Costs
- 6.8 Contract Pricing and Purchasing Models
- 6.9 Pricing Sensitivity and Competitive Positioning
- 6.10 Price, Margin and Profitability Implications
Chapter 7 India Compressed Biogas Plant EPC Market Dynamics
- 7.1 Market Growth Drivers
- 7.1.1 Demand-Side Drivers
- 7.1.2 Technology and Innovation Drivers
- 7.1.3 Infrastructure and Investment Drivers
- 7.1.4 Regulatory and Policy Drivers
- 7.2 Market Restraints
- 7.2.1 Cost and Affordability Constraints
- 7.2.2 Technology and Adoption Barriers
- 7.2.3 Supply Chain and Operational Constraints
- 7.3 Market Challenges
- 7.3.1 Competitive Pressure and Margin Erosion
- 7.3.2 Skills, Infrastructure and Implementation Gaps
- 7.4 Emerging Market Opportunities
- 7.5 Market Dynamics Impact and Time-Horizon Assessment
Chapter 8 India Compressed Biogas Plant EPC Value Chain Analysis
- 8.1 Industry Value Chain Overview
- 8.2 Upstream Suppliers and Critical Inputs
- 8.3 Technology and Component Providers
- 8.4 Manufacturing or Service Delivery
- 8.5 Distribution, Channel Partners and Integrators
- 8.6 Downstream Applications and End Users
- 8.7 Value Addition and Profit Pools
- 8.8 Vertical Integration and Outsourcing
- 8.9 Supplier Concentration and Risk
- 8.10 Supply Chain Localization and Resilience
Chapter 9 India Compressed Biogas Plant EPC Market Regulations and Policies
- 9.1 Relevant Laws, Standards and Compliance Frameworks
- 9.2 Product, Service, Safety and Quality Requirements
- 9.3 Government Policies, Incentives and Subsidies
- 9.4 Imports, Exports and Trade Barriers
- 9.5 Public Procurement and Local Content Requirements
- 9.6 Environmental and Sustainability Compliance
- 9.7 Upcoming Policy Changes and Market Implications
Chapter 10 India Compressed Biogas Plant EPC Market Hotspots and Opportunities
- 10.1 Market Opportunity Mapping and Growth Hotspots
- 10.2 High-Growth Applications and Customer Groups
- 10.3 Underserved Markets and White-Space Opportunities
- 10.4 Emerging Technology and Product Opportunities
- 10.5 New Capacity and Investment Hotspots
- 10.6 Market Entry and Expansion Opportunities
- 10.7 Distribution and Partnership Opportunities
- 10.8 Near-Term and Long-Term Commercial Potential
- 10.9 Opportunity Attractiveness and Execution Risks
Chapter 11 India Compressed Biogas Plant EPC Market Outlook, 2025-2035
- 11.1 Market Size and Analysis
- 11.1.1 Revenue (Market Measurement: 2025: USD 380.0 million → 2035: USD 1.29 billion)
- 11.1.2 Market Volume and Quantity Sold
- 11.1.3 Historical Market Size, 2018-2025
- 11.1.4 Base-Year Market Size, 2025
- 11.2 Market Forecast, 2025-2035
- 11.2.1 Revenue Forecast to 2035
- 11.2.2 Volume Forecast to 2035
- 11.2.3 CAGR and Year-on-Year Growth
- 11.2.4 Incremental Revenue Opportunity
- 11.3 Forecast Assumptions and Scenario Analysis
- 11.3.1 Base-Case Forecast
- 11.3.2 Optimistic and Conservative Scenarios
- 11.3.3 Technology, Pricing and Policy Sensitivities
- 11.4 Market Attractiveness and Growth Outlook
Chapter 12 India Compressed Biogas Plant EPC Market Segmentation and Outlook
- 12.1 Segmentation Summary and Market Shares, 2025
- 12.2 Largest and Fastest-Growing Segments
- 12.3 By Feedstock - Market Size and Forecast, 2025-2035
- 12.3.1 Segment Definition and Scope
- 12.3.2 Historical Market Size, 2018-2025
- 12.3.3 Revenue Forecast, 2025-2035
- 12.3.4 Volume Forecast, 2025-2035
- 12.3.5 Base-Year Market Share, 2025
- 12.3.6 Segment CAGR and Growth Drivers
- 12.3.7 Subsegment Market Size and Forecast
- 12.3.7.1 Paddy Straw
- 12.3.7.2 Press Mud
- 12.3.7.3 Municipal Solid Waste
- 12.3.7.4 Cattle Dung
- 12.3.8 Subsegment Pricing and Adoption Trends
- 12.3.9 Leading Suppliers and Competition
- 12.3.10 Regional Demand and Opportunities
- 12.4 By Capacity - Market Size and Forecast, 2025-2035
- 12.4.1 Segment Definition and Scope
- 12.4.2 Historical Market Size, 2018-2025
- 12.4.3 Revenue Forecast, 2025-2035
- 12.4.4 Volume Forecast, 2025-2035
- 12.4.5 Base-Year Market Share, 2025
- 12.4.6 Segment CAGR and Growth Drivers
- 12.4.7 Subsegment Market Size and Forecast
- 12.4.7.1 Below 5 TPD
- 12.4.7.2 5-15 TPD
- 12.4.7.3 Above 15 TPD
- 12.4.8 Subsegment Pricing and Adoption Trends
- 12.4.9 Leading Suppliers and Competition
- 12.4.10 Regional Demand and Opportunities
- 12.5 By Developer - Market Size and Forecast, 2025-2035
- 12.5.1 Segment Definition and Scope
- 12.5.2 Historical Market Size, 2018-2025
- 12.5.3 Revenue Forecast, 2025-2035
- 12.5.4 Volume Forecast, 2025-2035
- 12.5.5 Base-Year Market Share, 2025
- 12.5.6 Segment CAGR and Growth Drivers
- 12.5.7 Subsegment Market Size and Forecast
- 12.5.7.1 OMCs and GAIL
- 12.5.7.2 Private Developers
- 12.5.8 Subsegment Pricing and Adoption Trends
- 12.5.9 Leading Suppliers and Competition
- 12.5.10 Regional Demand and Opportunities
- 12.6 Segment Growth Comparison
- 12.7 Segment Attractiveness and Priority Matrix
Chapter 13 India Compressed Biogas Plant EPC Geographic Market Outlook, 2025-2035
- 13.1 Domestic Market Distribution and Demand Clusters
- 13.2 State- or Province-Wise Market Size and Forecast, 2025-2035
- 13.3 City and Metropolitan Market Outlook
- 13.4 Industrial, Manufacturing and Commercial Clusters
- 13.5 Geographic Concentration of Key End Users
- 13.6 Local Pricing and Purchasing Differences
- 13.7 Domestic Production Facilities and Capacity Map
- 13.8 Local Infrastructure and Project Pipeline
- 13.9 State-Level Policy and Incentive Differences
- 13.10 Subnational Investment Hotspots and Opportunities
- 13.11 Distribution and Logistics Networks
- 13.12 Domestic Competitive Footprint
Chapter 14 India Compressed Biogas Plant EPC Technology, Innovation and Sustainability Outlook
- 14.1 Technology Landscape and Maturity
- 14.2 Product, Process and Service Innovation
- 14.3 AI, Automation and Digital Tools in the Industry
- 14.4 Technology Adoption and Performance Benchmarking
- 14.5 Innovation Pipeline and R&D Investment
- 14.6 Patent and Intellectual Property Trends
- 14.7 Energy Efficiency and Resource Management
- 14.8 Sustainability, Recycling and Circularity
- 14.9 Technology Roadmap, 2025-2035
- 14.10 Risks of Obsolescence and Technology Substitution
Chapter 15 India Compressed Biogas Plant EPC Market Key Strategic Imperatives
- 15.1 Growth and Market Entry Priorities
- 15.2 High-Return Products and Segments
- 15.3 Pricing, Profitability and Cost Optimization
- 15.4 Technology Investment and Product Differentiation
- 15.5 Supply Chain Localization and Resilience
- 15.6 Distribution and Customer Acquisition
- 15.7 Partnership, Acquisition and Capacity Strategy
- 15.8 Regional Expansion Priorities
- 15.9 Short-, Medium- and Long-Term Actions
Chapter 16 Competition Outlook
- 16.1 Industry Competition Characteristics
- 16.2 Market Structure and Concentration
- 16.3 Market Share and Competitive Positioning, 2025
- 16.4 Company-Wise Revenue and Product Benchmarking
- 16.5 Production and Service Capacity Benchmarking
- 16.6 Technology, Pricing and Differentiation
- 16.7 Regional Footprint and Distribution Strength
- 16.8 Mergers, Acquisitions and Strategic Alliances
- 16.9 New Entrants and Competitive Threats
- 16.10 Porter's Five Forces and Industry Attractiveness
- 16.11 Competitive Outlook, 2025-2035
Chapter 17 Company Profiles
- 17.1 Company Coverage and Selection Criteria
- 17.2 Praj Industries
- 17.2.1 Business Description
- 17.2.2 Company Ownership and Geographic Presence
- 17.2.3 Product and Service Portfolio
- 17.2.4 Manufacturing and Operating Footprint
- 17.2.5 Production Capacity and Expansion Plans
- 17.2.6 Financial Performance and Investment
- 17.2.7 Market Share and Competitive Position
- 17.2.8 Technology and Innovation Capabilities
- 17.2.9 Strategic Alliances or Partnerships
- 17.2.10 Recent Developments
- 17.2.11 Growth Strategy and Outlook
- 17.3 Thermax
- 17.4 Verbio India
- 17.5 EverEnviro
- 17.6 IOCL
- 17.7 BPCL
- 17.8 GAIL
- 17.9 Other Relevant Market Participants
Note: Every listed company is profiled on the structure shown under the first company. The company list is preliminary and may change based on research findings, market developments, data availability and client requirements.
Chapter 18 Disclaimer
- 18.1 Research and Forecast Disclaimer
- 18.2 Data Source and Estimation Limitations
Note: The depth of individual sections depends on data availability for this market. Volume, capacity, trade and other unit-based metrics are included where applicable.

