
Old fleets and long queues define regional buying
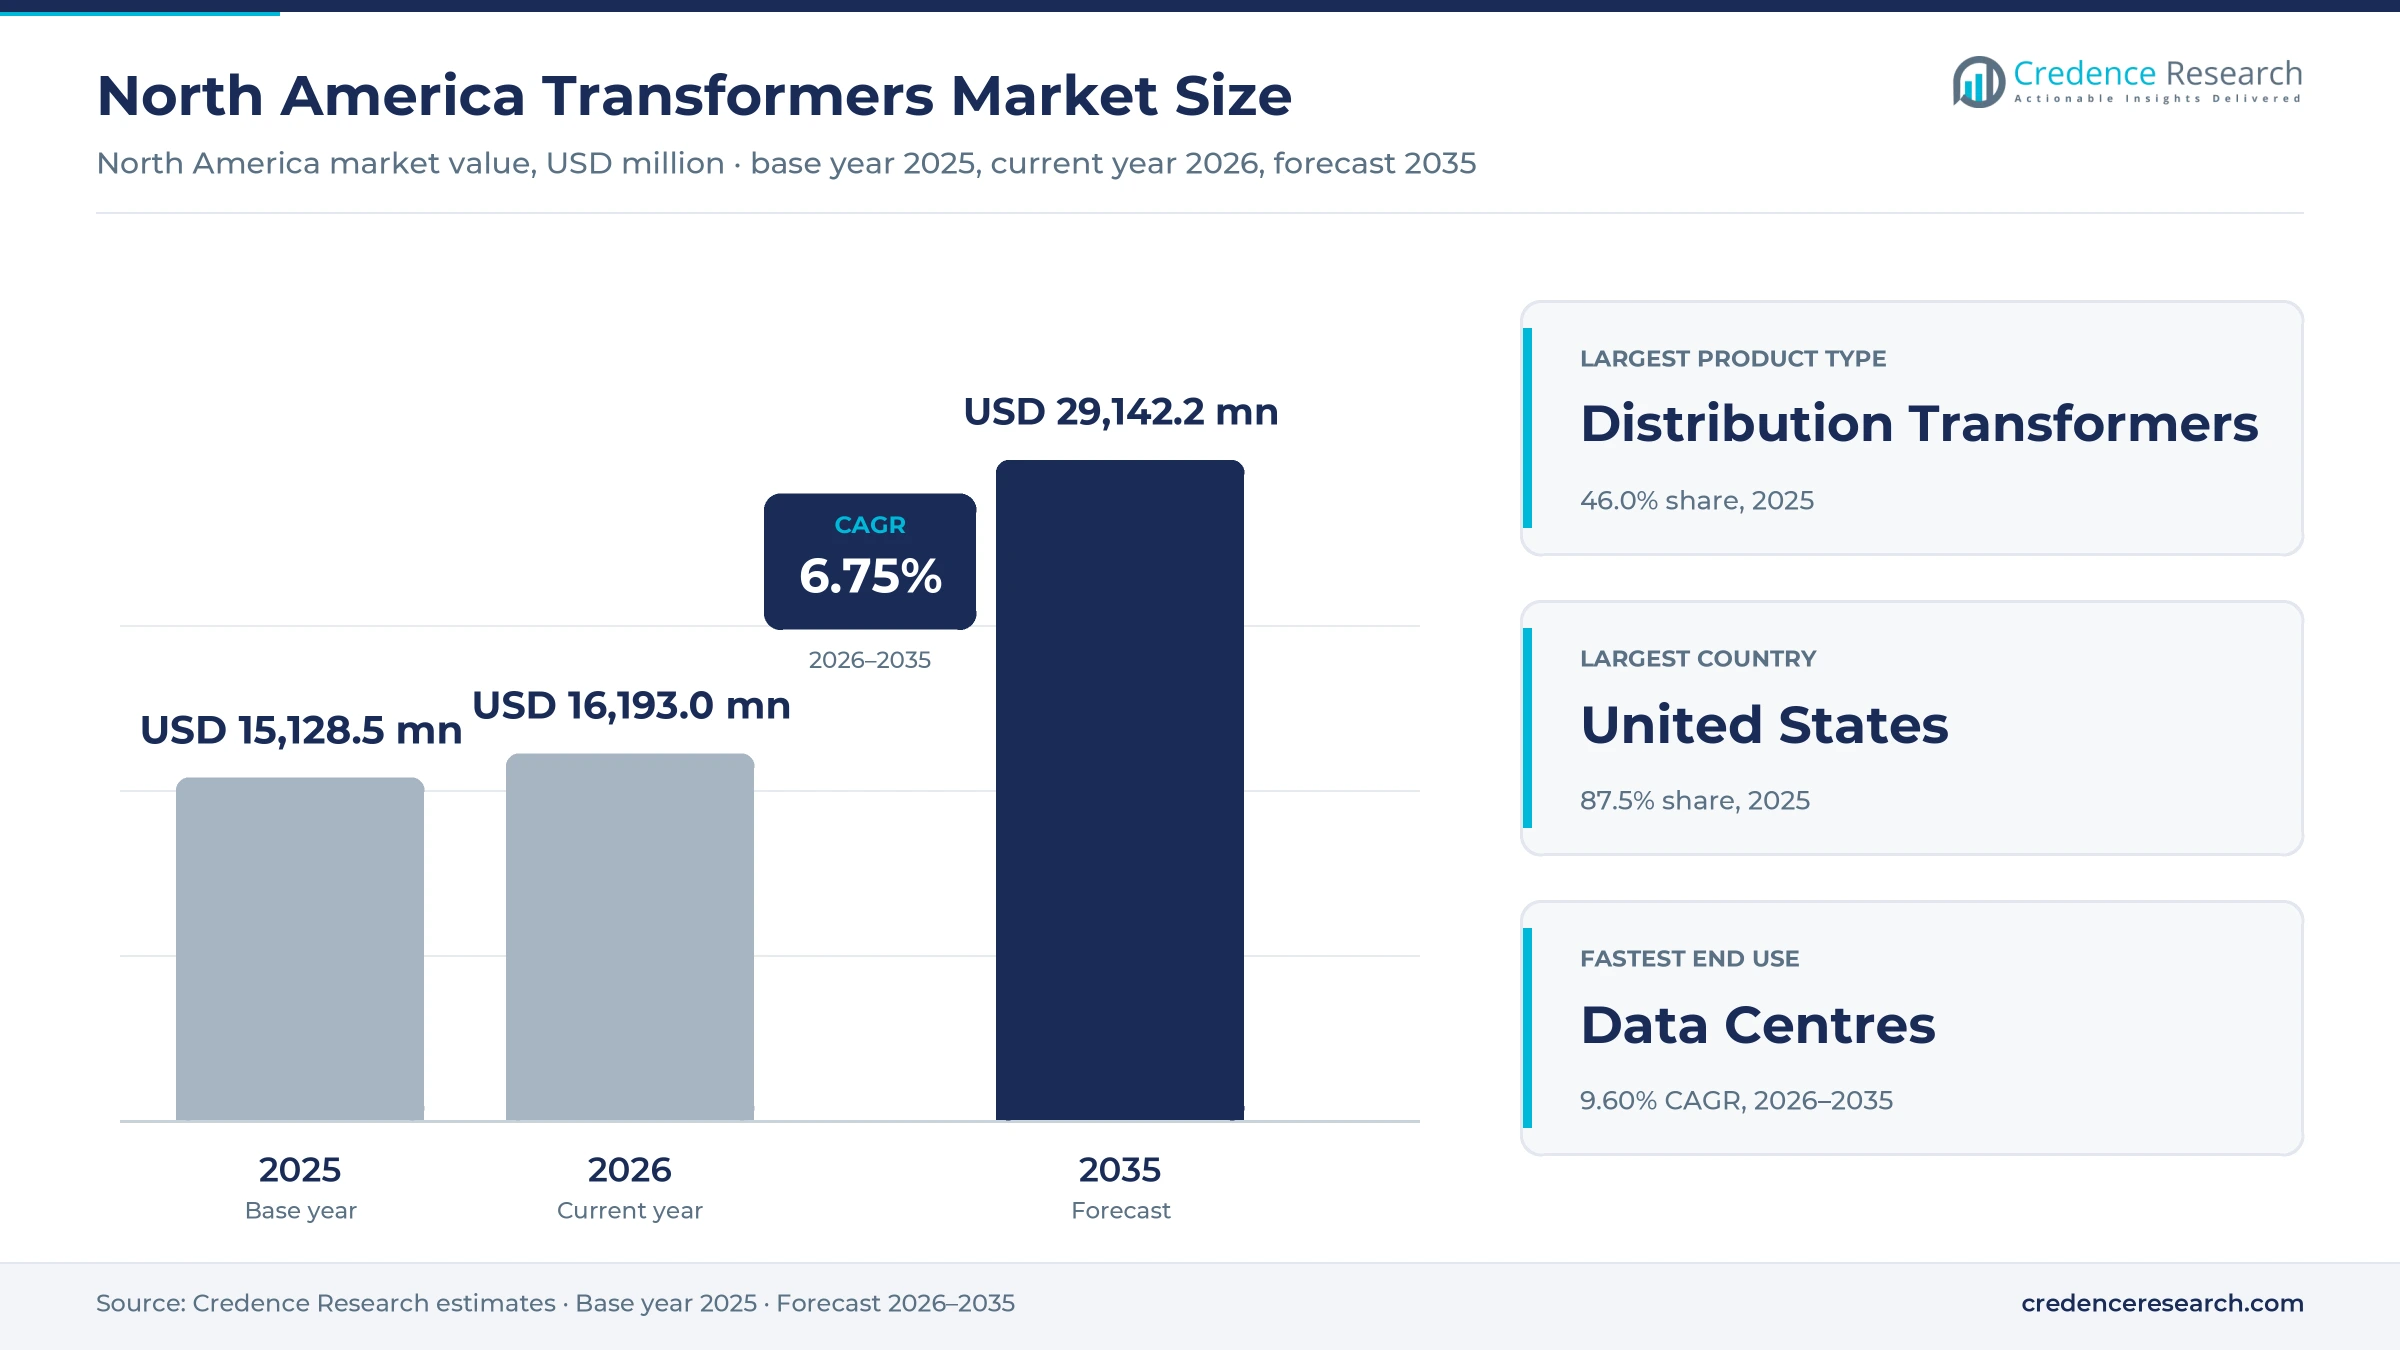
The North America transformers market was valued at USD 15.13 billion in 2025 and is projected to increase from USD 16.19 billion in 2026 to USD 29.14 billion by 2035, registering a CAGR of 6.75% during 2026–2035. Demand comes from utilities replacing aged distribution fleets, grid operators connecting new generation, and data center developers ordering large units years ahead of energization. The United States held the largest share, 87.5% in 2025, because its utility capital programs and hyperscale construction exceed those of its neighbors. Mexico is the fastest-growing country at 7.66% a year, supported by the federal utility CFE and its 2025–2030 transmission expansion plan. Supply remains the central commercial issue, as buyers in the region still depend heavily on imported large units while new factories in Virginia, South Carolina, North Carolina and Quebec move toward production. Tariffs introduced in August 2025 on steel and aluminum content have also changed how importers price and source finished equipment.
Which transformer sales count toward this estimate?
The market counts new distribution, power, instrument and specialty units sold in the United States, Canada and Mexico, in mineral-oil, ester-fluid, dry-type and gas-insulated designs. Values reflect sales through direct manufacturer contracts, electrical distributors, EPC supply packages and remanufacturers. Utilities buy most volume under multiyear frameworks, while data center owners and industrial sites usually buy by project.
Field repair labor, standalone monitoring software, switchgear and exports leaving the region are excluded from the estimate. The value chain runs from electrical steel, copper, insulation and bushings through winding and tanking factories to utilities and private asset owners. Core steel and large-unit test capacity are the tightest points in that chain today.
North America Transformers Market Insights
- The North America transformers market rises from USD 15.13 billion in 2025 to USD 29.14 billion by 2035, a 6.75% CAGR, as utilities replace aged units and large loads request new grid connections.
- The United States held 87.5% of 2025 value, and its imports of large liquid-filled units reached about $2.98 billion in 2024, according to World Bank WITS data.
- Distribution Transformers led product types with 46.0% of 2025 value, because NREL counts 60 million to 80 million such units in U.S. service.
- Ownership shifted on Feb. 2, 2026, when GE Vernova completed its $5.275 billion purchase of the remaining half of Prolec GE.
- Hitachi Energy, Eaton and Siemens Energy all target new regional capacity between 2027 and 2028, so buyers still face tight supply for several more years.
Distribution fleets lead while large units grow faster
Why distribution units lead and power units grow faster
Based on product type, the market is categorized into Distribution Transformers, Power Transformers, Instrument Transformers and Specialty Transformers. Distribution Transformers led with 46.0% of 2025 value because NREL counts 60 million to 80 million distribution units in U.S. service, which creates steady replacement orders. Power Transformers grow fastest at 7.28% a year as POWER magazine reported in January 2026 that demand had risen 119% since 2019. Hitachi Energy responded with about $457 million for a large-unit factory in South Boston, Virginia, announced on Sept. 4, 2025.
How grid owners and data centers split end-use demand
Based on end-use industry, the market is categorized into Power Generation and Networks, Data Centres, Manufacturing and Mining, and Buildings and Transport Infrastructure. Power Generation and Networks led with 66.0% of 2025 value because Edison Electric Institute members projected nearly $208 billion of 2025 investment on Oct. 7, 2025. Data Centres grow fastest at 9.60% a year as the Department of Energy reported that those sites could use 325 to 580 terawatt-hours by 2028. Eaton named data centers first among the reasons for its South Carolina factory in February 2025.
Why investor-owned utilities still anchor purchasing
Based on customer type, the market is categorized into Investor-Owned Utilities, Public and Cooperative Utilities, Private Asset Owners and EPC Contractors. Investor-Owned Utilities led with 52.0% of 2025 value because Foley & Lardner reported in September 2026 that their yearly investment had climbed about 49% from roughly $139.8 billion in 2020. Private Asset Owners grow fastest at 7.97% a year as Hammond Power Solutions leased a Fort Worth plant on Sept. 22, 2026, citing data center projects. Cooperative buyers hold a distinct position, since Arkansas Electric Cooperatives owns the Tennessee manufacturer ERMCO.
How cooling and insulation choices divide the installed base
Based on technology, the market is categorized into Mineral-Oil-Immersed, Ester-Fluid-Immersed, Dry-Type and Gas-Insulated. Mineral-Oil-Immersed led with 68.0% of 2025 value because World Bank WITS recorded about $6.03 billion of liquid-filled U.S. imports in 2024, against about $1.30 billion for larger dry-type lines. Ester-Fluid-Immersed units grow fastest at 9.11% a year as Cargill reports more than 3.5 million units using its FR3 fluid. Gas designs face stricter rules around SF6 switchgear, because the EPA records a California phaseout beginning in 2025.
| Segment Group | Leading Sub-segment | Share, 2025 | Fastest-growing Sub-segment | CAGR, 2026–2035 |
|---|---|---|---|---|
| By Product Type | Distribution Transformers | 46.0% | Power Transformers | 7.28% |
| By End-Use Industry | Power Generation and Networks | 66.0% | Data Centres | 9.60% |
| By Customer Type | Investor-Owned Utilities | 52.0% | Private Asset Owners | 7.97% |
| By Technology | Mineral-Oil-Immersed | 68.0% | Ester-Fluid-Immersed | 9.11% |
Request a Free Sample
Fill in your details and we'll send you a free sample report.
- Sample data tables & charts
- Research methodology
Utility budgets and new loads keep factories full
Utility capital programs and aging-grid replacement lift orders
Replacement of an old fleet gives this market its steadiest order base, because utilities must swap failing units regardless of the economic cycle. NREL research found about 55% of distribution units are at least 33 years old and near the end of their service lives. It also estimated that required capacity could rise by up to 260% over 2021 levels by 2050. Funding for grid modernization is growing as well, since the Edison Electric Institute expects more than $1.1 trillion of investment over five years, according to a separate POWER magazine report on investor-owned utility spending. Storms add to the schedule, and Duke Energy replaced about 16,000 units after Hurricanes Helene and Milton, according to Utility Dive in February 2025.
Data center connections raise density and voltage needs
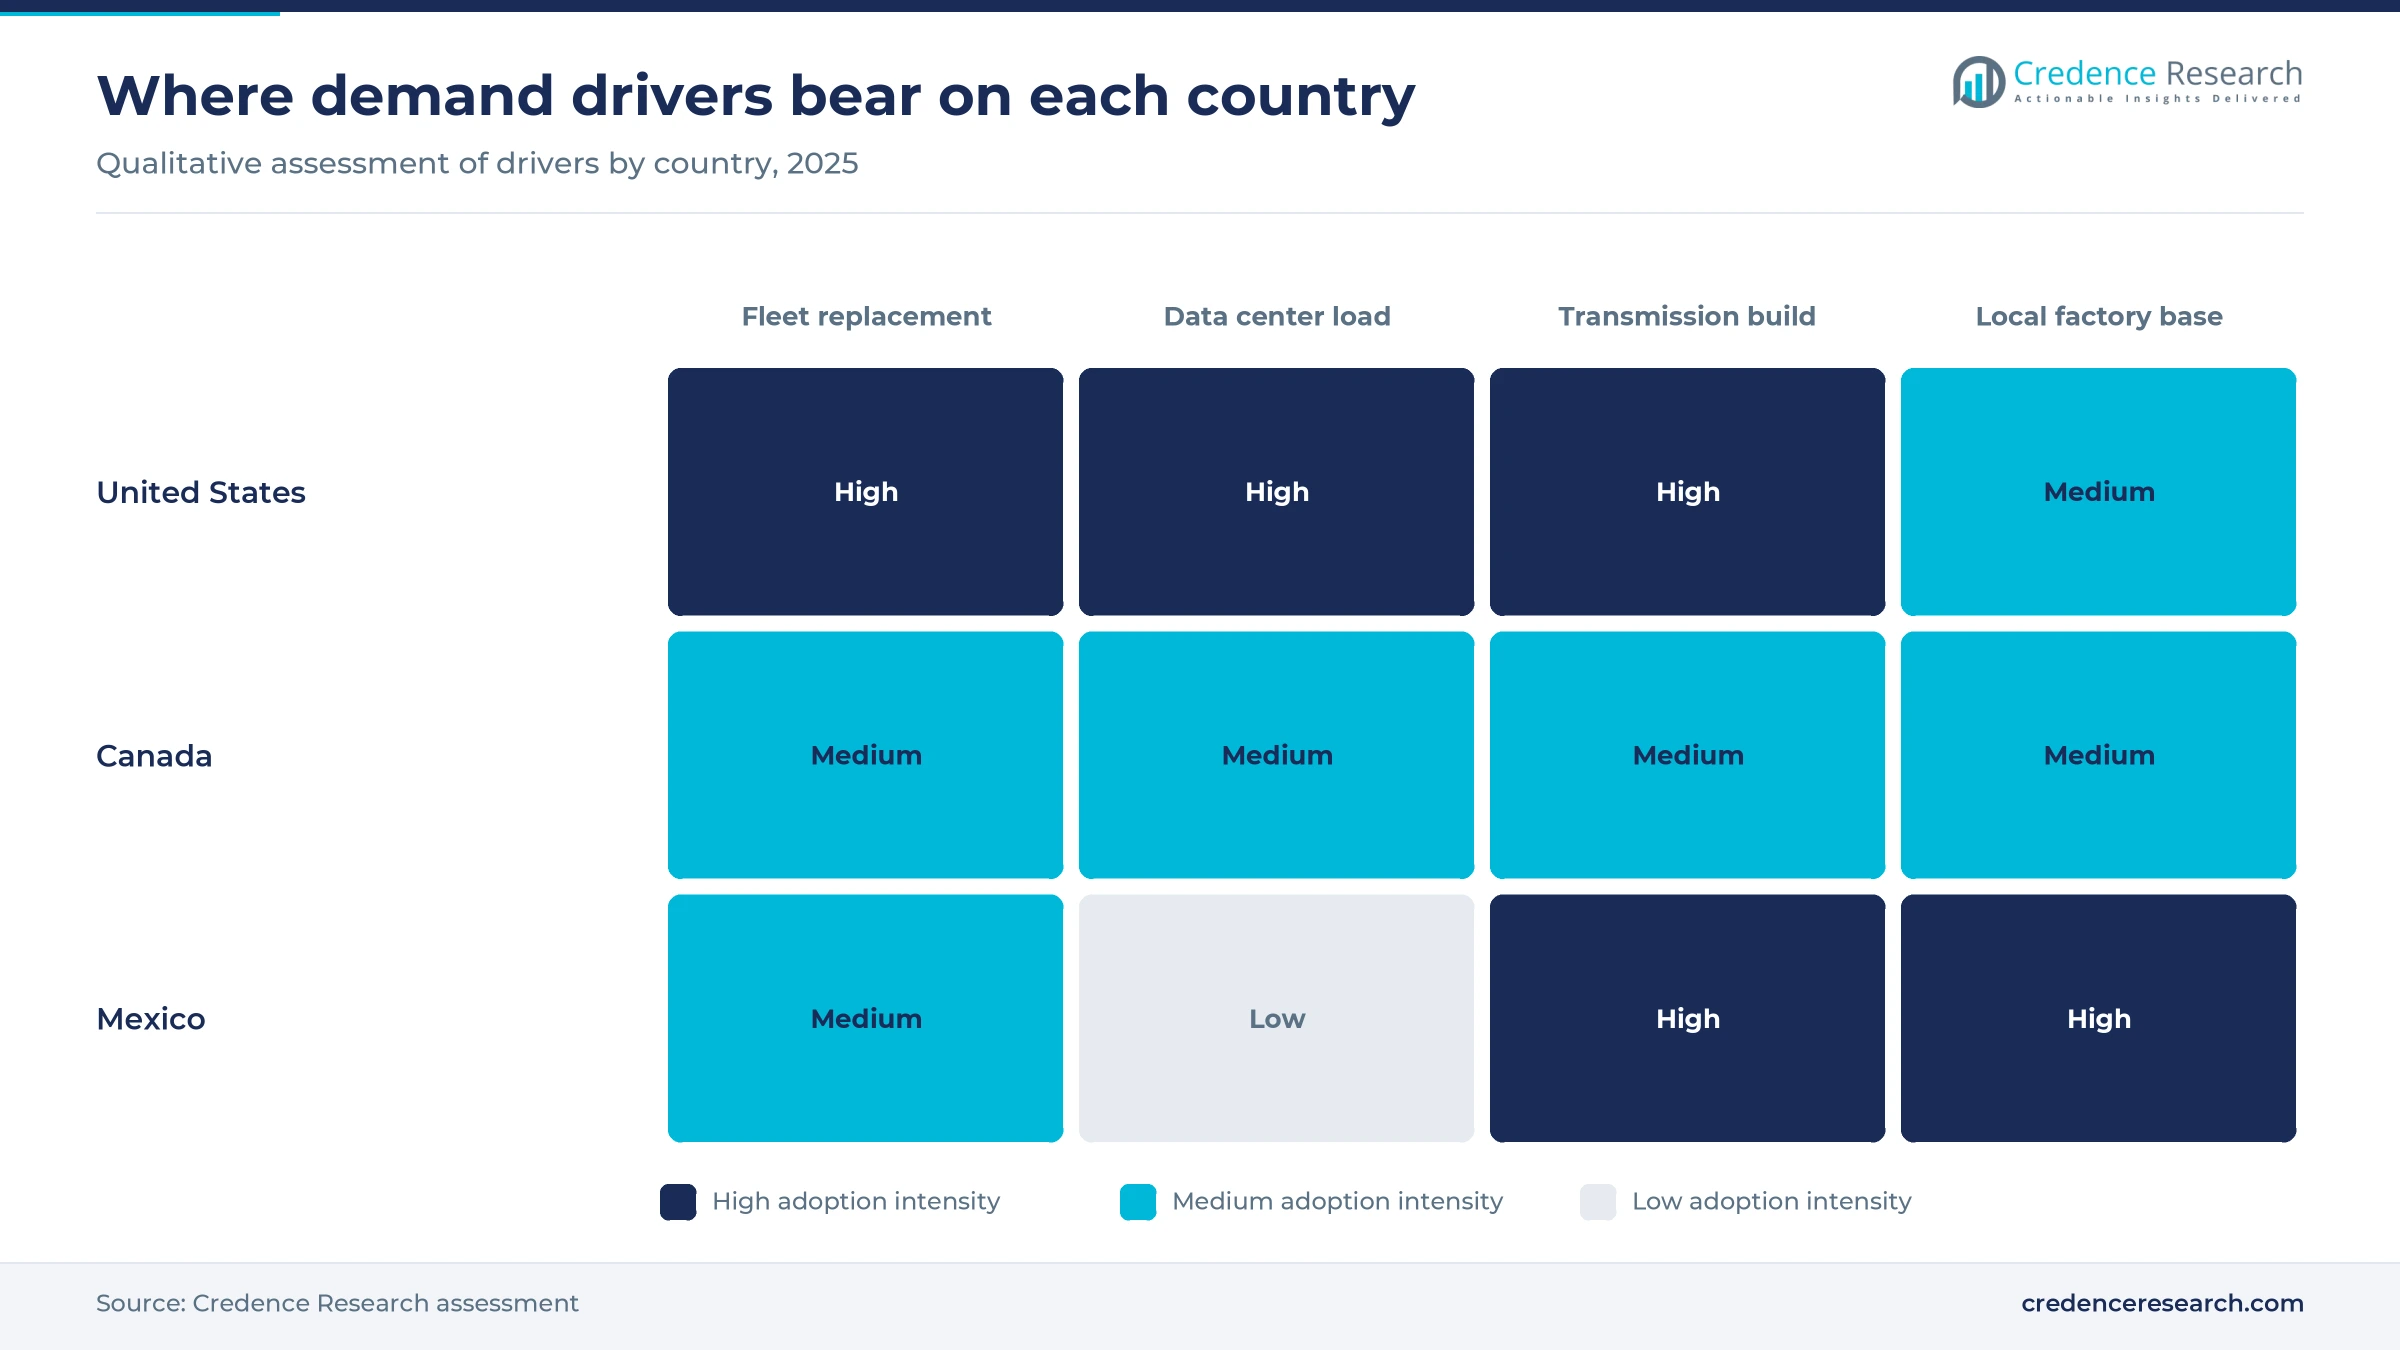
Data centers have moved from a niche customer to a major source of large-unit orders, because each campus needs substation, medium-voltage and building-level equipment together. The Department of Energy reported on Dec. 20, 2024 that these sites used 176 terawatt-hours in 2023, about 4.4% of U.S. electricity, and could reach 6.7% to 12% by 2028. Suppliers are planning around that load, and hyperscale campuses figure in several factory announcements. Hammond Power Solutions committed about C$50 million to its Fort Worth plant, with staged production from the fourth quarter of 2027, and its chief executive tied the move to data center projects. As a result, Data Centres grow at 9.60% a year.
Transmission planning and interconnection add large units
Grid planning rules and new generation are extending order books for the largest and most complex units. FERC Order No. 1920, issued on May 13, 2024, requires regional planners to look at least 20 years ahead, and Crowell & Moring noted that first planning cycles were due by about June 2026. Generator connections have already changed the order mix, and POWER magazine reported in January 2026 that generator step-up demand had risen 274% since 2019. Those units averaged 144 weeks of lead time in the second quarter of 2025. In Mexico, the federal utility CFE plans $8.177 billion for 275 new lines and 524 substation works between 2025 and 2030, according to the Proyectos México government portal.
Regional factory commitments secure future supply
Manufacturers are adding regional plants because long import cycles and tariffs now favor production close to buyers. Hitachi Energy announced more than $1 billion of U.S. investment on Sept. 4, 2025, and its $106 million Alamo, Tennessee, expansion will raise bushing output by mid-2027. Prolec GE began a $140 million expansion in Goldsboro, North Carolina, in March 2026, lifting annual output from 220 to 420 medium power units. Eaton is converting a site in Jonesville, South Carolina, for three-phase units with a $340 million budget and a 2027 start. Earlier, Eaton spent $100 million doubling voltage regulator capacity in Nacogdoches, Texas, according to Renewable Energy World in October 2023. These commitments support the regional outlook of 6.75% annual growth.
Fluids, ownership and supply chains are being reset
Shift toward ester fluids at fire-sensitive sites
Buyers are moving from mineral dielectric oil toward ester fluids where fire risk or load density is the main concern. Cargill says FR3 has nearly 30 years of field use and a K-class fire rating, and it markets the fluid directly to data center owners. It also claims that a same-size unit can carry up to 20% more load than one using mineral oil. Cargill also reports bio-based content above 99% under ASTM D6866, which helps owners that face environmental reviews at sites near occupied buildings. These arguments explain why Ester-Fluid-Immersed units grow at 9.11% a year, although mineral oil remains the default for most utility purchases.
Rise of integrated ownership across the supply chain
Large groups are tightening control of factories and critical components, because core parts have become as scarce as finished units. GE Vernova completed its $5.275 billion purchase of the remaining half of Prolec GE on Feb. 2, 2026, gaining seven manufacturing sites in the Americas, five of them in the United States. Hitachi Energy followed on Oct. 16, 2026, with C$479 million for insulation and components, including a pressboard factory in London, Ontario, due by 2028. Ottawa is contributing C$20 million and Ontario up to C$20 million, which shows how public money now backs the supply chain. In turn, independent assemblers must secure insulation, bushings and steel through longer contracts than they used before 2020.
Opening for remanufacturers and stock programs
Remanufacturing offers an opening for suppliers that can deliver during the wait for new factory output. The Remanufacturing Industries Council puts typical savings at 10% to 40% against a new unit, according to a POWER magazine partner article sponsored by Maddox in June 2026. That article also said new distribution units take 60 to 80 weeks, while Maddox can ship remanufactured units in one to four weeks. Larger manufacturers see the same opening, since Siemens Energy planned Charlotte service capacity for 12 refurbished large units a year, rising to 24, according to the American Public Power Association. Federal advisers from NIAC also listed utility storm stock among their solutions, which supports inventory programs for distributors.
Opportunity in Canadian and Mexican supply corridors
Neighboring producers have a clear opportunity to take volume from long-distance suppliers as U.S. buyers shorten their supply chains. World Bank WITS data show U.S. imports of the largest liquid-filled class reached about $2.98 billion in 2024, up from about $1.93 billion in 2023. Mexico supplied the largest amount, about $708 million, followed by South Korea at about $358 million and Brazil at about $282 million. Canada supplied about $170 million, and capacity there is rising, because Hitachi Energy is spending C$270 million to nearly triple large-unit output at Varennes, Quebec. A 2020 agreement excluded Mexican GOES-based units from earlier related tariffs, according to FreightWaves in November 2020, although the August 2025 content tariff now applies to certain transformers.
Lead times, tariffs and steel limit delivery
Long lead times delay substations and data center energization
Lead times remain the largest obstacle for buyers, and POWER magazine reported that power units averaged 128 weeks in the second quarter of 2025. Prices have climbed alongside those waits, rising 77% for power units since 2019 and up to 95% for some distribution classes. This pushes utilities and developers to order before their designs are final, which ties up capital and raises cancellation risk. Early reservation agreements and standardized specifications are the main mitigation available today.
Tariffs on steel and aluminum content raise import costs
Trade policy has added cost and uncertainty, because a 50% tariff on non-U.S. steel and aluminum content has applied to certain transformers since Aug. 18, 2025, according to tED Magazine. Hammond Power Solutions said the change affects its dry-type and control products and adds complexity and cost. Importers therefore face prices that vary by product line and metal content. Regional sourcing helps, although new plants cannot absorb enough of this volume before 2027.
Core steel supply remains concentrated in one domestic producer
Core material is a structural bottleneck, since Foley & Lardner identifies Cleveland-Cliffs as the only domestic producer of grain-oriented electrical steel. The Department of Energy final rule of April 4, 2024, eases the pressure by allowing about 75% of distribution units to keep that steel from 2029, according to NRECA. However, NRECA also noted that amorphous steel has only one domestic supplier. Manufacturers therefore carry concentrated material risk, and long-term steel contracts remain their most practical protection.
Custom designs limit factory throughput
Design variety slows production, because the National Infrastructure Advisory Council counted more than 80,000 unit types in the U.S. system, according to Utility Dive in February 2025. Each variation reduces repeat runs and adds engineering and testing time, which limits output at plants that are already full. Smaller public utilities suffer most, since they order fewer units and hold less purchasing power. Standardized designs and shared specifications remain the most direct mitigation, although adoption across utilities has been slow.
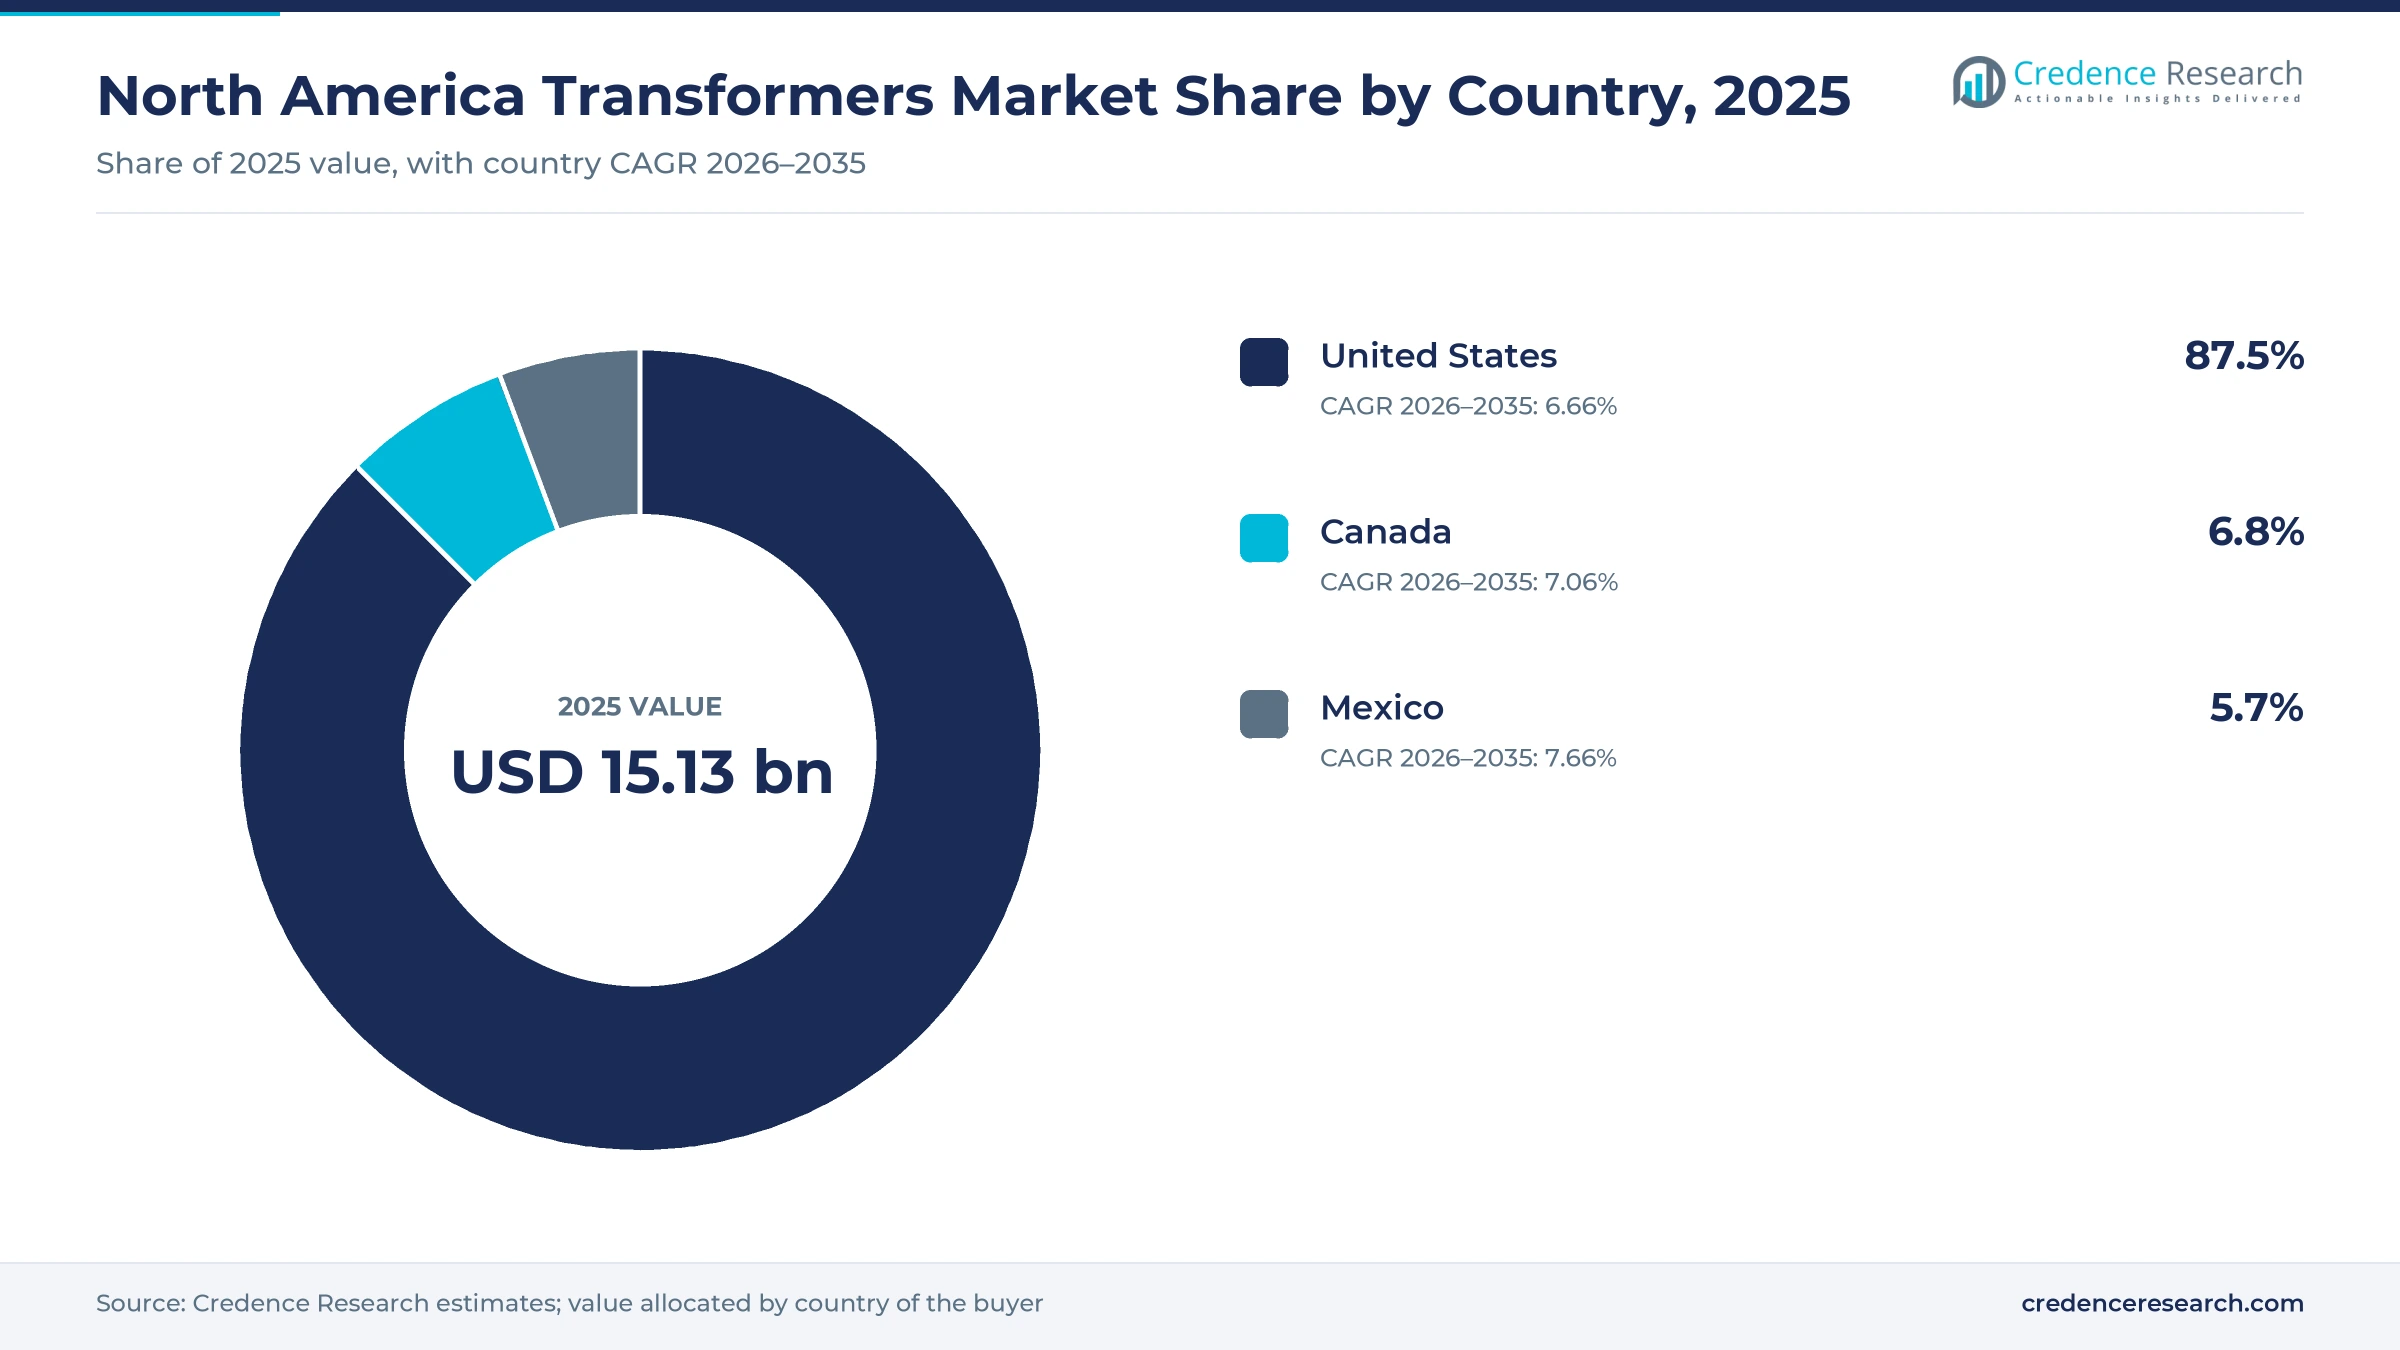
U.S. holds the value as CFE works lift Mexico's growth
| Country | Value, 2025 (USD billion) | Share, 2025 | CAGR, 2026–2035 |
|---|---|---|---|
| United States | 13.24 | 87.5% | 6.66% |
| Canada | 1.03 | 6.8% | 7.06% |
| Mexico | 0.86 | 5.7% | 7.66% |
United States carries the region through utility and data center spending
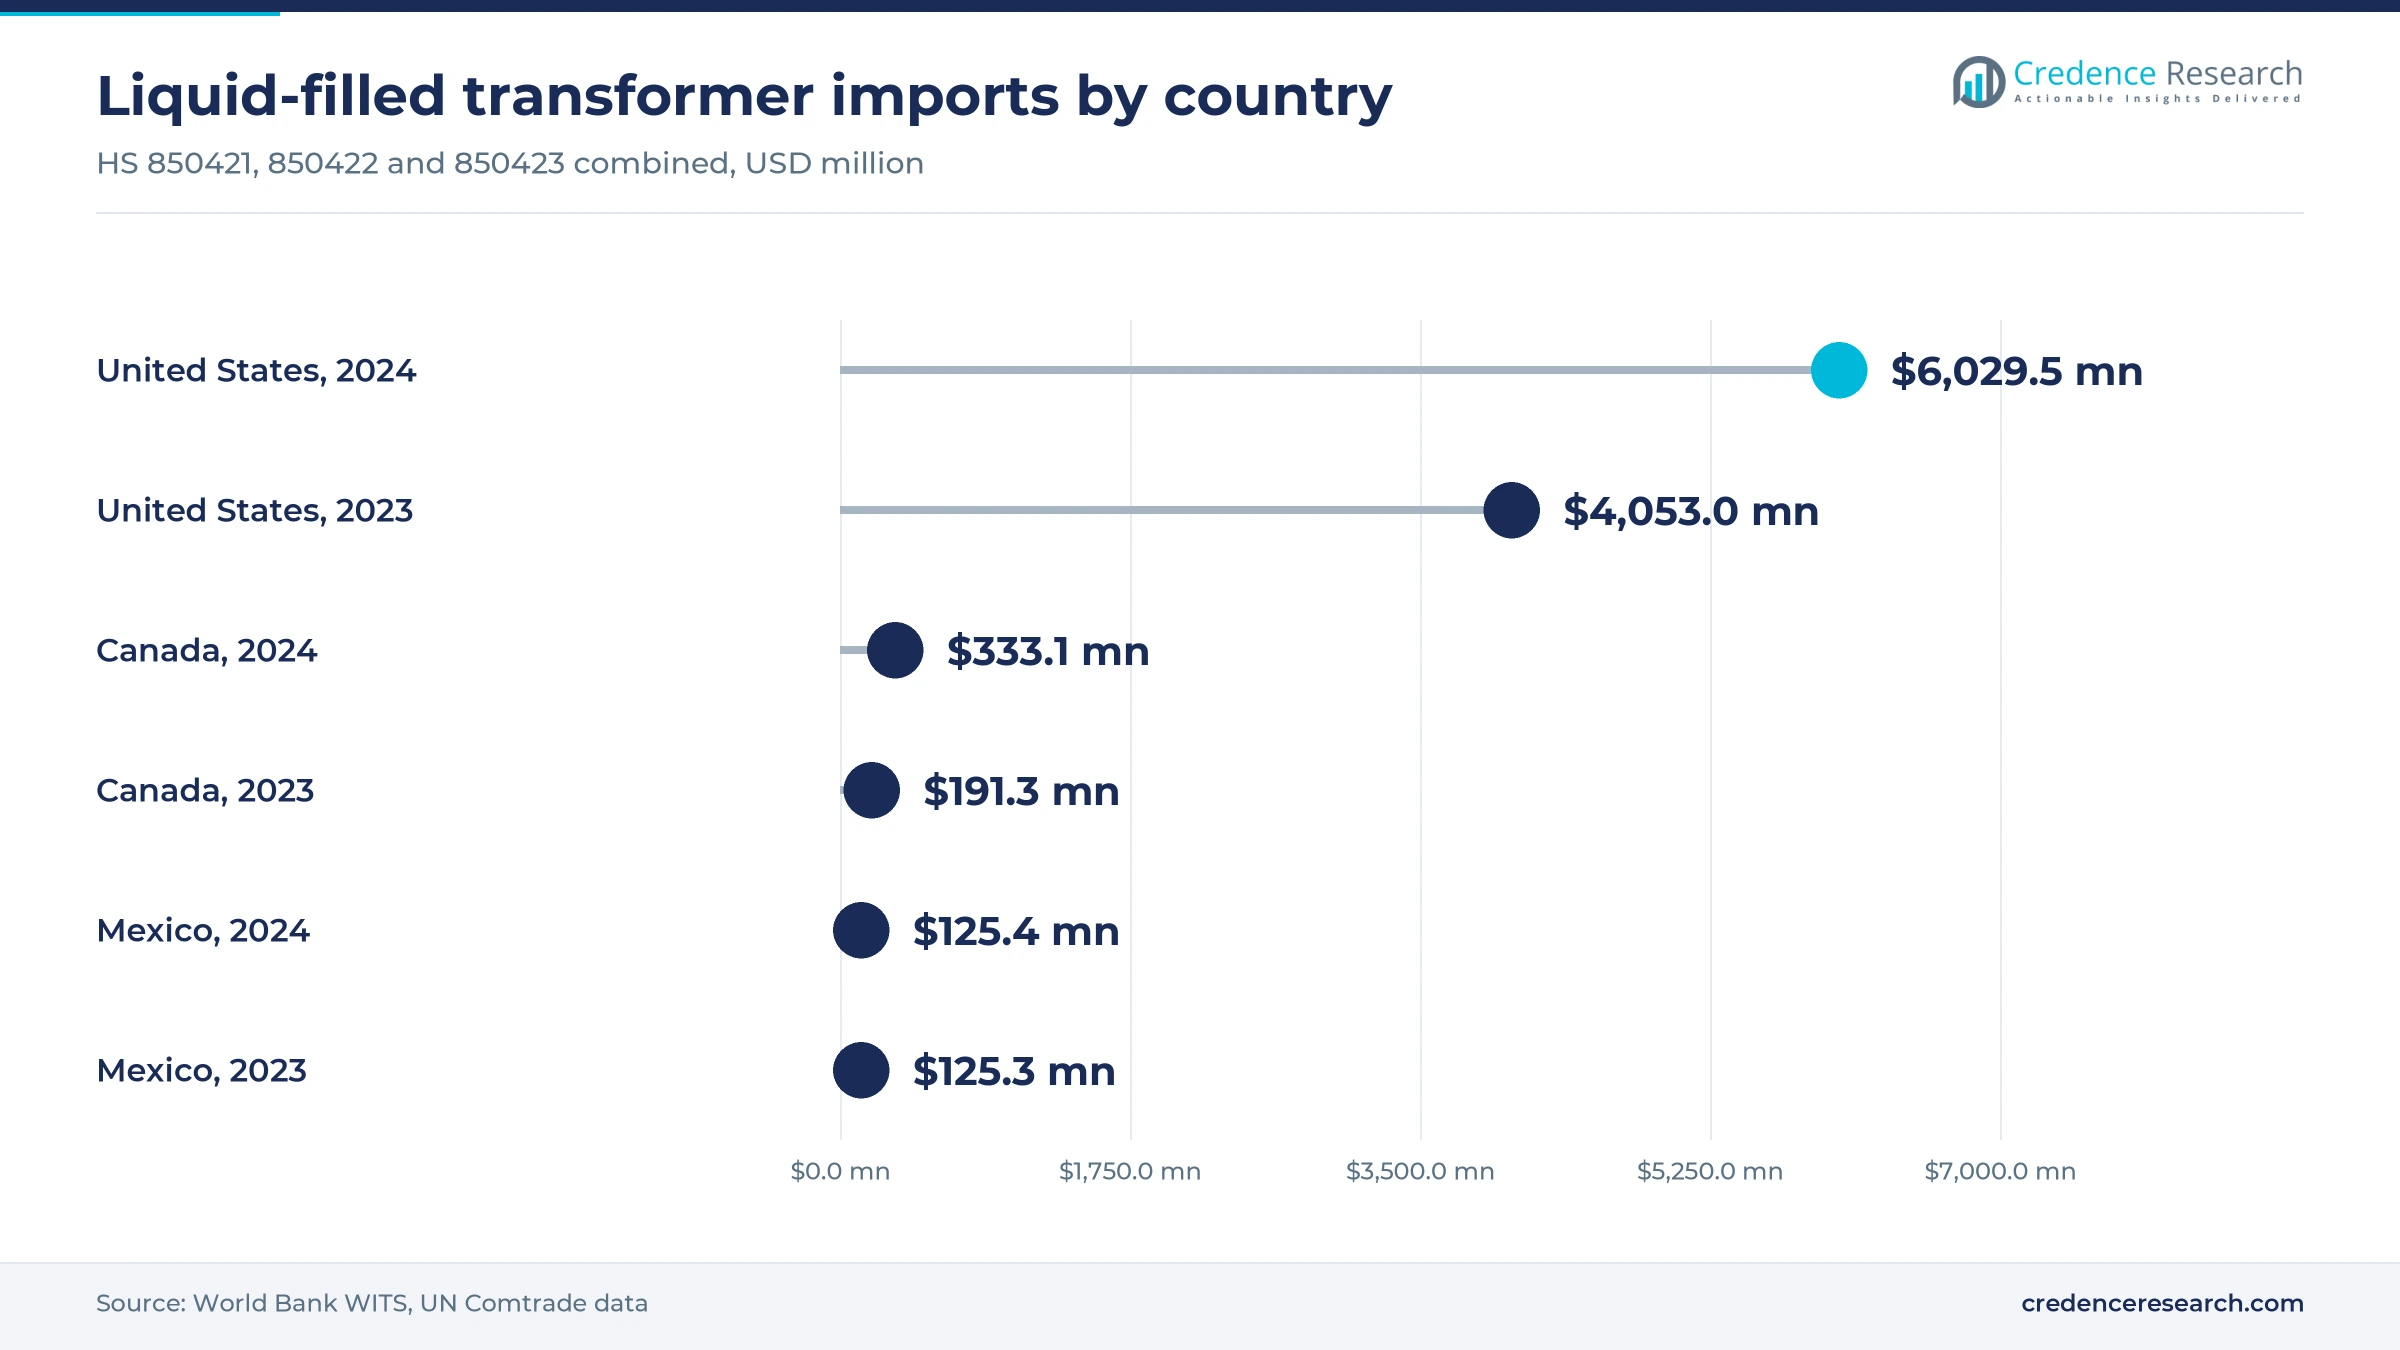
The United States held 87.5% of 2025 value and grows at 6.66% a year. Its dependence on outside supply is the defining feature, with liquid-filled imports reaching about $6.03 billion in 2024 from about $4.05 billion a year earlier, according to World Bank WITS. New domestic capacity is arriving through plants in Virginia, South Carolina and North Carolina. Siemens Energy expects its Charlotte factory to start production in early 2027, with first-year output planned at 24 large units.
Canada builds large-unit and component capacity
Canada held 6.8% of 2025 value and grows at 7.06% a year. Its imports across the three liquid-filled classes rose to about $333 million in 2024 from about $191 million in 2023, according to World Bank WITS. Domestic capability is expanding at the same time, as Hitachi Energy builds out Varennes and a London, Ontario, insulation plant. Hammond Power Solutions, based in Guelph, Ontario, also gives the country a homegrown supplier of dry-type equipment.
Mexico grows fastest on CFE transmission works
Mexico held 5.7% of 2025 value and is the fastest-growing country at 7.66% a year. Domestic demand rests on the CFE plan for 524 substation works through 2030, which the Proyectos México portal says will benefit about 50 million users. Its own imports stayed near $125 million in both 2023 and 2024, according to World Bank WITS, which suggests that local factories meet much of the need. Exports matter too, as Mexican plants shipped about $1.86 billion of liquid-filled units to the United States in 2024.
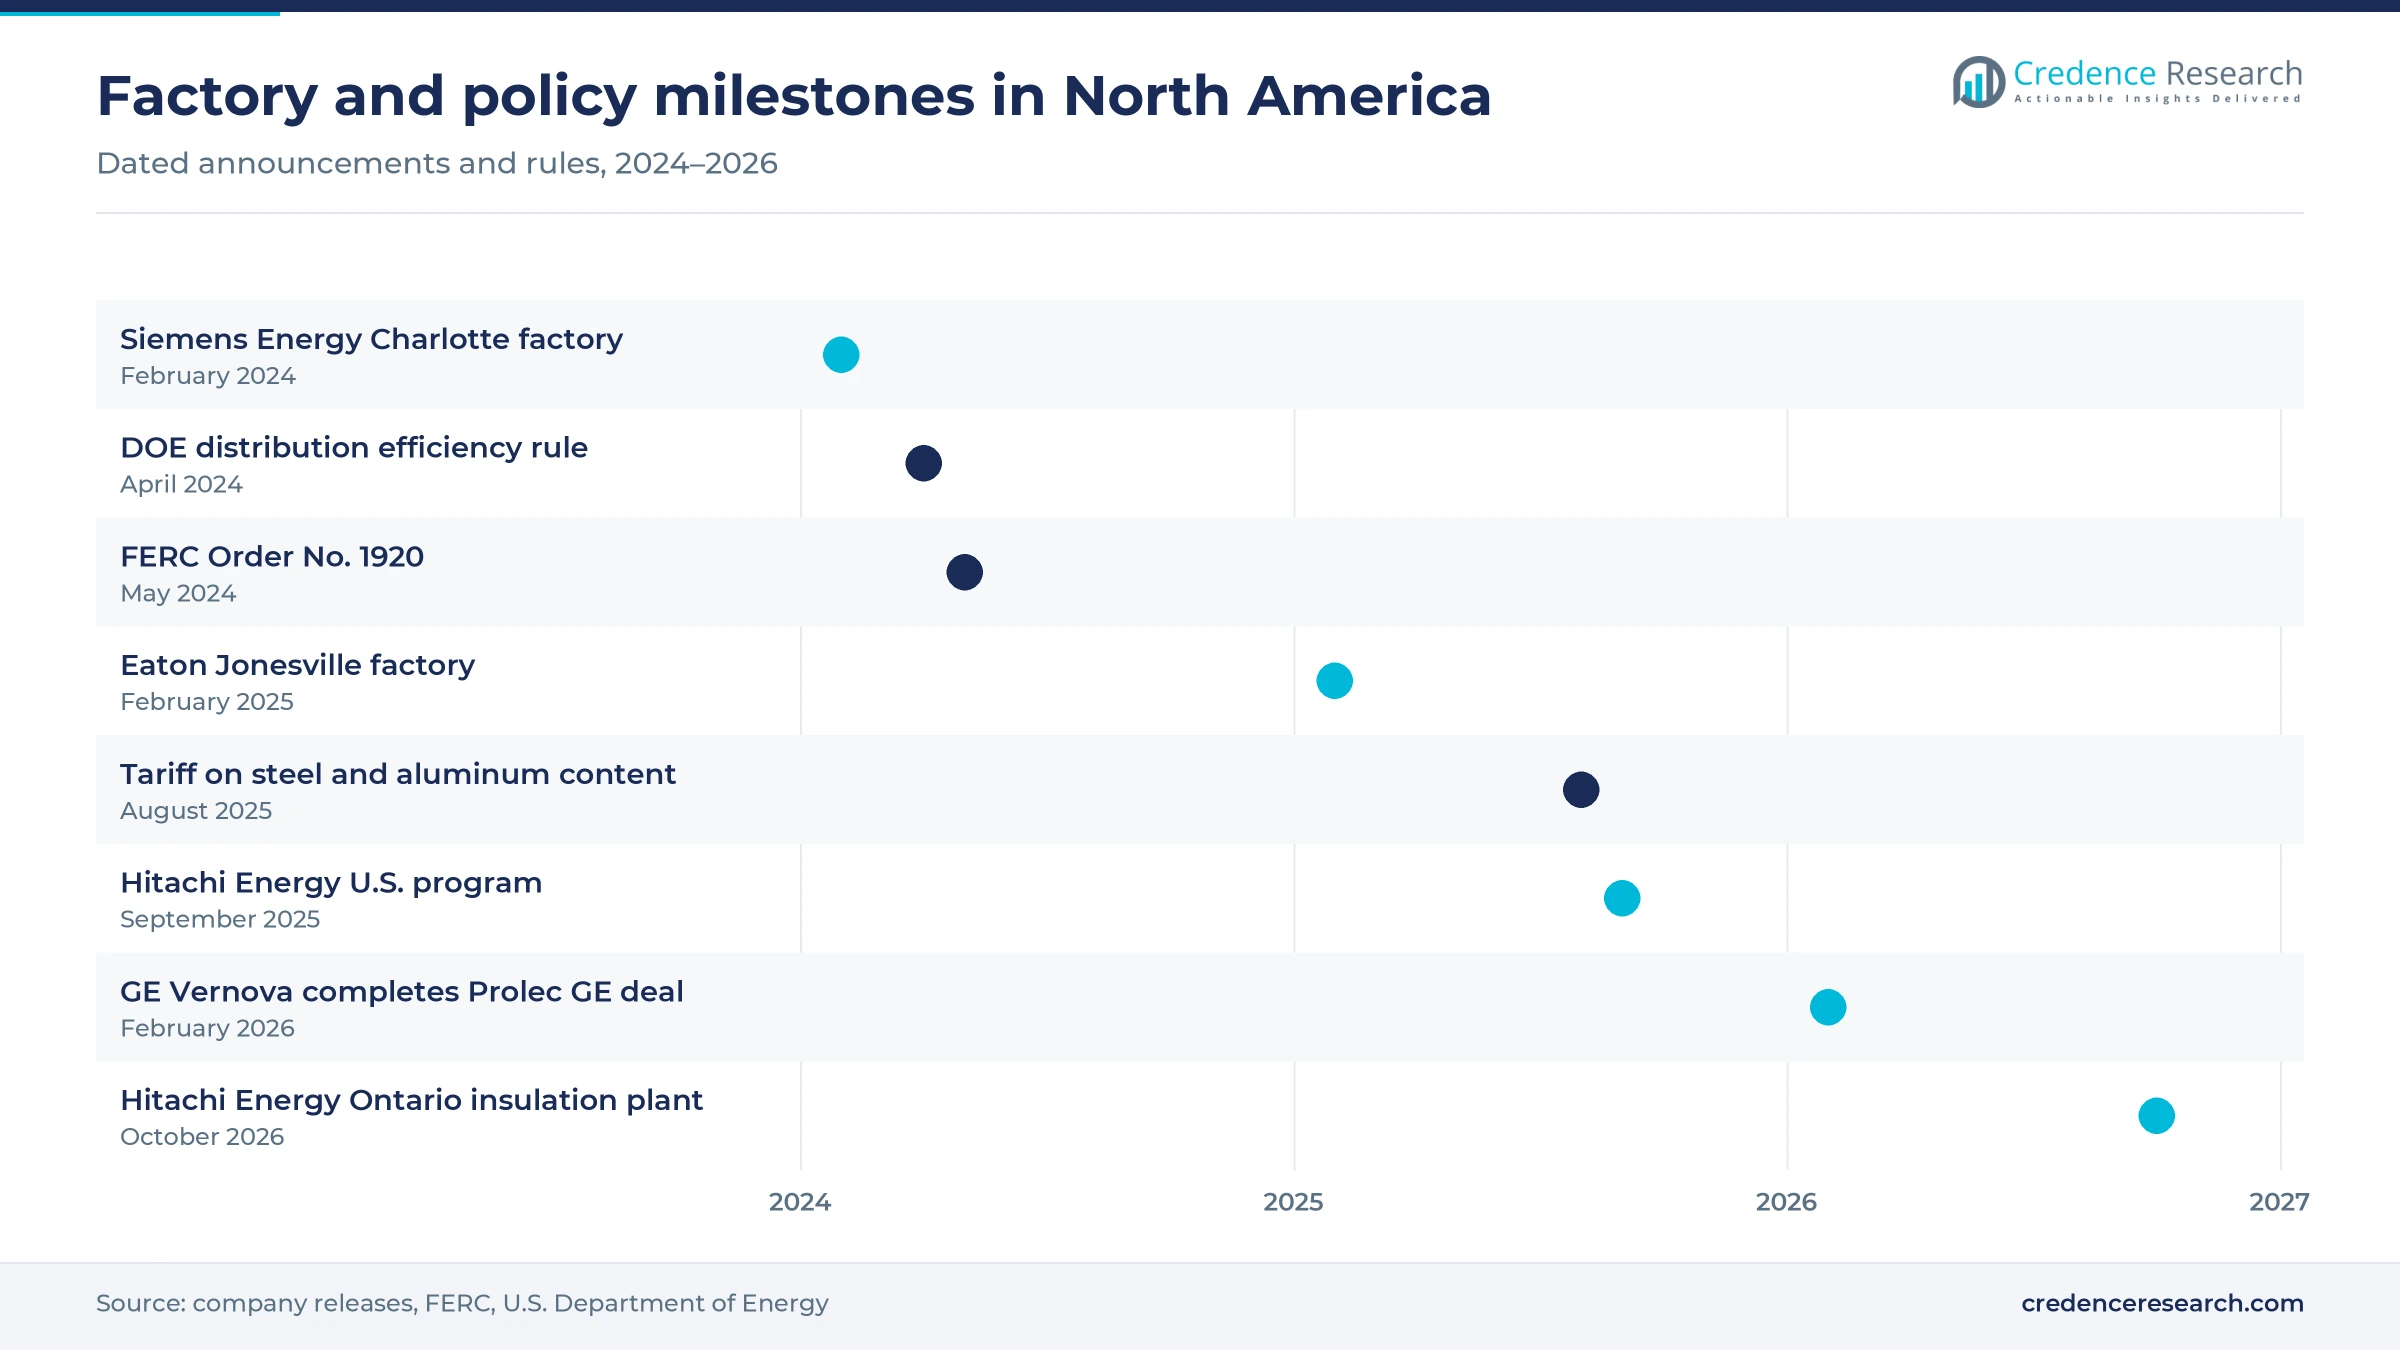
Factory and policy moves from 2024 to 2026
| Development | Status and market relevance |
|---|---|
| In February 2024, Siemens Energy announced a $150 million large power unit factory in Charlotte, North Carolina, planned for up to 57 new units a year. | Production expected in early 2027 |
| In February 2025, Eaton announced a $340 million three-phase factory in Jonesville, South Carolina, with about 700 local jobs. | Production and hiring planned for 2027 |
| In September 2025, Hitachi Energy announced more than $1 billion of U.S. investment, including about $457 million in South Boston, Virginia. | More than 825 new jobs planned at the site |
| In February 2026, GE Vernova completed its $5.275 billion purchase of the remaining stake in Prolec GE. | Completed, consolidating seven sites in the Americas |
| In September 2026, Hammond Power Solutions announced a leased Fort Worth, Texas, plant backed by about C$50 million. | Staged production from the fourth quarter of 2027 |
Core steel, fluid and insulation choices shape units
- Grain-oriented steel cores remain the standard for most units, and the 2024 federal efficiency rule lets about 75% of distribution units keep them from 2029.
- Amorphous steel cores must replace that steel in about a quarter of distribution designs under the same rule, although buyers depend on a single domestic supplier for the material.
- Natural ester fluids raise the fire point and allow greater loading, which suits data center yards and other sites near occupied buildings.
- Dry-type designs avoid liquid handling indoors, so commercial buildings and data halls use them where spill containment would be costly.
Need a Custom Version of This Report?
Tailor the scope, geography, or segments to your exact requirements.
- Custom geography or segment scope
- Direct access to our analyst team
Scale builders race to add regional large-unit capacity
Competition in the North America transformers market centers on delivery slots rather than list prices, because most large buyers now reserve factory capacity years ahead. Prolec GE, now wholly owned by GE Vernova, combines seven sites in the Americas with medium power expansion at Goldsboro. Hitachi Energy competes at the largest ratings and is building its supply chain through Virginia, Tennessee, Quebec and Ontario projects. Eaton is strongest in distribution and three-phase equipment, with its Nacogdoches and Jonesville sites serving utility and data center customers. Hammond Power Solutions focuses on dry-type and custom units and is entering Texas to sit nearer U.S. projects. Siemens Energy is adding its first U.S. large power unit factory and refurbishment service at Charlotte. Local rivals are also investing, as POWER magazine reports $50 million from Central Moloney in Florida and $40 million from Virginia Transformer in Georgia.
Companies profiled and their roles in this market
| Company | Type | Role in the market |
|---|---|---|
| Prolec GE | Manufacturer owned by GE Vernova | Distribution and medium power units, with Goldsboro output rising to 420 units a year |
| Hitachi Energy | Global grid equipment manufacturer | Large power units at South Boston and Varennes, plus bushings at Alamo |
| Eaton | Electrical equipment manufacturer | Three-phase units and voltage regulators from Nacogdoches, with Jonesville to follow |
| Hammond Power Solutions | Canadian specialist manufacturer | Dry-type, custom and large standard units from Canada, Mexico and soon Fort Worth |
| Siemens Energy | Global energy equipment manufacturer | Large power units and refurbishment at Charlotte from early 2027 |
New plants arrive late, so scarcity favors planners
Credence Research's view is that supply stays tight until the plants announced since 2024 ramp up, so advantage rests with buyers and sellers that plan early. Most large commitments reach production between 2027 and 2028, which leaves several years of constrained delivery for generator step-up and substation units. Distribution equipment should ease first, and POWER magazine already reports better availability there. Suppliers with local steel contracts, service capacity and data center relationships hold the strongest position. Buyers should treat framework agreements and standard designs as risk controls rather than purchasing options.
How this market estimate was built
The report uses 2025 as the base year and 2035 as the forecast year. Market values come from the Credence Research model, and the country, segment and growth splits are Credence Research estimates. Those estimates were checked against official trade data from World Bank WITS, federal agency publications, trade association statements, company press releases and trade press articles opened during preparation. No interviews or surveys were conducted for this edition of the report. Country shares follow the Credence Research regional model, and the segment splits carry the greatest uncertainty because manufacturers rarely publish regional sales by product.
Capacity from 2027 shifts the contest toward price
The North America transformers market reaches USD 29.14 billion by 2035 as utility replacement work continues and new factories relieve the most severe shortages. Competition should shift gradually from delivery slots toward price and service once the Virginia, South Carolina, North Carolina and Quebec plants reach volume. Power Transformers and Data Centres remain the areas to watch, because large connections keep arriving faster than grid capacity. Federal efficiency rules taking effect in 2029 will also shape core choices. The main risks are slower data center construction, further tariff changes and tight supplies of core steel.
Frequently Asked Questions
How big is the North America transformers market?
Which country leads the regional market?
Which country grows fastest through 2035?
Which product type holds the largest share?
Why are data centers important to transformer demand?
What are the main supply constraints for buyers?
Which companies are expanding capacity in North America?
How does the federal efficiency rule affect core materials?
Table of Content
Chapter 1 Market Segmentation
- 1.1 Segmentation Framework
- 1.1.1 Product and Service Classification
- 1.1.2 Application and End-Use Classification
- 1.1.3 Technology and Solution Classification
- 1.1.4 Customer and Distribution Channel Classification
- 1.1.5 Geographic Segmentation
- 1.1.6 Market Segment Definitions and Boundaries
- 1.2 By Product Type
- 1.2.1 Distribution Transformers
- 1.2.2 Power Transformers
- 1.2.3 Instrument Transformers
- 1.2.4 Specialty Transformers
- 1.3 By End-Use Industry
- 1.3.1 Power Generation and Networks
- 1.3.2 Data Centres
- 1.3.3 Manufacturing and Mining
- 1.3.4 Buildings and Transport Infrastructure
- 1.4 By Customer Type
- 1.4.1 Investor-Owned Utilities
- 1.4.2 Public and Cooperative Utilities
- 1.4.3 Private Asset Owners
- 1.4.4 EPC Contractors
- 1.5 By Technology
- 1.5.1 Mineral-Oil-Immersed
- 1.5.2 Ester-Fluid-Immersed
- 1.5.3 Dry-Type
- 1.5.4 Gas-Insulated
- 1.6 By Country
- 1.6.1 United States
- 1.6.2 Canada
- 1.6.3 Mexico
Chapter 2 Introduction
- 2.1 Report Objectives and Scope
- 2.2 Product Definition and Industry Terminology
- 2.3 Market Inclusions and Exclusions
- 2.4 Research Process
- 2.4.1 Primary Research and Expert Interviews
- 2.4.2 Secondary Research and Source Review
- 2.4.3 Top-Down and Bottom-Up Estimation
- 2.4.4 Data Triangulation and Verification
- 2.5 Market Size Measurement Basis
- 2.5.1 2025: USD 15.13 billion → 2035: USD 29.14 billion
- 2.6 Historical and Forecast Reference Periods
- 2.6.1 Historical Period: 2018-2025
- 2.6.2 Base Year: 2025
- 2.6.3 Forecast Period: 2025-2035
- 2.7 Research Assumptions and Limitations
Chapter 3 Executive Summary
- 3.1 Market Snapshot and Key Findings
- 3.2 Base-Year Market Size, 2025
- 3.3 Forecast Market Size, 2035
- 3.4 Revenue and Volume Growth Outlook
- 3.5 Key Demand and Supply Indicators
- 3.6 Leading Market Segments
- 3.7 Fastest-Growing Market Opportunities
- 3.8 Regional Performance Highlights
- 3.9 Technology and Industry Transformation
- 3.10 Competitive Landscape Summary
- 3.11 Analyst View and Strategic Implications
Chapter 4 North America Transformers Market Trends and Developments
- 4.1 Historical Industry Development, 2018-2025
- 4.2 Recent Market Trends and Developments
- 4.3 Demand and Customer Behavior Trends
- 4.4 Technology and Product Innovation
- 4.5 Artificial Intelligence, Automation and Digitalization
- 4.6 Local Manufacturing and Supply Chain Realignment
- 4.7 Industry Partnerships, Mergers and Acquisitions
- 4.8 Sustainability and Circular Economy Developments
- 4.9 Government and Private Sector Investment Trends
- 4.10 Emerging Business Models and Commercialization
- 4.11 Industry Developments and Announcements
Chapter 5 North America Transformers Market Production, Supply and Demand Analysis
- 5.1 Demand Trend and Consumption Analysis, 2018-2025
- 5.2 Demand Forecast, 2025-2035
- 5.3 Production and Output Trend, 2018-2025
- 5.4 Production and Output Forecast, 2025-2035
- 5.5 Installed Capacity and Capacity Utilization
- 5.6 Company-Wise Production Plants and Statistics
- 5.6.1 Installed Production Capacity
- 5.6.2 Actual Production
- 5.6.3 Planned Capacity and Expansion Targets
- 5.7 Supply Chain Structure and Procurement Trends
- 5.8 Supply-Demand Gap and Bottlenecks
- 5.9 Import Dependence and Sourcing Structure
- 5.10 Contract Manufacturing and Outsourcing
- 5.11 Regional Supply and Demand Concentration
Chapter 6 North America Transformers Market Pricing Analysis
- 6.1 Pricing Structure and Measurement
- 6.2 Historical Pricing Trends, 2018-2025
- 6.3 Pricing Outlook, 2025-2035
- 6.4 Average Selling Price and Unit Economics
- 6.5 Pricing by Product and Market Segment
- 6.6 Geographic Pricing Differences
- 6.7 Key Input, Energy, Labor and Logistics Costs
- 6.8 Contract Pricing and Purchasing Models
- 6.9 Pricing Sensitivity and Competitive Positioning
- 6.10 Price, Margin and Profitability Implications
Chapter 7 North America Transformers Market Dynamics
- 7.1 Market Growth Drivers
- 7.1.1 Demand-Side Drivers
- 7.1.2 Technology and Innovation Drivers
- 7.1.3 Infrastructure and Investment Drivers
- 7.1.4 Regulatory and Policy Drivers
- 7.2 Market Restraints
- 7.2.1 Cost and Affordability Constraints
- 7.2.2 Technology and Adoption Barriers
- 7.2.3 Supply Chain and Operational Constraints
- 7.3 Market Challenges
- 7.3.1 Competitive Pressure and Margin Erosion
- 7.3.2 Skills, Infrastructure and Implementation Gaps
- 7.4 Emerging Market Opportunities
- 7.5 Market Dynamics Impact and Time-Horizon Assessment
Chapter 8 North America Transformers Value Chain Analysis
- 8.1 Industry Value Chain Overview
- 8.2 Upstream Suppliers and Critical Inputs
- 8.3 Technology and Component Providers
- 8.4 Manufacturing or Service Delivery
- 8.5 Distribution, Channel Partners and Integrators
- 8.6 Downstream Applications and End Users
- 8.7 Value Addition and Profit Pools
- 8.8 Vertical Integration and Outsourcing
- 8.9 Supplier Concentration and Risk
- 8.10 Supply Chain Localization and Resilience
Chapter 9 North America Transformers Market Regulations and Policies
- 9.1 Relevant Laws, Standards and Compliance Frameworks
- 9.2 Product, Service, Safety and Quality Requirements
- 9.3 Government Policies, Incentives and Subsidies
- 9.4 Imports, Exports and Trade Barriers
- 9.5 Public Procurement and Local Content Requirements
- 9.6 Environmental and Sustainability Compliance
- 9.7 Upcoming Policy Changes and Market Implications
Chapter 10 North America Transformers Market Hotspots and Opportunities
- 10.1 Market Opportunity Mapping and Growth Hotspots
- 10.2 High-Growth Applications and Customer Groups
- 10.3 Underserved Markets and White-Space Opportunities
- 10.4 Emerging Technology and Product Opportunities
- 10.5 New Capacity and Investment Hotspots
- 10.6 Market Entry and Expansion Opportunities
- 10.7 Distribution and Partnership Opportunities
- 10.8 Near-Term and Long-Term Commercial Potential
- 10.9 Opportunity Attractiveness and Execution Risks
Chapter 11 North America Transformers Market Outlook, 2025-2035
- 11.1 Market Size and Analysis
- 11.1.1 Revenue (Market Measurement: 2025: USD 15.13 billion → 2035: USD 29.14 billion)
- 11.1.2 Market Volume and Quantity Sold
- 11.1.3 Historical Market Size, 2018-2025
- 11.1.4 Base-Year Market Size, 2025
- 11.2 Market Forecast, 2025-2035
- 11.2.1 Revenue Forecast to 2035
- 11.2.2 Volume Forecast to 2035
- 11.2.3 CAGR and Year-on-Year Growth
- 11.2.4 Incremental Revenue Opportunity
- 11.3 Forecast Assumptions and Scenario Analysis
- 11.3.1 Base-Case Forecast
- 11.3.2 Optimistic and Conservative Scenarios
- 11.3.3 Technology, Pricing and Policy Sensitivities
- 11.4 Market Attractiveness and Growth Outlook
Chapter 12 North America Transformers Market Segmentation and Outlook
- 12.1 Segmentation Summary and Market Shares, 2025
- 12.2 Largest and Fastest-Growing Segments
- 12.3 By Product Type - Market Size and Forecast, 2025-2035
- 12.3.1 Segment Definition and Scope
- 12.3.2 Historical Market Size, 2018-2025
- 12.3.3 Revenue Forecast, 2025-2035
- 12.3.4 Volume Forecast, 2025-2035
- 12.3.5 Base-Year Market Share, 2025
- 12.3.6 Segment CAGR and Growth Drivers
- 12.3.7 Subsegment Market Size and Forecast
- 12.3.7.1 Distribution Transformers
- 12.3.7.2 Power Transformers
- 12.3.7.3 Instrument Transformers
- 12.3.7.4 Specialty Transformers
- 12.3.8 Subsegment Pricing and Adoption Trends
- 12.3.9 Leading Suppliers and Competition
- 12.3.10 Regional Demand and Opportunities
- 12.4 By End-Use Industry - Market Size and Forecast, 2025-2035
- 12.4.1 Segment Definition and Scope
- 12.4.2 Historical Market Size, 2018-2025
- 12.4.3 Revenue Forecast, 2025-2035
- 12.4.4 Volume Forecast, 2025-2035
- 12.4.5 Base-Year Market Share, 2025
- 12.4.6 Segment CAGR and Growth Drivers
- 12.4.7 Subsegment Market Size and Forecast
- 12.4.7.1 Power Generation and Networks
- 12.4.7.2 Data Centres
- 12.4.7.3 Manufacturing and Mining
- 12.4.7.4 Buildings and Transport Infrastructure
- 12.4.8 Subsegment Pricing and Adoption Trends
- 12.4.9 Leading Suppliers and Competition
- 12.4.10 Regional Demand and Opportunities
- 12.5 By Customer Type - Market Size and Forecast, 2025-2035
- 12.5.1 Segment Definition and Scope
- 12.5.2 Historical Market Size, 2018-2025
- 12.5.3 Revenue Forecast, 2025-2035
- 12.5.4 Volume Forecast, 2025-2035
- 12.5.5 Base-Year Market Share, 2025
- 12.5.6 Segment CAGR and Growth Drivers
- 12.5.7 Subsegment Market Size and Forecast
- 12.5.7.1 Investor-Owned Utilities
- 12.5.7.2 Public and Cooperative Utilities
- 12.5.7.3 Private Asset Owners
- 12.5.7.4 EPC Contractors
- 12.5.8 Subsegment Pricing and Adoption Trends
- 12.5.9 Leading Suppliers and Competition
- 12.5.10 Regional Demand and Opportunities
- 12.6 By Technology - Market Size and Forecast, 2025-2035
- 12.6.1 Segment Definition and Scope
- 12.6.2 Historical Market Size, 2018-2025
- 12.6.3 Revenue Forecast, 2025-2035
- 12.6.4 Volume Forecast, 2025-2035
- 12.6.5 Base-Year Market Share, 2025
- 12.6.6 Segment CAGR and Growth Drivers
- 12.6.7 Subsegment Market Size and Forecast
- 12.6.7.1 Mineral-Oil-Immersed
- 12.6.7.2 Ester-Fluid-Immersed
- 12.6.7.3 Dry-Type
- 12.6.7.4 Gas-Insulated
- 12.6.8 Subsegment Pricing and Adoption Trends
- 12.6.9 Leading Suppliers and Competition
- 12.6.10 Regional Demand and Opportunities
- 12.7 By Country - Market Size and Forecast, 2025-2035
- 12.7.1 Segment Definition and Scope
- 12.7.2 Historical Market Size, 2018-2025
- 12.7.3 Revenue Forecast, 2025-2035
- 12.7.4 Volume Forecast, 2025-2035
- 12.7.5 Base-Year Market Share, 2025
- 12.7.6 Segment CAGR and Growth Drivers
- 12.7.7 Subsegment Market Size and Forecast
- 12.7.7.1 United States
- 12.7.7.2 Canada
- 12.7.7.3 Mexico
- 12.7.8 Subsegment Pricing and Adoption Trends
- 12.7.9 Leading Suppliers and Competition
- 12.7.10 Regional Demand and Opportunities
- 12.8 Segment Growth Comparison
- 12.9 Segment Attractiveness and Priority Matrix
Chapter 13 North America Transformers End-Use and Application Market Outlook
- 13.1 End-Use Industry and Customer Demand Structure
- 13.2 Leading Applications and Customer Groups
- 13.3 End-Use Market Size, Share and Forecast
- 13.4 Major End-Use Industry Deep Dives
- 13.4.1 Customer Requirements and Use Cases
- 13.4.2 Demand and Replacement Cycles
- 13.4.3 Technical and Regulatory Considerations
- 13.4.4 Purchasing and Procurement Models
- 13.4.5 Leading Vendors and Distribution Channels
- 13.4.6 Forecast and Commercial Opportunities
- 13.5 Emerging Applications and Cross-Segment Demand
- 13.6 End-Use Industry Investment Priorities
Chapter 14 North America Transformers Geographic Market Outlook, 2025-2035
- 14.1 Regional Market Size and Country-Level Shares, 2025
- 14.2 Country Market Size Comparison, 2025
- 14.3 Country Market Forecasts, 2025-2035
- 14.4 Subregional Industrial and Demand Clusters
- 14.5 Intra-Regional Pricing and Cost Differences
- 14.6 Cross-Border Trade and Supply Networks
- 14.7 Regional Supply and Demand Balances
- 14.8 Country Opportunity Comparison and Prioritization
Note: Every listed country is covered on the structure shown under the first country.
Chapter 15 North America Transformers Technology, Innovation and Sustainability Outlook
- 15.1 Technology Landscape and Maturity
- 15.2 Product, Process and Service Innovation
- 15.3 AI, Automation and Digital Tools in the Industry
- 15.4 Technology Adoption and Performance Benchmarking
- 15.5 Innovation Pipeline and R&D Investment
- 15.6 Patent and Intellectual Property Trends
- 15.7 Energy Efficiency and Resource Management
- 15.8 Sustainability, Recycling and Circularity
- 15.9 Technology Roadmap, 2025-2035
- 15.10 Risks of Obsolescence and Technology Substitution
Chapter 16 North America Transformers Market Key Strategic Imperatives
- 16.1 Growth and Market Entry Priorities
- 16.2 High-Return Products and Segments
- 16.3 Pricing, Profitability and Cost Optimization
- 16.4 Technology Investment and Product Differentiation
- 16.5 Supply Chain Localization and Resilience
- 16.6 Distribution and Customer Acquisition
- 16.7 Partnership, Acquisition and Capacity Strategy
- 16.8 Regional Expansion Priorities
- 16.9 Short-, Medium- and Long-Term Actions
Chapter 17 Competition Outlook
- 17.1 Industry Competition Characteristics
- 17.2 Market Structure and Concentration
- 17.3 Market Share and Competitive Positioning, 2025
- 17.4 Company-Wise Revenue and Product Benchmarking
- 17.5 Production and Service Capacity Benchmarking
- 17.6 Technology, Pricing and Differentiation
- 17.7 Regional Footprint and Distribution Strength
- 17.8 Mergers, Acquisitions and Strategic Alliances
- 17.9 New Entrants and Competitive Threats
- 17.10 Porter's Five Forces and Industry Attractiveness
- 17.11 Competitive Outlook, 2025-2035
Chapter 18 Company Profiles
- 18.1 Company Coverage and Selection Criteria
- 18.2 Prolec GE
- 18.2.1 Business Description
- 18.2.2 Company Ownership and Geographic Presence
- 18.2.3 Product and Service Portfolio
- 18.2.4 Manufacturing and Operating Footprint
- 18.2.5 Production Capacity and Expansion Plans
- 18.2.6 Financial Performance and Investment
- 18.2.7 Market Share and Competitive Position
- 18.2.8 Technology and Innovation Capabilities
- 18.2.9 Strategic Alliances or Partnerships
- 18.2.10 Recent Developments
- 18.2.11 Growth Strategy and Outlook
- 18.3 Hitachi Energy
- 18.4 Eaton
- 18.5 Hammond Power Solutions
- 18.6 Siemens Energy
- 18.7 Other Relevant Market Participants
Note: Every listed company is profiled on the structure shown under the first company. The company list is preliminary and may change based on research findings, market developments, data availability and client requirements.
Chapter 19 Disclaimer
- 19.1 Research and Forecast Disclaimer
- 19.2 Data Source and Estimation Limitations
Note: The depth of individual sections depends on data availability for this market. Volume, capacity, trade and other unit-based metrics are included where applicable.

