
Compliance is moving school runs to contracted fleets
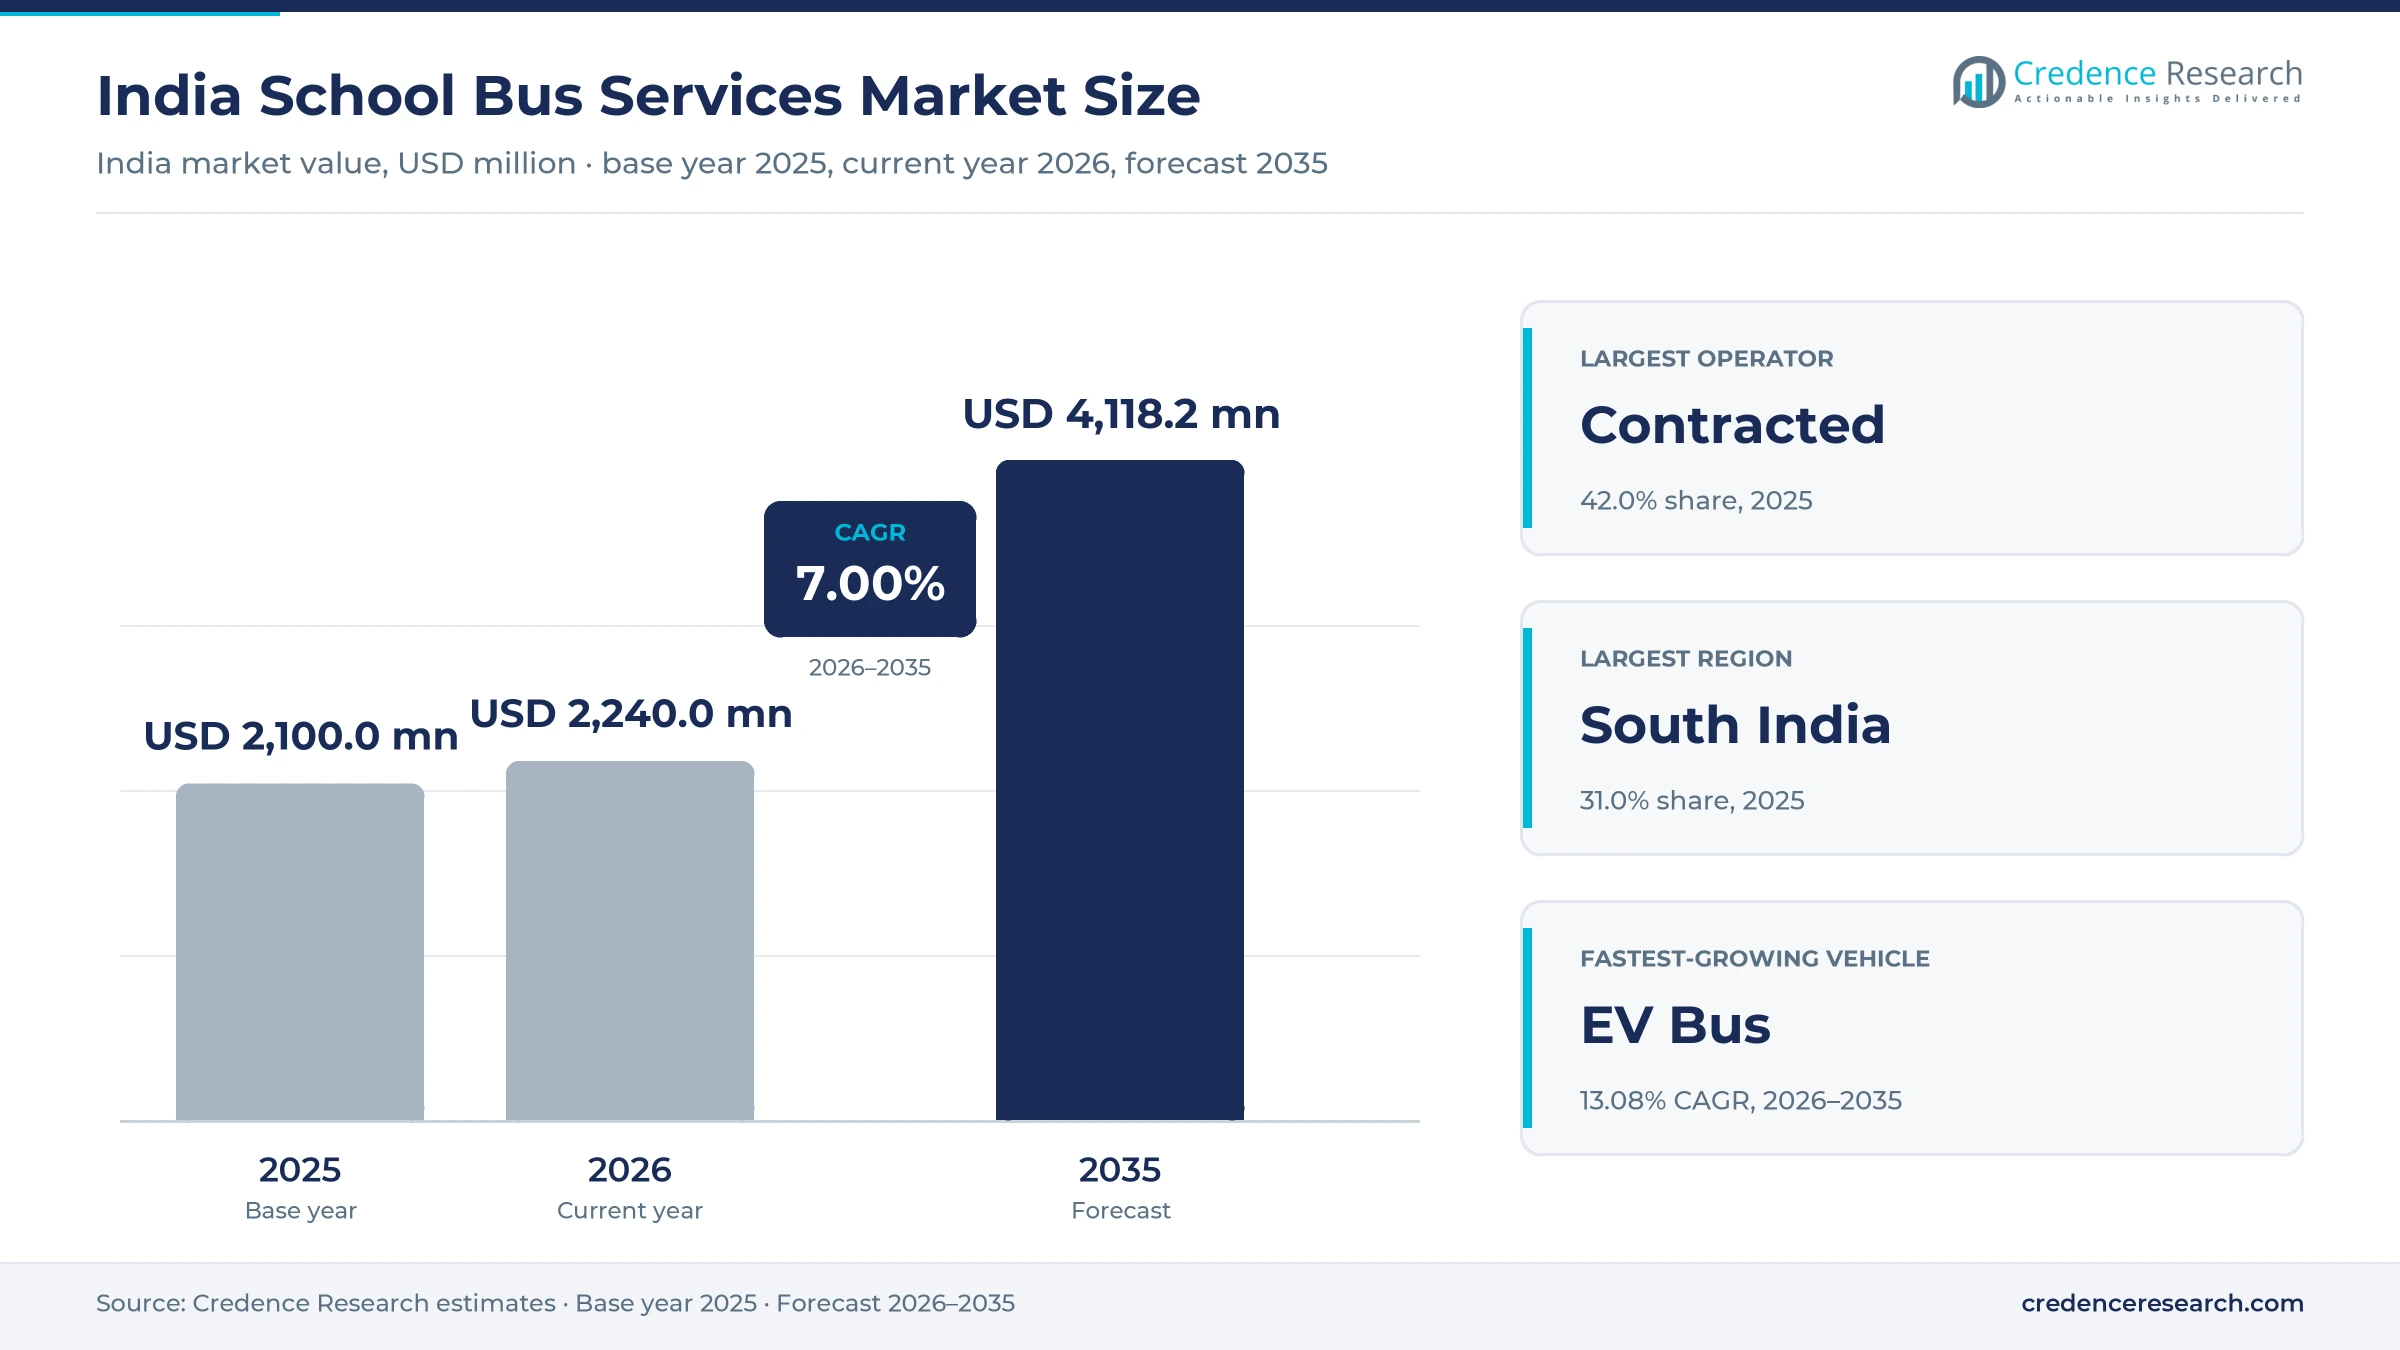
The India school bus services market was valued at USD 2.10 billion in 2025 and is projected to increase from USD 2.24 billion in 2026 to USD 4.12 billion by 2035, registering a CAGR of 7.00% during 2026–2035. Private unaided schools enrolled about 98.9 million students in 2025-26, according to UDISE+ data, and their families often pay for buses, vans or autos as well as tuition. South India held the largest regional share, 31.0% in 2025, supported by large registered fleets in Telangana, Kerala and Bengaluru. East India is the fastest-growing region at 7.56% a year as West Bengal and Bihar push pool cars and autos toward permits, GPS and fitness checks. Delhi's EV policy, notified on June 30, 2026, adds a further change because it requires 30% of school buses, whether owned, leased or hired, to be electric by March 31, 2030. As a result, compliant contracted fleets are gaining ground over informal operators.
What do school bus services in India include and how do schools buy them?
The market counts the annual value of moving students between home and school by bus, van or auto, including fees collected by schools that run their own fleets and payments to contractors. Schools either own vehicles, hire them from local contractors or leave families to arrange vans and autos directly, and fees are usually set by distance.
The market excludes the sale of vehicles, public transit passes and general staff transport. Vehicle makers, body builders, insurers and tracking vendors sit upstream, while school transport committees, regional transport offices and parents shape prices and compliance downstream.
India School Bus Services Market Insights
- The India school bus services market rises from USD 2.10 billion in 2025 to USD 4.12 billion by 2035, a 7.00% CAGR built on fee revisions and formalized routes.
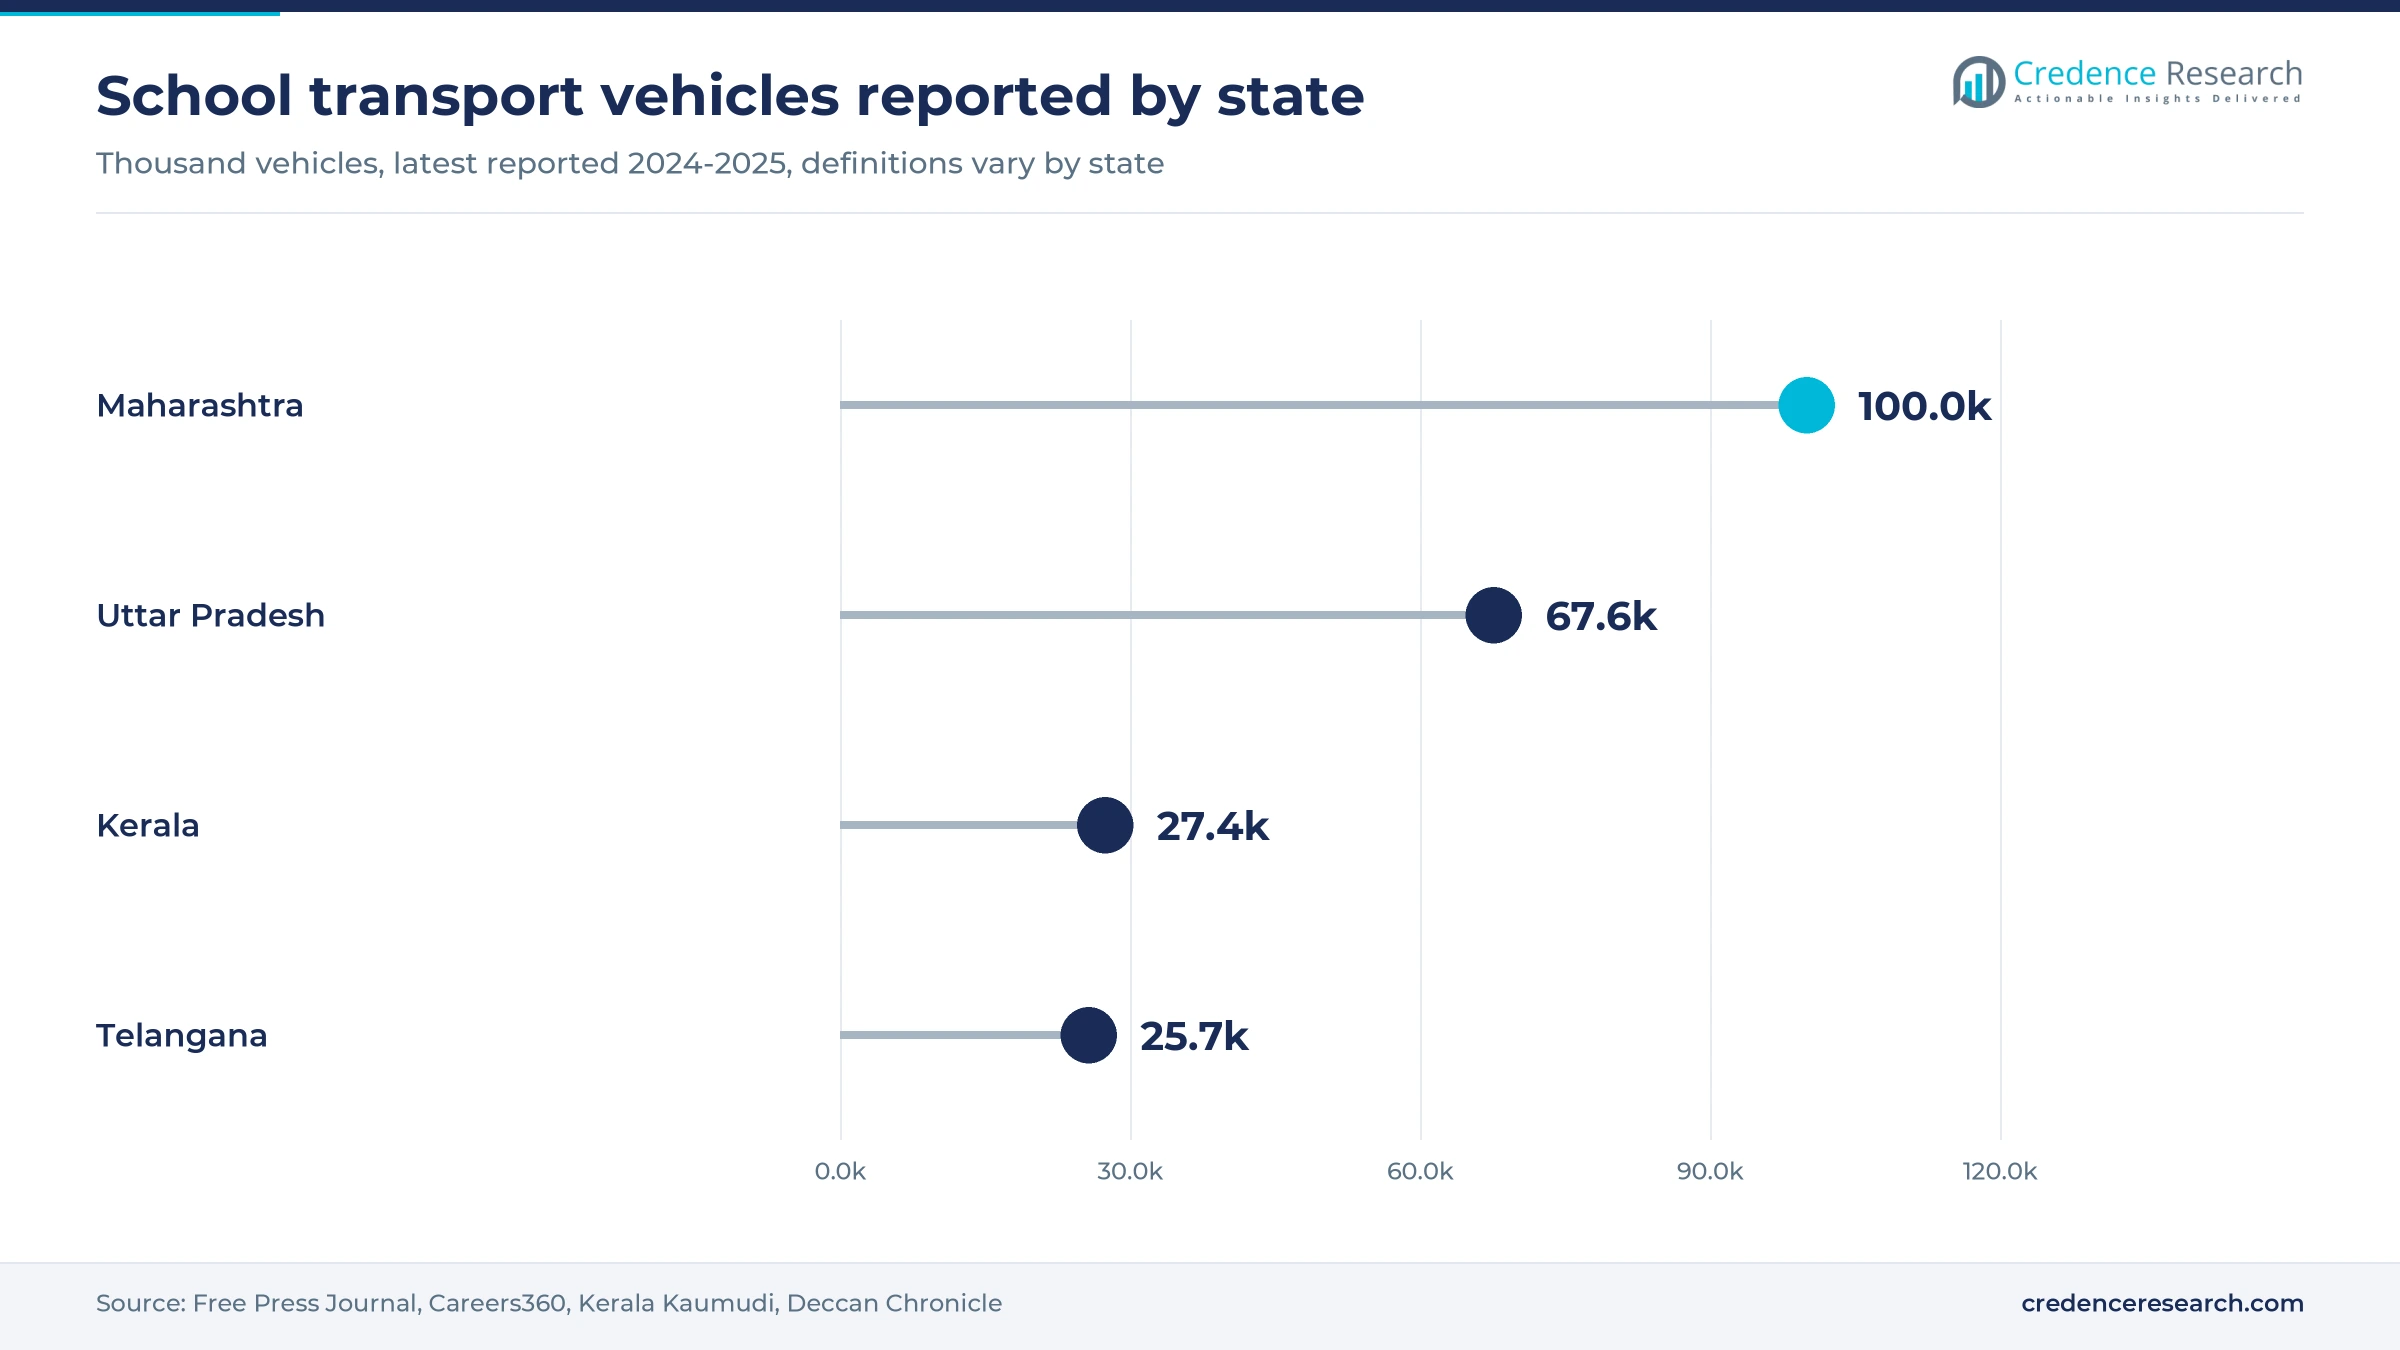
- South India held 31.0% of 2025 value, with Telangana alone reporting 25,677 school buses and Kerala another 27,400 in state transport department records.
- Contracted operators led with 42.0% of 2025 value, because most Delhi school buses are hired or leased rather than registered directly to schools.
- Delhi's EV policy, notified on June 30, 2026, requires 30% of owned, leased and hired school buses to be electric by March 31, 2030.
- Tata Motors, Ashok Leyland and Eicher supply the vehicles, while local contractors compete on routes and vendors such as Mobisoft Infotech and Tracko sell tracking.
Contracted operators lead as schools stop running fleets
Why do contracted operators lead school transport in India?
Based on operator, the market is categorized into contracted, school-owned and van/auto services. Contracted operators led with 42.0% of 2025 value because schools often hire rather than register buses, and the ICCT noted that most Delhi school buses are hired or leased while Vahan records show only 83 school and institutional buses there. Contracted operators also grow fastest at 7.81% a year as Delhi's policy counts hired and leased buses and as Uttar Pradesh seized 913 school vehicles in July 2025, which pushes schools toward vetted vendors. Van and auto services stay sizable, with about 60,000 unauthorized school vehicles in Maharashtra, according to the Free Press Journal.
How do buses, vans and electric buses divide school routes?
Based on vehicle, the market is categorized into bus, van and EV bus. Bus service led with 72.0% of 2025 value because full-size vehicles carry organized routes, and about 70% of school buses seat 30 to 40 passengers, according to electrive's October 2026 report on the India Clean Transport Summit. Vans fill narrower lanes, and Maharashtra proposed in July 2025 to recognize school vans carrying up to 12 passengers. EV Bus service grows fastest at 13.08% a year as daily runs of 50 to 60 kilometers suit charging between shifts and as Tata Motors showed its Ultra Skool 9/9 EV at Prawaas 5.0 in July 2026.
Why is GPS and RFID tracking the faster-growing service?
Based on service, the market is categorized into transport only and GPS/RFID tracked. Transport Only contracts led with 62.0% of 2025 value because tracking remains uneven, and Kerala Kaumudi reported in May 2024 that most schools had not followed the state's Vidya Vahan directive. GPS/RFID Tracked routes grow fastest at 8.67% a year as the Madhya Pradesh High Court required GPS and CCTV on every school bus in December 2024 and as the Bureau of Indian Standards began work on a national RFID model, according to Swarajya in November 2025. Vendors such as Tracko already sell RFID attendance cards and live parent apps to schools.
| Segment Group | Leading Sub-segment | Share, 2025 | Fastest-growing Sub-segment | CAGR, 2026–2035 |
|---|---|---|---|---|
| By Operator | Contracted | 42.0% | Contracted | 7.81% |
| By Vehicle | Bus | 72.0% | EV Bus | 13.08% |
| By Service | Transport Only | 62.0% | GPS/RFID Tracked | 8.67% |
Request a Free Sample
Fill in your details and we'll send you a free sample report.
- Sample data tables & charts
- Research methodology
Private enrollment and stricter rules drive paid transport
Enrollment and outsourcing lift paid school transport
Private school enrollment gives paid transport its base, because families choosing unaided schools pay for the commute as well as tuition. UDISE+ data for 2025-26, as analyzed by Arun C Mehta, show 247 million students in school, including 98.9 million in private unaided schools. The Ministry of Statistics ran its education survey from April to June 2025 to measure household spending. The ministry's August 2025 release put average spending at INR 25,002 per student in non-government schools against INR 2,863 in government schools. Most Delhi school buses are hired or leased, and about 90% of the city's 72,000 registered buses are private, according to the ICCT. In the Credence Research model this adds about 2.66 percentage points to annual growth to 2035.
Fleet compliance rules favor organized operators
Safety rules raise the cost of informal operation, and that gap favors organized fleets that can carry the paperwork. The Madhya Pradesh High Court ruled on Dec. 5, 2024, that buses older than 12 years cannot carry students, according to ETV Bharat. Uttar Pradesh inspected 46,748 of its 67,613 registered school buses and vans in July 2025 and issued 4,438 challans. Telangana warned operators in June 2025 after 8,657 of its 25,677 school buses lacked fitness certificates, according to Deccan Chronicle. West Bengal followed in December 2025 with directives on permits, panic buttons and attendants, according to Millennium Post. In the Credence Research model this adds about 1.96 percentage points to annual growth to 2035.
GPS routes and long contracts improve fleet utilization
GPS-enabled routes make contracted fleets easier to audit and fill, which improves utilization between the two daily school runs. Mobisoft Infotech announced in December 2025 that pilots of its student transport platform cut unscheduled delays by 35% and emergency response times by 50%, according to Autocar Professional. Its product joins digital boarding checks with automotive telematics, so schools can see driver speed beside boarding records. Off-peak income also helps longer contracts, since West Bengal's December 2025 directives let pool cars take other trips during off-hours. School buses run only 50 to 60 kilometers a day, according to electrive, which leaves spare vehicle hours. In the Credence Research model this adds about 1.26 percentage points to annual growth to 2035.
Fee revisions lift value faster than student numbers
Fee revisions lift market value even where ridership is stable, because operators pass fuel, insurance and compliance costs directly to parents. The School Bus Owners Association in Maharashtra raised charges by 15% from June 2026, and a parents' forum put bus fees at about INR 1,500 to INR 3,000. Operators in Raipur, Bhilai-Durg and Bilaspur planned increases of 15% to 20% the same month, according to The Hitavada. Bengaluru operators signaled a rise in April 2025, when one annual fee moved from INR 24,000 to INR 30,000, according to Star of Mysore. As a result, revenue per seat is rising faster than national enrollment, which added about 2.9 million students in 2025-26.
Electric mandates and RFID standards reshape school runs
Shift toward electric school fleets gains a legal anchor
Electric buses are moving from pilots into rules, and Delhi provides the clearest legal anchor. Delhi's EV policy, notified on June 30, 2026, requires 10% of owned, leased and hired school buses to be electric by the end of year two, 20% by year three and 30% by March 31, 2030. Tata Motors showed its Ultra Skool 9/9 EV at Prawaas 5.0 in July 2026, according to Sustainable Bus. A World Bank assessment cited by electrive, still under review, projects about 90,000 private electric buses by 2030, with educational institutions taking roughly 35%. Switch Mobility has also urged makers to develop school models with 30 and 40 seats. EV Bus service therefore grows at 13.08% a year, although it starts from a small base.
Rise of national RFID standards for school tracking
Tracking is shifting from separate school-by-school apps toward common national standards. The Bureau of Indian Standards announced a research project on an IoT model joining RFID, GPS and GSM modules, according to Swarajya in November 2025. Private schools in Delhi, Mumbai, Bengaluru and Hyderabad already run their own systems, so a standard would bring those purchases together. Kerala has gone further with Vidya Vahan, a state app that also applies to contract vehicles in a state with 27,400 school buses, according to Kerala Kaumudi. Vendors are responding, and Tracko sells attendance cards read by onboard RFID readers with live parent alerts. GPS/RFID Tracked routes gain from this shift at 8.67% a year through 2035.
Opening for regularized vans and pool cars
Regularizing informal operators opens a large conversion market for permits, retrofits and insurance. Maharashtra's transport minister told the Assembly that about 60,000 of 100,000 school vehicles were unauthorized, according to the Free Press Journal in July 2025. The state then announced a plan for a color-coded school van class carrying up to 12 passengers. West Bengal, with nearly 100,000 pool cars according to Devdiscourse, offered faster commercial registration in December 2025. Bihar let autos return to school duty in April 2025 on condition that they fit GPS and speedometers by June 1, according to Patna Press. Suppliers of fleet management tools and insurers can therefore sell to thousands of small owners who need formal records for the first time.
Opening for electric contracts that spare school capital
Service contracts can remove the capital barrier that keeps schools from buying electric vehicles. Electric school buses cost nearly twice as much as comparable combustion-engine models, according to electrive's October 2026 report. PMI Electro Mobility, which has deployed over 3,300 electric buses across more than 34 cities, ran school pilots and its chief operating officer for SPV operations said no school was ready to bear any extra cost for the switch. Rohit Bhan of Chartered Speed added that a school with five or 10 buses could not justify its own charging station, which favors shared depots. Delhi has proposed opening public depot chargers to school buses, so operators that combine routes across several campuses can offer lease models without asking schools for capital.
Fee resistance and illegal vans squeeze compliant operators
Fee hikes meet organized parent resistance
Fee increases are testing what parents will accept, which limits how quickly operators can recover costs. The Mahaparents Parents Association demanded withdrawal of Maharashtra's fee rise in June 2026 and asked that school transport committees approve any revision, according to Punekar News. The PTA United Forum put the added cost at INR 225 to INR 400, according to the Free Press Journal. Contractors may therefore face slower collections and disputes, and sharing cost records with school committees offers one practical remedy.
Unauthorized vans undercut compliant operators
Unauthorized vans undercut compliant operators because they can avoid permit, tax and insurance costs. The School Bus Owners' Association petitioned the Bombay High Court in July 2026, alleging that more than 5,000 Mumbai vans run without permits, insurance or tax payments, according to the Free Press Journal. Maharashtra's 7,206 penalties in one year raised INR 49.2 million, yet the problem persists. Licensed fleets lose price-sensitive routes as a result, so steady enforcement and a workable small-vehicle category remain the main remedies.
Fitness lapses expose fleets to seizure at reopening
Annual fitness deadlines create a recurring supply shock at the start of term. Telangana checked over 1,000 buses on its June 2026 opening day, booking more than 150 vehicles and seizing 35, according to Telangana Today. Greater Hyderabad had cleared 12,414 of 13,730 buses by then, which left more than 1,300 still outstanding. Uttar Pradesh found 1,768 vehicles with expired certificates in July 2025. Smaller owners feel this most because a seized bus strands routes, so early inspection booking is the practical remedy.
Charging access limits small electric fleets
Charging access limits electric adoption among small fleets, even where rules now demand the change. Many private operators park on roadsides, under flyovers or in rented spaces, according to electrive's October 2026 report, which leaves no site for chargers. The ICCT also identifies charging infrastructure as a large share of private operators' capital spending. Contractors therefore need shared depots or lender support, and the Ministry of Heavy Industries is evaluating help for 50,000 electric buses that could ease this burden if school fleets qualify.
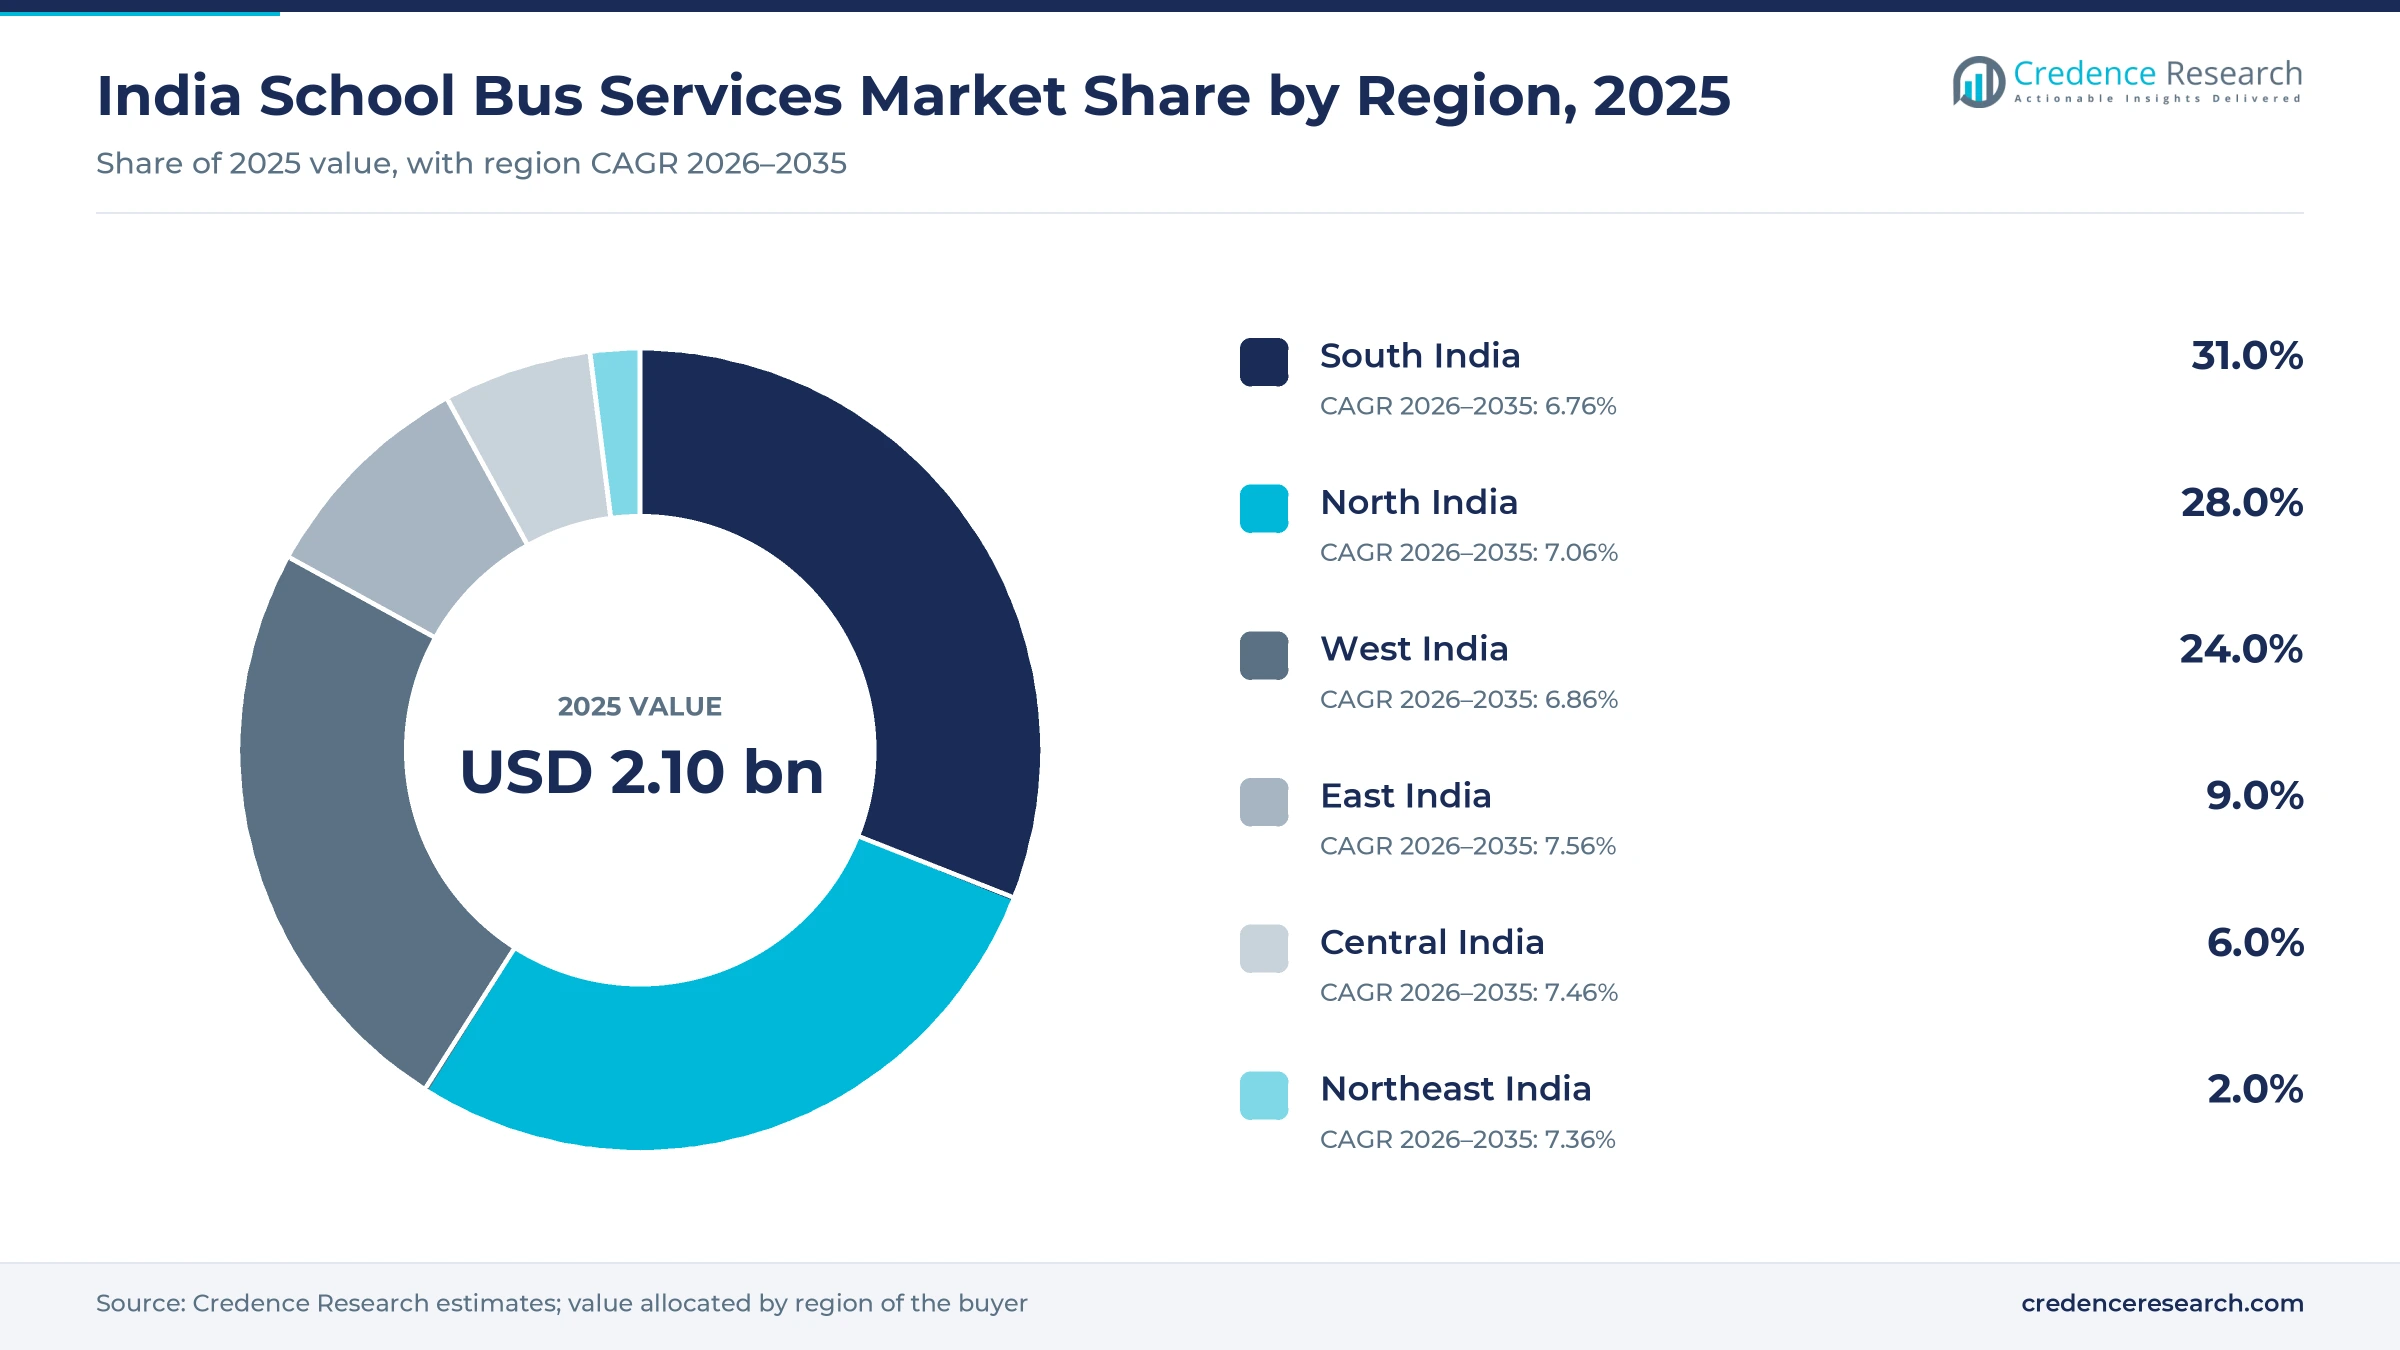
South India leads while East India formalizes fastest
| Region | Value, 2025 (USD billion) | Share, 2025 | CAGR, 2026–2035 |
|---|---|---|---|
| South India | 0.65 | 31.0% | 6.76% |
| North India | 0.59 | 28.0% | 7.06% |
| West India | 0.50 | 24.0% | 6.86% |
| East India | 0.19 | 9.0% | 7.56% |
| Central India | 0.13 | 6.0% | 7.46% |
| Northeast India | 0.04 | 2.0% | 7.36% |
South India leads on large registered fleets
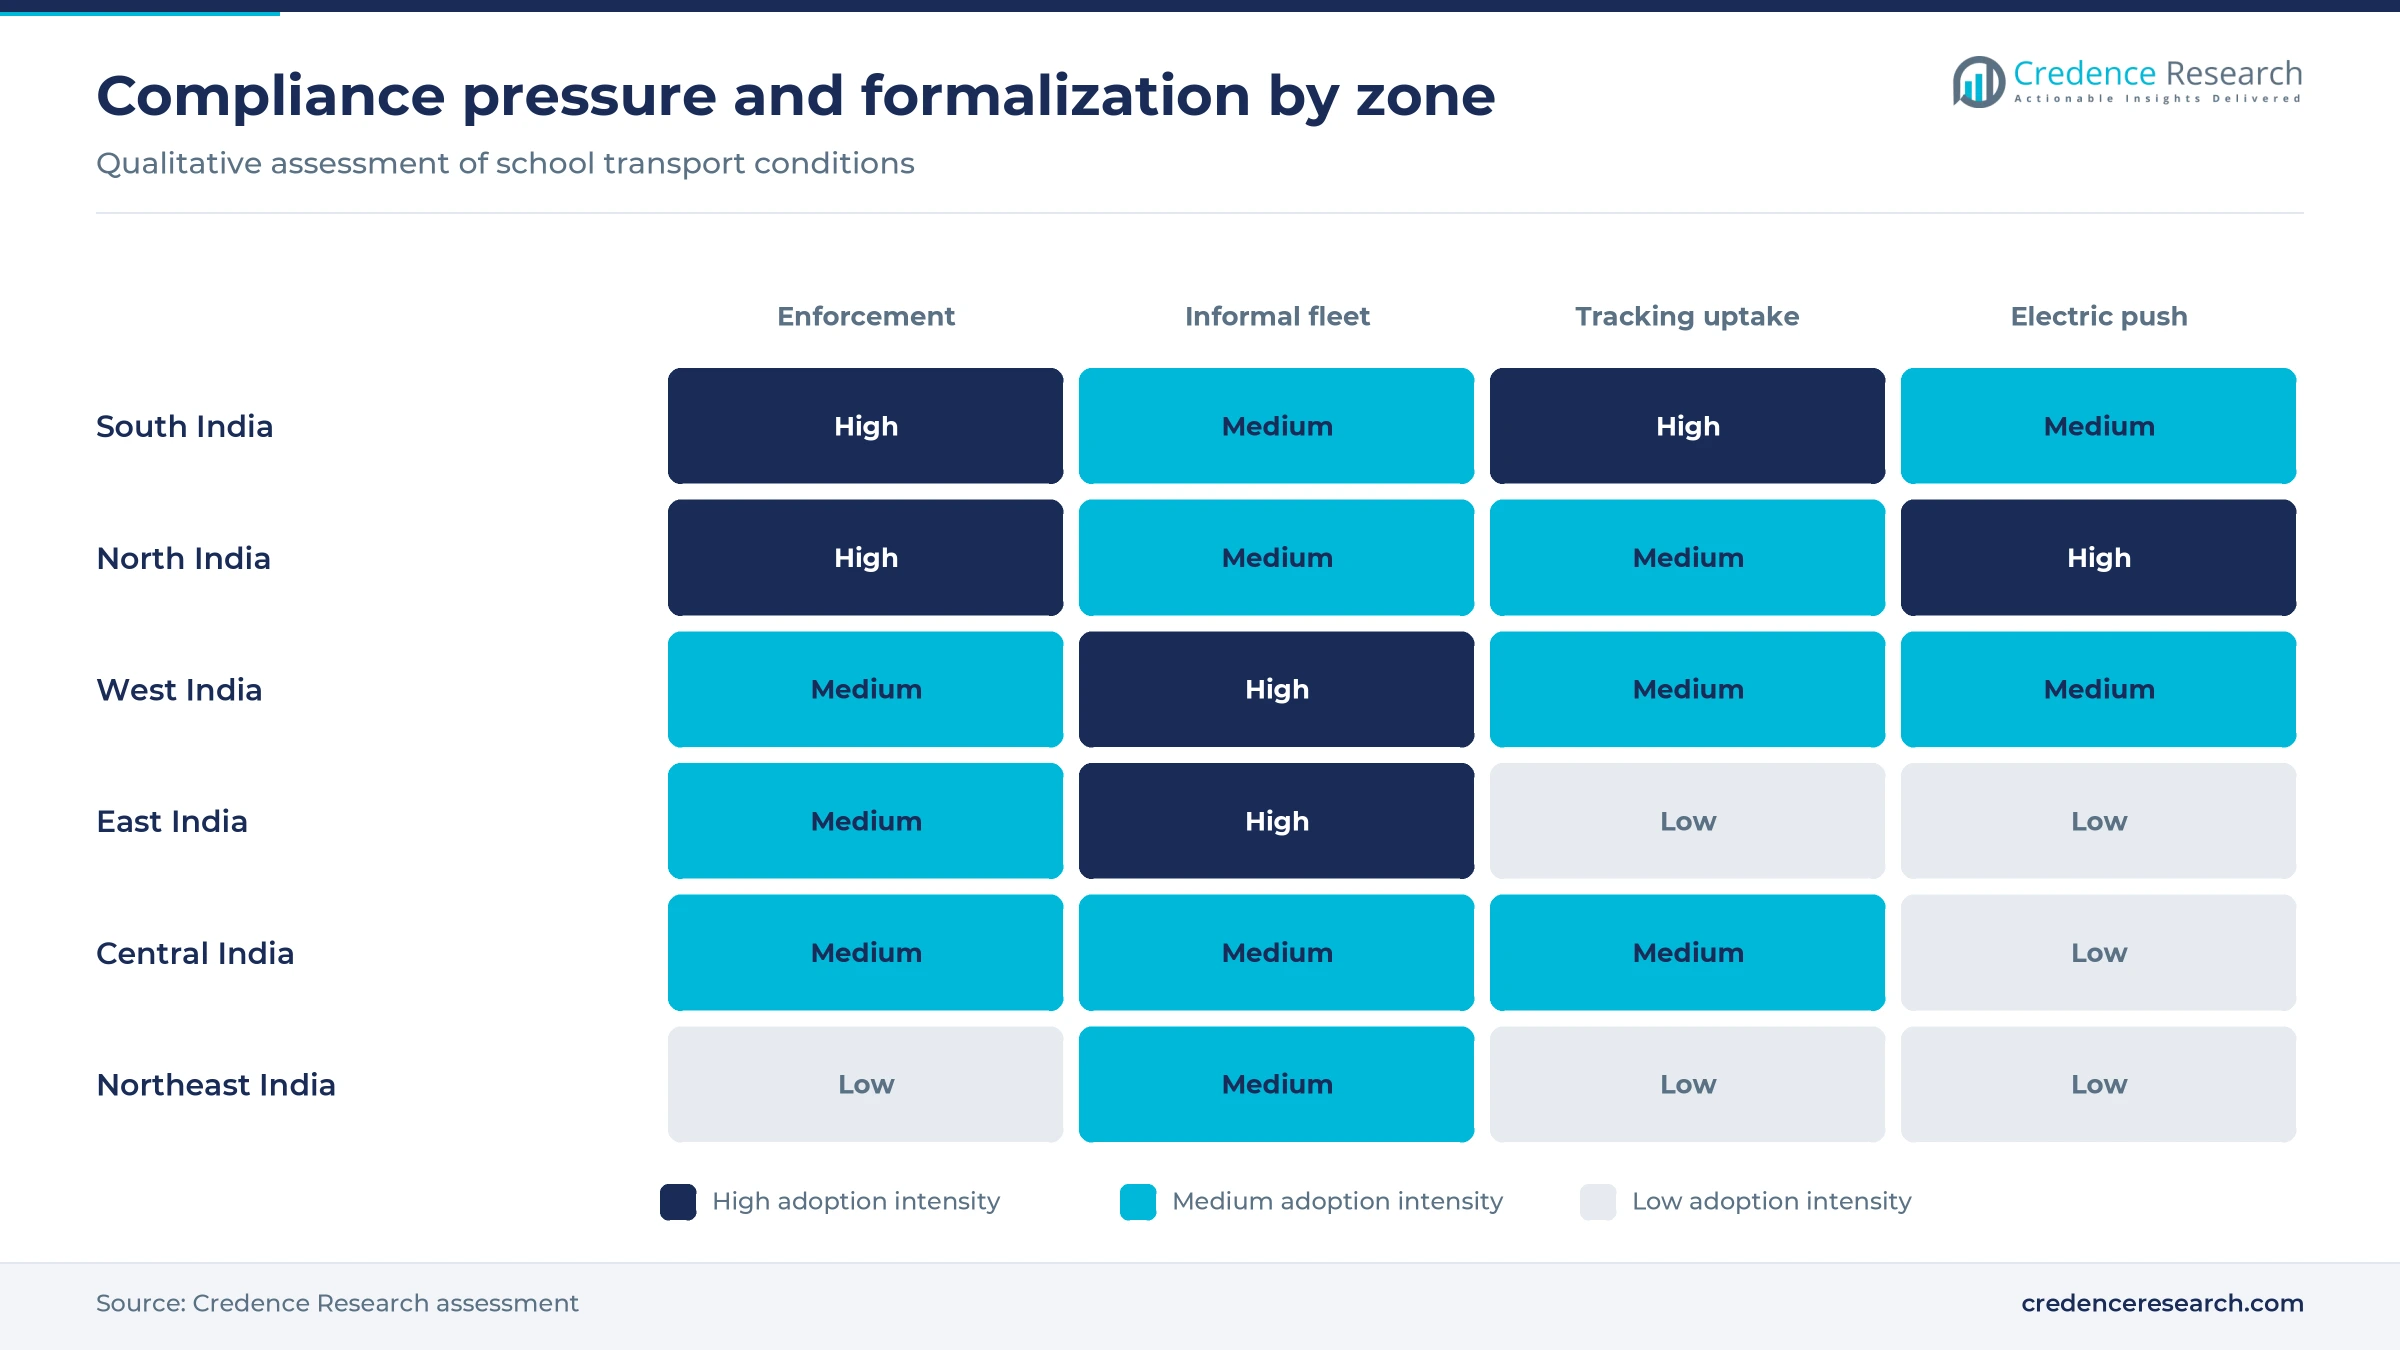
South India held 31.0% of 2025 value and grows at 6.76% a year, the slowest pace among the zones because its fleets are already large. Telangana reported 25,677 school buses in June 2025, and Kerala counts 27,400, according to Deccan Chronicle and Kerala Kaumudi. Bengaluru alone has over 15,000 school buses and vans, according to Star of Mysore. Tracking is also further along here, since Kerala's Vidya Vahan app gives parents and officials the same live view of each vehicle.
North India pairs inspections with electric rules
North India held 28.0% of 2025 value and grows at 7.06% a year. Uttar Pradesh reports the largest fleet among the zone's states reviewed, with 67,613 registered school buses and vans, and its transport commissioner ordered monthly reviews after the July 2025 drive. Delhi adds phased electric targets that also cover hired school fleets. Chandigarh issued challans to 215 buses and 1,089 three-wheelers between January 2023 and March 2024, according to The Tribune, and it ties transport compliance to school recognition.
West India turns on the Maharashtra van dispute
West India held 24.0% of 2025 value and grows at 6.86% a year, with Maharashtra setting the tone. Operators there organize through the School Bus Owners Association, which both sets fee revisions and litigates against illegal vans. Pune's transport office inspected 1,464 school vehicles between January and November 2025 and penalized 249, with fines of INR 6.2 million, according to the Free Press Journal. A state resolution of April 16, 2025, also requires schools to form transport committees, which gives buyers a formal role.
East India formalizes pool cars and autos fastest
East India held 9.0% of 2025 value and is the fastest zone at 7.56% a year, because a large informal fleet is moving into the permit system. West Bengal's December 2025 directives followed an accident in Uluberia that killed three children, and they require permits, panic buttons and attendants, according to Millennium Post. Bihar banned autos on school runs from April 1, 2025, and then readmitted them with GPS and speedometer conditions, according to Patna Press. Each conversion brings previously informal revenue into the organized market.
Central India follows the Madhya Pradesh court order
Central India held 6.0% of 2025 value and grows at 7.46% a year. The Madhya Pradesh High Court's December 2024 order followed a January 2018 Indore crash, and it limits bus age to 12 years while requiring GPS, CCTV and yellow livery, according to ETV Bharat. The age limit forces replacement spending that smaller owners must recover through fees. Operators in Raipur, Bhilai-Durg and Bilaspur in Chhattisgarh planned further fee increases in June 2026, according to The Hitavada.
Northeast India shows high transport cost per student
Northeast India held 2.0% of 2025 value and grows at 7.36% a year from a small base. Household survey data analyzed by Dataful show transport spending above INR 10,000 per student in Manipur and Sikkim, which may reflect longer trips in hill states. Assam's school education department directed private schools in November 2024 to enforce GPS, CCTV and yellow livery on buses, according to The Sentinel. Enforcement of those rules will decide how much of this spending reaches organized operators.
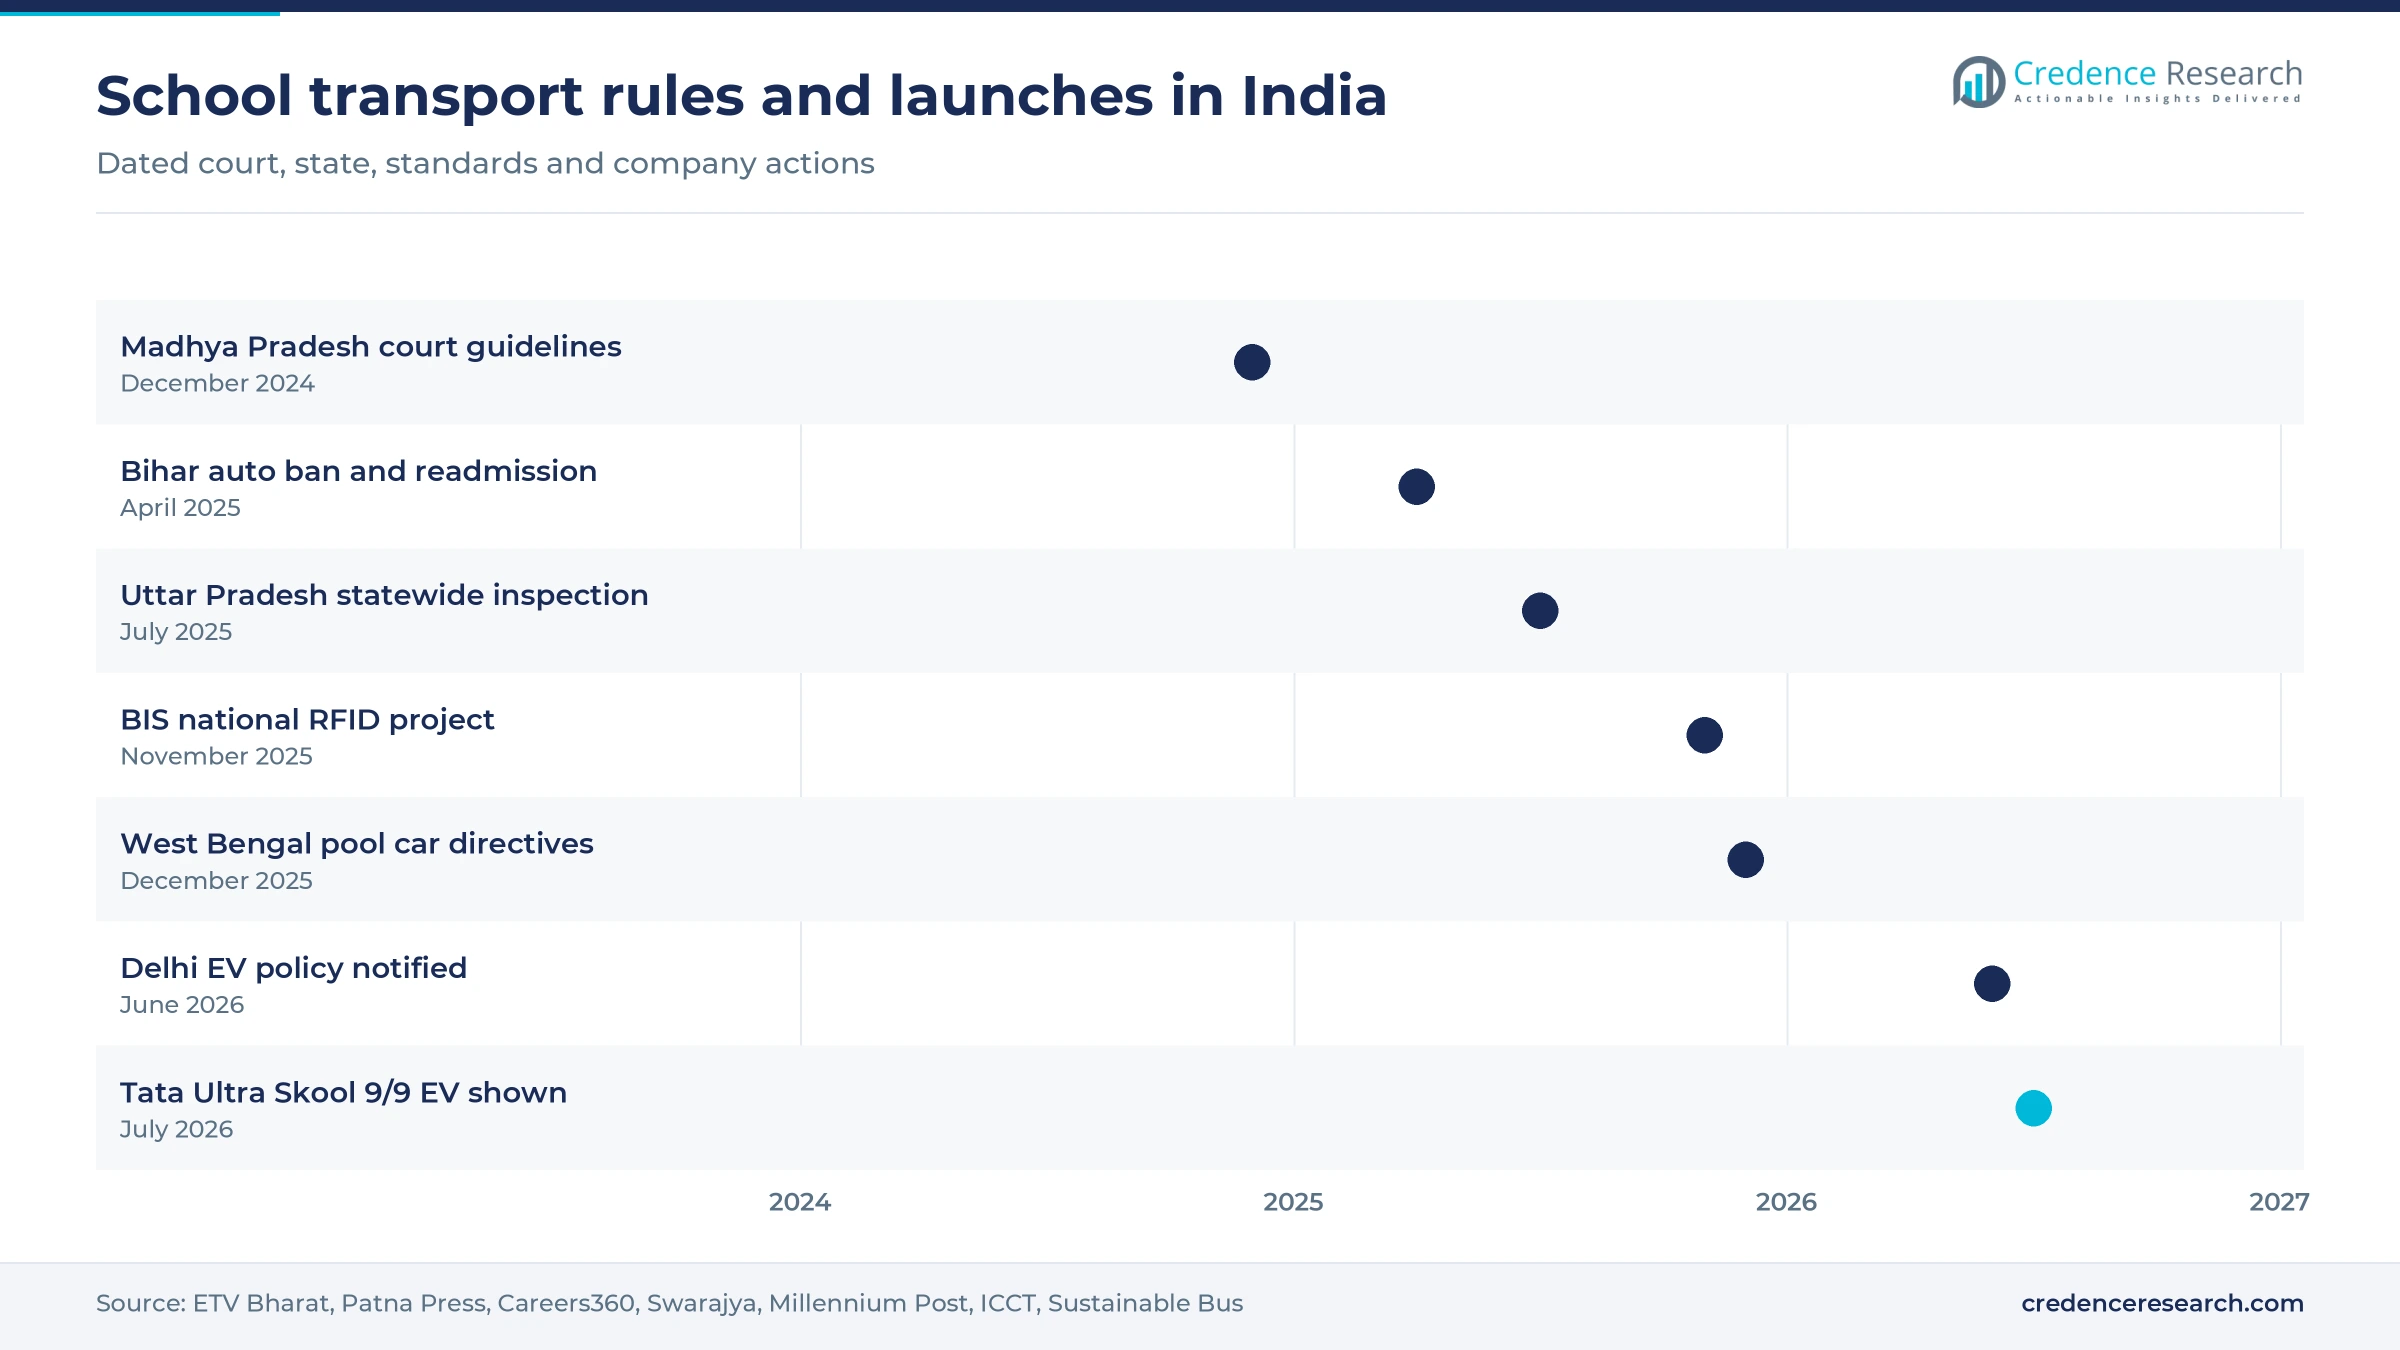
Courts and states tightened school transport from 2024
| Development | Status and market relevance |
|---|---|
| In December 2024, the Madhya Pradesh High Court issued school bus guidelines that bar buses older than 12 years and require GPS and CCTV. | In force statewide until specific Motor Vehicles Act provisions are made |
| In April 2025, Bihar banned autos and e-rickshaws from school runs and then readmitted autos that meet GPS and door conditions. | E-rickshaw ban remains and autos face compliance deadlines |
| In July 2025, Uttar Pradesh inspected 46,748 school vehicles in a statewide drive and seized 913 of them. | Monthly reviews ordered for regional transport offices |
| In November 2025, the Bureau of Indian Standards planned a research project on a national RFID model for school buses. | Design stage and not yet implemented |
| In June 2026, Delhi notified its EV policy with phased electric targets for owned, leased and hired school buses. | First 10% milestone falls two years after notification |
Tracking and electric drive change how routes are run
- GPS location tracking gives parents and officials live vehicle positions, and it became compulsory on Madhya Pradesh school buses under the December 2024 court order.
- RFID attendance cards mark each student's boarding and exit, and Tracko pairs them with panic and overspeed alerts in a parent app.
- In-bus CCTV supports driver and attendant oversight, and Pune police directed in 2025 that all vehicles carrying schoolchildren must fit cameras.
- Parent apps connect routes with school records, and Kerala requires schools to register parents' numbers in Vidya Vahan, a step that sits alongside student information systems in school offices.
- Electric drivetrains suit fixed daily runs of 50 to 60 kilometers, and school buses can weigh 1,000 to 1,100 kilograms less than urban buses, according to electrive.
Need a Custom Version of This Report?
Tailor the scope, geography, or segments to your exact requirements.
- Custom geography or segment scope
- Direct access to our analyst team
Local contractors compete as OEMs and tech vendors supply
Competition takes place route by route, because most contracts are held by local contractors and individual owners rather than national brands. Owners organize through bodies such as the School Bus Owners Association in Maharashtra and the Karnataka United School and Light Motor Vehicle Drivers' Union, which also speak for them on fee revisions. Tata Motors, Ashok Leyland and Eicher supply the commercial vehicles behind these fleets, and 91Trucks lists the Tata Starbus Ultra School with 56 seats at INR 1.7 million to INR 3.0 million. Electric specialists PMI Electro Mobility and Switch Mobility are testing or shaping school offers. Mobisoft Infotech and Tracko compete on tracking software instead of transport. Contracted operators are natural buyers of these tools, because they hold the largest market share and must show fitness, permit and tracking records to 2035. The strongest contractors win on document discipline and route density, because a failed fitness check can cost a school its whole morning run.
Companies profiled and their roles in this market
| Company | Type | Role in the market |
|---|---|---|
| Tata Motors | Bus OEM | Sells the Starbus Ultra School and showed the Ultra Skool 9/9 EV at Prawaas 5.0 in July 2026 |
| Ashok Leyland | Bus OEM | Sells the Sunshine, which 91Trucks lists among school transport buses for 2025 |
| Eicher | Bus OEM | Presented the Skyline Pro 3010 School at Prawaas 4.0 in August 2024, and Tractor Karvan lists the Skyline Pro Next among school buses for 2026 |
| PMI Electro Mobility | Electric bus operator | Has run school pilot tests and deployed over 3,300 electric buses across India |
| Switch Mobility | Electric bus OEM | Has urged makers to develop 30-seat and 40-seat electric school models |
| Mobisoft Infotech | Tracking software | Pune-based vendor of GPS, boarding verification and telematics for student transport |
| Tracko | Tracking software | Maverick Labs product with live GPS tracking, RFID attendance and a parent app |
Compliance capacity will decide who wins school contracts
Credence Research's view is that compliance capacity, not fleet size, will decide who holds school contracts by 2035. Inspections in Uttar Pradesh and Telangana show that many owners still struggle with fitness papers, and Delhi's policy now puts hired buses inside school accountability. As a result, schools have good reason to reduce vendor counts and ask for tracked routes. Van and auto operators remain essential on narrow lanes, but their revenue depends on how Maharashtra and Bihar settle small-vehicle rules. Electric buses will likely reach schools through operator leases rather than direct purchases.
How Credence Research sized school transport in India
The report uses 2025 as the base year and 2026 to 2035 as the forecast period. Market values come from the Credence Research model, and operator, vehicle, service and regional splits are Credence Research estimates. The inputs are government statistics such as UDISE+ and the Ministry of Statistics education survey, court orders, state transport department figures reported in the press, published fee revisions and company announcements. No interviews or surveys were conducted for this edition, and fee levels vary widely by city, so regional values carry more uncertainty than the national total.
Formal contracts and early electric fleets shape 2035
The market is forecast to reach USD 4.12 billion by 2035, growing at a 7.00% CAGR from USD 2.24 billion in 2026. Fee revisions and the move of van and pool car routes into permits should carry most of that value through 2030. Delhi's March 2030 target then tests whether electric contracts can spread beyond the capital, and a national mandate of the kind suggested by a World Bank transport specialist would speed that shift. Contracted fleets with tracked routes should gain market share by 2035, while South India stays the largest zone and East India keeps the fastest pace.
Frequently Asked Questions
How big is the India school bus services market?
Which operator type leads the market?
Which region is largest?
Which region grows fastest?
What rules are shaping school transport in India?
How fast will electric school buses grow?
How much do parents pay for school buses?
Who are the main companies in this market?
Table of Content
Chapter 1 Market Segmentation
- 1.1 Segmentation Framework
- 1.1.1 Product and Service Classification
- 1.1.2 Application and End-Use Classification
- 1.1.3 Technology and Solution Classification
- 1.1.4 Customer and Distribution Channel Classification
- 1.1.5 Geographic Segmentation
- 1.1.6 Market Segment Definitions and Boundaries
- 1.2 By Operator
- 1.2.1 Contracted
- 1.2.2 School-Owned
- 1.2.3 Van/Auto
- 1.3 By Vehicle
- 1.3.1 Bus
- 1.3.2 Van
- 1.3.3 EV Bus
- 1.4 By Service
- 1.4.1 Transport Only
- 1.4.2 GPS/RFID Tracked
Chapter 2 Introduction
- 2.1 Report Objectives and Scope
- 2.2 Product Definition and Industry Terminology
- 2.3 Market Inclusions and Exclusions
- 2.4 Research Process
- 2.4.1 Primary Research and Expert Interviews
- 2.4.2 Secondary Research and Source Review
- 2.4.3 Top-Down and Bottom-Up Estimation
- 2.4.4 Data Triangulation and Verification
- 2.5 Market Size Measurement Basis
- 2.5.1 2025: USD 2.10 billion → 2035: USD 4.12 billion
- 2.6 Historical and Forecast Reference Periods
- 2.6.1 Historical Period: 2018-2025
- 2.6.2 Base Year: 2025
- 2.6.3 Forecast Period: 2025-2035
- 2.7 Research Assumptions and Limitations
Chapter 3 Executive Summary
- 3.1 Market Snapshot and Key Findings
- 3.2 Base-Year Market Size, 2025
- 3.3 Forecast Market Size, 2035
- 3.4 Revenue and Volume Growth Outlook
- 3.5 Key Demand and Supply Indicators
- 3.6 Leading Market Segments
- 3.7 Fastest-Growing Market Opportunities
- 3.8 Regional Performance Highlights
- 3.9 Technology and Industry Transformation
- 3.10 Competitive Landscape Summary
- 3.11 Analyst View and Strategic Implications
Chapter 4 India School Bus Services Market Trends and Developments
- 4.1 Historical Industry Development, 2018-2025
- 4.2 Recent Market Trends and Developments
- 4.3 Demand and Customer Behavior Trends
- 4.4 Technology and Product Innovation
- 4.5 Artificial Intelligence, Automation and Digitalization
- 4.6 Local Manufacturing and Supply Chain Realignment
- 4.7 Industry Partnerships, Mergers and Acquisitions
- 4.8 Sustainability and Circular Economy Developments
- 4.9 Government and Private Sector Investment Trends
- 4.10 Emerging Business Models and Commercialization
- 4.11 Industry Developments and Announcements
Chapter 5 India School Bus Services Market Supply and Demand Analysis
- 5.1 Demand Trend and Consumption Analysis, 2018-2025
- 5.2 Demand Forecast, 2025-2035
- 5.3 Supply Chain Structure and Procurement Trends
- 5.4 Supply-Demand Gap and Bottlenecks
- 5.5 Import Dependence and Sourcing Structure
- 5.6 Regional Supply and Demand Concentration
Chapter 6 India School Bus Services Market Pricing Analysis
- 6.1 Pricing Structure and Measurement
- 6.2 Historical Pricing Trends, 2018-2025
- 6.3 Pricing Outlook, 2025-2035
- 6.4 Pricing by Product and Market Segment
- 6.5 Geographic Pricing Differences
- 6.6 Key Input, Energy, Labor and Logistics Costs
- 6.7 Contract Pricing and Purchasing Models
- 6.8 Pricing Sensitivity and Competitive Positioning
- 6.9 Price, Margin and Profitability Implications
Chapter 7 India School Bus Services Market Dynamics
- 7.1 Market Growth Drivers
- 7.1.1 Demand-Side Drivers
- 7.1.2 Technology and Innovation Drivers
- 7.1.3 Infrastructure and Investment Drivers
- 7.1.4 Regulatory and Policy Drivers
- 7.2 Market Restraints
- 7.2.1 Cost and Affordability Constraints
- 7.2.2 Technology and Adoption Barriers
- 7.2.3 Supply Chain and Operational Constraints
- 7.3 Market Challenges
- 7.3.1 Competitive Pressure and Margin Erosion
- 7.3.2 Skills, Infrastructure and Implementation Gaps
- 7.4 Emerging Market Opportunities
- 7.5 Market Dynamics Impact and Time-Horizon Assessment
Chapter 8 India School Bus Services Value Chain Analysis
- 8.1 Industry Value Chain Overview
- 8.2 Upstream Suppliers and Critical Inputs
- 8.3 Technology and Component Providers
- 8.4 Manufacturing or Service Delivery
- 8.5 Distribution, Channel Partners and Integrators
- 8.6 Downstream Applications and End Users
- 8.7 Value Addition and Profit Pools
- 8.8 Vertical Integration and Outsourcing
- 8.9 Supplier Concentration and Risk
- 8.10 Supply Chain Localization and Resilience
Chapter 9 India School Bus Services Market Regulations and Policies
- 9.1 Relevant Laws, Standards and Compliance Frameworks
- 9.2 Product, Service, Safety and Quality Requirements
- 9.3 Government Policies, Incentives and Subsidies
- 9.4 Imports, Exports and Trade Barriers
- 9.5 Public Procurement and Local Content Requirements
- 9.6 Data Protection, AI and Cybersecurity Compliance
- 9.7 Upcoming Policy Changes and Market Implications
Chapter 10 India School Bus Services Market Hotspots and Opportunities
- 10.1 Market Opportunity Mapping and Growth Hotspots
- 10.2 High-Growth Applications and Customer Groups
- 10.3 Underserved Markets and White-Space Opportunities
- 10.4 Emerging Technology and Product Opportunities
- 10.5 New Capacity and Investment Hotspots
- 10.6 Market Entry and Expansion Opportunities
- 10.7 Distribution and Partnership Opportunities
- 10.8 Near-Term and Long-Term Commercial Potential
- 10.9 Opportunity Attractiveness and Execution Risks
Chapter 11 India School Bus Services Market Outlook, 2025-2035
- 11.1 Market Size and Analysis
- 11.1.1 Revenue (Market Measurement: 2025: USD 2.10 billion → 2035: USD 4.12 billion)
- 11.1.2 Historical Market Size, 2018-2025
- 11.1.3 Base-Year Market Size, 2025
- 11.2 Market Forecast, 2025-2035
- 11.2.1 Revenue Forecast to 2035
- 11.2.2 CAGR and Year-on-Year Growth
- 11.2.3 Incremental Revenue Opportunity
- 11.3 Forecast Assumptions and Scenario Analysis
- 11.3.1 Base-Case Forecast
- 11.3.2 Optimistic and Conservative Scenarios
- 11.3.3 Technology, Pricing and Policy Sensitivities
- 11.4 Market Attractiveness and Growth Outlook
Chapter 12 India School Bus Services Market Segmentation and Outlook
- 12.1 Segmentation Summary and Market Shares, 2025
- 12.2 Largest and Fastest-Growing Segments
- 12.3 By Operator - Market Size and Forecast, 2025-2035
- 12.3.1 Segment Definition and Scope
- 12.3.2 Historical Market Size, 2018-2025
- 12.3.3 Revenue Forecast, 2025-2035
- 12.3.4 Base-Year Market Share, 2025
- 12.3.5 Segment CAGR and Growth Drivers
- 12.3.6 Subsegment Market Size and Forecast
- 12.3.6.1 Contracted
- 12.3.6.2 School-Owned
- 12.3.6.3 Van/Auto
- 12.3.7 Subsegment Pricing and Adoption Trends
- 12.3.8 Leading Suppliers and Competition
- 12.3.9 Regional Demand and Opportunities
- 12.4 By Vehicle - Market Size and Forecast, 2025-2035
- 12.4.1 Segment Definition and Scope
- 12.4.2 Historical Market Size, 2018-2025
- 12.4.3 Revenue Forecast, 2025-2035
- 12.4.4 Base-Year Market Share, 2025
- 12.4.5 Segment CAGR and Growth Drivers
- 12.4.6 Subsegment Market Size and Forecast
- 12.4.6.1 Bus
- 12.4.6.2 Van
- 12.4.6.3 EV Bus
- 12.4.7 Subsegment Pricing and Adoption Trends
- 12.4.8 Leading Suppliers and Competition
- 12.4.9 Regional Demand and Opportunities
- 12.5 By Service - Market Size and Forecast, 2025-2035
- 12.5.1 Segment Definition and Scope
- 12.5.2 Historical Market Size, 2018-2025
- 12.5.3 Revenue Forecast, 2025-2035
- 12.5.4 Base-Year Market Share, 2025
- 12.5.5 Segment CAGR and Growth Drivers
- 12.5.6 Subsegment Market Size and Forecast
- 12.5.6.1 Transport Only
- 12.5.6.2 GPS/RFID Tracked
- 12.5.7 Subsegment Pricing and Adoption Trends
- 12.5.8 Leading Suppliers and Competition
- 12.5.9 Regional Demand and Opportunities
- 12.6 Segment Growth Comparison
- 12.7 Segment Attractiveness and Priority Matrix
Chapter 13 India School Bus Services Geographic Market Outlook, 2025-2035
- 13.1 Domestic Market Distribution and Demand Clusters
- 13.2 State- or Province-Wise Market Size and Forecast, 2025-2035
- 13.3 City and Metropolitan Market Outlook
- 13.4 Industrial, Manufacturing and Commercial Clusters
- 13.5 Geographic Concentration of Key End Users
- 13.6 Local Pricing and Purchasing Differences
- 13.7 Domestic Production Facilities and Capacity Map
- 13.8 Local Infrastructure and Project Pipeline
- 13.9 State-Level Policy and Incentive Differences
- 13.10 Subnational Investment Hotspots and Opportunities
- 13.11 Distribution and Logistics Networks
- 13.12 Domestic Competitive Footprint
Chapter 14 India School Bus Services Technology, Innovation and Sustainability Outlook
- 14.1 Technology Landscape and Maturity
- 14.2 Product, Process and Service Innovation
- 14.3 AI, Automation and Digital Tools in the Industry
- 14.4 Technology Adoption and Performance Benchmarking
- 14.5 Innovation Pipeline and R&D Investment
- 14.6 Energy Efficiency and Resource Management
- 14.7 Sustainability, Recycling and Circularity
- 14.8 Technology Roadmap, 2025-2035
- 14.9 Risks of Obsolescence and Technology Substitution
Chapter 15 India School Bus Services Market Key Strategic Imperatives
- 15.1 Growth and Market Entry Priorities
- 15.2 High-Return Products and Segments
- 15.3 Pricing, Profitability and Cost Optimization
- 15.4 Technology Investment and Product Differentiation
- 15.5 Supply Chain Localization and Resilience
- 15.6 Distribution and Customer Acquisition
- 15.7 Partnership, Acquisition and Capacity Strategy
- 15.8 Regional Expansion Priorities
- 15.9 Short-, Medium- and Long-Term Actions
Chapter 16 Competition Outlook
- 16.1 Industry Competition Characteristics
- 16.2 Market Structure and Concentration
- 16.3 Market Share and Competitive Positioning, 2025
- 16.4 Company-Wise Revenue and Product Benchmarking
- 16.5 Production and Service Capacity Benchmarking
- 16.6 Technology, Pricing and Differentiation
- 16.7 Regional Footprint and Distribution Strength
- 16.8 Mergers, Acquisitions and Strategic Alliances
- 16.9 New Entrants and Competitive Threats
- 16.10 Porter's Five Forces and Industry Attractiveness
- 16.11 Competitive Outlook, 2025-2035
Chapter 17 Company Profiles
- 17.1 Company Coverage and Selection Criteria
- 17.2 Tata Motors
- 17.2.1 Business Description
- 17.2.2 Company Ownership and Geographic Presence
- 17.2.3 Product and Service Portfolio
- 17.2.4 Manufacturing and Operating Footprint
- 17.2.5 Financial Performance and Investment
- 17.2.6 Market Share and Competitive Position
- 17.2.7 Technology and Innovation Capabilities
- 17.2.8 Strategic Alliances or Partnerships
- 17.2.9 Recent Developments
- 17.2.10 Growth Strategy and Outlook
- 17.3 Ashok Leyland
- 17.4 Eicher
- 17.5 PMI Electro Mobility
- 17.6 Switch Mobility
- 17.7 Mobisoft Infotech
- 17.8 Tracko
- 17.9 Other Relevant Market Participants
Note: Every listed company is profiled on the structure shown under the first company. The company list is preliminary and may change based on research findings, market developments, data availability and client requirements.
Chapter 18 Disclaimer
- 18.1 Research and Forecast Disclaimer
- 18.2 Data Source and Estimation Limitations
Note: The depth of individual sections depends on data availability for this market. Volume, capacity, trade and other unit-based metrics are included where applicable.

