
Market Overview
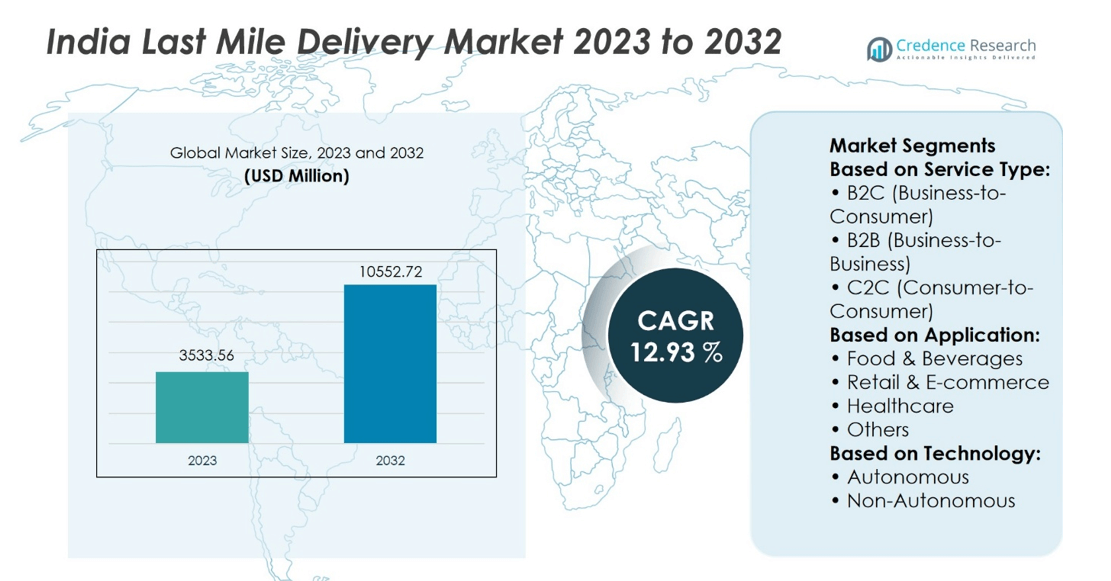
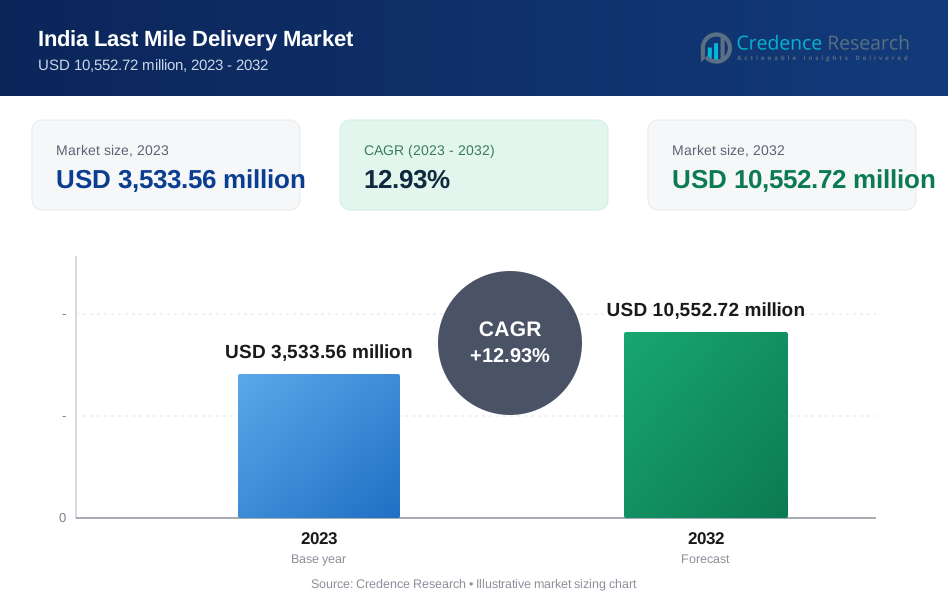
India Last Mile Delivery Market size was valued at USD 3533.56 million in 2023 and is anticipated to reach USD 10552.72 million by 2032, at a CAGR of 12.93% during the forecast period.
| REPORT ATTRIBUTE | DETAILS |
|---|---|
| Historical Period | 2020-2023 |
| Base Year | 2024 |
| Forecast Period | 2025-2032 |
| India Last Mile Delivery Market Size 2024 | USD 3533.56 million |
| India Last Mile Delivery Market, CAGR | 12.93% |
| India Last Mile Delivery Market Size 2032 | USD 10552.72 million |
The India Last Mile Delivery Market grows on strong drivers such as rapid e-commerce expansion, rising urbanization, and evolving consumer lifestyles that demand faster and more reliable fulfillment. It gains momentum from the adoption of advanced technologies like AI-driven route optimization, real-time tracking, and predictive analytics, which improve efficiency and transparency. Sustainability also shapes the market, with companies deploying electric vehicles and greener delivery models. Trends include the rise of hyperlocal networks, quick commerce, and expansion into tier-II and tier-III cities. It evolves as a critical enabler of digital commerce, blending innovation with nationwide accessibility.
The India Last Mile Delivery Market shows strong geographical variation, with southern and northern regions leading growth due to dense urban populations, advanced infrastructure, and high e-commerce penetration, while western and eastern regions expand steadily through rising digital adoption and localized logistics networks. Key players shaping the market include DHL Group, FedEx Corp, United Parcel Service Inc, com Inc, and Ekart. It reflects a competitive landscape where both global leaders and domestic specialists invest in technology, sustainability, and network expansion.
Market Insights
- India Last Mile Delivery Market size was valued at USD 3533.56 million in 2023 and is expected to reach USD 10552.72 million by 2032, at a CAGR of 12.93%.
- Rapid e-commerce growth, urbanization, and shifting consumer lifestyles drive strong demand for faster and reliable fulfillment.
- Adoption of AI-driven route optimization, predictive analytics, and real-time tracking improves delivery efficiency and customer transparency.
- Competition intensifies as global logistics leaders and domestic specialists invest in technology, sustainability, and network expansion.
- High operational costs, traffic congestion, and infrastructure gaps act as restraints that challenge profitability and service consistency.
- Southern and northern regions lead growth due to dense populations and advanced infrastructure, while western and eastern regions grow steadily with rising digital adoption.
- Key players such as DHL Group, FedEx Corp, United Parcel Service Inc, com Inc, and Ekart strengthen networks through innovation and strategic partnerships.
Market Drivers
E-Commerce Expansion Driving Delivery Volumes
The India Last Mile Delivery Market grows rapidly with the surge of e-commerce platforms serving urban and semi-urban regions. The rise of online marketplaces and direct-to-consumer brands fuels high-frequency order volumes. Consumers demand quick fulfillment, and this pushes companies to strengthen logistics infrastructure. Large players like Amazon and Flipkart scale delivery fleets to meet same-day and next-day expectations. Regional e-commerce startups expand networks to capture tier-II and tier-III demand. It supports growth in both parcel density and geographical coverage, making last mile delivery a critical enabler of online retail.
Rising Urbanization and Changing Consumer Lifestyles
Rapid urbanization shapes delivery models across metro and tier-I cities, where consumer lifestyles demand convenience. Increasing working populations depend on flexible delivery slots for groceries, apparel, and electronics. This trend creates opportunities for logistics companies to invest in micro-fulfillment centers. It also boosts reliance on technology-driven scheduling systems that optimize workforce efficiency. Food delivery platforms like Swiggy and Zomato influence consumer expectations for speed and reliability. The shift in lifestyle preferences accelerates last mile service adoption across urban clusters.
- For instance, Swiggy completed over 2,000 million orders in 2023, powered by AI-enabled demand prediction and optimized rider allocation, underscoring how changing lifestyles accelerate last mile service adoption across urban clusters.
Technological Integration Enhancing Delivery Efficiency
Advanced technology remains a key driver in improving efficiency and customer satisfaction. Artificial intelligence and route optimization tools reduce delivery times and fuel costs. Real-time tracking systems create transparency and trust for end-users. Companies invest in electric vehicles and drones to address sustainability concerns and reach congested or remote zones. It enhances operational resilience while supporting faster delivery turnaround. Logistics platforms integrate machine learning for demand prediction, aligning capacity with peak shopping seasons. The push for automation strengthens reliability in the India Last Mile Delivery Market.
- For instance, Delhivery does handle a very large volume of shipments. They process over 1.5 million packages daily, which translates to roughly 547.5 million shipments annually, not 1.5 billion.
Government Initiatives and Infrastructure Development
Supportive government initiatives act as a catalyst for market expansion. Investment in road networks, digital infrastructure, and smart city projects improves delivery accessibility. The introduction of policies favoring electric mobility encourages companies to deploy greener fleets. It helps logistics providers lower operational costs while aligning with sustainability goals. Regulatory frameworks for digital payments also promote cashless transactions, reducing delays in the delivery cycle. Public-private partnerships drive innovation in supply chain efficiency. Infrastructure reforms and digital adoption together create a favorable environment for scaling last mile delivery services.
Market Trends
Growth of Hyperlocal Delivery Models
The India Last Mile Delivery Market witnesses strong traction from hyperlocal models serving food, grocery, and essential retail categories. Consumers expect instant fulfillment, which drives companies to position dark stores and micro-warehouses closer to demand clusters. Food aggregators and quick commerce players dominate this trend with 10-to-30-minute delivery commitments. It pushes logistics partners to optimize delivery density and improve vehicle utilization. Retailers integrate hyperlocal services to compete with established marketplaces. The model supports demand in urban zones where convenience and immediacy influence purchasing choices.
Rising Adoption of Electric Vehicles and Green Logistics
Sustainability shapes operational strategies across last mile networks. Logistics companies invest in electric two-wheelers and small vans to reduce emissions and control fuel costs. It aligns with government policies that encourage greener fleets through incentives and infrastructure. Startups experiment with battery-swapping stations to increase vehicle availability. Large delivery firms form partnerships with EV manufacturers to scale adoption. The India Last Mile Delivery Market benefits from this trend by reducing environmental impact while achieving cost efficiency.
- For instance, Flipkart's announcement of over 10,000 electric vehicles in its delivery fleet, with a focus on Tier-1 cities, showcases its commitment to sustainable logistics.
Integration of Technology and Advanced Analytics
Technology adoption transforms how companies manage last mile delivery operations. Artificial intelligence tools enable precise demand forecasting, while advanced analytics support route planning. It reduces delivery times and ensures better allocation of fleets during peak periods. Real-time tracking platforms enhance customer engagement and satisfaction. Digital twins and simulation software gain traction for supply chain optimization. Companies also expand API integrations with retailers to create seamless fulfillment experiences across industries.
- For instance, Delhivery reported handling 250 million shipments in fiscal supported by machine learning algorithms for demand prediction.
Expansion into Rural and Semi-Urban Markets
Demand increasingly shifts beyond metro cities into tier-II and tier-III locations. Logistics players expand networks and set up localized distribution centers to meet growing rural orders. It requires flexible vehicle models and innovative delivery formats like hub-and-spoke systems. E-commerce firms push deeper penetration into underserved markets to capture new customers. Partnerships with regional logistics startups strengthen rural accessibility. This expansion diversifies growth sources and positions last mile delivery as a nationwide enabler of digital commerce.
Market Challenges Analysis
High Operational Costs and Logistical Complexities
The India Last Mile Delivery Market faces constant pressure from rising operational costs and logistical hurdles. Fuel price fluctuations, vehicle maintenance, and labor expenses create challenges in sustaining profitability. It struggles with fragmented networks where delivery partners manage multiple locations without efficient route planning. Urban congestion further delays fulfillment and adds to fuel consumption. Companies attempt to balance affordability with service quality, but high costs continue to erode margins. Seasonal peaks amplify complexities as demand surges require extra capacity and workforce. These factors make cost optimization one of the toughest challenges for logistics providers.
Infrastructure Gaps and Workforce Constraints
Limited infrastructure and workforce availability hinder reliable last mile execution across diverse regions. Many rural and semi-urban areas lack proper road connectivity, which restricts access for delivery fleets. It becomes difficult for companies to maintain consistency in service levels when infrastructure fails to support demand. Delivery personnel shortages create high attrition rates, impacting reliability and increasing training costs. Safety risks for riders in congested cities further complicate workforce stability. Payment collection in cash-on-delivery transactions also adds delays and inefficiencies. These structural barriers slow down the ability of the India Last Mile Delivery Market to achieve seamless nationwide coverage.
Market Opportunities
Expansion through Tier-II and Tier-III Market Penetration
The India Last Mile Delivery Market holds strong opportunities in expanding services to tier-II and tier-III cities, where e-commerce adoption continues to accelerate. Rising internet penetration and smartphone usage drive consumer access to digital marketplaces in semi-urban and rural areas. Companies can strengthen presence by establishing localized distribution hubs and partnering with regional logistics firms. It opens access to untapped demand while building brand loyalty in underserved regions. Flexible vehicle fleets and hub-and-spoke delivery models create efficient networks across diverse geographies. This expansion enables logistics providers to diversify revenue streams while improving national coverage.
Leveraging Technology and Sustainable Delivery Models
Advanced technology integration presents significant opportunities to optimize last mile operations. Artificial intelligence, predictive analytics, and automation enhance route efficiency, reduce delivery timelines, and improve customer experience. It allows companies to streamline operations during peak demand while lowering costs. Electric vehicles and green logistics strategies offer opportunities to align with sustainability goals while reducing fuel dependency. Partnerships with EV manufacturers and investments in charging infrastructure strengthen long-term scalability. The growing emphasis on eco-friendly logistics creates a favorable environment for innovation, positioning the India Last Mile Delivery Market as a driver of sustainable growth.
Market Segmentation Analysis:
By Service Type
The India Last Mile Delivery Market operates across B2C, B2B, and C2C delivery models, with B2C maintaining dominance due to the strong growth of e-commerce platforms. Consumers demand faster and more reliable delivery for online purchases, and companies respond with same-day and next-day services. B2B deliveries also gain momentum as manufacturers and wholesalers seek efficient supply chain links to retailers. It drives partnerships between logistics providers and enterprise clients to handle bulk movements with speed and accuracy. The C2C segment rises with digital platforms enabling peer-to-peer shipments, particularly in urban areas where convenience and affordability influence choices.
- For instance, Ekart, Flipkart’s logistics arm, processes over 10 million shipments per month, backed by expansive fulfillment infrastructure and optimized delivery networks, illustrating how B2C demand drives scale and innovation in last mile operations.
By Application
Food and beverages represent a significant share within last mile delivery due to the popularity of online food aggregators and quick commerce platforms. It creates demand for rapid fulfillment supported by dense local distribution networks. Retail and e-commerce applications expand quickly as online shopping penetrates across metros and semi-urban centers. Healthcare delivery, including medicines and critical supplies, emerges as a high-value application where precision and reliability remain essential. Other segments, including consumer electronics and personal goods, strengthen demand diversity and require flexible service models. The broadening of applications reinforces last mile delivery as a vital enabler of India’s digital economy.
By Technology
The integration of technology reshapes service capabilities across autonomous and non-autonomous delivery models. Non-autonomous delivery remains the current backbone, supported by fleets of two-wheelers, vans, and local distribution vehicles. It accounts for most volumes while companies focus on optimizing routes through AI and advanced analytics. Autonomous delivery represents an emerging frontier, with trials of drones and robotic carriers in controlled environments. Logistics providers invest in automation to address labor shortages, cut costs, and expand into hard-to-reach areas. The gradual adoption of autonomous solutions signals the market’s long-term shift toward innovative and sustainable delivery models.
- For instance, Delhivery operates in over 18,000 pin codes across India and processes more than 1.5 million shipments daily, supported by automated sortation hubs and AI-powered route planning systems.
Segments:
Based on Service Type:
- B2C (Business-to-Consumer)
- B2B (Business-to-Business)
- C2C (Consumer-to-Consumer)
Based on Application:
- Food & Beverages
- Retail & E-commerce
- Healthcare
- Others
Based on Technology:
- Autonomous
- Non-Autonomous
Based on the Geography:
- Southern India
- Northern India
- Western and Eastern India
Regional Analysis
Southern India
Southern India accounts for the largest share of the India Last Mile Delivery Market, contributing around 35% of the overall market. The region benefits from strong e-commerce penetration in states such as Karnataka, Tamil Nadu, Telangana, and Kerala, where urban populations adopt digital platforms at scale. Bengaluru, Chennai, and Hyderabad lead demand due to their concentration of tech-savvy consumers, advanced logistics infrastructure, and high density of delivery startups. Food and grocery delivery platforms such as Swiggy, BigBasket, and Dunzo strengthen last mile activity by building dense hyperlocal networks. It also benefits from strong connectivity through highways and expanding warehousing clusters, which enable efficient supply chain flows. The presence of multinational e-commerce giants and local logistics players ensures consistent innovation in delivery models, including the early adoption of electric vehicles. Southern India sets the benchmark for speed, efficiency, and digital adoption within last mile logistics.
Northern India
Northern India represents about 30% of the India Last Mile Delivery Market, driven by the economic influence of Delhi NCR, Punjab, Uttar Pradesh, and Haryana. The region is marked by high consumer spending and growing online retail adoption across urban and semi-urban clusters. Delhi NCR serves as a critical hub where logistics providers experiment with express delivery models to meet demand for same-day and next-day services. Food delivery continues to expand rapidly, supported by a young population and rising preference for convenience. It faces challenges from traffic congestion and seasonal disruptions, which force companies to adopt advanced route optimization and micro-warehousing strategies. Demand for healthcare delivery is also increasing, particularly in cities like Lucknow and Chandigarh, where timely access to medicines and medical devices has become critical. Northern India continues to attract heavy investment in last mile logistics infrastructure due to its large consumer base.
Western and Eastern India
Western India accounts for about 20% of the India Last Mile Delivery Market, led by Maharashtra and Gujarat where cities such as Mumbai, Pune, and Ahmedabad drive demand. High population density, thriving retail ecosystems, and the presence of major ports like Mumbai and Kandla support robust delivery operations. Logistics providers invest in hyperlocal fulfillment centers and electric two-wheeler fleets to manage demand efficiently across urban and industrial corridors. Eastern India contributes nearly 15% of the market, covering West Bengal, Odisha, Bihar, and Jharkhand. Demand concentrates in cities like Kolkata, Bhubaneswar, and Patna, where e-commerce platforms partner with regional logistics startups to expand reach. The region faces infrastructure challenges such as poor road connectivity and workforce shortages, yet rising digital penetration and growing healthcare delivery needs sustain momentum. Together, Western and Eastern India represent 35% of the India Last Mile Delivery Market, offering a mix of mature urban demand and emerging opportunities in underserved regions.
Key Player Analysis
Competitive Analysis
The India Last Mile Delivery Market include DHL Group, United Parcel Service Inc, FedEx Corp, com Inc, and Ekart. The India Last Mile Delivery Market is highly competitive, with both global logistics providers and domestic companies expanding aggressively to capture growing e-commerce and retail demand. Competition intensifies around delivery speed, service reliability, and coverage across metro, semi-urban, and rural areas. Companies differentiate through investments in technology such as AI-driven route optimization, real-time tracking systems, and predictive analytics to enhance operational efficiency. Sustainability has become a defining factor, with firms deploying electric vehicles and exploring alternative delivery models to reduce costs and environmental impact. Hyperlocal delivery networks, quick commerce integration, and healthcare logistics also emerge as areas of strong rivalry. The ability to scale infrastructure rapidly, align with regional needs, and build customer-centric solutions shapes competitive positioning. Players that leverage innovation, invest in localized hubs, and create end-to-end digital ecosystems are better positioned to lead in this evolving market.
Recent Developments
- In March 2025, Ekart partnered with IKEA to manage last-mile deliveries of home furnishings in North India.
- In January 2025, FedEx launched FedEx Surround® in India, an advanced monitoring and intervention solution designed to provide near-real-time shipment visibility, AI-powered predictive analytics, and enhanced handling for sensitive shipments.
- In December 2024, Indian Railways is transforming its parcel business through improved logistics efficiency, streamlined operations, and the use of digital tracking systems. Such upgrades shorten transit times and facilitate quicker movement of goods nationwide.
- In August 2024, Amazon India entered into an MoU with Indian Railways to improve the logistics of e-commerce through the optimization of hub-and-spoke networks and utilization of railway infrastructure for quicker movement of packages.
Market Concentration & Characteristics
The India Last Mile Delivery Market displays moderate concentration, where a mix of global logistics providers, e-commerce giants, and domestic specialists compete for market share. It is defined by high-volume parcel movements driven by e-commerce growth, food delivery expansion, and increasing adoption of hyperlocal models. Large players dominate metro and tier-I cities with advanced technology, dense fleets, and established infrastructure, while regional operators play a crucial role in tier-II and tier-III locations by offering flexible and cost-effective services. The market emphasizes speed, transparency, and reliability, with consumers expecting real-time tracking, faster fulfillment, and convenient payment options. It continues to shift toward sustainability, with growing investments in electric vehicles and green logistics solutions. Intense competition fosters innovation, pushing companies to adopt AI-based route optimization, digital platforms for customer engagement, and partnerships that strengthen last mile networks. Market characteristics also include high operational costs, workforce dependency, and the need for scalable delivery infrastructure to meet fluctuating demand. The India Last Mile Delivery Market reflects a dynamic structure where scale, adaptability, and technology integration determine long-term leadership.
Report Coverage
The research report offers an in-depth analysis based on Service Type, Application, Technology and Geography. It details leading market players, providing an overview of their business, product offerings, investments, revenue streams, and key applications. Additionally, the report includes insights into the competitive environment, SWOT analysis, current market trends, as well as the primary drivers and constraints. Furthermore, it discusses various factors that have driven market expansion in recent years. The report also explores market dynamics, regulatory scenarios, and technological advancements that are shaping the industry. It assesses the impact of external factors and global economic changes on market growth. Lastly, it provides strategic recommendations for new entrants and established companies to navigate the complexities of the market.
Future Outlook
- E-commerce growth will continue to drive higher parcel volumes across metro and semi-urban regions.
- Quick commerce and hyperlocal delivery will expand further with demand for groceries and essentials.
- Companies will increase adoption of electric vehicles to lower fuel costs and support sustainability goals.
- Investment in micro-fulfillment centers will improve speed and delivery efficiency.
- Artificial intelligence and predictive analytics will enhance route planning and demand forecasting.
- Drone and autonomous delivery trials will gain momentum in controlled environments.
- Tier-II and tier-III cities will emerge as high-potential markets for logistics expansion.
- Healthcare and pharmaceutical delivery will gain strategic importance with rising online demand.
- Strategic partnerships between logistics providers and e-commerce platforms will strengthen service networks.
- Customer expectations for real-time tracking and flexible delivery options will shape innovation in services.
Request a Free Sample
Fill in your details and we'll send you a free sample report.
- Sample data tables & charts
- Research methodology
Need a Custom Version of This Report?
Tailor the scope, geography, or segments to your exact requirements.
- Custom geography or segment scope
- Direct access to our analyst team
Frequently Asked Questions
What is the market size of the India last mile delivery market in 2023, and what is it projected to be in 2032?
What are the key drivers for the growth of the last mile delivery market in India?
How is technology influencing last mile delivery in India?
Which regions are driving the growth of last mile delivery in India?
Who are the major players in the India Last Mile Delivery Market?
Table of Content
Chapter 1. Report Introduction
- 1.1 Report Description & Purpose
- 1.1.1 Report Title & Market Definition
- 1.1.2 Unique Selling Propositions (USP) & Key Differentiators
- 1.1.3 Value Proposition for Stakeholders
- 1.2 Research Objectives
- 1.2.1 Market Sizing Objectives (Volume & Revenue) (Volume Where Applicable)
- 1.2.2 Segmentation Objectives
- 1.2.3 Competitive Intelligence Objectives
- 1.2.4 Forecast & Scenario Objectives
- 1.3 Report Scope
- 1.3.1 India Last Mile Delivery Scope – Segments & Subsegments Covered
- 1.3.2 Geographic Scope – Selected Country & Subnational Markets Covered
- 1.3.3 Historical Period, Base Year & Forecast Period (2023; forecast to 2032)
- 1.3.4 Inclusions & Exclusions
- 1.4 Industry Classification & Applicable Codes
- 1.5 Currency, Measurement Units & Valuation Basis
- 1.6 Target Stakeholders
- 1.7 Limitations & Assumptions
Chapter 2. Executive Summary
- 2.1 India Last Mile Delivery Snapshot
- 2.1.1 Market Size – Historical (2023) & Forecast (2023-2032) (2023: USD 3,533.56 million → 2032: USD 10,552.72 million)
- 2.1.2 Volume & Revenue – National Totals (Volume Where Applicable)
- 2.1.3 Key Market Highlights – Top Five Facts
- 2.2 India Last Mile Delivery Segmentation Snapshot
- 2.2.1 Market Split by Subnational Area – 2023 vs. 2032
- 2.3 Competitive Snapshot
- 2.3.1 Top 10 Players by Revenue Share – 2023
- 2.3.2 Top 10 Players by Volume Share – 2023 (Volume Where Applicable)
- 2.3.3 Recent Strategic Developments (18-Month Summary)
- 2.4 Key Investment Highlights & Strategic Conclusions
Chapter 3. India Last Mile Delivery Dynamics & Industry Analysis
- 3.1 Market Overview & Context
- 3.1.1 India Last Mile Delivery Position in the Broader Industry Value Chain
- 3.1.2 Demand Structure & Purchasing Dynamics
- 3.1.3 Market Maturity & Development Stage Across Domestic Markets
- 3.2 India Last Mile Delivery Drivers
- 3.3 India Last Mile Delivery Restraints & Challenges
- 3.4 India Last Mile Delivery Opportunities
- 3.5 Porter's Five Forces Analysis
- 3.5.1 Threat of New Entrants
- 3.5.2 Bargaining Power of Suppliers
- 3.5.3 Bargaining Power of Buyers
- 3.5.4 Threat of Substitutes
- 3.5.5 Competitive Rivalry – Intensity Assessment
- 3.6 India Last Mile Delivery Value Chain Analysis
- 3.6.1 Upstream – Key Inputs, Resources & Suppliers
- 3.6.1.1 Key Input/Resource 1
- 3.6.1.2 Key Input/Resource 2
- 3.6.1.3 Key Input/Resource 3
- 3.6.2 Midstream – Core Operations & Value Creation
- 3.6.2.1 Operating Model & Process Overview
- 3.6.2.2 Key Operating Locations & Capabilities by Company
- 3.6.3 Downstream – Market Channels & End Users
- 3.6.3.1 Direct Sales & Customer Engagement Channels
- 3.6.3.2 Indirect Sales, Intermediaries & Partner Channels
- 3.6.4 Value Chain Profitability Analysis
- 3.6.1 Upstream – Key Inputs, Resources & Suppliers
- 3.7 PESTEL Analysis
- 3.7.1 Political Factors
- 3.7.2 Economic Factors
- 3.7.3 Social Factors
- 3.7.4 Technological Factors
- 3.7.5 Environmental Factors
- 3.7.6 Legal Factors
- 3.8 India Last Mile Delivery Supply Chain Analysis
- 3.8.1 Critical Input & Resource Availability Risk Assessment
- 3.8.2 Supplier & Operational Concentration Risk (Geographic Exposure)
- 3.8.3 Supply & Service Disruption Impact Analysis
- 3.9 National & Subnational Regulatory Landscape
Note: The regulatory and policy landscape section covers regulations based on their applicability to the market, India Last Mile Delivery category, geography, and scope of the study. Only regulatory frameworks with a material impact on operations, compliance, trade, sustainability, or market access are analyzed in detail.
Chapter 4. Key Investment Pockets & Opportunity Analysis
- 4.1 India Last Mile Delivery Attractiveness Analysis
- 4.1.1 By Subnational Area – Investment Attractiveness Matrix (Market Size × CAGR)
- 4.2 Absolute Revenue Growth Opportunity
- 4.2.1 By Subnational Area – Absolute Revenue Growth Through 2032
- 4.3 Incremental Demand Opportunity
- 4.3.1 By Subnational Area – Incremental Demand Through 2032
- 4.3.2 Segment – Incremental Demand
- 4.4 Emerging Submarket Opportunity Deep Dive (Subject to Applicability)
- 4.5 Priority Domestic Market Opportunity Scorecards
- 4.5.1 Priority Domestic Market 1
- 4.5.2 Priority Domestic Market 2
- 4.5.3 Priority Domestic Market 3
- 4.5.4 Priority Domestic Market 4
Note: Domestic market scorecards cover relevant states, provinces, territories, cities, or economic zones within the selected country. Numbered entries are populated with market names suited to the national administrative structure and research scope. Geographic share tables use one consistent, nonoverlapping set of areas.
Chapter 5. India Last Mile Delivery Cross-Border Trade & Market Access Analysis
- 5.1 National Trade & International Partner Overview
- 5.1.1 Export Value by Destination Country (2023)
- 5.1.2 Export Volume by Destination Country (2023) (Where Applicable)
- 5.1.3 Import Value by Source Country (2023)
- 5.1.4 Import Volume by Source Country (2023) (Where Applicable)
- 5.1.5 National & Partner-Country Trade Balances (2023)
- 5.2 Export Analysis – Segment
- 5.2.1 Category 1 (Applicable Classification Code)
- 5.2.2 Category 2 (Applicable Classification Code)
- 5.2.3 Category 3 (Applicable Classification Code)
- 5.2.4 Category 4 (Applicable Classification Code)
- 5.2.5 Category 5 (Applicable Classification Code)
- 5.3 Import Analysis – Segment
- 5.3.1 Category 1 (Applicable Classification Code)
- 5.3.2 Category 2 (Applicable Classification Code)
- 5.3.3 Category 3 (Applicable Classification Code)
- 5.3.4 Category 4 (Applicable Classification Code)
- 5.3.5 Category 5 (Applicable Classification Code)
- 5.4 Cross-Border Pricing & Transaction Benchmarks
- 5.4.1 Export Pricing – Segment & Destination Country
- 5.4.2 Import Pricing – Segment & Source Country
- 5.4.3 Price Trends (2023)
- 5.5 Key Cross-Border Trade & Delivery Routes
- 5.5.1 Cross-Border Trade/Delivery Route 1
- 5.5.2 Cross-Border Trade/Delivery Route 2
- 5.5.3 Cross-Border Trade/Delivery Route 3
- 5.5.4 Cross-Border Trade/Delivery Route 4
- 5.5.5 Cross-Border Trade/Delivery Route 5
- 5.6 Trade Policy & Market Access Impact Assessment
- 5.6.1 Tariff & Non-Tariff Barriers
- 5.6.2 National Participation in Regional Trade & Economic Frameworks
- 5.6.3 Bilateral & Multilateral Trade Agreements
- 5.6.4 Cross-Border Operating, Licensing & Localization Requirements
Note: This chapter covers international trade relevant to India Last Mile Delivery in the selected country. Exports are analyzed by destination and imports by source. Domestic interregional flows are excluded from international trade totals. Goods, services, and digital offerings use applicable classifications; volume and route analyses apply only where meaningful.
Chapter 6. Competitive Landscape & Company Benchmarking
- 6.1 India Last Mile Delivery Concentration & Structure
- 6.1.1 Herfindahl-Hirschman Index (HHI) – the historical period vs. 2023
- 6.1.2 Leading, Mid-Sized & Emerging Player Structure
- 6.1.3 Multinational, National & Local Player Dynamics
- 6.2 India Last Mile Delivery Share Analysis – 2023
- 6.2.1 National Revenue Share by Company
- 6.2.2 National Volume Share by Company (Volume Where Applicable)
- 6.2.3 Company Revenue Share by Subnational Area
- 6.2.4 Market Share Evolution (the historical period vs. 2023)
- 6.2.5 Company Market Share by Key Segment
- 6.2.6 Company Market Share by Customer Group
- 6.3 Operating Scale, Capacity & Infrastructure Analysis
- 6.3.1 National Operating Scale & Supply Capacity
- 6.3.2 Resource Utilization & Operating Efficiency
- 6.3.3 Output, Service Delivery & Activity Metrics
- 6.3.4 Operating Footprint & Infrastructure Map
- 6.3.5 Planned Operational & Capacity Expansion
- 6.4 India Last Mile Delivery Competitive Benchmarking Matrix
- 6.4.1 Revenue, Growth, Profitability & Operating Metric Comparison
- 6.4.2 Channel Revenue Mix
- 6.4.3 Revenue Exposure Across Domestic Markets
- 6.4.4 R&D Intensity
- 6.4.5 Sustainability Maturity
- 6.5 Strategic Developments in India Last Mile Delivery (Last 24 Months)
- 6.5.1 Mergers, Acquisitions & Divestments
- 6.5.2 New Products, Services & Solutions in India Last Mile Delivery
- 6.5.3 Operational & Infrastructure Expansions
- 6.5.4 Strategic Alliances, Joint Ventures & Partnerships
- 6.5.5 Distribution Expansion & Market Entry
- 6.5.6 Sustainability & ESG Initiatives
- 6.6 Competitive Strategy Mapping
- 6.6.1 Leader, Challenger, Follower & Niche Classification
- 6.6.2 Pricing Strategy Comparison
- 6.6.3 Channel Strategy Matrix
Note: Strategic developments are included based on their materiality and the availability of reliable information.
Chapter 7. India Last Mile Delivery – By Sales & Delivery Channel
- 7.1 Segment Overview
- 7.1.1 Volume & Revenue Split by Channel (2023 & 2032) (Volume Where Applicable)
- 7.1.2 Channel Mix Evolution (2023-2032)
Chapter 8. Subnational Market Analysis – Country Overview
- 8.1 Domestic Geographic Market Overview
- 8.1.1 Subnational Volume Share (Where Applicable)
- 8.1.2 Subnational Revenue Share
- 8.1.3 Market Volume by Subnational Area (Where Applicable)
- 8.1.4 Market Revenue by Subnational Area
- 8.1.5 Subnational Forecasts Through 2032
- 8.2 Cross-Area Segment Analysis Within the Country
- 8.2.1 By Sales & Delivery Channel
- 8.2.2 By Competitive Positioning & Price Tier
Chapter 9. India Last Mile Delivery – Priority Domestic Market 1
Chapter 10. India Last Mile Delivery – Priority Domestic Market 2
Chapter 11. India Last Mile Delivery – Priority Domestic Market 3
Chapter 12. India Last Mile Delivery – Priority Domestic Market 4
Chapter 13. India Last Mile Delivery Company Profiles
- 13.1 [Company 01]
- 13.1.1 Company Overview
- 13.1.2 Key Management Personnel
- 13.1.3 Products & Services Portfolio
- 13.1.4 Financial Performance
- 13.1.5 Domestic Market Focus & Local Operating Presence
- 13.1.6 Recent Developments & Strategic Initiatives
Note: The company profile list is preliminary and may change based on research findings, market developments, data availability, and client requirements.
Chapter 14. Appendices
- Appendix A – List of Abbreviations & Acronyms
- Appendix B – Industry Classification Code Reference – Full Series
- Appendix C – Supply, Output & Operating Capacity Data Tables
- Appendix D – End-Use & Demand Base Tables
- Appendix E – Demand, Adoption & Usage Assumptions
- Appendix F – Pricing & Revenue Metric Reference Tables
- Appendix G – Company Operations & Infrastructure Database
- Appendix H – Cross-Border Trade & Activity Data Tables (Where Applicable)
- Appendix I – Regulatory Summary Tables
- Appendix J – Primary Research Participant List (Anonymized)
- Appendix K – Primary Research Questionnaire Framework
- Appendix L – Data Sources & Bibliography
- Appendix M – Market Size Divergence & Source Comparison
Chapter 15. Research Methodology
- 15.1 Research Framework & Philosophy
- 15.2 Secondary Research – Sources, Hierarchy & Data Extraction
- 15.3 Data Modeling – National Market Sizing & Subnational Allocation
- 15.4 Primary Research – Stakeholder Framework, LOI & Sample Sizes
- 15.5 Forecast Methodology – Regression, Scenario & Sensitivity Analysis
- 15.6 Quality Control – Four-Layer Validation Framework
- 15.7 Limitations & Standard Assumptions
- 15.8 Disclaimer
