
Road, fleet and toll technology across three countries
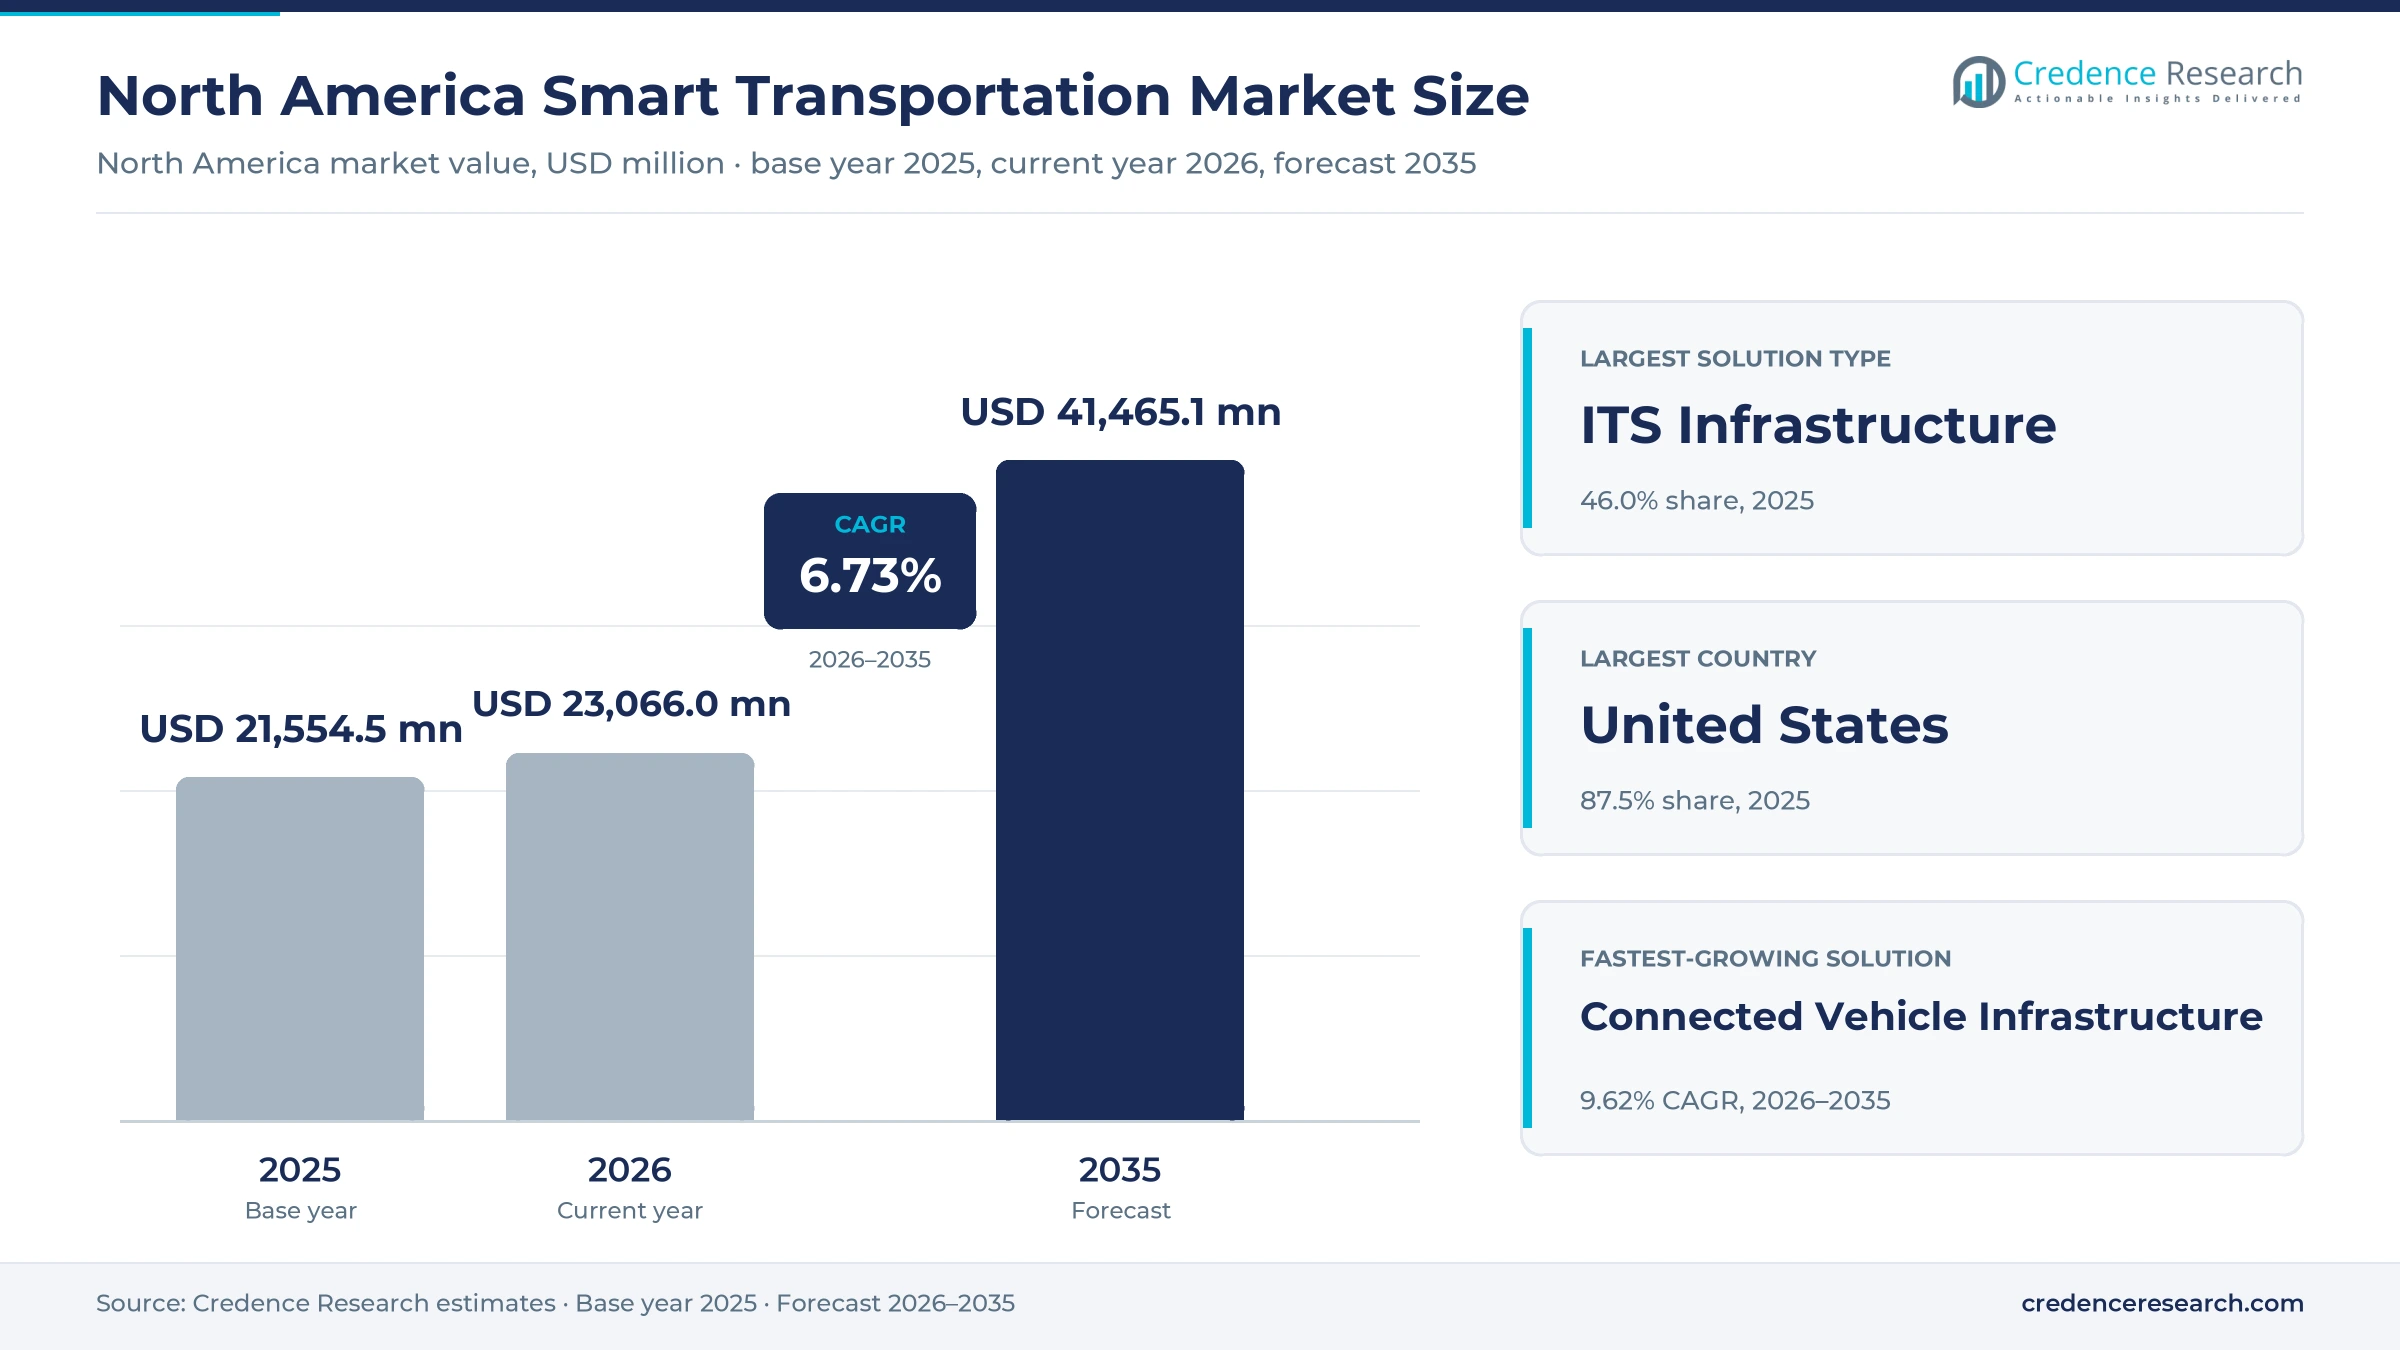
The North America smart transportation market was valued at USD 21.55 billion in 2025 and is projected to increase from USD 23.07 billion in 2026 to USD 41.47 billion by 2035, registering a CAGR of 6.73% during 2026–2035. Demand comes from three buyers with different budgets, namely road agencies upgrading signals and corridors, toll operators replacing roadside systems, and fleets paying for logging, tracking and video subscriptions. The United States held the largest share, 87.5% in 2025, because federal grants, electronic logging rules and a large tolled network all concentrate there. Mexico is the fastest-growing country at 7.92% a year, as federal toll plazas move from cash toward electronic tags during 2026. One regulatory change matters most for suppliers, since the Federal Communications Commission adopted final C-V2X rules in November 2024 and started a two-year sunset for older short-range radios. Buyers can now specify one radio path for new roadside units, which reduces technology risk in long procurements.
What does North American smart transportation spending include?
The market counts road-focused technology purchased by public agencies, toll operators and commercial fleets across the United States, Canada and Mexico. It includes signal and corridor systems, toll roadside and back-office systems, connected vehicle roadside units, and fleet tracking, logging and video platforms sold as licenses, subscriptions or managed services.
The market excludes civil construction, pavement work, vehicles themselves, fuel and airline, rail and maritime systems. Revenue reaches suppliers through direct enterprise sales, public tenders and channel partners, and long contract terms mean that a single award can shape a vendor's position on a corridor for decades.
North America Smart Transportation Market Insights
- The market grows from USD 21.55 billion in 2025 to USD 41.47 billion by 2035, a 6.73% annual pace from 2026–2035 that rests mostly on recurring contracts.
- The United States held 87.5% of 2025 value, supported by federal V2X grants, electronic logging enforcement and a large tolled road network.
- ITS Infrastructure led solution types with 46.0% of 2025 value, while connected vehicle units expand from a much smaller installed base.
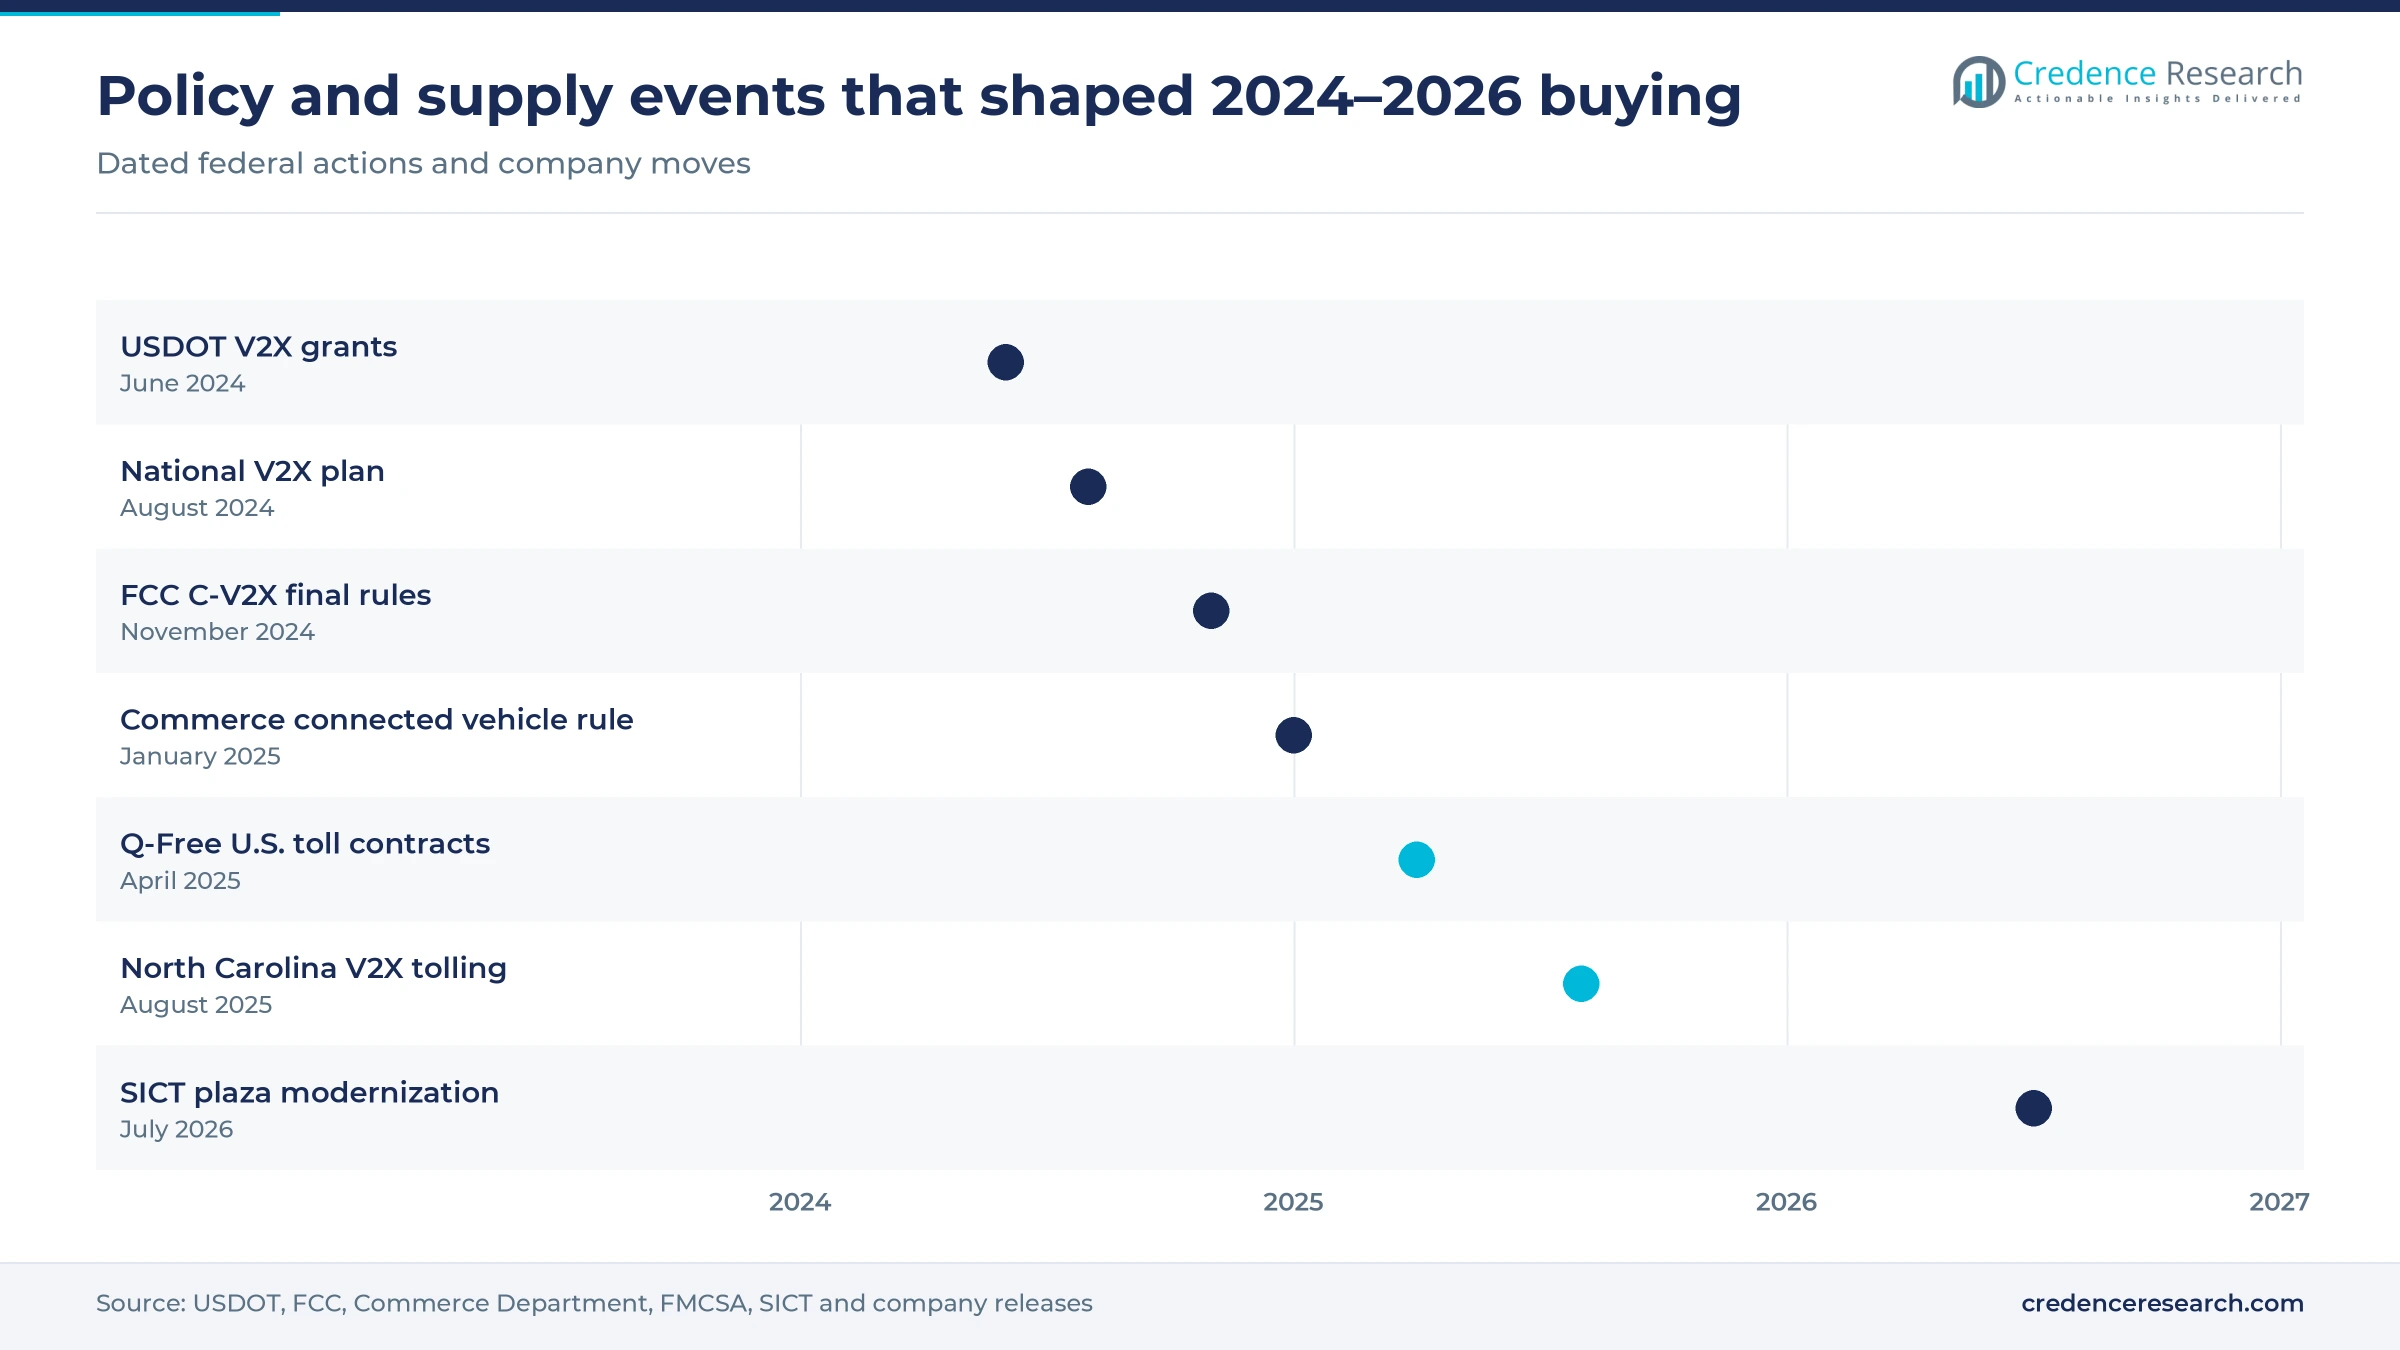
- The FCC adopted final C-V2X rules on Nov. 21, 2024, which gave roadside buyers one radio path and started a two-year short-range radio sunset.
- Fleet platforms compete on data scale and video safety, while toll integrators such as Kapsch TrafficCom and Q-Free compete on long corridor contracts.
Roadside systems lead while V2X units grow fastest
Why do roadside systems still hold the largest budget?
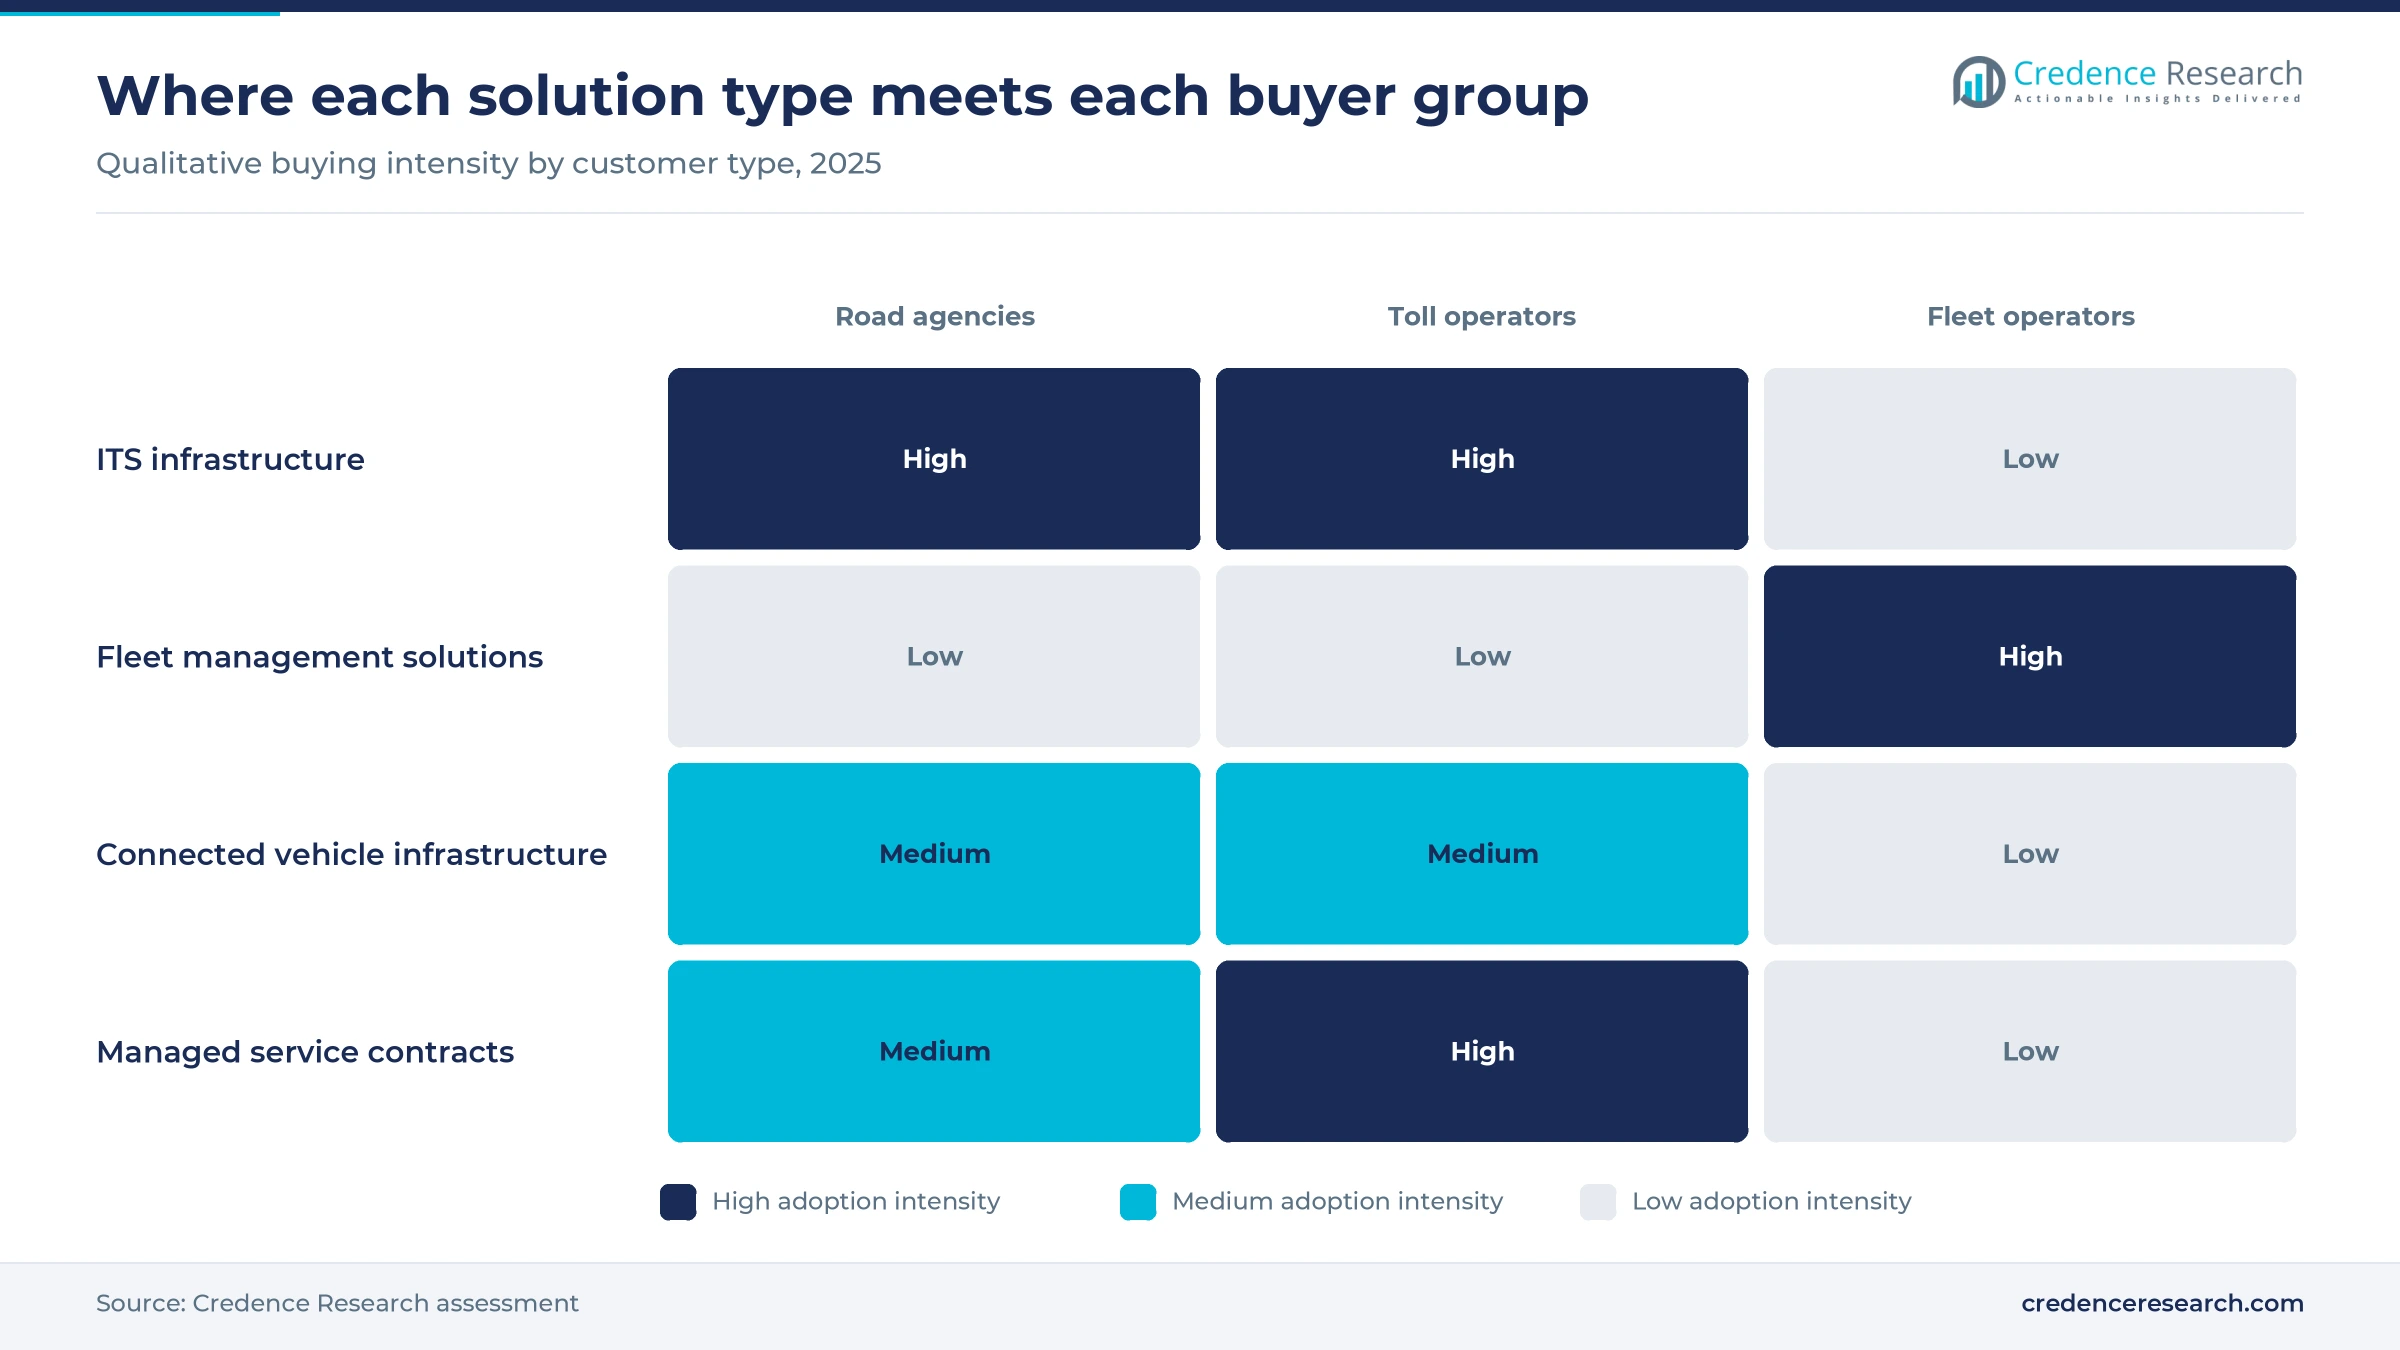
Based on solution type, the market is categorized into ITS Infrastructure, Fleet Management Solutions and Connected Vehicle Infrastructure. ITS Infrastructure led with 46.0% of 2025 value because public road budgets are large, and the Congressional Budget Office counted $249 billion of U.S. government highway spending in 2023. Kapsch TrafficCom also reports that its technology runs on 53% of U.S. tolled roads, which shows how much roadside equipment is installed. Connected Vehicle Infrastructure grows fastest at 9.62% a year as a small base meets new federal money, including Utah DOT's $20 million V2X grant covering all of Utah and I-80 across Wyoming.
Which buyers control the largest share of spending?
Based on customer type, the market is categorized into Road Agencies, Toll Operators and Fleet Operators. Road Agencies led with 44.0% of 2025 value because signals, corridors and traffic centers sit on public budgets, as Toronto's March 2025 congestion report shows with about 2,400 remotely controlled signals. Fleet Operators grow fastest at 7.43% a year as tracking and video spread through private fleets. Geotab said in September 2025 that it added its latest million subscriptions in under two years, while Verizon Connect's 2026 survey of nearly 900 fleet professionals put video telematics use at 46%, up 10 points since 2023.
Why does traffic efficiency outweigh safety spending today?
Based on application, the market is categorized into Traffic Efficiency, Fleet Productivity and Safety and Compliance. Traffic Efficiency led with 47.0% of 2025 value because delay has a visible local price, and INRIX's 2025 scorecard measured 112 hours lost per Chicago driver at a cost of $2,063. Safety and Compliance grows fastest at 7.88% a year as regulators and courts raise the cost of weak records. Overdrive reported that federal regulators have removed 79 logging devices since January 2025, and CCJ reported in May 2026 that the median nuclear verdict against corporations reached $51 million in 2024.
How are buyers shifting from purchases to subscriptions?
Based on pricing model, the market is categorized into Capital Purchases and Licenses, Recurring Subscriptions and Managed Service Fees. Capital Purchases and Licenses led with 44.0% of 2025 value because agencies still buy equipment through grant-funded projects, as Fresno, Calif., did on Oct. 16, 2025, approving $1.499 million of controllers and licenses for 62 intersections. Recurring Subscriptions grow fastest at 7.80% a year as fleets pay per vehicle rather than per project. Samsara described tens of thousands of customers in its March 2026 results, and Geotab reported serving more than 100,000 customers on its subscription platform.
| Segment Group | Leading Sub-segment | Share, 2025 | Fastest-growing Sub-segment | CAGR, 2026–2035 |
|---|---|---|---|---|
| By Solution Type | ITS Infrastructure | 46.0% | Connected Vehicle Infrastructure | 9.62% |
| By Customer Type | Road Agencies | 44.0% | Fleet Operators | 7.43% |
| By Application | Traffic Efficiency | 47.0% | Safety and Compliance | 7.88% |
| By Pricing Model | Capital Purchases and Licenses | 44.0% | Recurring Subscriptions | 7.80% |
Request a Free Sample
Fill in your details and we'll send you a free sample report.
- Sample data tables & charts
- Research methodology
V2X funding and logging rules anchor buyer budgets
Connected vehicle deployment and interoperability
Federal connected vehicle policy has moved from pilots to funded corridors, which gives roadside buyers a multiyear procurement path. USDOT published its national V2X deployment plan on Aug. 16, 2024, and Location Business News reported that the first stage targets 20% of U.S. highways and 25% of major city intersections by 2028. In June 2024, USDOT awarded nearly $60 million to Maricopa County, the Texas A&M Transportation Institute and Utah DOT, and the Maricopa award alone links 750 roadside units to about 400 vehicle units. The FCC then adopted final rules that settled 30 MHz of the 5.9 GHz band, according to a November 2024 Venable summary. As a result, connected vehicle technology suppliers can design new roadside units around one stable radio standard.
Fleet compliance and subscription adoption
Compliance rules keep trucking fleets on paid software, because a logging device that loses its registration must be replaced within weeks. FreightWaves reported on Oct. 17, 2025, that regulators had revoked 24 electronic logging devices that year, the highest annual number since full enforcement began in 2018, while 1,133 stayed registered. Canada adds a second compliance base, since the compliance publisher JJ Keller records its federal logging mandate as in force since Jan. 1, 2023. Subscription scale has followed these rules, and Geotab said in September 2025 that it had passed 5 million connected vehicle subscriptions worldwide. Tracking demand is broad, since Verizon Connect's 2026 survey put GPS tracking use at 80%. In turn, fleet management vendors gain renewal income that does not depend on public budgets.
Adaptive traffic operations and safety investment
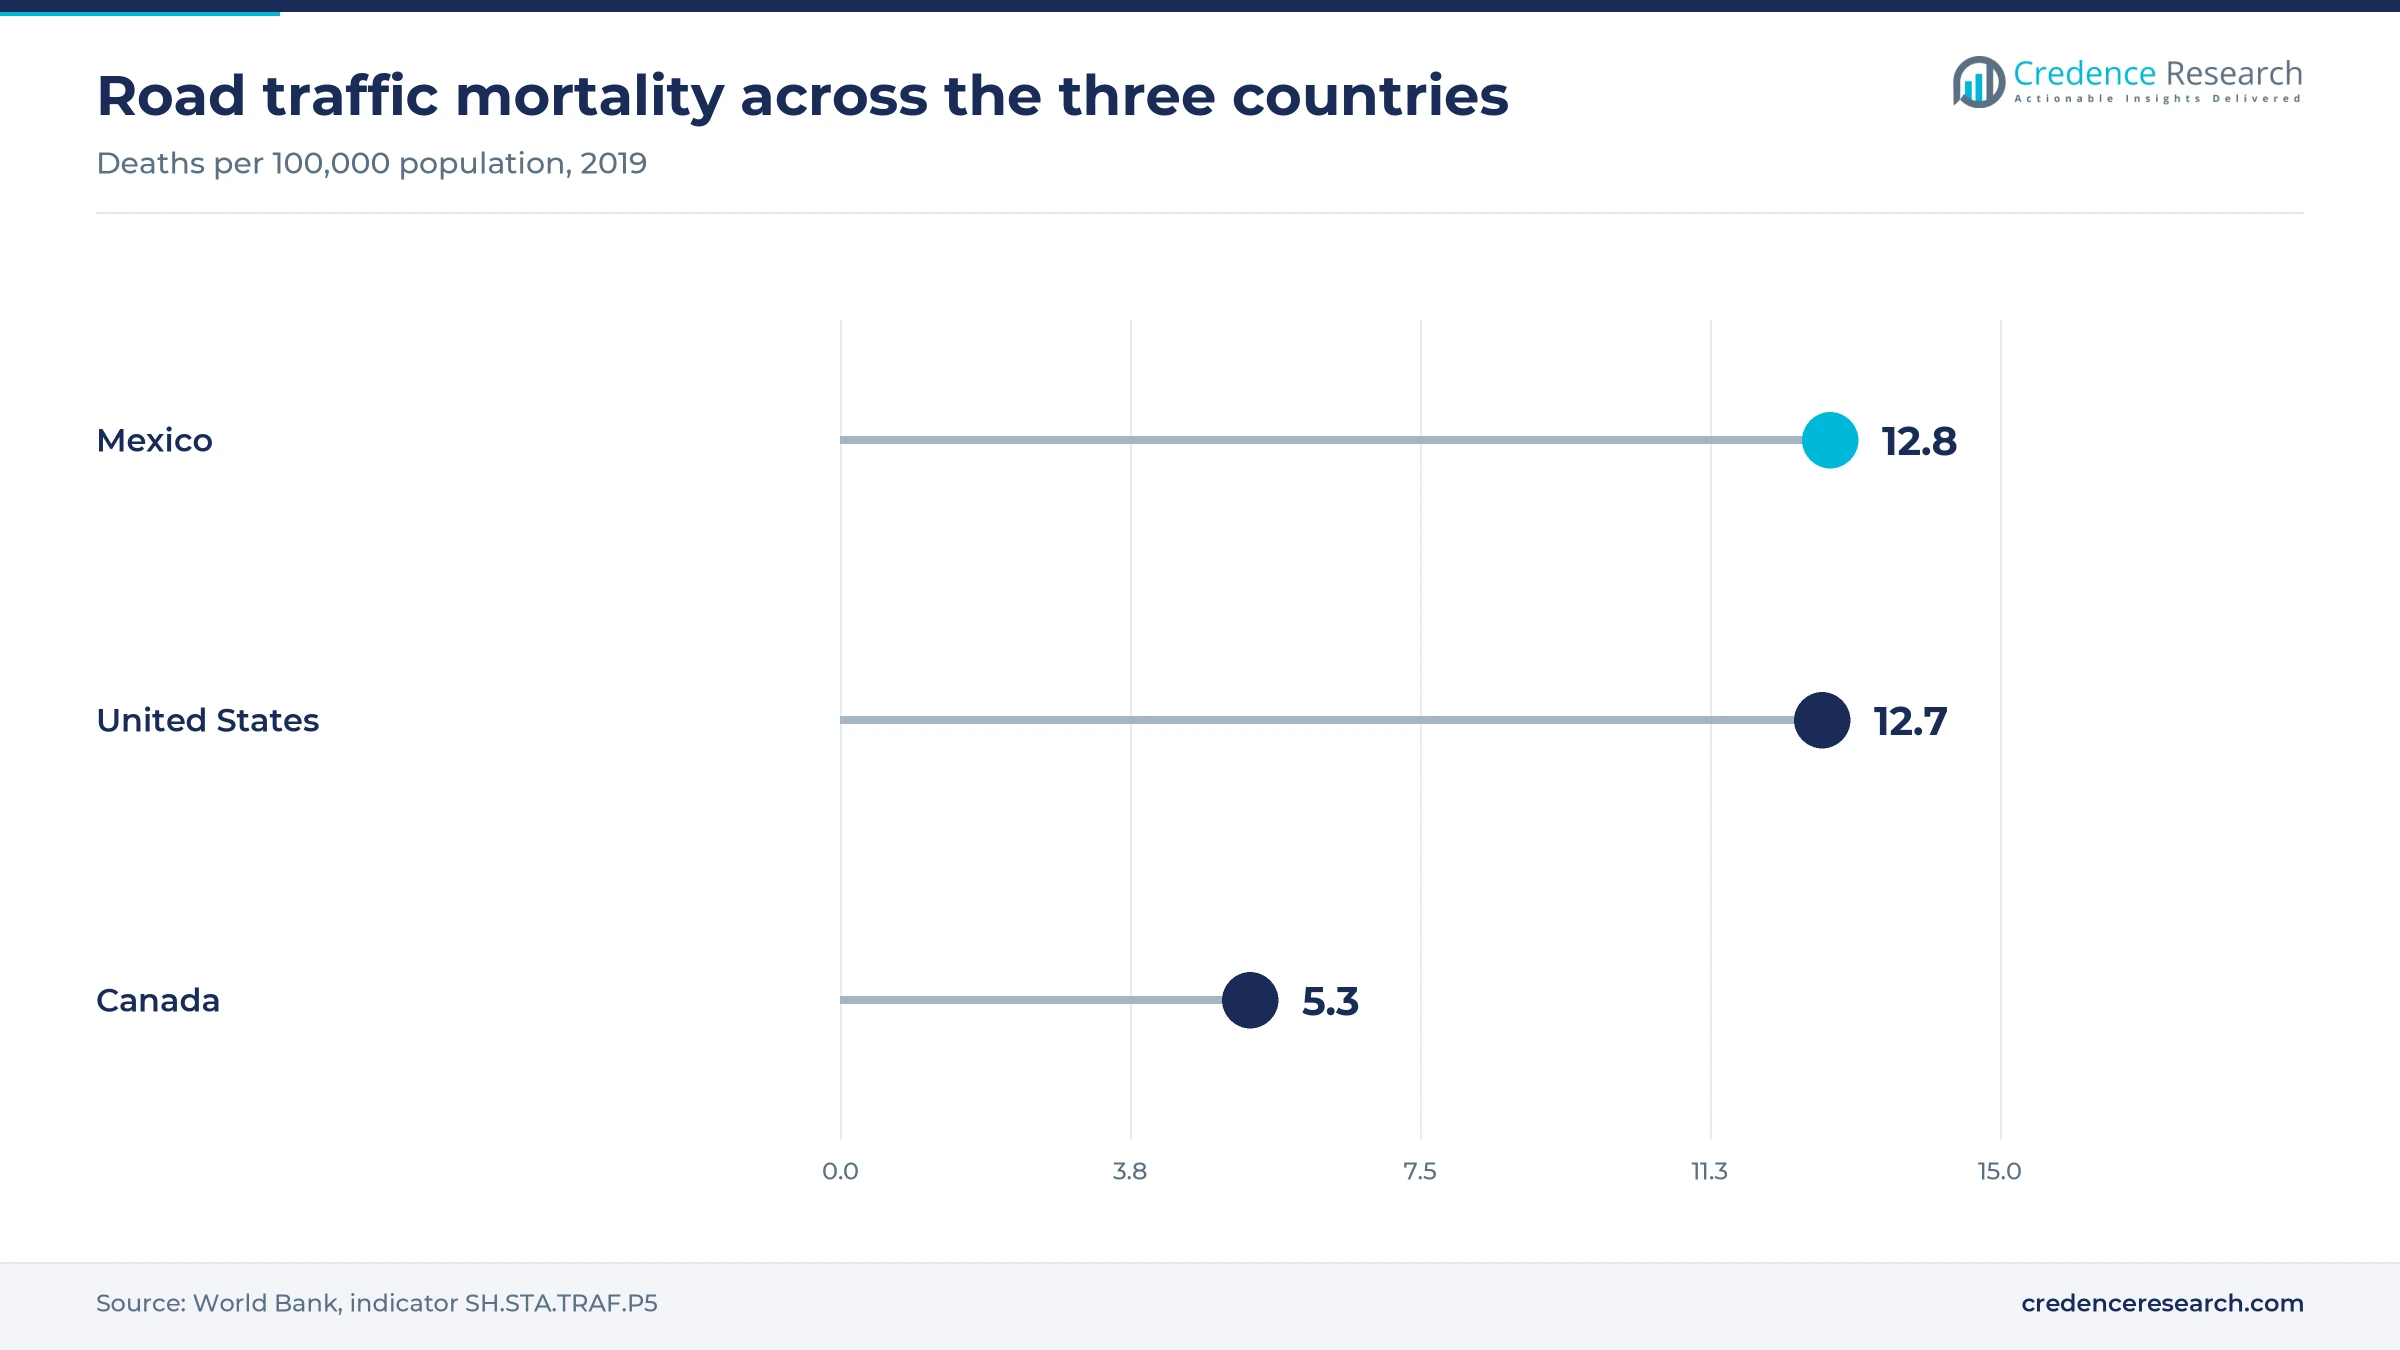
Congestion and crash costs give road agencies a measurable case for smarter signals and corridor monitoring. INRIX's December 2025 scorecard placed New York at 102 lost hours per driver and Philadelphia at 101, which keeps delay in front of elected officials. Safety data supports the same demand, because NHTSA reported 17,140 traffic deaths in the first half of 2025, down 8.2% but still a heavy public cost. Purchases are now specific and modest in size, and Fresno's adaptive signal contracts covered six corridors using federal CMAQ grants and Measure C funds. Toronto staff also planned 50 further Transit Signal Priority intersections by the end of 2025. These projects usually start small, then expand into wider advanced traffic management platforms once agencies can show results.
Toll modernization and long-term service contracts
Toll operators are replacing roadside and back-office systems through contracts that outlast most technology cycles. Louisiana's Interstate 10 Calcasieu River Bridge partnership gave Kapsch TrafficCom a 50-year role in October 2024, with the tolling portion valued at $230 million, according to Work Truck. The Riverside County Transportation Commission also extended its toll services contract by 10 years, taking the scope through 2041. Toll demand is large, since Conduent said in May 2026 that its tolling business supports more than 14 million transactions per day, which shows the processing load behind electronic toll collection programs. Q-Free won its first U.S. toll road traffic management contracts in April 2025, with three operators. Because these terms are so long, incumbents hold steady work while challengers target system replacement cycles.
In-vehicle tolling and AI video reshape procurement
Shift toward in-vehicle V2X toll collection
Toll payment is beginning to shift from windshield tags toward radios built into vehicles, which could change who owns the customer relationship. Kapsch TrafficCom and the North Carolina Turnpike Authority announced a V2X toll collection system on Aug. 25, 2025, five days after Kapsch and Audi of America published a roadmap for V2X tolling in North America. Kapsch's RIS-9360 roadside unit also earned OmniAir certification on Aug. 29, 2025, according to the company. Kapsch says it has manufactured more than 113 million tags, so the installed base will not disappear quickly. As a result, operators are likely to run tags and V2X side by side, and connected vehicle units grow fastest at 9.62% a year from a small base.
Rise of AI video and single-platform fleet software
Fleet buyers are consolidating video, telematics and maintenance into one contract, and liability costs explain much of that shift. Lytx launched LytxOne at its Protect 2026 conference on May 5, 2026, combining video safety, telematics, maintenance, compliance and asset tracking. Verizon Connect's 2026 survey found that 74% of fleets using AI-powered video reported better driver safety, while 64% said it helps protect against false claims. CCJ quoted a Samsara executive in May 2026 calling cameras almost table stakes, and such demand also supports the separate market for dashcams. Samsara said its data asset now captures more than 25 trillion data points a year, a scale that supports fleet demand. Consequently, vendors with larger data pools can argue that their risk models improve faster.
Opportunity in Mexico's electronic toll conversion
Mexico offers the clearest near-term opening for tag, lane and back-office suppliers because federal plazas are moving away from cash. Mexico Business News reported in July 2025 that CAPUFE, which operates 3,700 km of toll roads, would make electronic tags mandatory in stages from 2026, citing about 1 second per electronic crossing against about 30 seconds for cash. Crónica reported on July 21, 2026, that the transport ministry SICT is equipping federal plaza lanes for the TAG-IAVE system. Xataka México reported in March 2026 that SICT presented a road program of 397 billion pesos. Suppliers that bring local installation partners can therefore bid on toll lanes and corridor monitoring together.
Opportunity in adaptive signal retrofits for cities
Mid-sized cities are an open smart transportation opportunity because adaptive retrofits now arrive at a price that fits local grant programs. Demand is visible in Fresno's October 2025 contracts, which work out to about $24,000 per intersection across 62 sites, including controllers, licenses, configuration, training and warranty. Toronto shows the remaining headroom, since a councillor's April 2026 update counted about 200 smart signals by the end of 2025 and 50 more planned for 2026. U.S. DOT's ITS benefits database also records that an adaptive system in Toronto cut delay by 17% and vehicle stops by 22% in a 1993 evaluation. Consequently, suppliers that package software, integration and training can win repeat corridor orders from agencies with no large traffic engineering staff.
Federal funding gaps and radio transition slow projects
Lapse of multiyear federal transportation funding
Federal authorization under the Infrastructure Investment and Jobs Act ran out on Sept. 30, 2026, and short extensions now replace multiyear certainty. The National Association of Counties warned on Sept. 2, 2026, that overall transportation funding could fall by more than 15 percent without the law's advance appropriations. Counties and metro agencies feel this first, because grant-funded signal and V2X projects depend on those programs. As a result, agencies may phase work into smaller packages, and suppliers need longer sales cycles and more flexible payment milestones.
Short-range radio sunset and stranded roadside assets
Agencies that installed earlier short-range roadside radios now face replacement costs, because the FCC's November 2024 order set a two-year sunset for those licenses, according to Venable. No new short-range licenses will be issued during that window, and existing ones renew only until the phase-out ends. Early adopters carry the heaviest burden, since their radios lose licensed status once the phase-out ends. Consequently, budgets meant for new corridors can shift to like-for-like replacement, and vendors can reduce resistance by offering firmware upgrades, trade-in credits and multi-radio units where they exist.
Logging device revocations and vendor churn
Small carriers face real disruption when a logging vendor loses its registration, as federal regulators give only 60 days to switch devices. Overdrive reported that 12 more devices were pulled in one later action, after which carriers that did not switch could be cited. Drivers using revoked systems after a deadline can be placed out of service, which turns a software problem into lost revenue. As a result, trust in low-cost devices weakens, and fleets now ask for proof of compliance support before signing multiyear subscriptions.
Supply chain limits on connected vehicle components
Connected vehicle suppliers must rework sourcing because the Commerce Department's final rule of Jan. 14, 2025, bars covered Chinese and Russian software from Model Year 2027 and hardware from Model Year 2030. Trucks and buses are excluded for now, although the Bureau of Industry and Security planned a separate commercial vehicle rulemaking. Fleet telematics vendors therefore face uncertainty about which modules will remain eligible. Consequently, buyers are asking for component origin details in tenders, and suppliers with audited supply chains can defend prices more easily.
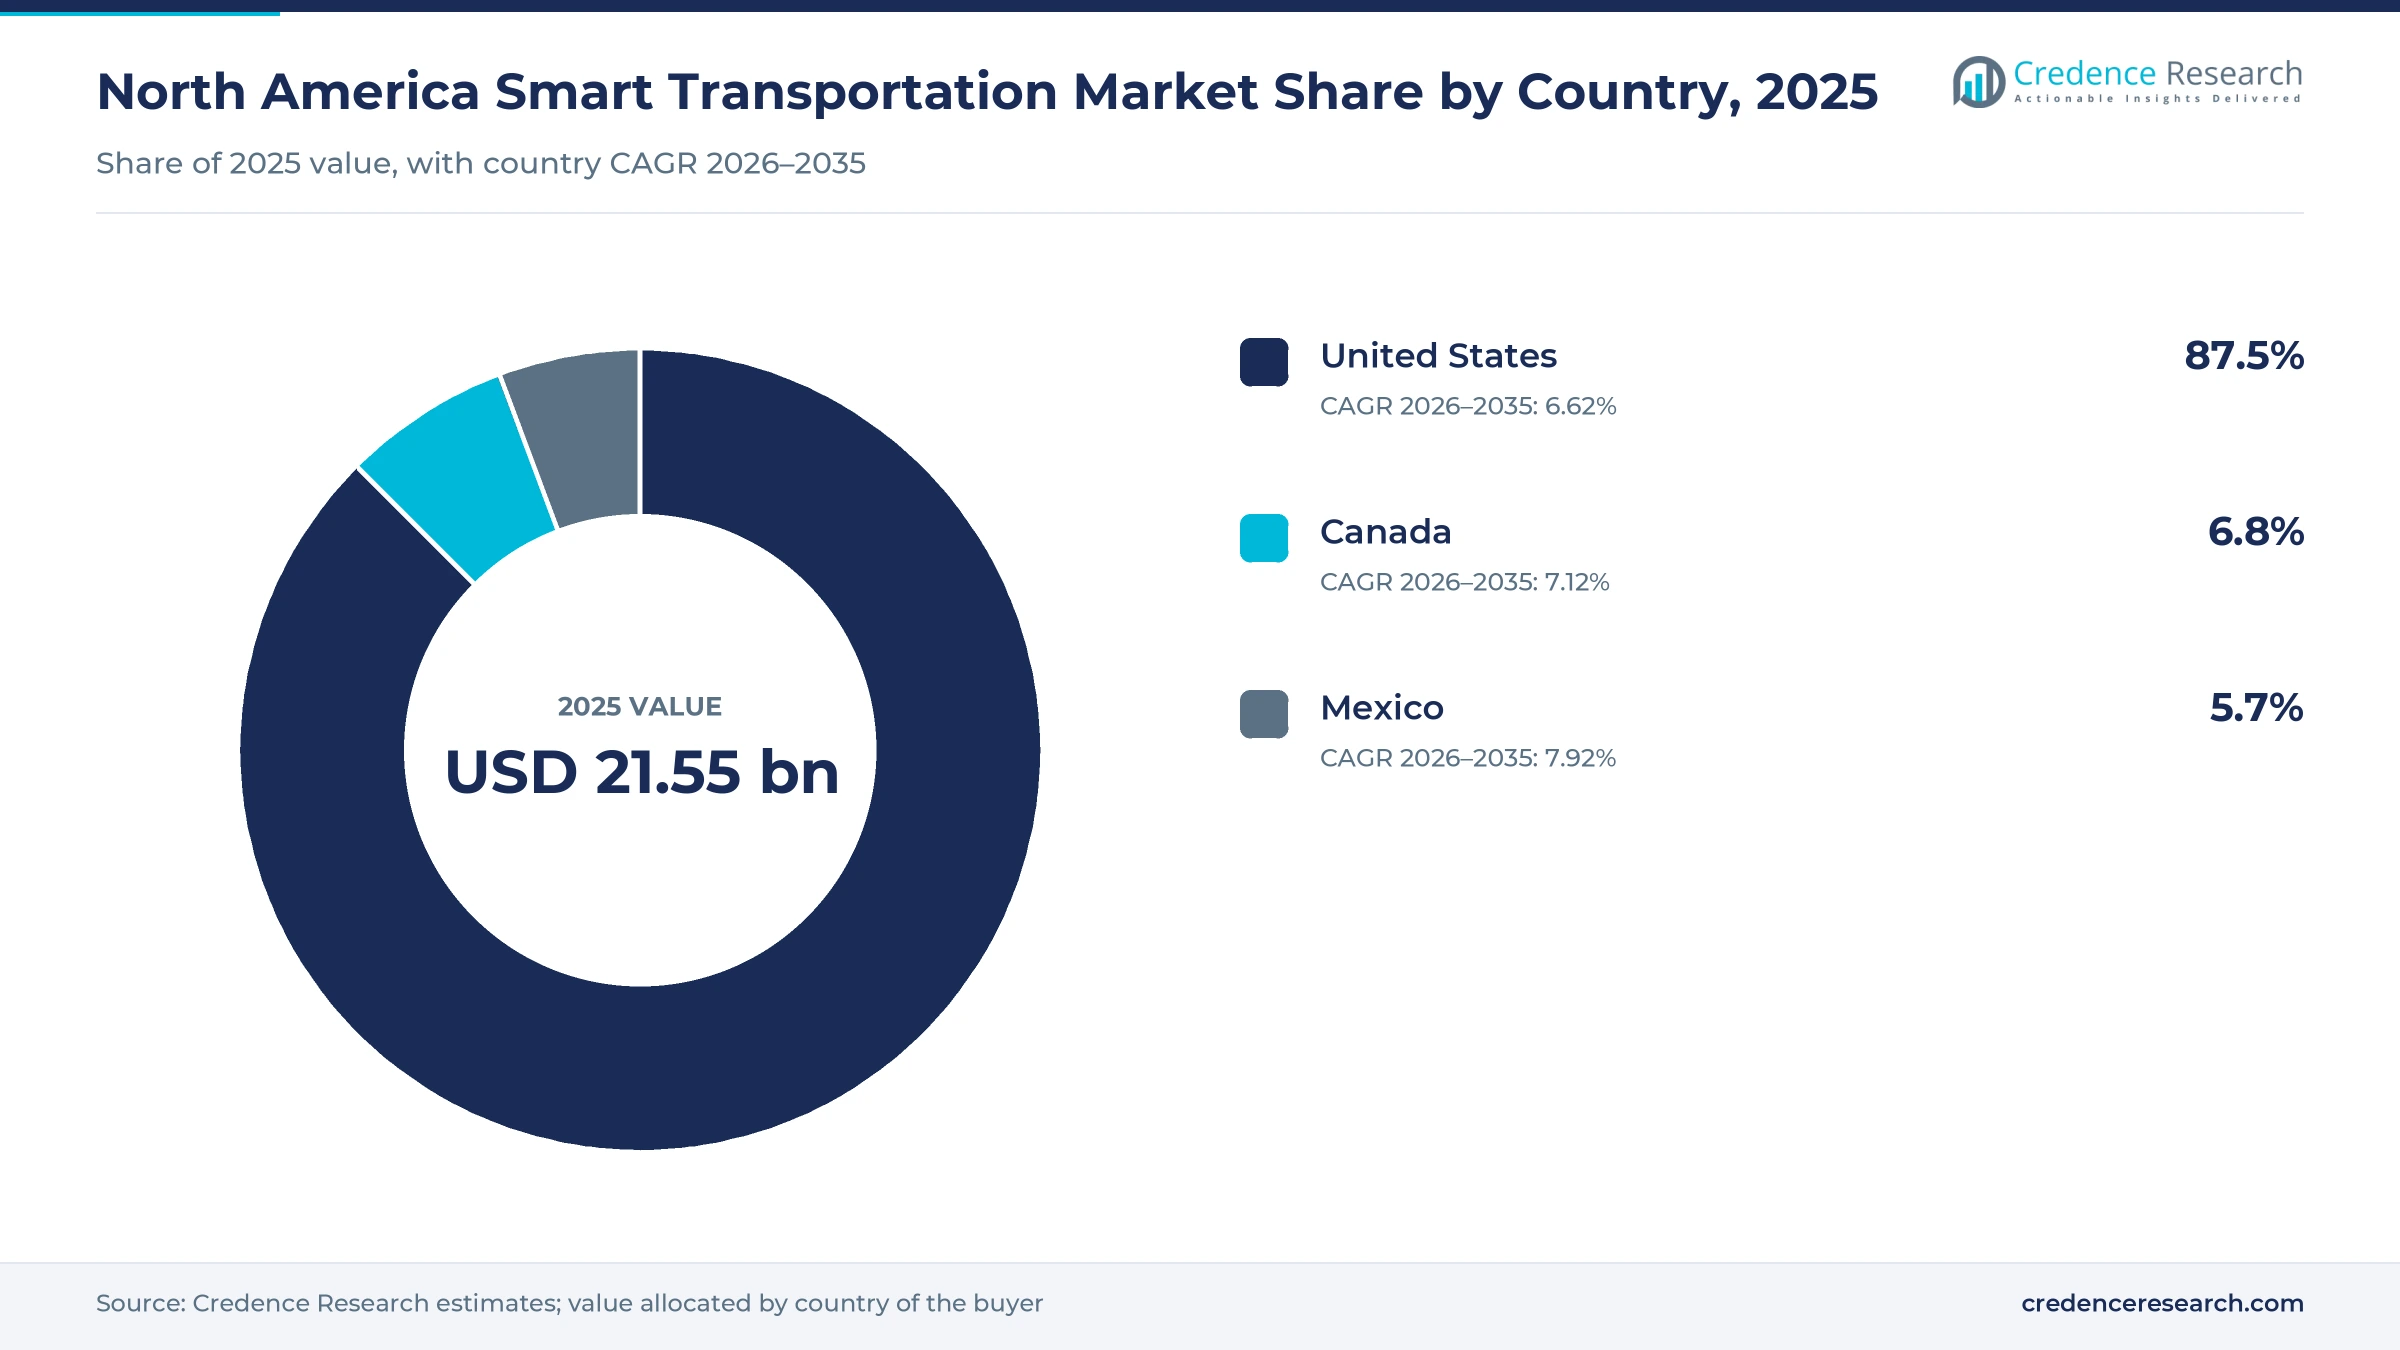
The United States dominates as Mexico digitizes tolls
| Country | Value, 2025 (USD billion) | Share, 2025 | CAGR, 2026–2035 |
|---|---|---|---|
| United States | 18.86 | 87.5% | 6.62% |
| Canada | 1.47 | 6.8% | 7.12% |
| Mexico | 1.23 | 5.7% | 7.92% |
United States holds the deepest public and fleet budgets
The United States held 87.5% of 2025 value and grows at 6.62% a year, because federal grants, logging rules and private toll concessions all operate at national scale. World Bank GDP data for 2025 give the United States about 88% of combined output. Q-Free's April 2025 awards illustrate that depth, with Transurban in Northern Virginia covering just over 65 miles and 298 gates, E-470 in Colorado covering 47 miles, and Cintra in Dallas-Fort Worth covering about 54 miles. Almaviva's $335 million purchase of Iteris also shows foreign interest in American traffic software.
Canada pairs dense urban signals with costly toll corridors
Canada held 6.8% of 2025 value and grows at 7.12% a year, led by Ontario's urban corridors and by fleets adopting logging software. Highway 407 ETR set an annual transponder lease of C$31.50 for 2026, with increases of up to 34 Canadian cents per kilometer for light vehicles on a few central sections, according to its Nov. 21, 2025 release. Toronto is also adding smart signals along the Yonge Street corridor in 2026. However, Ontario's May 2025 plan to end tolls on the provincial section of Highway 407 East shows that politics can shrink tolling demand.
Mexico grows fastest as highway monitoring spreads
Mexico held 5.7% of 2025 value and grows at 7.92% a year, the fastest pace among the three countries, as tag rollout and highway monitoring advance together. Kapsch TrafficCom said on Aug. 5, 2025, that it had completed a system on the Palmillas–Apaseo Highway with 21 traffic cameras, six variable message signs, two weigh-in-motion stations and a weather station. Such concession projects show how private operators fund monitoring directly. However, CAPUFE keeps a few cash lanes at first, according to Mexico Business News, so full conversion will take time.
Tolling contracts and portfolio sales define 2025–2026
| Development | Status and market relevance |
|---|---|
| In April 2025, Q-Free won its first U.S. toll traffic management contracts with Transurban, E-470 and Cintra. | Awarded; gives Q-Free three U.S. toll corridors |
| In August 2025, Kapsch TrafficCom and the North Carolina Turnpike Authority announced a V2X toll collection system. | Announced; tests in-vehicle payment at production level |
| In September 2025, Geotab said it had surpassed 5 million connected vehicle subscriptions worldwide. | Reached; signals scale in subscription fleet data |
| In May 2026, Conduent agreed to sell its Public Transit business to Modaxo for $164 million while keeping tolling. | Pending; closing expected by the end of 2026 |
| In May 2026, Lytx introduced LytxOne, joining video safety, telematics, maintenance, compliance and asset tracking. | Launched; supports single-contract fleet buying |
C-V2X, adaptive signals and AI video shape the stack
- C-V2X roadside units carry safety and signal messages over the 5.9 GHz band, and they now replace earlier short-range radios on new federal corridor projects.
- Adaptive signal control changes timing from live detection, which makes it useful on corridors that previously ran limited fixed timing plans.
- AI video telematics flags risky driving events in the cab, so safety managers can coach drivers and defend against false claims with recorded evidence.
- All-electronic toll back offices match tags and license plate images to accounts, which lets operators remove cash handling and process very large daily volumes.
Need a Custom Version of This Report?
Tailor the scope, geography, or segments to your exact requirements.
- Custom geography or segment scope
- Direct access to our analyst team
Fleet platforms and toll integrators compete separately
Competition splits into two groups that rarely meet in the same tender. Samsara, Geotab, Verizon Connect and Lytx sell fleet platforms and compete on data scale, video quality and integration with maintenance and compliance tools. Kapsch TrafficCom, Conduent Transportation and Q-Free compete for toll roadside, back-office and traffic management contracts, where reference corridors and long service records matter more than list price. HERE Technologies supplies map and truck routing data to fleet software such as EROAD Go+. Cubic Transportation Systems and Iteris focus on signal software and traffic operations, usually through public tenders and city contracts. Portfolio moves are changing the field, since Almaviva bought Iteris and Conduent is selling its transit unit to concentrate on tolling. Direct enterprise sales dominate large fleets, while channel partners serve smaller operators; Geotab alone reports more than 700 partners worldwide. New entrants face high barriers in tolling because contracts can run from 10 to 50 years, so they often enter through replacement cycles.
Who supplies fleets, toll roads and signal corridors
| Company | Type | Role in the market |
|---|---|---|
| Samsara | Fleet platform | Connected operations software and video for North American fleets |
| Verizon Connect | Fleet platform | GPS tracking and AI video; publishes an annual fleet technology survey |
| Geotab | Fleet platform | Oakville, Ontario-based telematics supplier with more than 5 million subscriptions |
| Lytx | Fleet video | LytxOne platform combining video safety, telematics and compliance |
| Cubic Transportation Systems | Traffic software | Synchro Green adaptive signals, including Fresno, Calif., corridors |
| Kapsch TrafficCom | Toll integrator | Toll systems in California and Louisiana; ITS on a Mexican highway |
| Conduent Transportation | Toll operator services | Tolling back offices handling more than 14 million daily transactions |
| HERE Technologies | Location data platform | Map, traffic and routing data; its navigation app has run inside the EROAD Go+ fleet product in North America since September 2020 |
| Iteris | Traffic software | Smart mobility infrastructure tools, now owned by Almaviva |
| Q-Free | Traffic management | Kinetic Mobility system on toll roads in Virginia, Colorado and Texas |
Public budgets set the pace while fleets set the scale
Credence Research's view is that public budgets will set the pace of roadside work, while private fleets will set the scale of smart transportation data. Federal funding uncertainty after September 2026 is the largest near-term demand risk, and it falls mostly on county and metro projects. Long toll contracts and fleet subscriptions partly offset that risk because their income does not depend on annual grants. The regional split is the most assumption-heavy estimate here, and it rests mainly on economic weight. Buyers should therefore treat country shares as directional, and suppliers should plan for slow public procurement alongside faster private renewals.
How the estimates were built and what they rest on
The report uses 2025 as the base year and forecasts through 2035. Market values come from the Credence Research model, and country, segment and growth splits are Credence Research estimates checked against public data on highway spending, tolling volumes and fleet subscriptions. Evidence comes from government releases, regulator notices, city records, company statements and named trade publications opened during preparation. No interviews or surveys were conducted for this report, and third-party surveys are attributed by name where they appear.
Recurring contracts carry growth through 2035
Smart transportation spending is forecast to rise from USD 23.07 billion in 2026 to USD 41.47 billion by 2035, a 6.73% annual pace. Recurring fleet subscriptions and long toll service contracts should carry a growing part of that value, while roadside hardware follows public funding cycles. The first V2X stage in 2028 will test whether agencies can match federal ambitions with local budgets. Mexico's toll conversion should remain the fastest country story, and Canada should stay concentrated in Ontario's corridors. Reauthorization terms in the United States are the variable most likely to shift this path in either direction.
Frequently Asked Questions
How big is the North America smart transportation market?
Which country leads this market?
Which country is growing fastest?
What is the largest solution type?
Why is connected vehicle infrastructure growing fastest?
How do logging rules affect demand?
What is the main risk to growth?
Which companies compete in this market?
Table of Content
Chapter 1 Market Segmentation
- 1.1 Segmentation Framework
- 1.1.1 Product and Service Classification
- 1.1.2 Application and End-Use Classification
- 1.1.3 Technology and Solution Classification
- 1.1.4 Customer and Distribution Channel Classification
- 1.1.5 Geographic Segmentation
- 1.1.6 Market Segment Definitions and Boundaries
- 1.2 By Solution Type
- 1.2.1 ITS Infrastructure
- 1.2.2 Fleet Management Solutions
- 1.2.3 Connected Vehicle Infrastructure
- 1.3 By Customer Type
- 1.3.1 Road Agencies
- 1.3.2 Toll Operators
- 1.3.3 Fleet Operators
- 1.4 By Application
- 1.4.1 Traffic Efficiency
- 1.4.2 Fleet Productivity
- 1.4.3 Safety and Compliance
- 1.5 By Pricing Model
- 1.5.1 Capital Purchases and Licenses
- 1.5.2 Recurring Subscriptions
- 1.5.3 Managed Service Fees
- 1.6 By Country
- 1.6.1 United States
- 1.6.2 Canada
- 1.6.3 Mexico
Chapter 2 Introduction
- 2.1 Report Objectives and Scope
- 2.2 Product Definition and Industry Terminology
- 2.3 Market Inclusions and Exclusions
- 2.4 Research Process
- 2.4.1 Primary Research and Expert Interviews
- 2.4.2 Secondary Research and Source Review
- 2.4.3 Top-Down and Bottom-Up Estimation
- 2.4.4 Data Triangulation and Verification
- 2.5 Market Size Measurement Basis
- 2.5.1 2025: USD 21.55 billion → 2035: USD 41.47 billion
- 2.6 Historical and Forecast Reference Periods
- 2.6.1 Historical Period: 2018-2025
- 2.6.2 Base Year: 2025
- 2.6.3 Forecast Period: 2025-2035
- 2.7 Research Assumptions and Limitations
Chapter 3 Executive Summary
- 3.1 Market Snapshot and Key Findings
- 3.2 Base-Year Market Size, 2025
- 3.3 Forecast Market Size, 2035
- 3.4 Revenue and Volume Growth Outlook
- 3.5 Key Demand and Supply Indicators
- 3.6 Leading Market Segments
- 3.7 Fastest-Growing Market Opportunities
- 3.8 Regional Performance Highlights
- 3.9 Technology and Industry Transformation
- 3.10 Competitive Landscape Summary
- 3.11 Analyst View and Strategic Implications
Chapter 4 North America Smart Transportation Market Trends and Developments
- 4.1 Historical Industry Development, 2018-2025
- 4.2 Recent Market Trends and Developments
- 4.3 Demand and Customer Behavior Trends
- 4.4 Technology and Product Innovation
- 4.5 Artificial Intelligence, Automation and Digitalization
- 4.6 Local Manufacturing and Supply Chain Realignment
- 4.7 Industry Partnerships, Mergers and Acquisitions
- 4.8 Sustainability and Circular Economy Developments
- 4.9 Government and Private Sector Investment Trends
- 4.10 Emerging Business Models and Commercialization
- 4.11 Industry Developments and Announcements
Chapter 5 North America Smart Transportation Market Production, Supply and Demand Analysis
- 5.1 Demand Trend and Consumption Analysis, 2018-2025
- 5.2 Demand Forecast, 2025-2035
- 5.3 Production and Output Trend, 2018-2025
- 5.4 Production and Output Forecast, 2025-2035
- 5.5 Installed Capacity and Capacity Utilization
- 5.6 Company-Wise Production Plants and Statistics
- 5.6.1 Installed Production Capacity
- 5.6.2 Actual Production
- 5.6.3 Planned Capacity and Expansion Targets
- 5.7 Supply Chain Structure and Procurement Trends
- 5.8 Supply-Demand Gap and Bottlenecks
- 5.9 Import Dependence and Sourcing Structure
- 5.10 Contract Manufacturing and Outsourcing
- 5.11 Regional Supply and Demand Concentration
Chapter 6 North America Smart Transportation Market Pricing Analysis
- 6.1 Pricing Structure and Measurement
- 6.2 Historical Pricing Trends, 2018-2025
- 6.3 Pricing Outlook, 2025-2035
- 6.4 Average Selling Price and Unit Economics
- 6.5 Pricing by Product and Market Segment
- 6.6 Geographic Pricing Differences
- 6.7 Key Input, Energy, Labor and Logistics Costs
- 6.8 Contract Pricing and Purchasing Models
- 6.9 Pricing Sensitivity and Competitive Positioning
- 6.10 Price, Margin and Profitability Implications
Chapter 7 North America Smart Transportation Market Dynamics
- 7.1 Market Growth Drivers
- 7.1.1 Demand-Side Drivers
- 7.1.2 Technology and Innovation Drivers
- 7.1.3 Infrastructure and Investment Drivers
- 7.1.4 Regulatory and Policy Drivers
- 7.2 Market Restraints
- 7.2.1 Cost and Affordability Constraints
- 7.2.2 Technology and Adoption Barriers
- 7.2.3 Supply Chain and Operational Constraints
- 7.3 Market Challenges
- 7.3.1 Competitive Pressure and Margin Erosion
- 7.3.2 Skills, Infrastructure and Implementation Gaps
- 7.4 Emerging Market Opportunities
- 7.5 Market Dynamics Impact and Time-Horizon Assessment
Chapter 8 North America Smart Transportation Value Chain Analysis
- 8.1 Industry Value Chain Overview
- 8.2 Upstream Suppliers and Critical Inputs
- 8.3 Technology and Component Providers
- 8.4 Manufacturing or Service Delivery
- 8.5 Distribution, Channel Partners and Integrators
- 8.6 Downstream Applications and End Users
- 8.7 Value Addition and Profit Pools
- 8.8 Vertical Integration and Outsourcing
- 8.9 Supplier Concentration and Risk
- 8.10 Supply Chain Localization and Resilience
Chapter 9 North America Smart Transportation Market Regulations and Policies
- 9.1 Relevant Laws, Standards and Compliance Frameworks
- 9.2 Product, Service, Safety and Quality Requirements
- 9.3 Government Policies, Incentives and Subsidies
- 9.4 Imports, Exports and Trade Barriers
- 9.5 Public Procurement and Local Content Requirements
- 9.6 Environmental and Sustainability Compliance
- 9.7 Upcoming Policy Changes and Market Implications
Chapter 10 North America Smart Transportation Market Hotspots and Opportunities
- 10.1 Market Opportunity Mapping and Growth Hotspots
- 10.2 High-Growth Applications and Customer Groups
- 10.3 Underserved Markets and White-Space Opportunities
- 10.4 Emerging Technology and Product Opportunities
- 10.5 New Capacity and Investment Hotspots
- 10.6 Market Entry and Expansion Opportunities
- 10.7 Distribution and Partnership Opportunities
- 10.8 Near-Term and Long-Term Commercial Potential
- 10.9 Opportunity Attractiveness and Execution Risks
Chapter 11 North America Smart Transportation Market Outlook, 2025-2035
- 11.1 Market Size and Analysis
- 11.1.1 Revenue (Market Measurement: 2025: USD 21.55 billion → 2035: USD 41.47 billion)
- 11.1.2 Market Volume and Quantity Sold
- 11.1.3 Historical Market Size, 2018-2025
- 11.1.4 Base-Year Market Size, 2025
- 11.2 Market Forecast, 2025-2035
- 11.2.1 Revenue Forecast to 2035
- 11.2.2 Volume Forecast to 2035
- 11.2.3 CAGR and Year-on-Year Growth
- 11.2.4 Incremental Revenue Opportunity
- 11.3 Forecast Assumptions and Scenario Analysis
- 11.3.1 Base-Case Forecast
- 11.3.2 Optimistic and Conservative Scenarios
- 11.3.3 Technology, Pricing and Policy Sensitivities
- 11.4 Market Attractiveness and Growth Outlook
Chapter 12 North America Smart Transportation Market Segmentation and Outlook
- 12.1 Segmentation Summary and Market Shares, 2025
- 12.2 Largest and Fastest-Growing Segments
- 12.3 By Solution Type - Market Size and Forecast, 2025-2035
- 12.3.1 Segment Definition and Scope
- 12.3.2 Historical Market Size, 2018-2025
- 12.3.3 Revenue Forecast, 2025-2035
- 12.3.4 Volume Forecast, 2025-2035
- 12.3.5 Base-Year Market Share, 2025
- 12.3.6 Segment CAGR and Growth Drivers
- 12.3.7 Subsegment Market Size and Forecast
- 12.3.7.1 ITS Infrastructure
- 12.3.7.2 Fleet Management Solutions
- 12.3.7.3 Connected Vehicle Infrastructure
- 12.3.8 Subsegment Pricing and Adoption Trends
- 12.3.9 Leading Suppliers and Competition
- 12.3.10 Regional Demand and Opportunities
- 12.4 By Customer Type - Market Size and Forecast, 2025-2035
- 12.4.1 Segment Definition and Scope
- 12.4.2 Historical Market Size, 2018-2025
- 12.4.3 Revenue Forecast, 2025-2035
- 12.4.4 Volume Forecast, 2025-2035
- 12.4.5 Base-Year Market Share, 2025
- 12.4.6 Segment CAGR and Growth Drivers
- 12.4.7 Subsegment Market Size and Forecast
- 12.4.7.1 Road Agencies
- 12.4.7.2 Toll Operators
- 12.4.7.3 Fleet Operators
- 12.4.8 Subsegment Pricing and Adoption Trends
- 12.4.9 Leading Suppliers and Competition
- 12.4.10 Regional Demand and Opportunities
- 12.5 By Application - Market Size and Forecast, 2025-2035
- 12.5.1 Segment Definition and Scope
- 12.5.2 Historical Market Size, 2018-2025
- 12.5.3 Revenue Forecast, 2025-2035
- 12.5.4 Volume Forecast, 2025-2035
- 12.5.5 Base-Year Market Share, 2025
- 12.5.6 Segment CAGR and Growth Drivers
- 12.5.7 Subsegment Market Size and Forecast
- 12.5.7.1 Traffic Efficiency
- 12.5.7.2 Fleet Productivity
- 12.5.7.3 Safety and Compliance
- 12.5.8 Subsegment Pricing and Adoption Trends
- 12.5.9 Leading Suppliers and Competition
- 12.5.10 Regional Demand and Opportunities
- 12.6 By Pricing Model - Market Size and Forecast, 2025-2035
- 12.6.1 Segment Definition and Scope
- 12.6.2 Historical Market Size, 2018-2025
- 12.6.3 Revenue Forecast, 2025-2035
- 12.6.4 Volume Forecast, 2025-2035
- 12.6.5 Base-Year Market Share, 2025
- 12.6.6 Segment CAGR and Growth Drivers
- 12.6.7 Subsegment Market Size and Forecast
- 12.6.7.1 Capital Purchases and Licenses
- 12.6.7.2 Recurring Subscriptions
- 12.6.7.3 Managed Service Fees
- 12.6.8 Subsegment Pricing and Adoption Trends
- 12.6.9 Leading Suppliers and Competition
- 12.6.10 Regional Demand and Opportunities
- 12.7 By Country - Market Size and Forecast, 2025-2035
- 12.7.1 Segment Definition and Scope
- 12.7.2 Historical Market Size, 2018-2025
- 12.7.3 Revenue Forecast, 2025-2035
- 12.7.4 Volume Forecast, 2025-2035
- 12.7.5 Base-Year Market Share, 2025
- 12.7.6 Segment CAGR and Growth Drivers
- 12.7.7 Subsegment Market Size and Forecast
- 12.7.7.1 United States
- 12.7.7.2 Canada
- 12.7.7.3 Mexico
- 12.7.8 Subsegment Pricing and Adoption Trends
- 12.7.9 Leading Suppliers and Competition
- 12.7.10 Regional Demand and Opportunities
- 12.8 Segment Growth Comparison
- 12.9 Segment Attractiveness and Priority Matrix
Chapter 13 North America Smart Transportation End-Use and Application Market Outlook
- 13.1 End-Use Industry and Customer Demand Structure
- 13.2 Leading Applications and Customer Groups
- 13.3 End-Use Market Size, Share and Forecast
- 13.4 Major End-Use Industry Deep Dives
- 13.4.1 Customer Requirements and Use Cases
- 13.4.2 Demand and Replacement Cycles
- 13.4.3 Technical and Regulatory Considerations
- 13.4.4 Purchasing and Procurement Models
- 13.4.5 Leading Vendors and Distribution Channels
- 13.4.6 Forecast and Commercial Opportunities
- 13.5 Emerging Applications and Cross-Segment Demand
- 13.6 End-Use Industry Investment Priorities
Chapter 14 North America Smart Transportation Geographic Market Outlook, 2025-2035
- 14.1 Regional Market Size and Country-Level Shares, 2025
- 14.2 Country Market Size Comparison, 2025
- 14.3 Country Market Forecasts, 2025-2035
- 14.4 Subregional Industrial and Demand Clusters
- 14.5 Intra-Regional Pricing and Cost Differences
- 14.6 Cross-Border Trade and Supply Networks
- 14.7 Regional Supply and Demand Balances
- 14.8 Country Opportunity Comparison and Prioritization
Note: Every listed country is covered on the structure shown under the first country.
Chapter 15 North America Smart Transportation Technology, Innovation and Sustainability Outlook
- 15.1 Technology Landscape and Maturity
- 15.2 Product, Process and Service Innovation
- 15.3 AI, Automation and Digital Tools in the Industry
- 15.4 Technology Adoption and Performance Benchmarking
- 15.5 Innovation Pipeline and R&D Investment
- 15.6 Patent and Intellectual Property Trends
- 15.7 Energy Efficiency and Resource Management
- 15.8 Sustainability, Recycling and Circularity
- 15.9 Technology Roadmap, 2025-2035
- 15.10 Risks of Obsolescence and Technology Substitution
Chapter 16 North America Smart Transportation Market Key Strategic Imperatives
- 16.1 Growth and Market Entry Priorities
- 16.2 High-Return Products and Segments
- 16.3 Pricing, Profitability and Cost Optimization
- 16.4 Technology Investment and Product Differentiation
- 16.5 Supply Chain Localization and Resilience
- 16.6 Distribution and Customer Acquisition
- 16.7 Partnership, Acquisition and Capacity Strategy
- 16.8 Regional Expansion Priorities
- 16.9 Short-, Medium- and Long-Term Actions
Chapter 17 Competition Outlook
- 17.1 Industry Competition Characteristics
- 17.2 Market Structure and Concentration
- 17.3 Market Share and Competitive Positioning, 2025
- 17.4 Company-Wise Revenue and Product Benchmarking
- 17.5 Production and Service Capacity Benchmarking
- 17.6 Technology, Pricing and Differentiation
- 17.7 Regional Footprint and Distribution Strength
- 17.8 Mergers, Acquisitions and Strategic Alliances
- 17.9 New Entrants and Competitive Threats
- 17.10 Porter's Five Forces and Industry Attractiveness
- 17.11 Competitive Outlook, 2025-2035
Chapter 18 Company Profiles
- 18.1 Company Coverage and Selection Criteria
- 18.2 Samsara
- 18.2.1 Business Description
- 18.2.2 Company Ownership and Geographic Presence
- 18.2.3 Product and Service Portfolio
- 18.2.4 Manufacturing and Operating Footprint
- 18.2.5 Production Capacity and Expansion Plans
- 18.2.6 Financial Performance and Investment
- 18.2.7 Market Share and Competitive Position
- 18.2.8 Technology and Innovation Capabilities
- 18.2.9 Strategic Alliances or Partnerships
- 18.2.10 Recent Developments
- 18.2.11 Growth Strategy and Outlook
- 18.3 Verizon Connect
- 18.4 Geotab
- 18.5 Cubic Transportation Systems
- 18.6 Kapsch TrafficCom
- 18.7 Conduent Transportation
- 18.8 Lytx
- 18.9 HERE Technologies
- 18.10 Iteris
- 18.11 Q-Free
- 18.12 Other Relevant Market Participants
Note: Every listed company is profiled on the structure shown under the first company. The company list is preliminary and may change based on research findings, market developments, data availability and client requirements.
Chapter 19 Disclaimer
- 19.1 Research and Forecast Disclaimer
- 19.2 Data Source and Estimation Limitations
Note: The depth of individual sections depends on data availability for this market. Volume, capacity, trade and other unit-based metrics are included where applicable.

