
Federal API deadlines move approvals from fax to real time
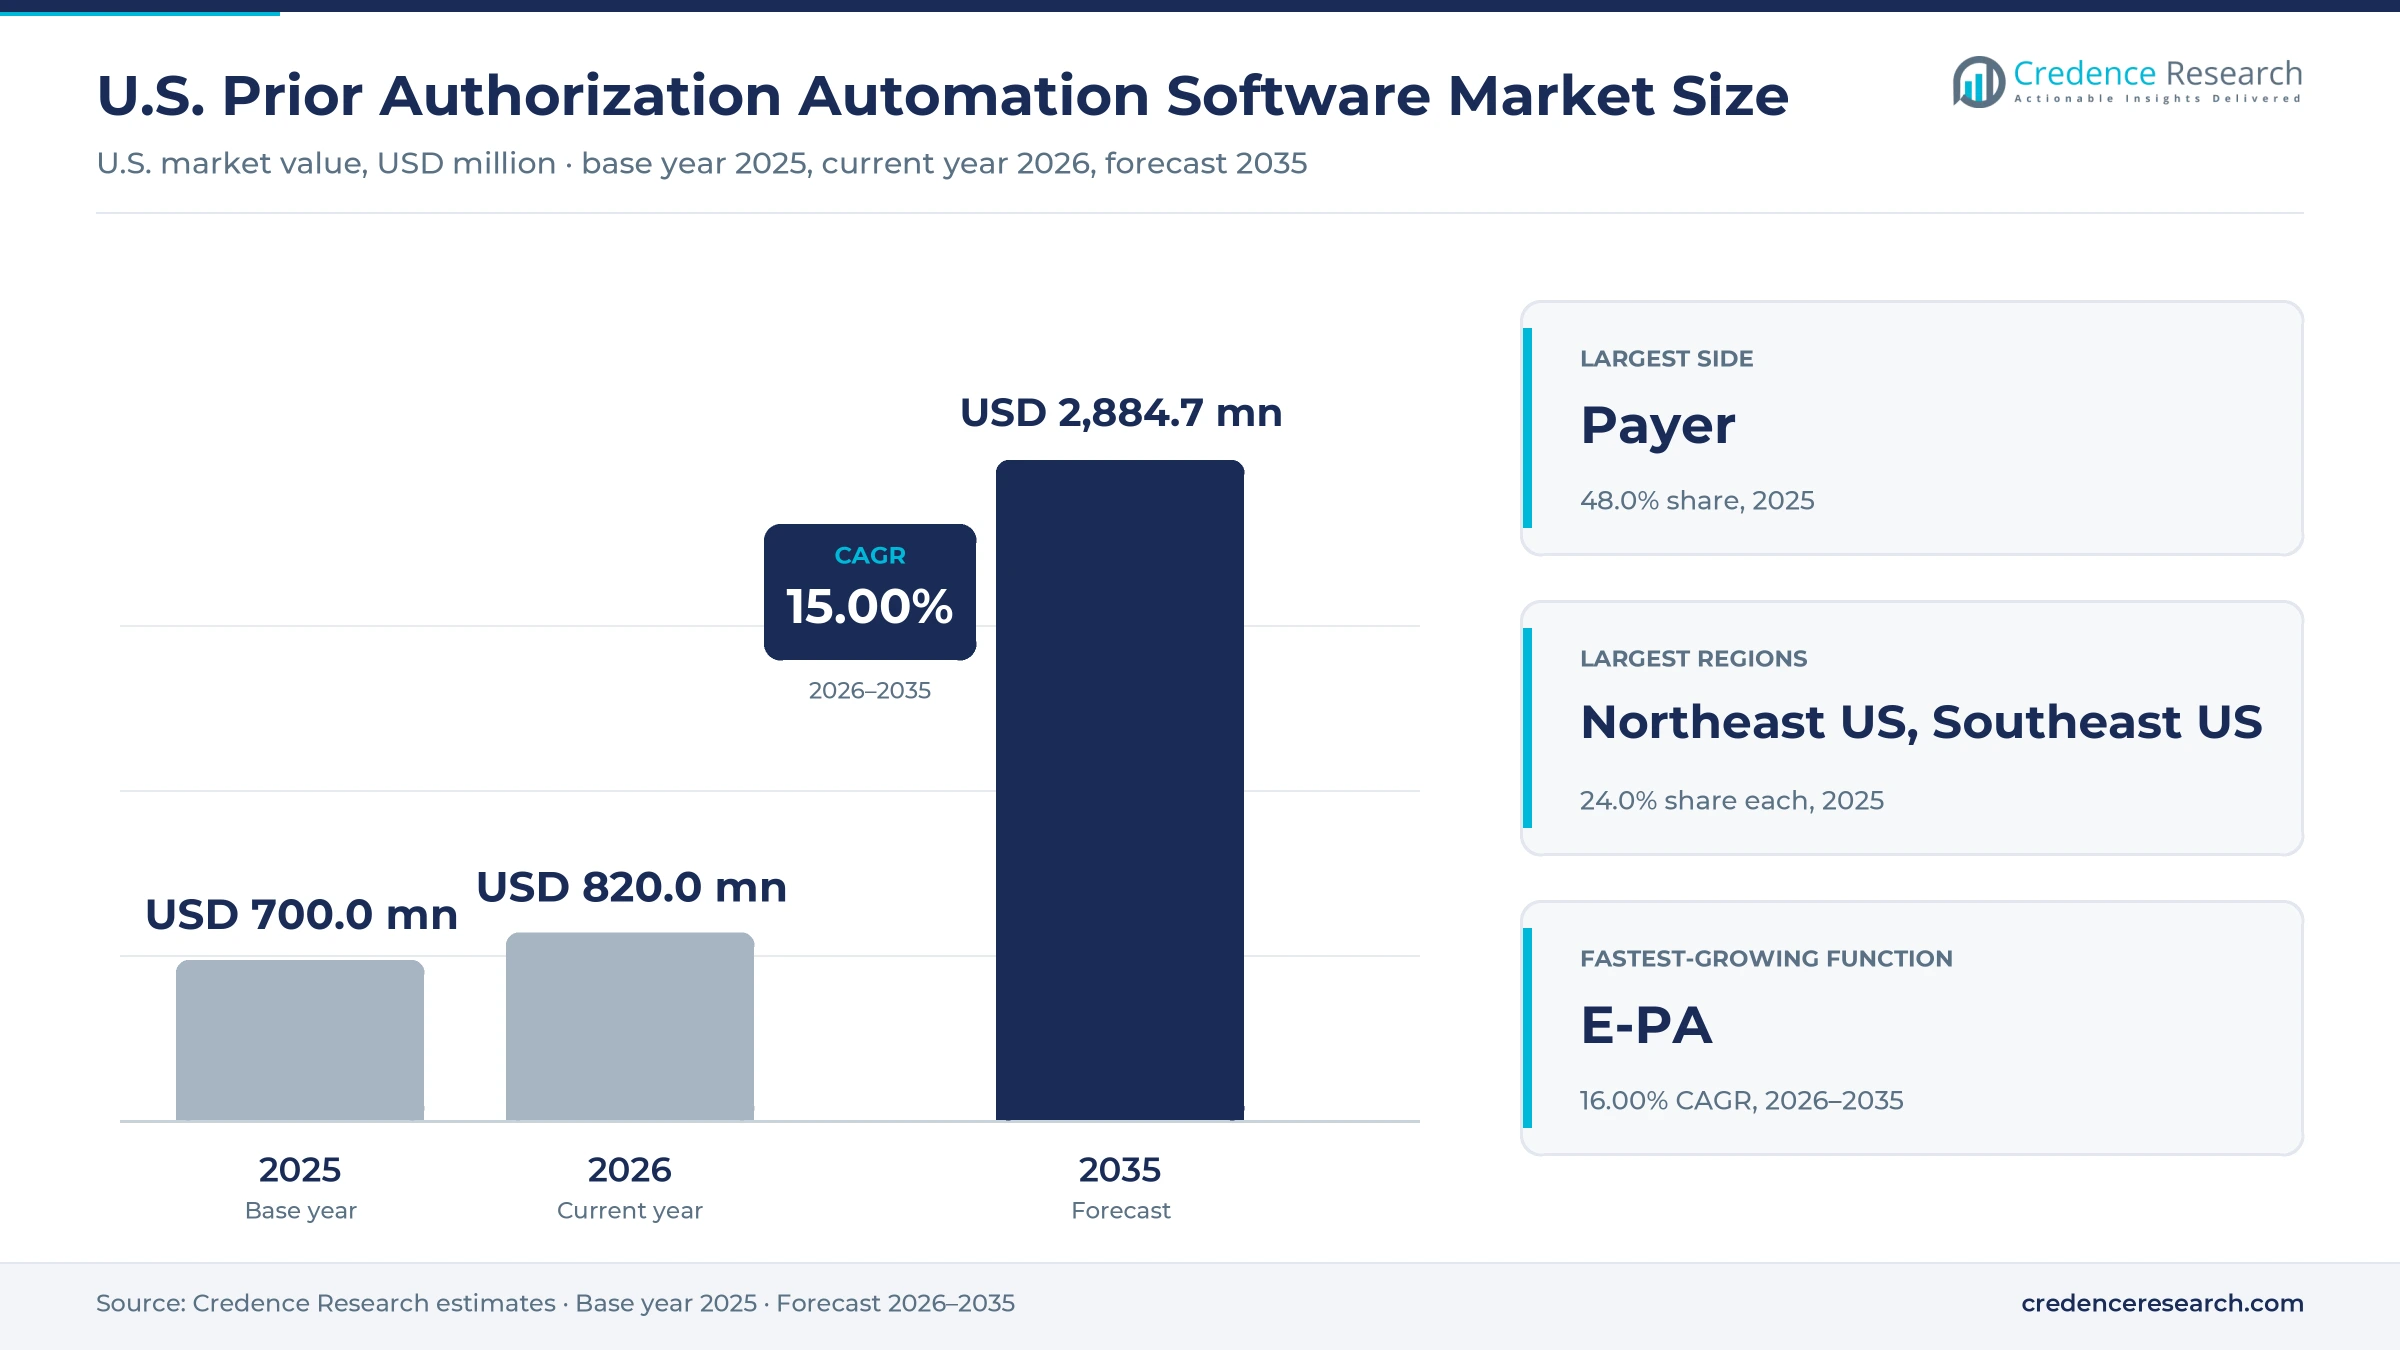
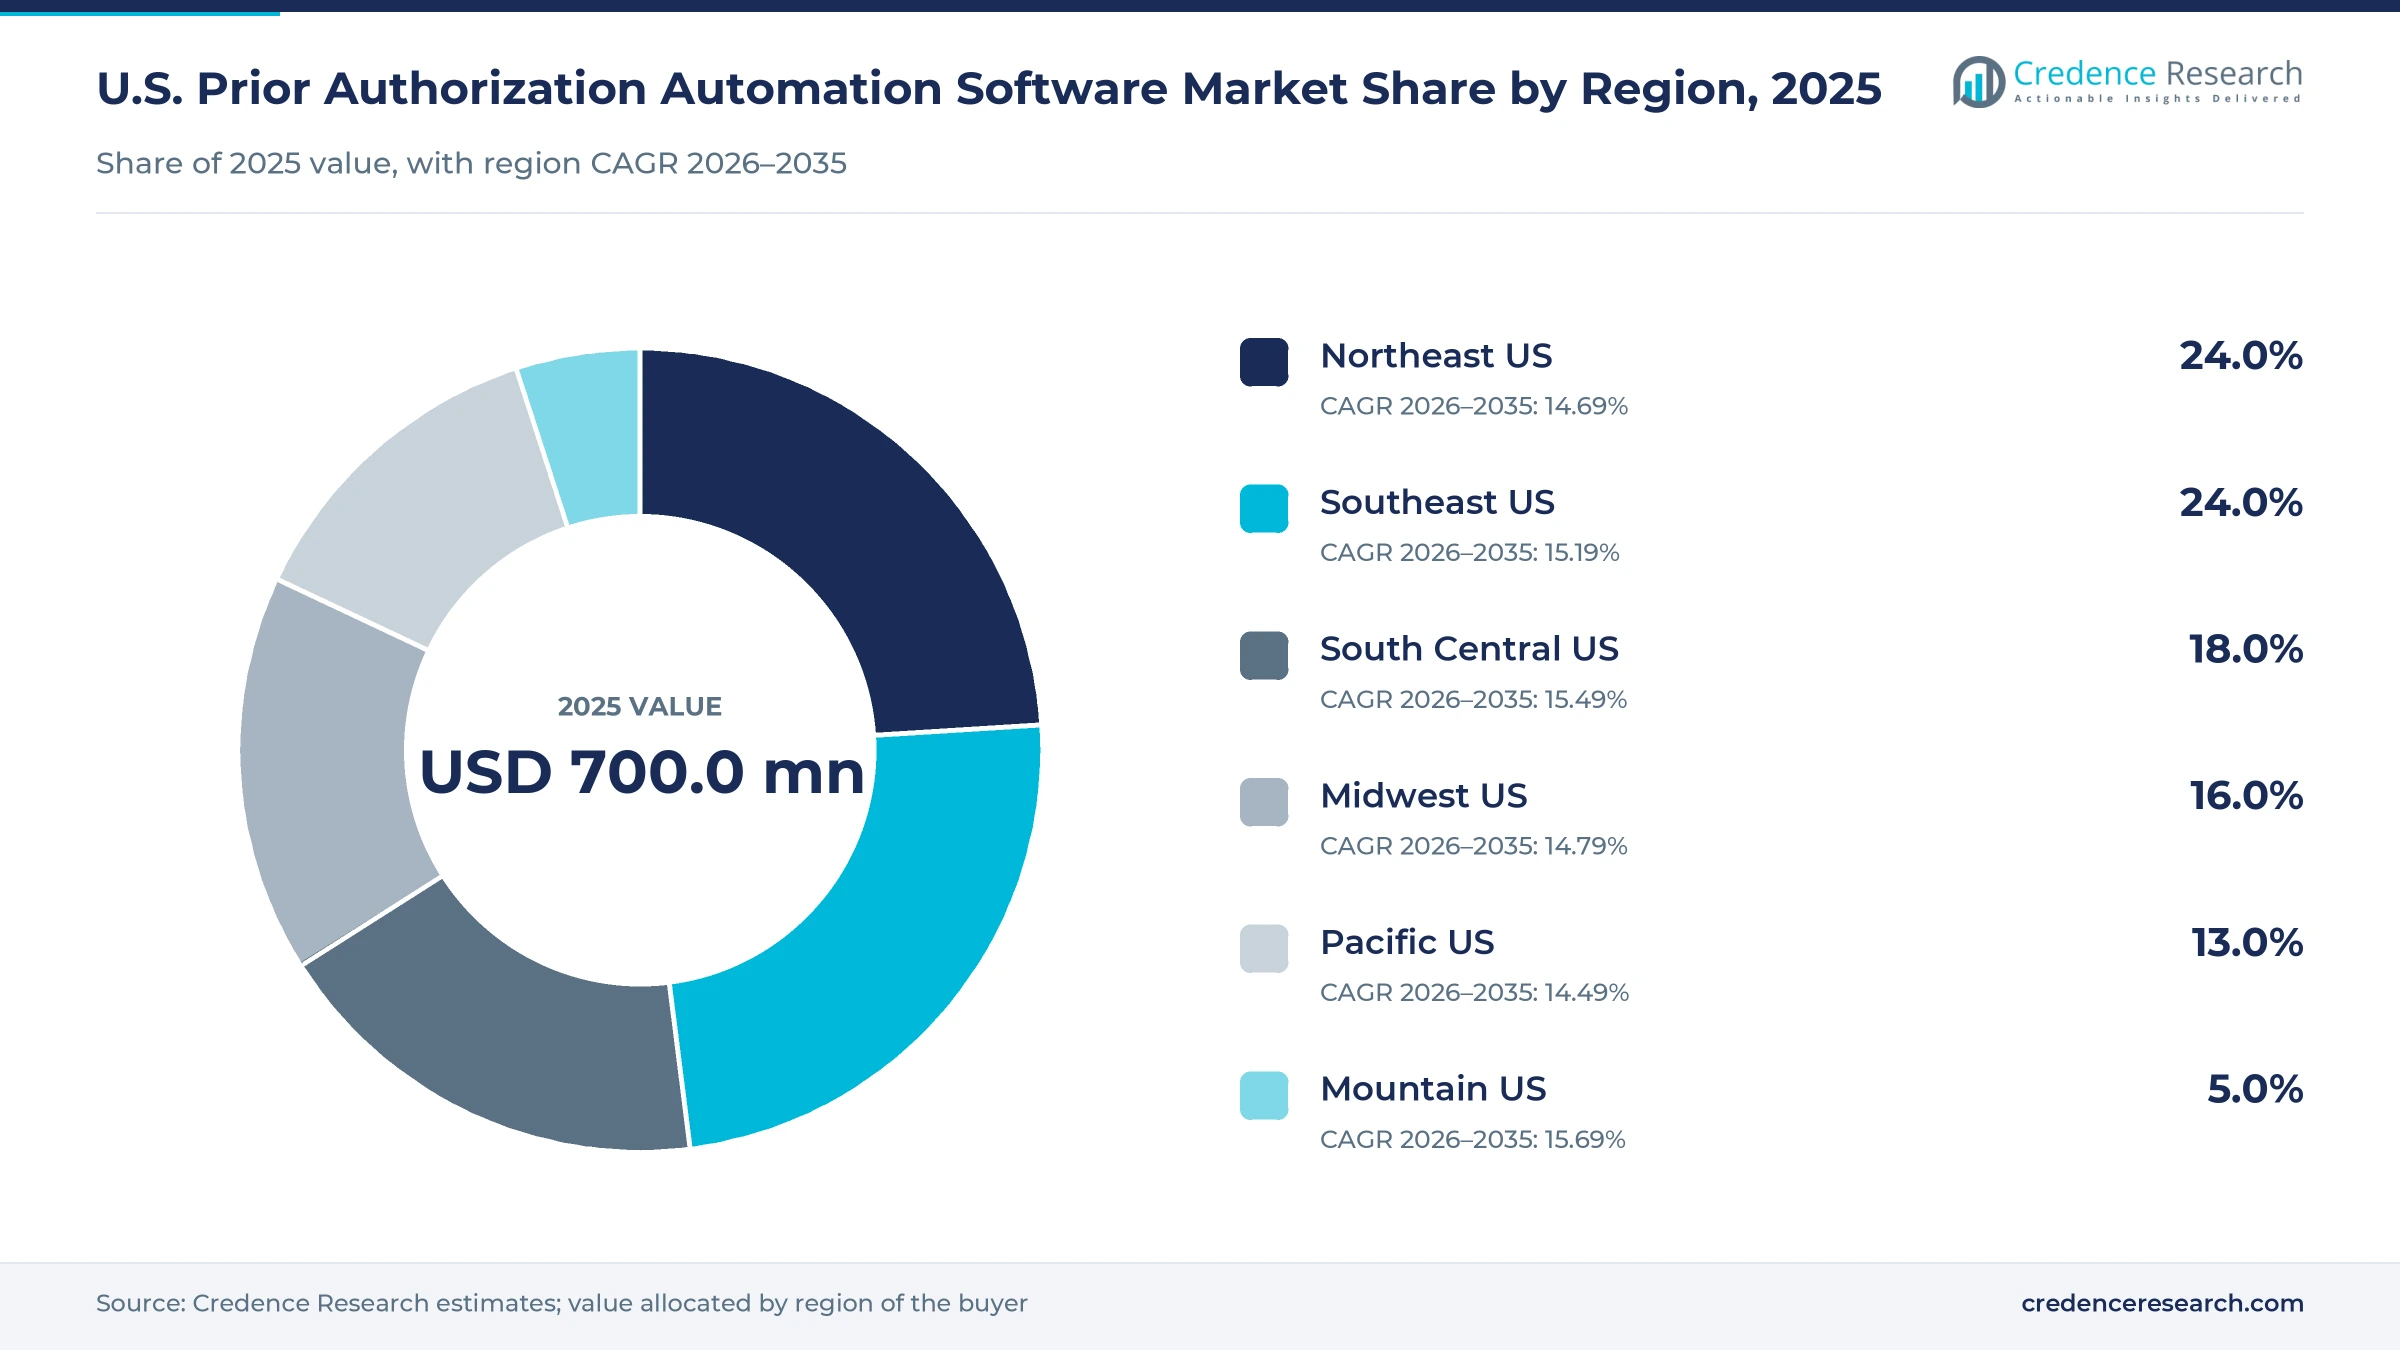
The U.S. prior authorization automation software market was valued at USD 700.0 million in 2025 and is projected to increase from USD 820.0 million in 2026 to USD 2.88 billion by 2035, registering a CAGR of 15.00% during 2026–2035. Demand comes from health plans, hospitals, physician groups and pharmacy benefit channels that want to cut the staff time spent on approval requests. The Northeast and Southeast held the largest regional shares, 24.0% each in 2025, while the Mountain region grows fastest at 15.69% a year. Federal rules set the pace, because the CMS Interoperability and Prior Authorization Final Rule requires 72-hour urgent and seven-day standard decisions from 2026 and a Prior Authorization API by Jan. 1, 2027. Insurers covering 257 million Americans also pledged in June 2025 to answer at least 80% of electronic requests in real time by 2027. Vendors are therefore pairing FHIR connections with AI document extraction and rules engines that approve routine cases in seconds.
What does prior authorization automation cover in the U.S.?
The market counts spending on software and technology-enabled services that automate prior authorization requests between payers, providers and pharmacy benefit channels. This includes intake tools that collect and route requests, clinical review platforms that apply medical policy, and electronic prior authorization networks that exchange requests and decisions, sold as SaaS subscriptions or as outsourced services that combine staff with AI.
The estimate excludes the clinical staff salaries of health plans and hospitals, general claims processing and billing systems, and electronic health record licenses where prior authorization is not priced separately. It also excludes drug costs and pharmacy dispensing fees, although pharmacy benefit electronic prior authorization transaction fees are counted.
U.S. Prior Authorization Automation Software Market Insights
- The market grows from USD 700.0 million in 2025 to USD 2.88 billion by 2035, a 15.00% CAGR, as payers meet the Jan. 1, 2027, Prior Authorization API deadline.
- The Northeast and Southeast each held 24.0% of 2025 value, supported by large plans, Highmark in Pittsburgh and Availity in Jacksonville.
- Payer-side tools held 48.0% of 2025 value, because federal decision deadlines and API duties fall on health plans first.
- Medicare Advantage insurers made 52.8 million prior authorization determinations in 2024, according to KFF, which keeps volumes high enough to justify automation.
- Waystar agreed in July 2025 to acquire Iodine Software for $1.25 billion, adding clinical AI to its prior authorization tools.
Payer tools lead while electronic requests grow fastest
Why do payer-side tools lead spending?
Based on side, the market is categorized into payer, provider and pharmacy benefit. Payer tools led with 48.0% of 2025 value because federal rules place the decision deadlines and API duties on Medicare Advantage, Medicaid and exchange plans, and KFF counted 52.8 million Medicare Advantage determinations in 2024 alone. Provider tools grow fastest at 15.76% a year as practices seek relief, since the AMA found that practices complete 39 requests a week for each physician. Rhyme reported more than 300 payer connections and over five million authorizations a year in October 2025.
Why does clinical review hold the largest function share?
Based on function, the market is categorized into intake, clinical review and e-PA. Clinical Review led with 42.0% of 2025 value because medical policy checks absorb the most nurse and physician time, and Availity reported that 76% of 1.1 million requests in one Blue plan were recommended for approval in near real time. Cohere Health processes more than 5.6 million requests a year through its review platform. E-PA grows fastest at 16.00% a year as CMS requires a FHIR Prior Authorization API by Jan. 1, 2027, and the CAQH 2025 Index put electronic prior authorization adoption at 40%, up from 31% two years earlier.
How do SaaS platforms and BPO with AI divide demand?
Based on deployment, the market is categorized into SaaS and BPO+AI. SaaS platforms led with 64.0% of 2025 value because payers and health systems buy network subscriptions, and Availity says it connects directly to more than 95% of health plans and 3.4 million providers. BPO+AI services grow fastest at 15.57% a year as buyers outsource calls and follow-up to AI agents, and Infinitus placed automated calls for 1.17 million patients and 20% of U.S. providers in 2025. Cohere Health also raised $90 million in May 2025 to meet health plan demand for AI-powered services.
| Segment Group | Leading Sub-segment | Share, 2025 | Fastest-growing Sub-segment | CAGR, 2026–2035 |
|---|---|---|---|---|
| By Side | Payer | 48.0% | Provider | 15.76% |
| By Function | Clinical Review | 42.0% | E-PA | 16.00% |
| By Deployment | SaaS | 64.0% | BPO+AI | 15.57% |
Request a Free Sample
Fill in your details and we'll send you a free sample report.
- Sample data tables & charts
- Research methodology
Staff cost, CMS rules and AI review lift spending
Payers and providers cut approval processing costs
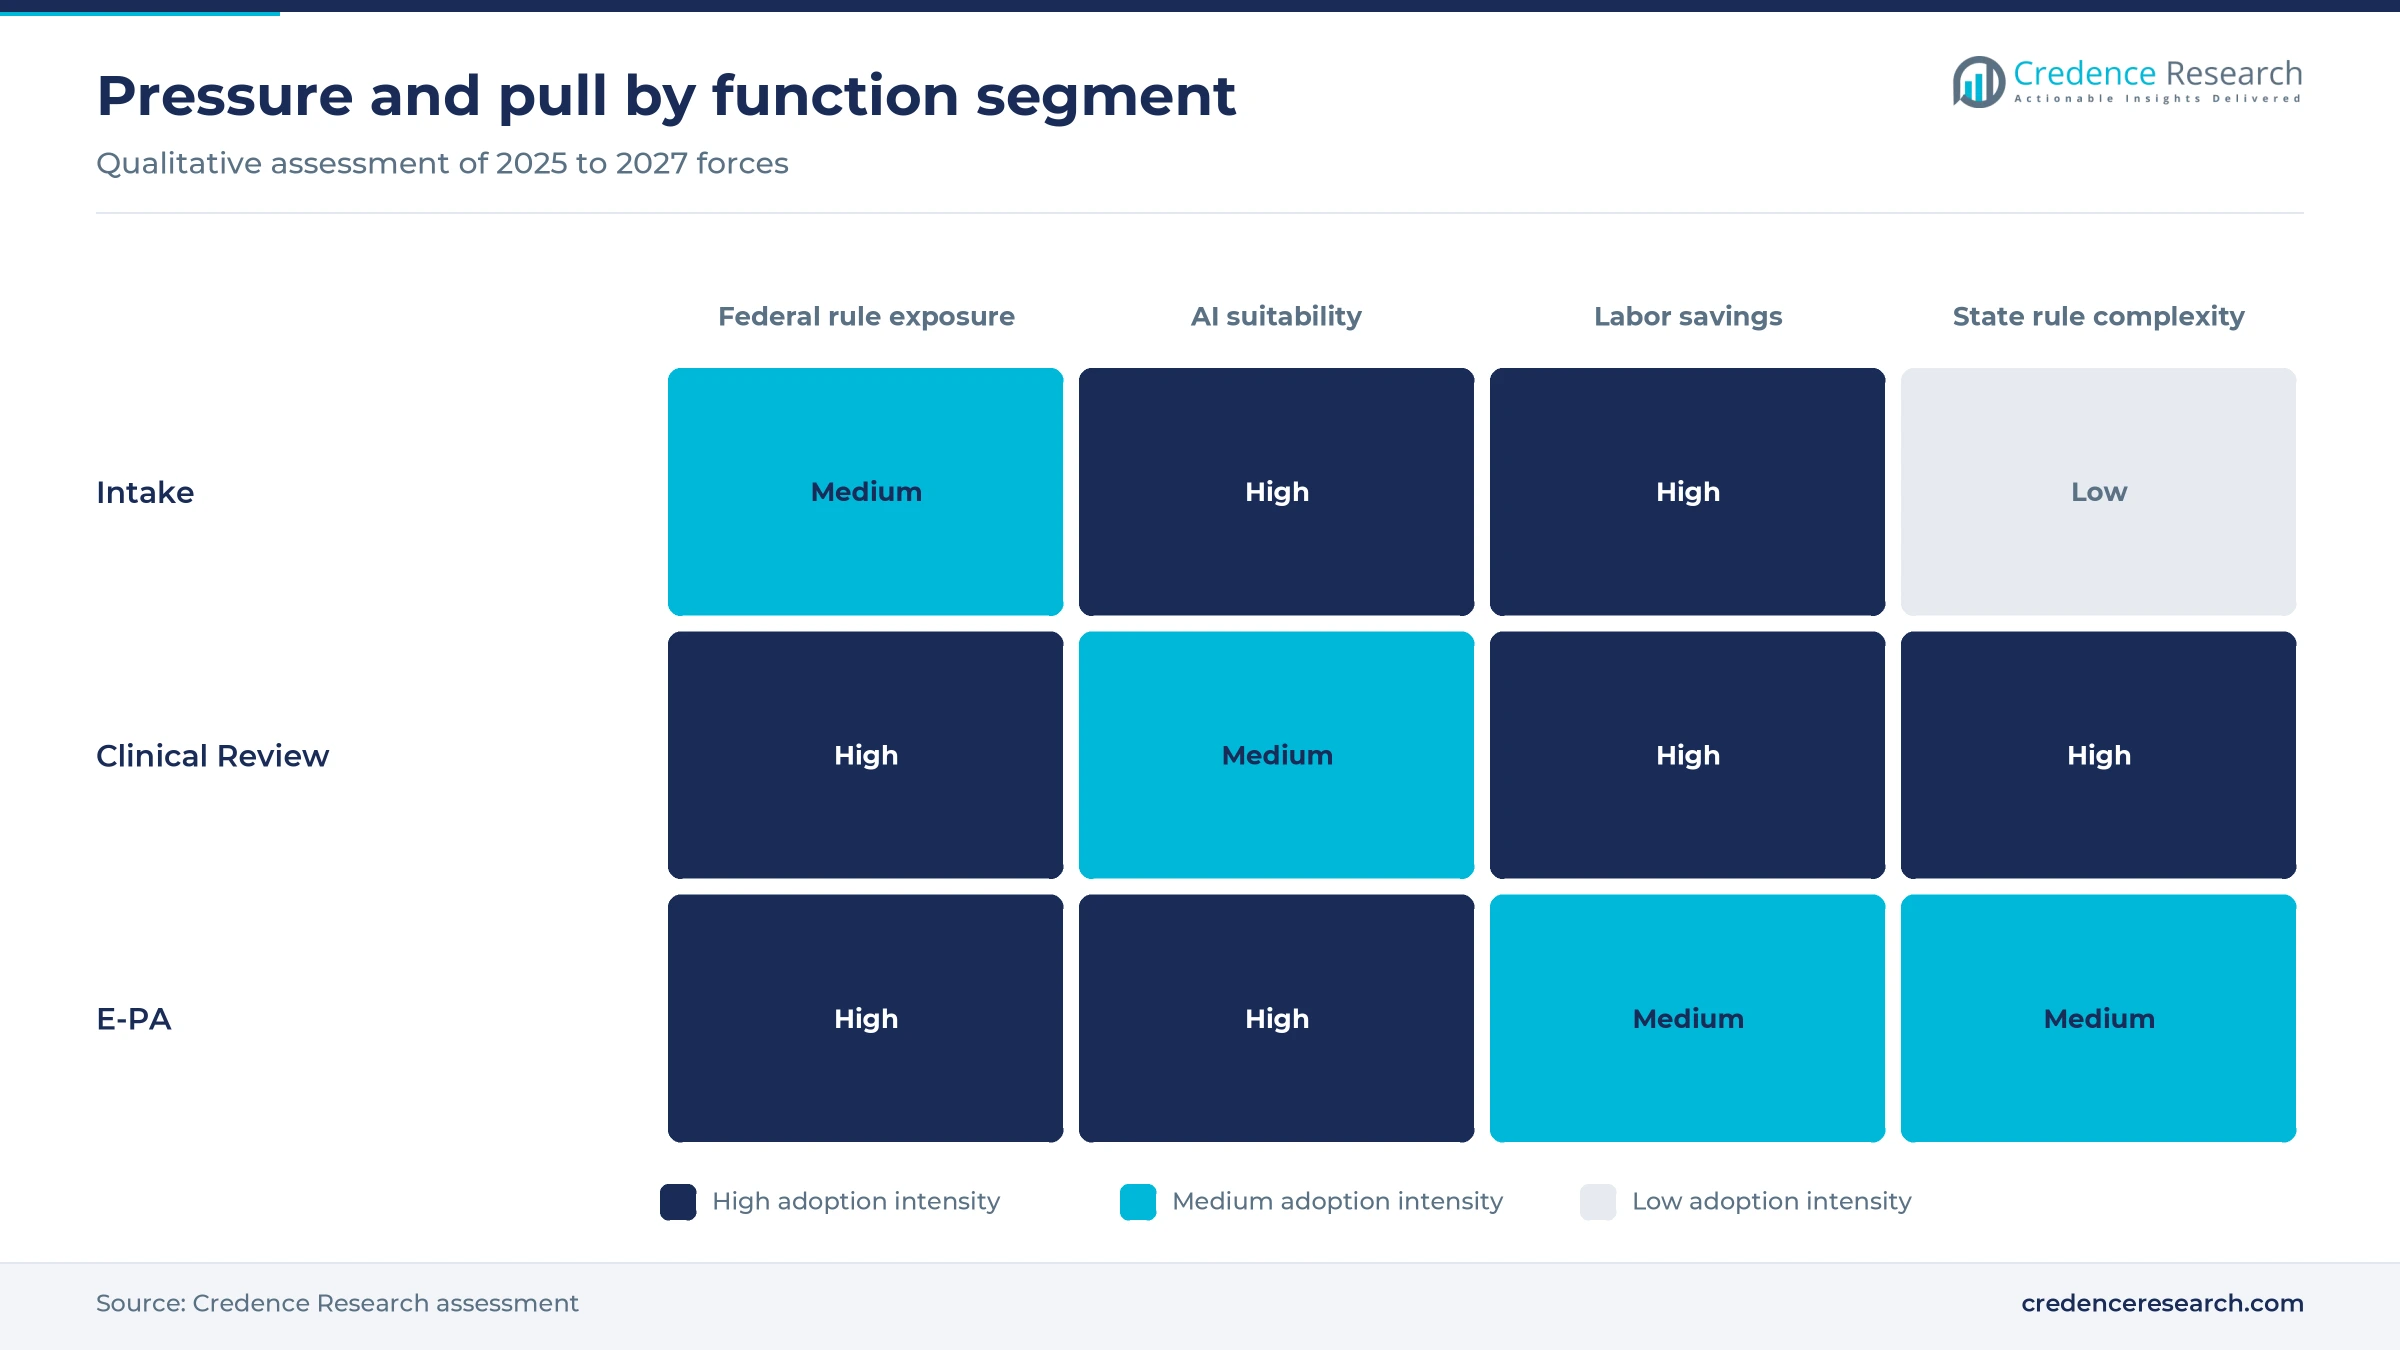
Payers and providers want to cut the labor cost of each approval request, which is the main reason budgets move from fax and phone work to software. An AMA survey of 1,000 physicians found that practices complete 39 prior authorizations a week and spend about 13 hours on them. The same survey found that 40% of physicians employ staff who work exclusively on these requests, which sustains demand for intake tools. On the payer side, KFF counted 52.8 million Medicare Advantage determinations in 2024, so even small savings per request add up across large plans. Plans averaged 1.7 requests per Medicare Advantage enrollee that year, according to the same KFF analysis. In the Credence Research model this cost driver adds about 5.85 percentage points to annual growth to 2035.
Interoperability rules push electronic approval workflows
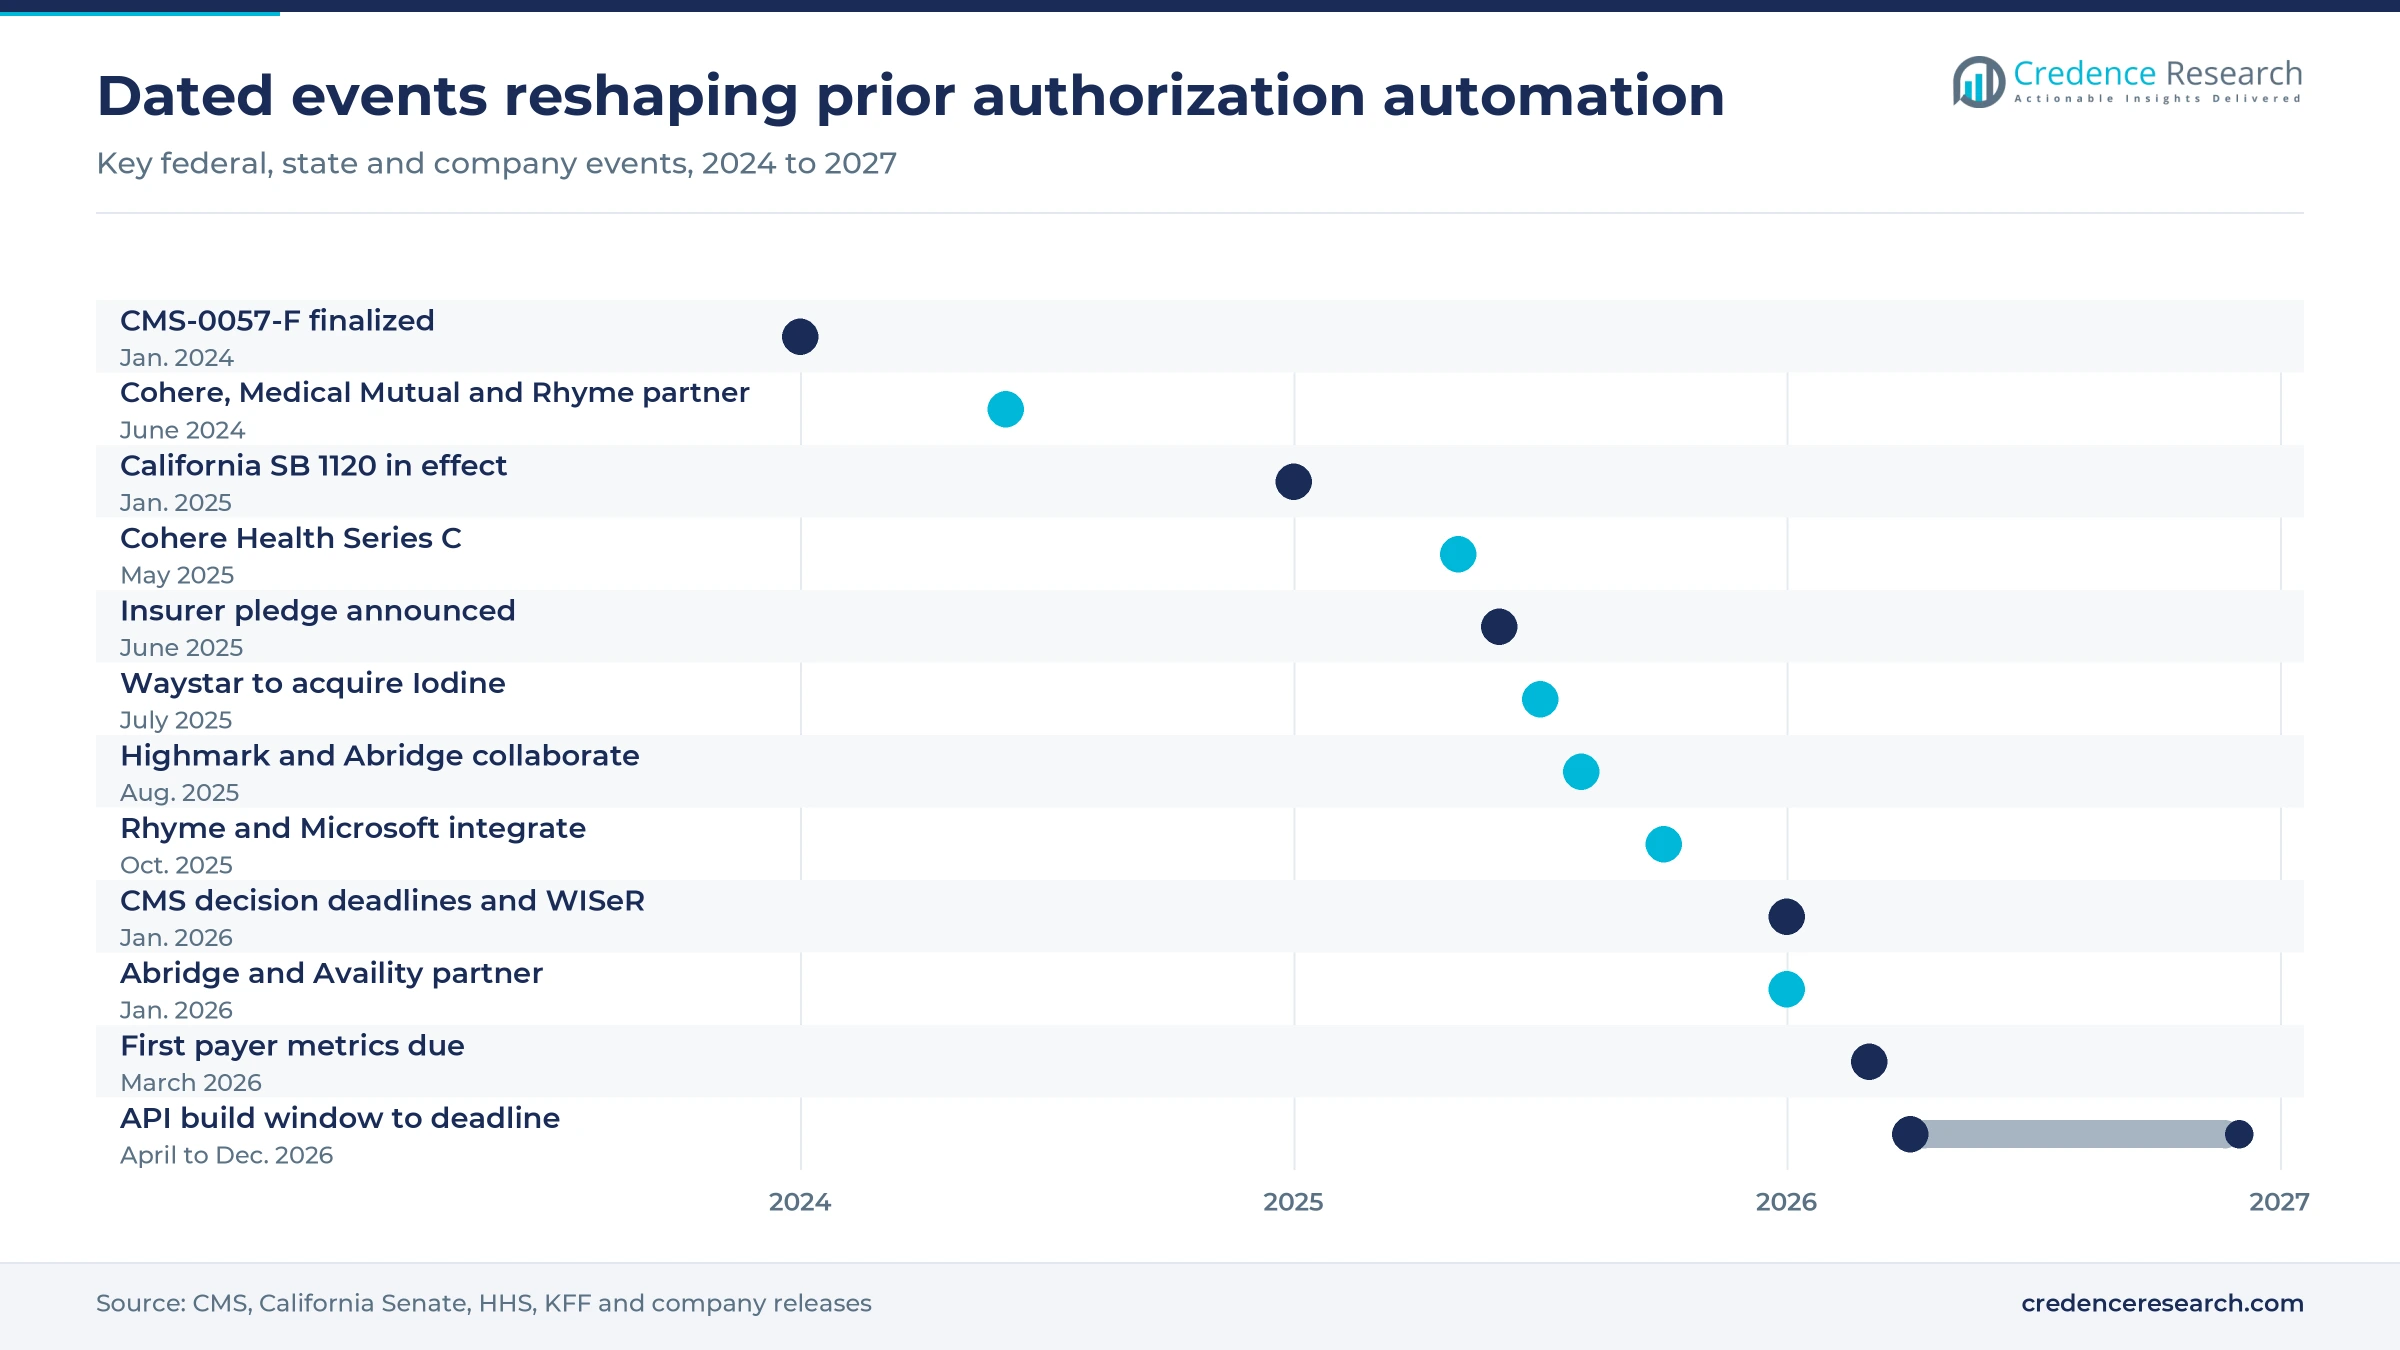
CMS finalized the Interoperability and Prior Authorization rule on Jan. 17, 2024, creating fixed deadlines that force payers to modernize approval workflows. Impacted payers must issue urgent decisions within 72 hours and standard decisions within seven calendar days from 2026. They must also build Patient Access, Provider Access, Payer-to-Payer and Prior Authorization APIs by Jan. 1, 2027, and publish their first approval metrics by March 31, 2026. CMS estimated savings of about $15 billion over ten years from these changes. Clinicians and hospitals will attest to electronic requests under a new measure from the 2027 reporting period, which links the rule to health data exchange platforms. In the Credence Research model this rule driver adds about 4.20 percentage points to annual growth.
AI document extraction raises case throughput
AI document extraction and rules engines let reviewers clear more cases per day, which turns automation into a capacity tool for payers. Availity reported in May 2025 that more than 1.1 million authorizations moved through its Intelligent Utilization Management solution at one Blue plan between January 2024 and March 2025. Of those requests, 76% were recommended for approval in near real time, with an average response under 20 seconds. Cohere Health processes more than 5.6 million requests a year and affects more than 15 million plan members, the company said in June 2024. Rhyme reported over five million authorizations a year in October 2025, adding provider demand to payer volumes. In the Credence Research model this throughput driver adds about 2.55 percentage points to annual growth, and Clinical Review holds 42.0% of value.
Insurer pledges set real-time approval targets
Voluntary insurer pledges add a second deadline beside the federal rule, because plans promised measurable reductions and faster answers. HHS announced on June 23, 2025, that 12 insurers and dozens of health plans covering 257 million Americans had committed to reform prior authorization, according to Healio. The pledge targets at least 80% of electronic approvals answered in real time by 2027, plus a 90-day continuation of approved care when patients switch plans. AHIP said in April 2026 that plans had already eliminated 11% of prior authorizations, about 6.5 million fewer requests, and 15% in Medicare Advantage, MedCity News reported. Fewer but faster requests push spending toward real-time tools, and E-PA grows at 16.00% a year in the Credence Research model.
Point-of-care approvals and AI guardrails reshape demand
Shift of approvals to the point of care
Prior authorization is shifting from back-office queues to the exam room, as ambient AI tools capture the clinical evidence while the visit happens. Highmark Health and Abridge announced on Aug. 12, 2025, that they would build a real-time prior authorization solution, starting with Allegheny Health Network, its 14-hospital provider, according to HIT Consultant. In January 2026 Abridge partnered with Availity to embed FHIR-native payer APIs in its ambient AI, Fierce Healthcare reported, with Abridge serving more than 200 health systems. Rhyme also announced an integration with Microsoft Dragon Copilot in October 2025 to return touchless answers while patients are still in the office. As a result, Provider tools grow at 15.76% a year in the Credence Research estimate.
Rise of AI guardrails in utilization review
AI guardrails are rising in utilization review, which favors vendors that keep clinicians in the decision loop. California's SB 1120, the Physicians Make Decisions Act, took effect on Jan. 1, 2025, and requires a licensed physician or qualified provider to decide any denial based on medical necessity. Maryland passed HB 820 in 2025, which bars insurers using AI from relying on group datasets instead of patient records, according to MultiState. CMS also launched the WISeR model on Jan. 1, 2026, testing technology-assisted prior authorization for selected services in traditional Medicare in six states, DLA Piper reported. Vendors now market auto-approval of routine cases while routing possible denials to human reviewers.
Opening in provider-side AI agents and services
Provider-side AI agents form a clear opening, because hospitals and practices still carry most of the manual follow-up work. Infinitus, which sells healthcare voice agents, placed automated calls for 1.17 million patients and 20% of U.S. providers in 2025, and it extended AI review to prior authorization follow-up calls early that year. Waystar agreed in July 2025 to acquire Iodine Software at a $1.25 billion enterprise value, saying generative AI for prior authorizations would expand through Waystar AltitudeAI. The AMA also found that physicians and staff spend about 13 hours a week on these requests, a cost that services can replace. Vendors that blend AI agents with staff can capture this work, and BPO+AI services grow at 15.57% a year in the Credence Research model.
Opening in pharmacy benefit electronic approvals
Pharmacy benefit electronic approvals offer an opening, since specialty drugs need fast coverage answers before patients leave the clinic. Surescripts reported on March 3, 2026, that its prior authorization automation returned approvals for qualifying medications in 18 seconds. The same report said 45,275 prescribers across 20 health systems were enabled for this service, covering 83 medications. Real-Time Prescription Benefit checks reached 973,463 prescribers in 2025, with 1 billion responses that informed 11.9 million specialty prescriptions. Pharmacy channels already run on standard electronic transactions, so vendors can add AI review on top of existing rails. Pharmacy benefit automation software holds a smaller share in the Credence Research estimate for 2025, which leaves room for growth as more drugs and prescribers join automated programs.
Denial scrutiny, state rules and long projects slow buyers
Do high appeal overturn rates raise scrutiny of automated review?
KFF reported in January 2026 that Medicare Advantage insurers denied 4.1 million requests in 2024, or 7.7% of determinations, and overturned 80.7% of the denials that were appealed. UnitedHealthcare posted the highest denial rate among large insurers, at 12.8%. These figures draw political attention to any tool linked with denials, and buyers must document how automated rules reach each decision. Vendors therefore stress auto-approvals and human review for adverse outcomes, which limits fully touchless denials.
How does the state rule patchwork raise configuration costs?
State laws set different decision clocks, which forces vendors to maintain separate rule sets for each market. Indiana SB 480 sets 24-hour urgent and 48-hour non-urgent deadlines, while Iowa HF 303 sets 48 hours and 10 calendar days, according to MultiState in August 2025. Texas HB 3812 extended its gold card look-back to one year, and six states had gold carding laws before 2025. Each change requires new logic, testing and reporting, which raises costs for smaller vendors and regional plans.
Will patient harm reports slow buyer approvals of AI tools?
Patient harm reports add caution to AI purchases, because buyers fear blame for delayed care. The AMA survey found that more than one quarter of physicians reported a serious adverse event linked to prior authorization, and 23% reported a hospitalization. Maryland now requires insurers to report adverse determinations made with AI to its Insurance Commissioner under HB 820. Compliance teams therefore extend vendor reviews and pilots, which delays contracts for new AI products by several months.
Do long integration projects delay value for payers?
Long integration projects delay returns, because each payer must connect policies, claims data and provider portals before automation works. Availity said in May 2025 that its Blue plan rollout took 10 months, compared with an average of 12 to 18 months for projects of that size. Plans that start late may miss the Jan. 1, 2027, API deadline set by CMS. Smaller Medicaid plans with limited IT staff face the greatest risk, so many choose shared networks or outsourced payer services over custom builds.
Northeast and Southeast hold the largest regional shares
| Region | Value, 2025 (USD million) | Share, 2025 | CAGR, 2026–2035 |
|---|---|---|---|
| Northeast | 168.0 | 24.0% | 14.69% |
| Southeast | 168.0 | 24.0% | 15.19% |
| South Central | 126.0 | 18.0% | 15.49% |
| Midwest | 112.0 | 16.0% | 14.79% |
| Pacific | 91.0 | 13.0% | 14.49% |
| Mountain | 35.0 | 5.0% | 15.69% |
The Northeast leads on large plans and health systems
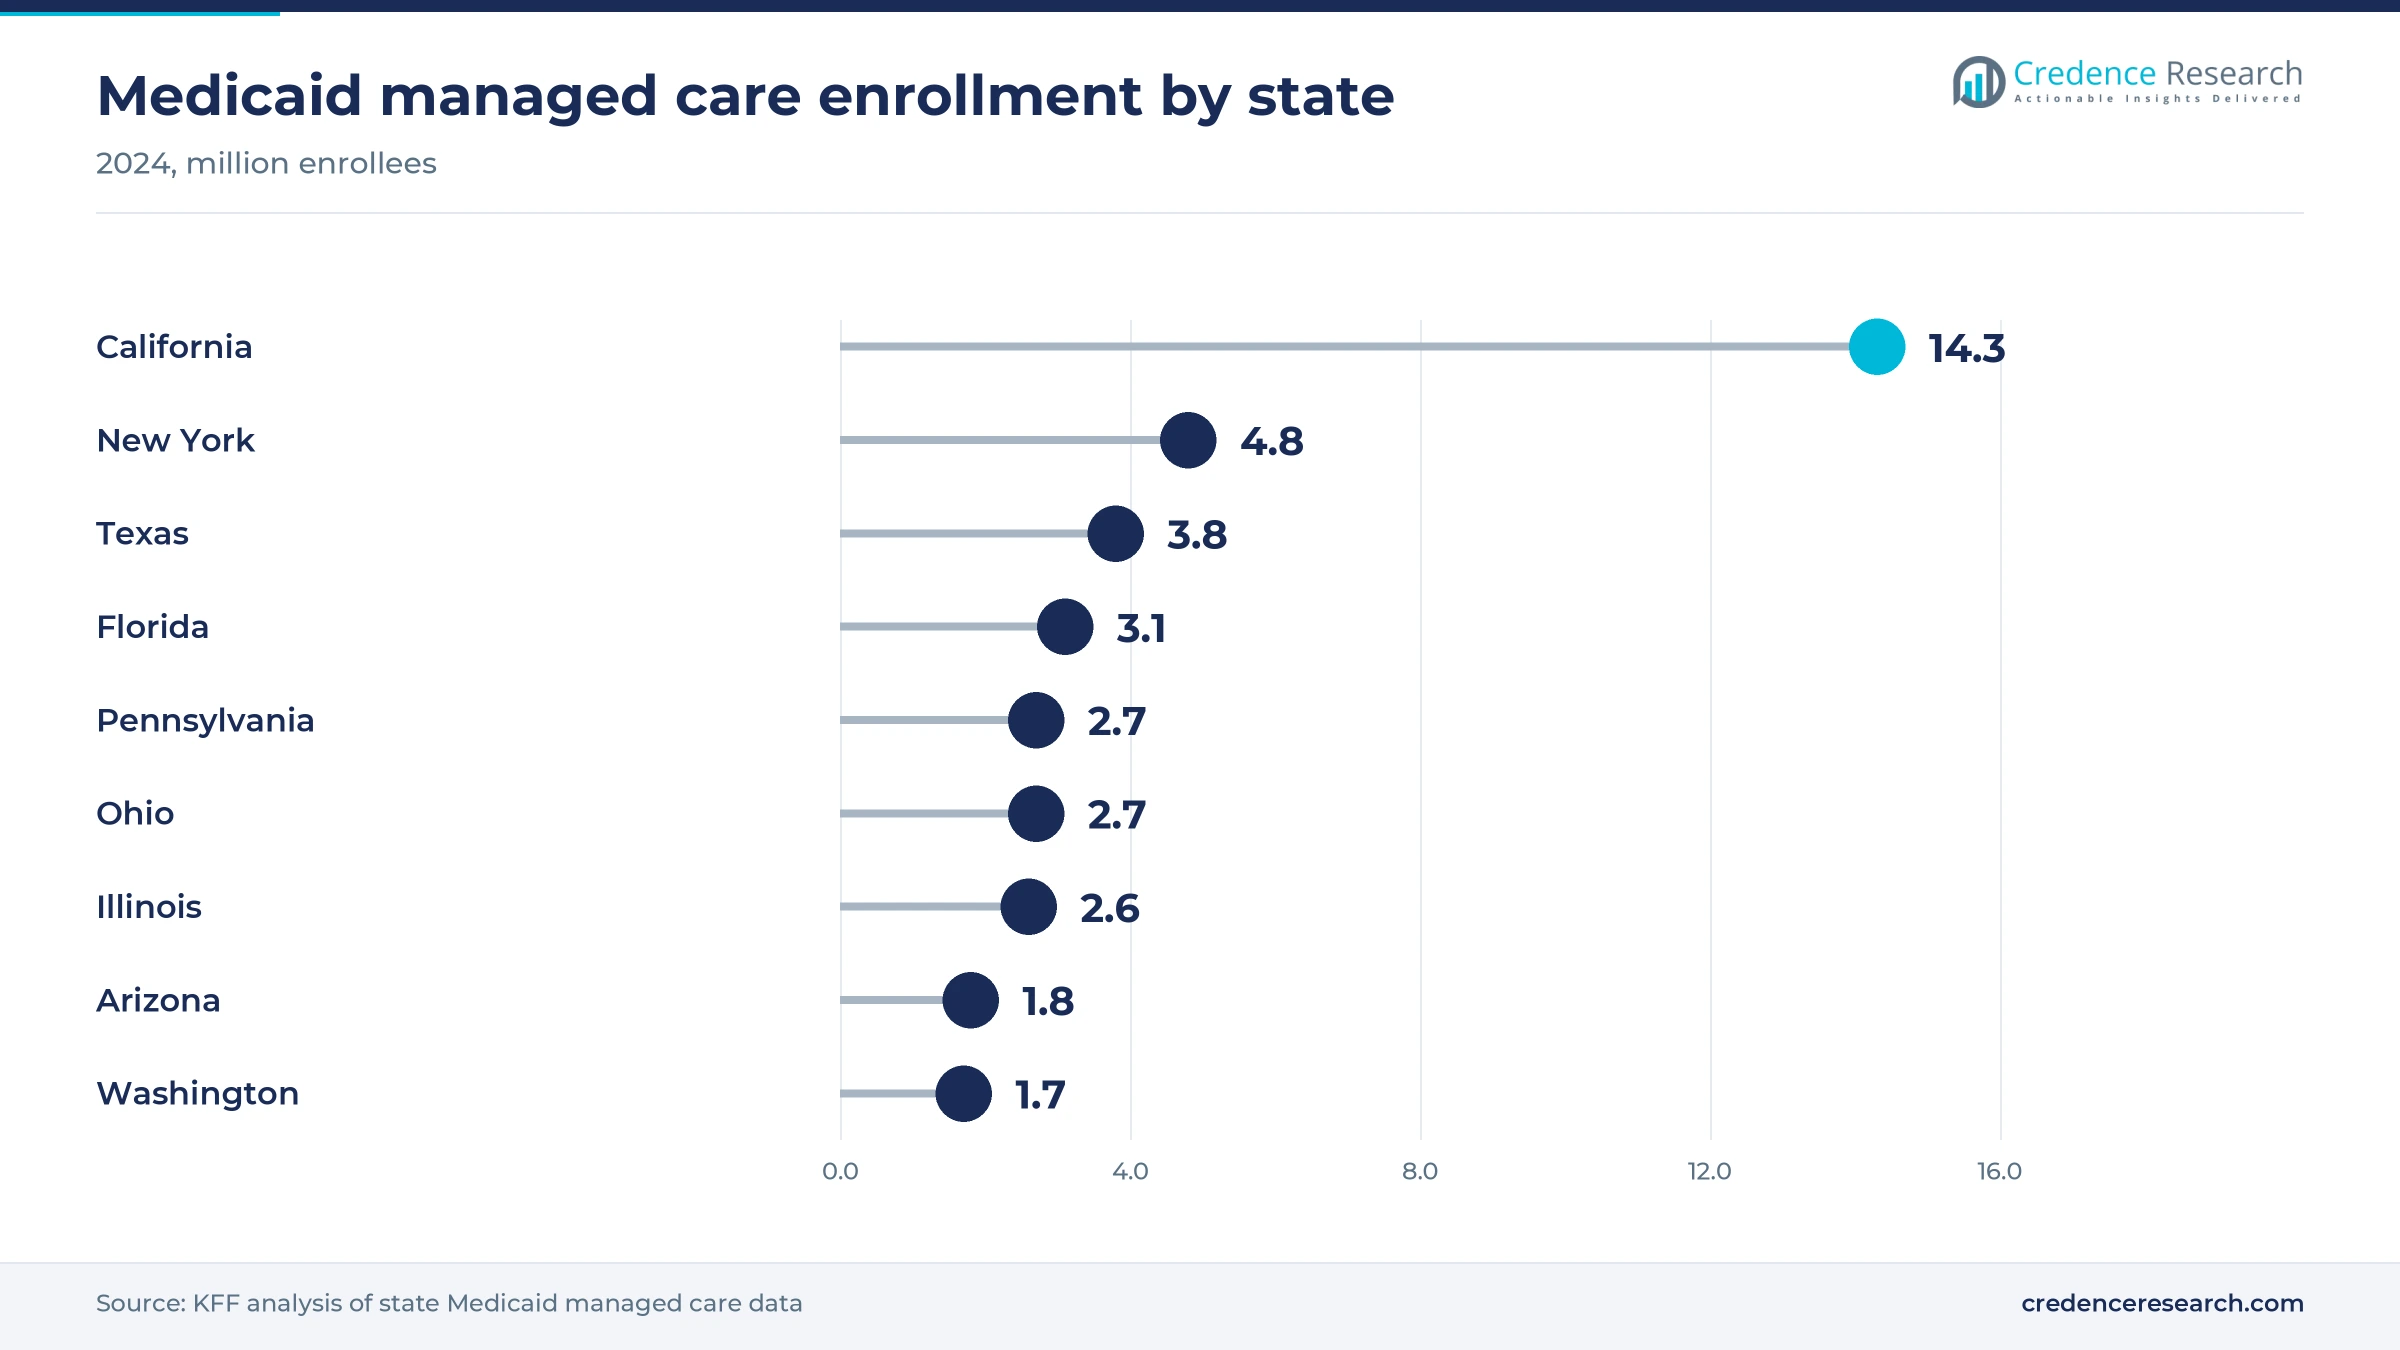
The Northeast held 24.0% of 2025 value and grows at 14.69% a year, slightly below the national pace. Pittsburgh-based Highmark Health began building real-time prior authorization with Abridge in August 2025, starting at Allegheny Health Network. New York had 4.75 million Medicaid managed care enrollees in 2024, according to KFF, which sustains payer-side review volume. New Jersey is also one of the six WISeR states, adding traditional Medicare requests from January 2026.
The Southeast shares the lead with network operators
The Southeast matched the Northeast share of 2025 value and grows at 15.19% a year, slightly above the national rate. Jacksonville-based Availity runs the largest network in the zone, with plans covering over 17 million lives using its Intelligent Utilization Management product by June 2025. Florida had 3.05 million Medicaid managed care enrollees in 2024, according to KFF, and many are in plans that must meet federal decision deadlines from 2026. Large Medicare Advantage populations add further request volume across the region.
South Central gains from texas rules and WISeR
The South Central region held 18.0% of 2025 value and grows at 15.49% a year, faster than the national pace. Texas and Oklahoma are both WISeR states, so traditional Medicare requests for selected services started there in January 2026. Texas had 3.84 million Medicaid managed care enrollees in 2024, according to KFF. Texas HB 3812 also extended the gold card look-back to one year in 2025, which pushes plans to track provider approval rates automatically.
The Midwest is built on Ohio payer projects
The Midwest held 16.0% of 2025 value and grows at 14.79% a year, below the national rate. Medical Mutual, which serves more than 1.2 million Ohioans, partnered with Cohere Health and Rhyme in June 2024 to automate requests end to end. Ohio joined the WISeR model in January 2026, and Ohio had 2.72 million Medicaid managed care enrollees in 2024. Indiana and Iowa also passed 2025 laws with shorter decision deadlines, adding demand for rules engines.
Pacific growth is slowed by integrated systems
The Pacific region held 13.0% of 2025 value and grows at 14.49% a year, the slowest rate among the six zones. Kaiser Foundation Health Plan recorded the lowest Medicare Advantage request rate in 2024, at 0.6 per enrollee, according to KFF, which limits external review demand. California still had 14.3 million Medicaid managed care enrollees in 2024, and SB 1120 requires physician decisions on medical necessity denials. Washington is one of the WISeR states from January 2026.
The Mountain region grows fastest from a small base
The Mountain region held 5.0% of 2025 value and grows at 15.69% a year, the fastest pace among the six zones. Arizona is a WISeR state, so traditional Medicare requests for selected services began there in January 2026. Arizona had 1.84 million Medicaid managed care enrollees in 2024, according to KFF. Colorado and Wyoming had gold carding laws before 2025, and Montana HB 398 made approvals valid for 12 months for chronic conditions.
Funding, acquisitions and pilots mark 2025 and 2026
| Development | Status and market relevance |
|---|---|
| In May 2025, Cohere Health raised $90 million in a Series C round led by Temasek to scale AI-powered services for health plans. | Funded; expands payer review capacity |
| In July 2025, Waystar agreed to acquire Iodine Software for $1.25 billion to add clinical AI to prior authorization tools. | Announced; expected to close by year-end 2025 |
| In October 2025, Rhyme announced an integration with Microsoft Dragon Copilot for touchless prior authorization at the point of care. | Launched; targets health system workflows |
| In January 2026, Abridge partnered with Availity to embed FHIR-native payer APIs in ambient AI during patient visits. | Announced; aims for real-time approvals |
| In January 2026, CMS launched the WISeR model for technology-assisted prior authorization in traditional Medicare in six states. | In effect; services from Jan. 15, 2026 |
FHIR APIs, ambient AI and rules engines change review
- FHIR Prior Authorization APIs must be live at impacted payers by Jan. 1, 2027, under CMS-0057-F, carrying requests and decisions between plans and provider systems.
- Ambient AI capture records the visit and fills request data in real time, as Abridge plans with Highmark Health and Availity.
- Rules engines with machine learning recommend routine approvals in seconds, as Availity reported under 20 seconds on average at one Blue plan.
- AI voice agents call payers to check status and follow up on appeals, as Infinitus did for 1.17 million patients in 2025.
Need a Custom Version of This Report?
Tailor the scope, geography, or segments to your exact requirements.
- Custom geography or segment scope
- Direct access to our analyst team
Vendors compete on network reach and touchless rates
Competition in prior authorization automation software centers on network reach, touchless approval rates and readiness for the 2027 federal API deadline. Availity uses its network of more than 95% of health plans and 3.4 million providers to sell payer-side Intelligent Utilization Management, and it added an Abridge partnership in January 2026. Cohere Health sells clinical review and automation to health plans, processing more than 5.6 million requests a year, and raised $90 million in May 2025. Rhyme serves the provider side with touchless requests for more than 300 payers and many large hospital systems. Waystar packages prior authorization inside its revenue cycle platform and agreed to buy Iodine Software in July 2025. Infinitus supplies AI voice agents for benefit checks and status calls. Plans increasingly pair a payer vendor with a provider vendor, and buyers compare revenue cycle management suites with point solutions.
How do the leading vendors position their offers?
| Company | Type | Role in the market |
|---|---|---|
| Cohere Health | Payer clinical review platform | Processes more than 5.6 million requests a year; $90 million Series C in May 2025 |
| Availity | Payer-provider network | Intelligent Utilization Management with 76% near real-time approval recommendations at one Blue plan |
| Rhyme | Provider-side automation | Touchless requests across more than 300 payers; Microsoft Dragon Copilot integration in October 2025 |
| Waystar | Revenue cycle platform | Prior authorization tools and AltitudeAI; agreed to acquire Iodine Software in July 2025 |
| Infinitus | AI voice agents | Automated calls for 1.17 million patients and 20% of U.S. providers in 2025 |
The 2027 API deadline decides vendor selection
Credence Research's view is that the Jan. 1, 2027, Prior Authorization API deadline will decide prior authorization automation software selection over the next 18 months. Payers that buy prior authorization automation software late face compressed projects, since Availity reported a 10-month rollout against an industry norm of 12 to 18 months. Provider-side tools grow faster, as point-of-care approvals with ambient AI reduce the staff time measured by the AMA. Vendors that show high auto-approval rates and human review for denials will win, because KFF data on appeal overturns keep denials under public scrutiny.
How prior authorization tool spending was modeled
The report uses 2025 as the base year and 2035 as the forecast year, with market values taken from the Credence Research model. Side, function, deployment and regional splits are Credence Research estimates informed by public data and are not reported statistics. Sources include CMS rules and fact sheets, KFF analyses of Medicare Advantage and Medicaid data, the AMA physician survey, CAQH Index coverage, state legislative summaries and company press releases and trade press. No interviews or surveys were conducted for this edition, so segment shares should be read as modeled ranges.
Real-time electronic approvals drive growth to 2035
From USD 820.0 million in 2026, the market is expected to reach USD 2.88 billion by 2035 as payers meet federal API duties and providers automate request intake. The Jan. 1, 2027, deadline and the insurer pledge for real-time answers set the near-term pace. Electronic requests grow fastest, and provider-side tools gain share as ambient AI moves approvals into the visit. The Mountain region grows fastest from a 5.0% share of 2025 value. U.S. prior authorization automation software spending therefore depends on payer API readiness, clear AI rules and proof that automation speeds care without raising denials.
Frequently Asked Questions
How big is the U.S. prior authorization automation software market?
What does the CMS prior authorization rule require?
Which side of the market holds the largest share?
Which region leads and which grows fastest?
How many prior authorizations do Medicare Advantage plans handle?
How much time do physicians spend on prior authorization?
What did health insurers pledge in June 2025?
Who are the leading companies?
Table of Content
Chapter 1 Market Segmentation
- 1.1 Segmentation Framework
- 1.1.1 Product and Service Classification
- 1.1.2 Application and End-Use Classification
- 1.1.3 Technology and Solution Classification
- 1.1.4 Customer and Distribution Channel Classification
- 1.1.5 Geographic Segmentation
- 1.1.6 Market Segment Definitions and Boundaries
- 1.2 By Side
- 1.2.1 Payer
- 1.2.2 Provider
- 1.2.3 Pharmacy Benefit
- 1.3 By Function
- 1.3.1 Clinical Review
- 1.3.2 Intake
- 1.3.3 E-PA
- 1.4 By Deployment
- 1.4.1 SaaS
- 1.4.2 BPO+AI
Chapter 2 Introduction
- 2.1 Report Objectives and Scope
- 2.2 Product Definition and Industry Terminology
- 2.3 Market Inclusions and Exclusions
- 2.4 Research Process
- 2.4.1 Primary Research and Expert Interviews
- 2.4.2 Secondary Research and Source Review
- 2.4.3 Top-Down and Bottom-Up Estimation
- 2.4.4 Data Triangulation and Verification
- 2.5 Market Size Measurement Basis
- 2.5.1 2025: USD 700.0 million → 2035: USD 2.88 billion
- 2.6 Historical and Forecast Reference Periods
- 2.6.1 Historical Period: 2018-2025
- 2.6.2 Base Year: 2025
- 2.6.3 Forecast Period: 2025-2035
- 2.7 Research Assumptions and Limitations
Chapter 3 Executive Summary
- 3.1 Market Snapshot and Key Findings
- 3.2 Base-Year Market Size, 2025
- 3.3 Forecast Market Size, 2035
- 3.4 Revenue and Volume Growth Outlook
- 3.5 Key Demand and Supply Indicators
- 3.6 Leading Market Segments
- 3.7 Fastest-Growing Market Opportunities
- 3.8 Regional Performance Highlights
- 3.9 Technology and Industry Transformation
- 3.10 Competitive Landscape Summary
- 3.11 Analyst View and Strategic Implications
Chapter 4 U.S. Prior Authorization Automation Software Market Trends and Developments
- 4.1 Historical Industry Development, 2018-2025
- 4.2 Recent Market Trends and Developments
- 4.3 Demand and Customer Behavior Trends
- 4.4 Technology and Product Innovation
- 4.5 Artificial Intelligence, Automation and Digitalization
- 4.6 Local Manufacturing and Supply Chain Realignment
- 4.7 Industry Partnerships, Mergers and Acquisitions
- 4.8 Sustainability and Circular Economy Developments
- 4.9 Government and Private Sector Investment Trends
- 4.10 Emerging Business Models and Commercialization
- 4.11 Industry Developments and Announcements
Chapter 5 U.S. Prior Authorization Automation Software Market Supply and Demand Analysis
- 5.1 Demand Trend and Consumption Analysis, 2018-2025
- 5.2 Demand Forecast, 2025-2035
- 5.3 Supply Chain Structure and Procurement Trends
- 5.4 Supply-Demand Gap and Bottlenecks
- 5.5 Import Dependence and Sourcing Structure
- 5.6 Regional Supply and Demand Concentration
Chapter 6 U.S. Prior Authorization Automation Software Market Pricing Analysis
- 6.1 Pricing Structure and Measurement
- 6.2 Historical Pricing Trends, 2018-2025
- 6.3 Pricing Outlook, 2025-2035
- 6.4 Pricing by Product and Market Segment
- 6.5 Geographic Pricing Differences
- 6.6 Key Input, Energy, Labor and Logistics Costs
- 6.7 Contract Pricing and Purchasing Models
- 6.8 Pricing Sensitivity and Competitive Positioning
- 6.9 Price, Margin and Profitability Implications
Chapter 7 U.S. Prior Authorization Automation Software Market Dynamics
- 7.1 Market Growth Drivers
- 7.1.1 Demand-Side Drivers
- 7.1.2 Technology and Innovation Drivers
- 7.1.3 Infrastructure and Investment Drivers
- 7.1.4 Regulatory and Policy Drivers
- 7.2 Market Restraints
- 7.2.1 Cost and Affordability Constraints
- 7.2.2 Technology and Adoption Barriers
- 7.2.3 Supply Chain and Operational Constraints
- 7.3 Market Challenges
- 7.3.1 Competitive Pressure and Margin Erosion
- 7.3.2 Skills, Infrastructure and Implementation Gaps
- 7.4 Emerging Market Opportunities
- 7.5 Market Dynamics Impact and Time-Horizon Assessment
Chapter 8 U.S. Prior Authorization Automation Software Value Chain Analysis
- 8.1 Industry Value Chain Overview
- 8.2 Upstream Suppliers and Critical Inputs
- 8.3 Technology and Component Providers
- 8.4 Manufacturing or Service Delivery
- 8.5 Distribution, Channel Partners and Integrators
- 8.6 Downstream Applications and End Users
- 8.7 Value Addition and Profit Pools
- 8.8 Vertical Integration and Outsourcing
- 8.9 Supplier Concentration and Risk
- 8.10 Supply Chain Localization and Resilience
Chapter 9 U.S. Prior Authorization Automation Software Market Regulations and Policies
- 9.1 Relevant Laws, Standards and Compliance Frameworks
- 9.2 Product, Service, Safety and Quality Requirements
- 9.3 Government Policies, Incentives and Subsidies
- 9.4 Imports, Exports and Trade Barriers
- 9.5 Public Procurement and Local Content Requirements
- 9.6 Data Protection, AI and Cybersecurity Compliance
- 9.7 Upcoming Policy Changes and Market Implications
Chapter 10 U.S. Prior Authorization Automation Software Market Hotspots and Opportunities
- 10.1 Market Opportunity Mapping and Growth Hotspots
- 10.2 High-Growth Applications and Customer Groups
- 10.3 Underserved Markets and White-Space Opportunities
- 10.4 Emerging Technology and Product Opportunities
- 10.5 New Capacity and Investment Hotspots
- 10.6 Market Entry and Expansion Opportunities
- 10.7 Distribution and Partnership Opportunities
- 10.8 Near-Term and Long-Term Commercial Potential
- 10.9 Opportunity Attractiveness and Execution Risks
Chapter 11 U.S. Prior Authorization Automation Software Market Outlook, 2025-2035
- 11.1 Market Size and Analysis
- 11.1.1 Revenue (Market Measurement: 2025: USD 700.0 million → 2035: USD 2.88 billion)
- 11.1.2 Historical Market Size, 2018-2025
- 11.1.3 Base-Year Market Size, 2025
- 11.2 Market Forecast, 2025-2035
- 11.2.1 Revenue Forecast to 2035
- 11.2.2 CAGR and Year-on-Year Growth
- 11.2.3 Incremental Revenue Opportunity
- 11.3 Forecast Assumptions and Scenario Analysis
- 11.3.1 Base-Case Forecast
- 11.3.2 Optimistic and Conservative Scenarios
- 11.3.3 Technology, Pricing and Policy Sensitivities
- 11.4 Market Attractiveness and Growth Outlook
Chapter 12 U.S. Prior Authorization Automation Software Market Segmentation and Outlook
- 12.1 Segmentation Summary and Market Shares, 2025
- 12.2 Largest and Fastest-Growing Segments
- 12.3 By Side - Market Size and Forecast, 2025-2035
- 12.3.1 Segment Definition and Scope
- 12.3.2 Historical Market Size, 2018-2025
- 12.3.3 Revenue Forecast, 2025-2035
- 12.3.4 Base-Year Market Share, 2025
- 12.3.5 Segment CAGR and Growth Drivers
- 12.3.6 Subsegment Market Size and Forecast
- 12.3.6.1 Payer
- 12.3.6.2 Provider
- 12.3.6.3 Pharmacy Benefit
- 12.3.7 Subsegment Pricing and Adoption Trends
- 12.3.8 Leading Suppliers and Competition
- 12.3.9 Regional Demand and Opportunities
- 12.4 By Function - Market Size and Forecast, 2025-2035
- 12.4.1 Segment Definition and Scope
- 12.4.2 Historical Market Size, 2018-2025
- 12.4.3 Revenue Forecast, 2025-2035
- 12.4.4 Base-Year Market Share, 2025
- 12.4.5 Segment CAGR and Growth Drivers
- 12.4.6 Subsegment Market Size and Forecast
- 12.4.6.1 Clinical Review
- 12.4.6.2 Intake
- 12.4.6.3 E-PA
- 12.4.7 Subsegment Pricing and Adoption Trends
- 12.4.8 Leading Suppliers and Competition
- 12.4.9 Regional Demand and Opportunities
- 12.5 By Deployment - Market Size and Forecast, 2025-2035
- 12.5.1 Segment Definition and Scope
- 12.5.2 Historical Market Size, 2018-2025
- 12.5.3 Revenue Forecast, 2025-2035
- 12.5.4 Base-Year Market Share, 2025
- 12.5.5 Segment CAGR and Growth Drivers
- 12.5.6 Subsegment Market Size and Forecast
- 12.5.6.1 SaaS
- 12.5.6.2 BPO+AI
- 12.5.7 Subsegment Pricing and Adoption Trends
- 12.5.8 Leading Suppliers and Competition
- 12.5.9 Regional Demand and Opportunities
- 12.6 Segment Growth Comparison
- 12.7 Segment Attractiveness and Priority Matrix
Chapter 13 U.S. Prior Authorization Automation Software Geographic Market Outlook, 2025-2035
- 13.1 Domestic Market Distribution and Demand Clusters
- 13.2 State- or Province-Wise Market Size and Forecast, 2025-2035
- 13.3 City and Metropolitan Market Outlook
- 13.4 Industrial, Manufacturing and Commercial Clusters
- 13.5 Geographic Concentration of Key End Users
- 13.6 Local Pricing and Purchasing Differences
- 13.7 Domestic Production Facilities and Capacity Map
- 13.8 Local Infrastructure and Project Pipeline
- 13.9 State-Level Policy and Incentive Differences
- 13.10 Subnational Investment Hotspots and Opportunities
- 13.11 Distribution and Logistics Networks
- 13.12 Domestic Competitive Footprint
Chapter 14 U.S. Prior Authorization Automation Software Technology, Innovation and Sustainability Outlook
- 14.1 Technology Landscape and Maturity
- 14.2 Product, Process and Service Innovation
- 14.3 AI, Automation and Digital Tools in the Industry
- 14.4 Technology Adoption and Performance Benchmarking
- 14.5 Innovation Pipeline and R&D Investment
- 14.6 Patent and Intellectual Property Trends
- 14.7 Energy Efficiency and Resource Management
- 14.8 Sustainability, Recycling and Circularity
- 14.9 Technology Roadmap, 2025-2035
- 14.10 Risks of Obsolescence and Technology Substitution
Chapter 15 U.S. Prior Authorization Automation Software Market Key Strategic Imperatives
- 15.1 Growth and Market Entry Priorities
- 15.2 High-Return Products and Segments
- 15.3 Pricing, Profitability and Cost Optimization
- 15.4 Technology Investment and Product Differentiation
- 15.5 Supply Chain Localization and Resilience
- 15.6 Distribution and Customer Acquisition
- 15.7 Partnership, Acquisition and Capacity Strategy
- 15.8 Regional Expansion Priorities
- 15.9 Short-, Medium- and Long-Term Actions
Chapter 16 Competition Outlook
- 16.1 Industry Competition Characteristics
- 16.2 Market Structure and Concentration
- 16.3 Market Share and Competitive Positioning, 2025
- 16.4 Company-Wise Revenue and Product Benchmarking
- 16.5 Production and Service Capacity Benchmarking
- 16.6 Technology, Pricing and Differentiation
- 16.7 Regional Footprint and Distribution Strength
- 16.8 Mergers, Acquisitions and Strategic Alliances
- 16.9 New Entrants and Competitive Threats
- 16.10 Porter's Five Forces and Industry Attractiveness
- 16.11 Competitive Outlook, 2025-2035
Chapter 17 Company Profiles
- 17.1 Company Coverage and Selection Criteria
- 17.2 Cohere Health
- 17.2.1 Business Description
- 17.2.2 Company Ownership and Geographic Presence
- 17.2.3 Product and Service Portfolio
- 17.2.4 Manufacturing and Operating Footprint
- 17.2.5 Financial Performance and Investment
- 17.2.6 Market Share and Competitive Position
- 17.2.7 Technology and Innovation Capabilities
- 17.2.8 Strategic Alliances or Partnerships
- 17.2.9 Recent Developments
- 17.2.10 Growth Strategy and Outlook
- 17.3 Availity
- 17.4 Rhyme
- 17.5 Waystar
- 17.6 Infinitus
- 17.7 Other Relevant Market Participants
Note: Every listed company is profiled on the structure shown under the first company. The company list is preliminary and may change based on research findings, market developments, data availability and client requirements.
Chapter 18 Disclaimer
- 18.1 Research and Forecast Disclaimer
- 18.2 Data Source and Estimation Limitations
Note: The depth of individual sections depends on data availability for this market. Volume, capacity, trade and other unit-based metrics are included where applicable.

