
Hybrid work and energy rules put real estate data to work
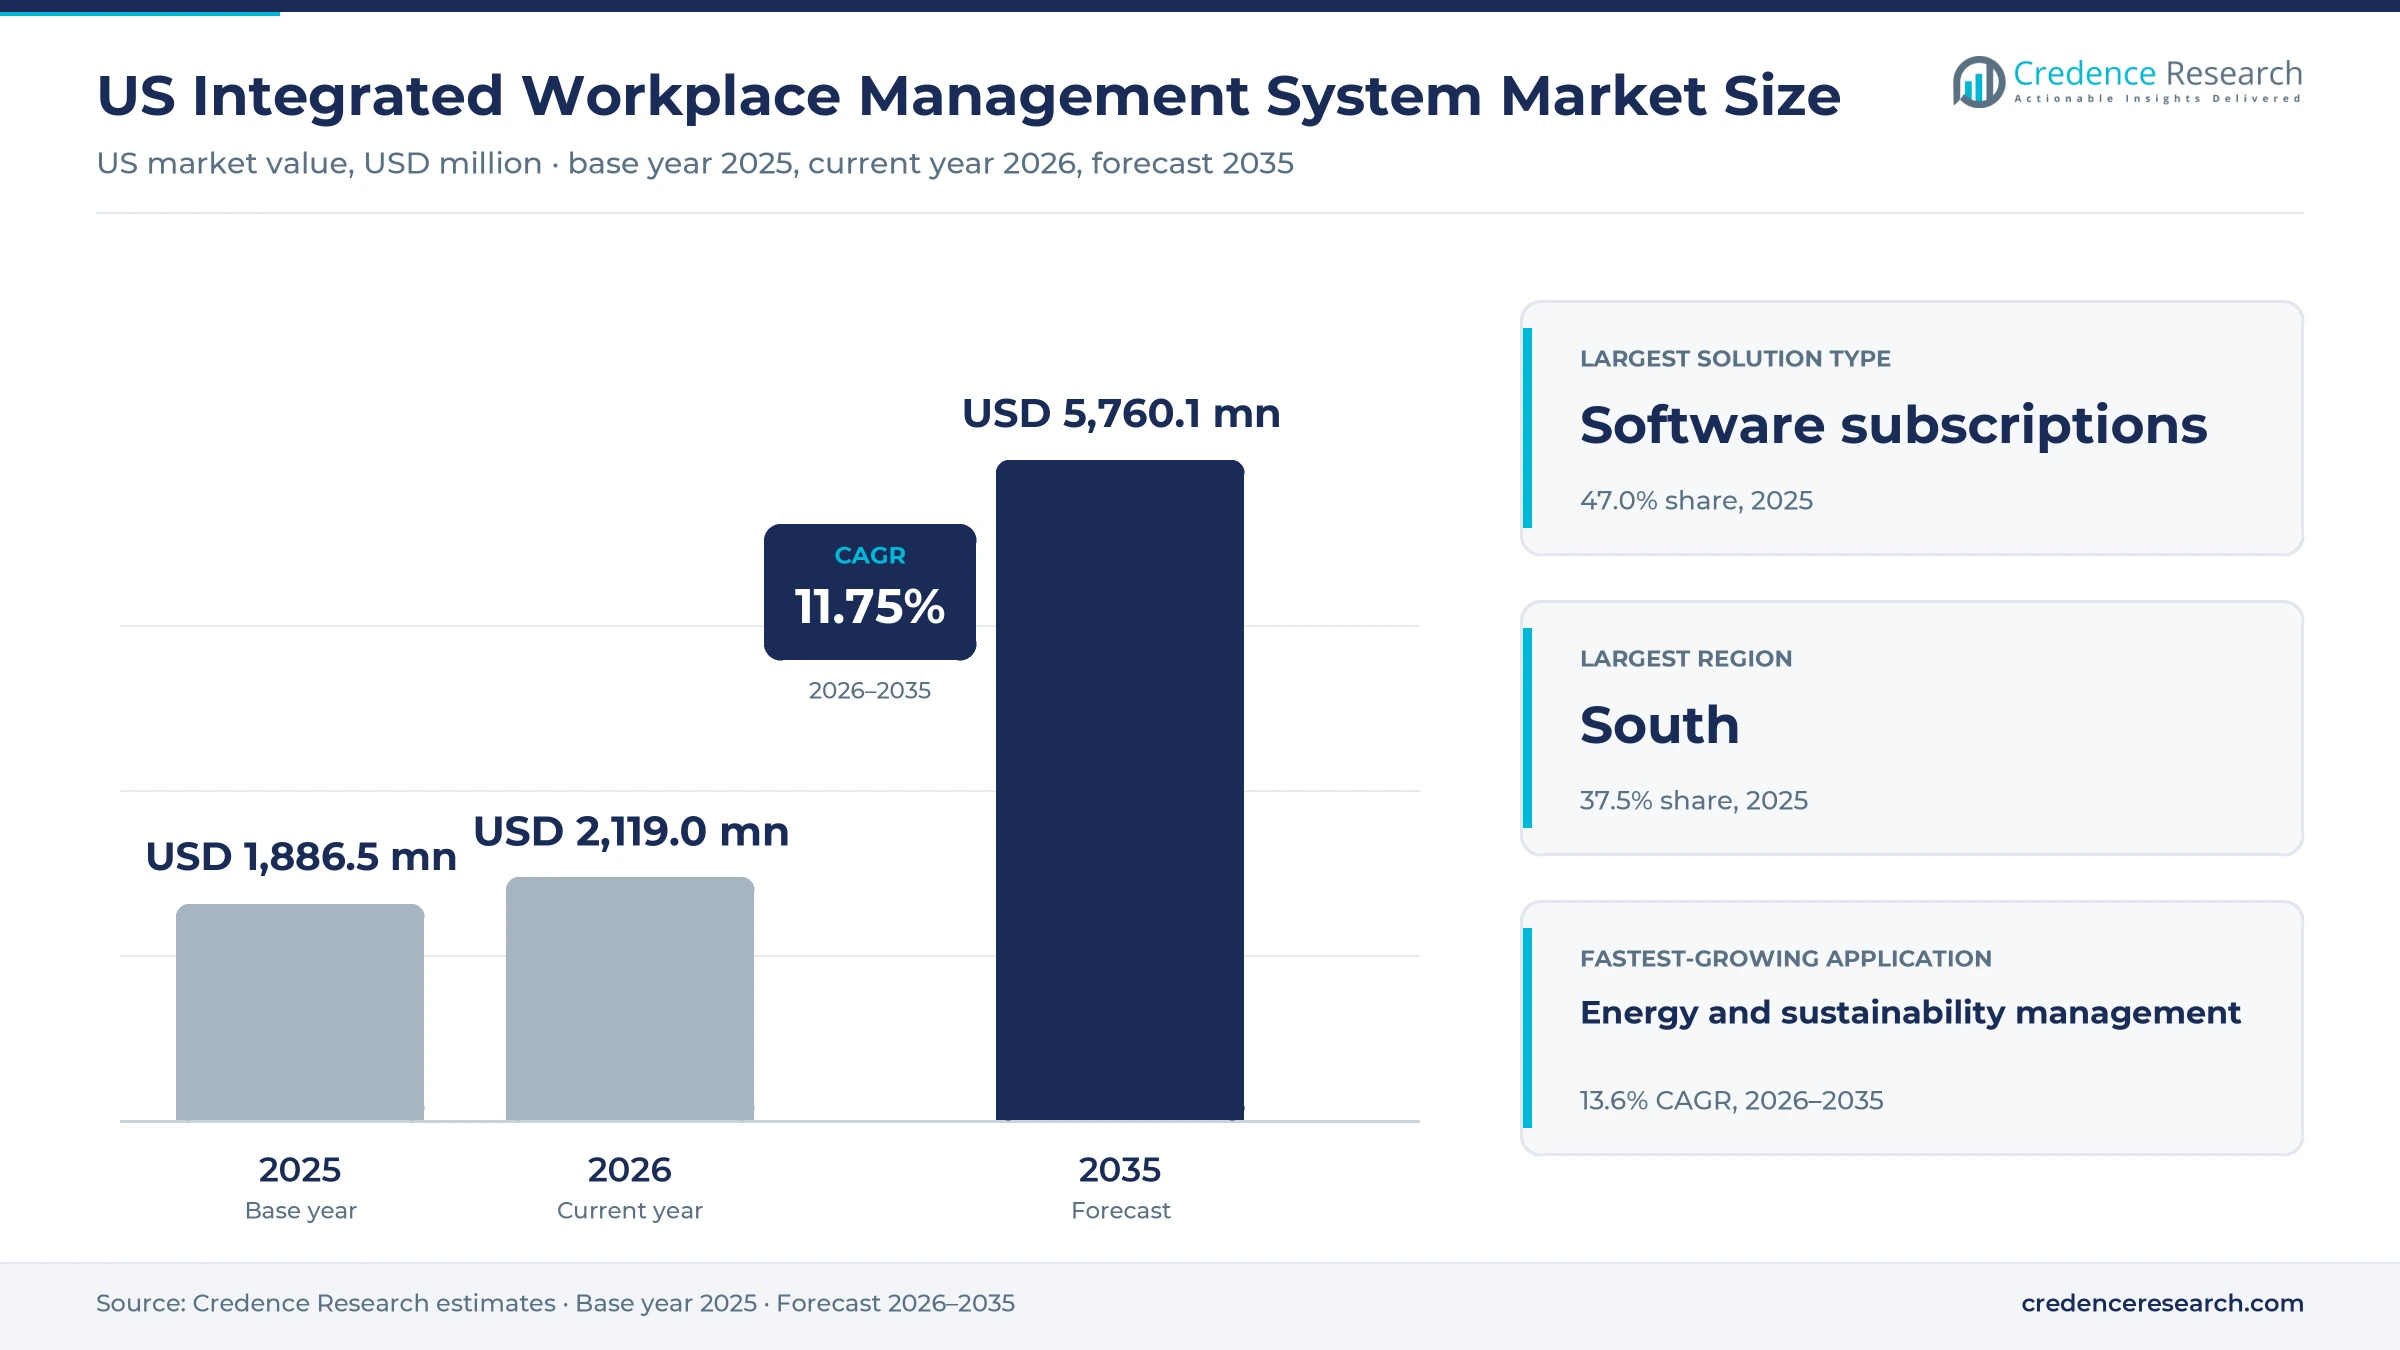
The U.S. integrated workplace management system market was valued at USD 1.89 billion in 2025 and is projected to increase from USD 2.12 billion in 2026 to USD 5.76 billion by 2035, registering a CAGR of 11.75% during 2026–2035. Demand comes from corporate real estate, facilities and finance teams that need one record of where people sit, what each lease costs, which assets need work and how much energy each building uses. Hybrid schedules have left many offices busy on some weekdays and quiet on others, so occupiers are consolidating floors and renegotiating leases with occupancy evidence in hand. The South held 37.5% of 2025 value, the largest share of any region, because it holds the most commercial floorspace and draws many corporate relocations. The same region is also the fastest-growing at 12.1% a year. On the commercial side, legacy on-premises suites are giving way to cloud subscriptions, and city and state building performance standards are turning energy data from a voluntary report into a compliance file.
One property record now spans space, leases, assets and energy
The estimate measures what U.S. organizations spend on integrated workplace management software and the services needed to run it, including cloud subscriptions, perpetual licenses with annual maintenance, implementation, data migration and managed administration. It covers space and workplace optimization, lease and portfolio administration, maintenance and capital planning, and energy and sustainability management sold as connected modules or suites.
The estimate excludes stand-alone building automation hardware, sensors sold without software, outsourced facility services such as cleaning or security, and brokerage fees. The value chain runs from software publishers and their cloud hosts through implementation partners and integrators to corporate real estate, facilities and finance teams.
US Integrated Workplace Management System Market Insights
- The U.S. integrated workplace management system market was valued at USD 1.89 billion in 2025 and is projected to reach USD 5.76 billion by 2035, registering a CAGR of 11.75% during 2026–2035.
- The South held 37.5% of 2025 value, because it held about 36% of U.S. commercial floorspace in the EIA's 2018 survey.
- Software subscriptions led with 47.0% of 2025 value, as publishers moved new sales to cloud plans that bundle hosting, upgrades and support.
- IBM ended new orders for TRIRIGA on Jan. 28, 2026, and named Maximo Real Estate and Facilities as the upgrade path, opening a large migration cycle.
- Trane Technologies, Johnson Controls and Fortive own leading suites, and Schneider Electric agreed to take control of Planon, linking workplace software to building equipment and controls.
Subscriptions lead while energy tracking grows fastest
Cloud subscriptions carry most spending as TRIRIGA sales end
Based on solution type, the market is categorized into software subscriptions, perpetual licenses and maintenance, and implementation and managed services. Software subscriptions led with 47.0% of 2025 value, because publishers now sell new seats mainly as cloud plans that bundle hosting, upgrades and support. Implementation and managed services grow fastest at 12.5% a year, as IBM ended new TRIRIGA software orders on Jan. 28, 2026, and named Maximo Real Estate and Facilities as the upgrade path. Each migration needs data mapping, testing and retraining, so integrators stay busy well beyond the license sale.
Empty floors lead spending while energy filings grow fastest
Based on application, the market is categorized into space and workplace optimization, lease and portfolio administration, maintenance and capital planning, and energy and sustainability management. Space and workplace optimization led with 34.0% of 2025 value, because occupiers pay most for evidence on unused floors, and the Government Accountability Office found that 17 of 24 agency headquarters used 25% or less of their capacity on average. Energy and sustainability management grows fastest at 13.6% a year, as about 95% of the roughly 20,000 properties covered by New York City Local Law 97 filed compliance reports by September 2026, according to the city. Mandatory filings move energy data into the same record as space data.
Office portfolios lead while hospitals add asset tracking
Based on end-use industry, the market is categorized into corporate offices and financial services, healthcare and life sciences, education and public administration, and retail and distributed operating estates. Corporate offices and financial services led with 44.0% of 2025 value, because large office portfolios buy first, and offices consume more energy than any other commercial building type, according to the EIA. Healthcare and life sciences grow fastest at 12.7% a year, as the American Hospital Association counts 6,100 hospitals with 907,216 staffed beds. Hospitals must document asset inspections and space use for accreditation, which favors suites that join maintenance and floor plan data.
| Segment Group | Leading Sub-segment | Share, 2025 | Fastest-growing Sub-segment | CAGR, 2026–2035 |
|---|---|---|---|---|
| By Solution Type | Software subscriptions | 47.0% | Implementation and managed services | 12.5% |
| By Application | Space and workplace optimization | 34.0% | Energy and sustainability management | 13.6% |
| By End-Use Industry | Corporate offices and financial services | 44.0% | Healthcare and life sciences | 12.7% |
Per-user plans start near USD 20 as suites use contracts
Pricing in the U.S. integrated workplace management system market follows three models. Point tools for maintenance and booking charge per named user or per bookable desk each month, which keeps entry costs low. Full suites for large portfolios are priced by floor area, asset count or an enterprise agreement that bundles modules, hosting and support. Implementation often matches or exceeds first-year subscription fees because floor plans, leases and asset registers must be cleaned and loaded. Migration deadlines and compliance modules move prices most, since buyers pay a premium for verified data before penalties apply.
| Offer or model | Typical price or fee | Basis |
|---|---|---|
| MaintainX Essential plan | USD 20 per user a month, billed annually | MaintainX pricing page, November 2026 |
| MaintainX Premium plan | USD 65 per user a month, billed annually | MaintainX pricing page, November 2026 |
| UpKeep Essential and Premium plans | USD 24 and USD 55 per user a month | UpKeep pricing page, November 2026 |
| Envoy Reservations | USD 5 per bookable resource a month, billed annually | Envoy pricing page, November 2026 |
| Enterprise suite for a large portfolio | About USD 0.05 to USD 0.08 per square foot a year including services | Credence Research estimate from list prices and typical contract scope |
Request a Free Sample
Fill in your details and we'll send you a free sample report.
- Sample data tables & charts
- Research methodology
Empty desks, building data and integration lift demand
Weekday attendance swings make desk planning weekly work
Hybrid schedules have made space the most visible cost that real estate teams can still cut, so occupiers need portfolio-wide booking and utilization data before they renew leases. According to the Bureau of Labor Statistics, 22.6% of U.S. workers teleworked or worked at home for pay in March 2026, a rate that held between 21.5% and 23.0% over the prior year. Kastle access data reported by Bisnow in February 2025 showed Tuesday attendance at 63.4% of prepandemic levels against 36.7% on Fridays. The federal return-to-office memorandum of Jan. 20, 2025, then ordered agencies back to duty stations full time. Space and workplace optimization holds 34.0% of 2025 value, because these swings make desk planning a weekly task.
Building energy data has become a compliance file
Energy and asset data have moved from facilities reports into finance and compliance reviews, which pulls building performance modules into the workplace suite. The Energy Information Administration counts about 5.9 million commercial buildings with 96.4 billion square feet. ENERGY STAR says more than 330,000 buildings, nearly 25% of U.S. commercial floorspace, tracked energy, water or waste in Portfolio Manager last year. More than 50 jurisdictions had some form of building performance policy by July 2023, according to ENERGY STAR. Suites that read meter data from building automation controls can file these reports without manual spreadsheets.
IT service desk links bring CIOs into workplace deals
Workplace software now has to connect with IT service desks, HR records and finance systems, which brings chief information officers into deals that facilities teams once ran alone. Eptura's Workplace Index puts the average at 17 tools for workplace and operational processes. Its April 2026 release added ServiceNow ticketing, Microsoft ecosystem links and data lake and ERP connectors. Nuvolo, acquired by Trane Technologies in November 2023, runs its suite of space records and maintenance software on the ServiceNow platform, according to Trane. Buyers favor suites that share one location hierarchy with the tools their employees already use. Implementation and managed services grow at 12.5% a year, the fastest solution type, as this integration work expands.
ASC 842 keeps lease records under audit
Lease accounting rules turned every office, store and equipment lease into a balance sheet item, so finance teams need lease records that reconcile with space and cost data. Cherry Bekaert notes that ASC 842 became effective for private companies for fiscal periods beginning after Dec. 15, 2021, which brought private occupiers under the same rule as listed companies. Lease modules that tie each lease to its floor plan let finance teams reconcile the balance sheet with occupancy data. Federal agencies spend about USD 2 billion a year to operate and maintain owned office buildings, according to the GAO. Occupiers with large property footprints use these records to time renewals and exits.
AI assistants and carbon reporting reshape buyer needs
Rise of AI assistants and live occupancy analytics
Suppliers are adding AI assistants that act on occupancy and maintenance data, which shifts the software from a record keeper to a planning tool. Eptura announced previews of assistants for workday planning, maintenance task assignment and portfolio scenario planning through Microsoft Copilot in April 2026, with rollout through July 2026. The same release added live analytics on desk and meeting room use. ServiceNow added agentic AI to Workplace Service Delivery in May 2025, so the system can block a closed space and move its bookings once a planner approves. Data from occupancy sensors feeds these assistants, and the Tuesday peak noted above shows why weekly forecasts matter.
Shift of carbon reporting into the workplace suite
Carbon disclosure is moving from a corporate sustainability report into building-by-building data, which favors suites that already hold floor area and meter records. California requires companies with more than USD 1 billion in revenue that do business in the state to report Scope 1 and Scope 2 emissions by Nov. 10, 2026, with Scope 3 from 2027. In Washington state, Tier 1 buildings over 220,000 square feet had to show compliance with the Clean Buildings Performance Standard by June 1, 2026. Boston and Washington, D.C., also reach first compliance years in 2025 and 2026, according to ENERGY STAR. Energy and sustainability modules gain the most as these deadlines arrive, because late or missing filings now carry fines.
Public-sector rightsizing opens space audit work
Federal, state and university portfolios hold large amounts of underused space, which creates demand for space audits, consolidation planning and disposal tracking. The GAO headquarters study noted above found that even the busiest agencies used only about 40% to 49% of their capacity in 2023. Eptura released Archibus for Government updates in November 2025, adding security and interface changes and new 2D and 3D building data APIs. Education and public administration buyers usually procure through multiyear contracts, which gives suppliers steady renewals once they win a portfolio. Vendors with government hosting and accessibility credentials stand to gain most.
Low entry prices open the midsize enterprise
Companies with fewer than 1,000 employees that lease a few floors of commercial real estate often run facilities on spreadsheets, and low per-user prices now let them buy single modules first. The per-user and per-desk list prices in the pricing table keep a first purchase within a department budget. Envoy also lists visitor management at USD 362 per location a month and lobby screens at USD 12 per device, so a small office can add modules one at a time. These entry prices for maintenance and booking tools give integrated suppliers a path to sell space, lease and energy modules later. Suppliers that package a light suite with fast setup can win buyers before point tools become entrenched.
Migrations, penalties and vendor churn test buyers
TRIRIGA end of support forces costly migrations
Platform end-of-life dates force buyers into migrations on the vendor timetable rather than their own. IBM says TRIRIGA support completes on Sept. 30, 2027, and customers moving to Maximo must finish the cutover by April 2029 to keep dual support. Large owners with custom workflows face data mapping, retesting and retraining costs. Some will reopen the vendor choice instead, which lengthens sales cycles. Phased moves that start with lease and space data lower the risk.
Fines for bad filings expose weak meter records
Building performance standards attach fines to bad or late data, which raises the cost of incomplete asset and meter records. Washington state can assess up to USD 5,000 plus USD 1.50 per square foot of gross floor area on owners without an approved compliance or exemption filing. Owners with mixed portfolios often lack submeters and current floor area records. Suites that validate data before filing reduce exposure, but cleanup work delays the first reporting cycle.
Weekday swings make average occupancy misleading
Attendance that swings by weekday makes it hard to set the right amount of space, even with good booking data. The Friday trough noted earlier sits far below midweek peaks, so averages hide the real demand. With 22.6% of U.S. workers teleworking in March 2026, that weekday gap in office demand is unlikely to close soon. Teams that plan on weekly averages risk crowded Tuesdays or idle floors. Combining badge, booking and sensor feeds gives more reliable peak estimates, though each source adds integration and privacy work.
Equipment makers' ownership of suites raises lock-in fears
Leading suites have changed owners in quick succession, and buyers now question product roadmaps and support. Johnson Controls acquired FM:Systems in July 2023, Trane Technologies completed its purchase of Nuvolo in November 2023, and Schneider Electric signed an agreement on July 30, 2024, to raise its Planon stake to 80%. Buyers worry that new owners will favor their own building equipment. Contract terms on data export and open APIs reduce that lock-in risk.
The South leads on floorspace as the West tightens rules
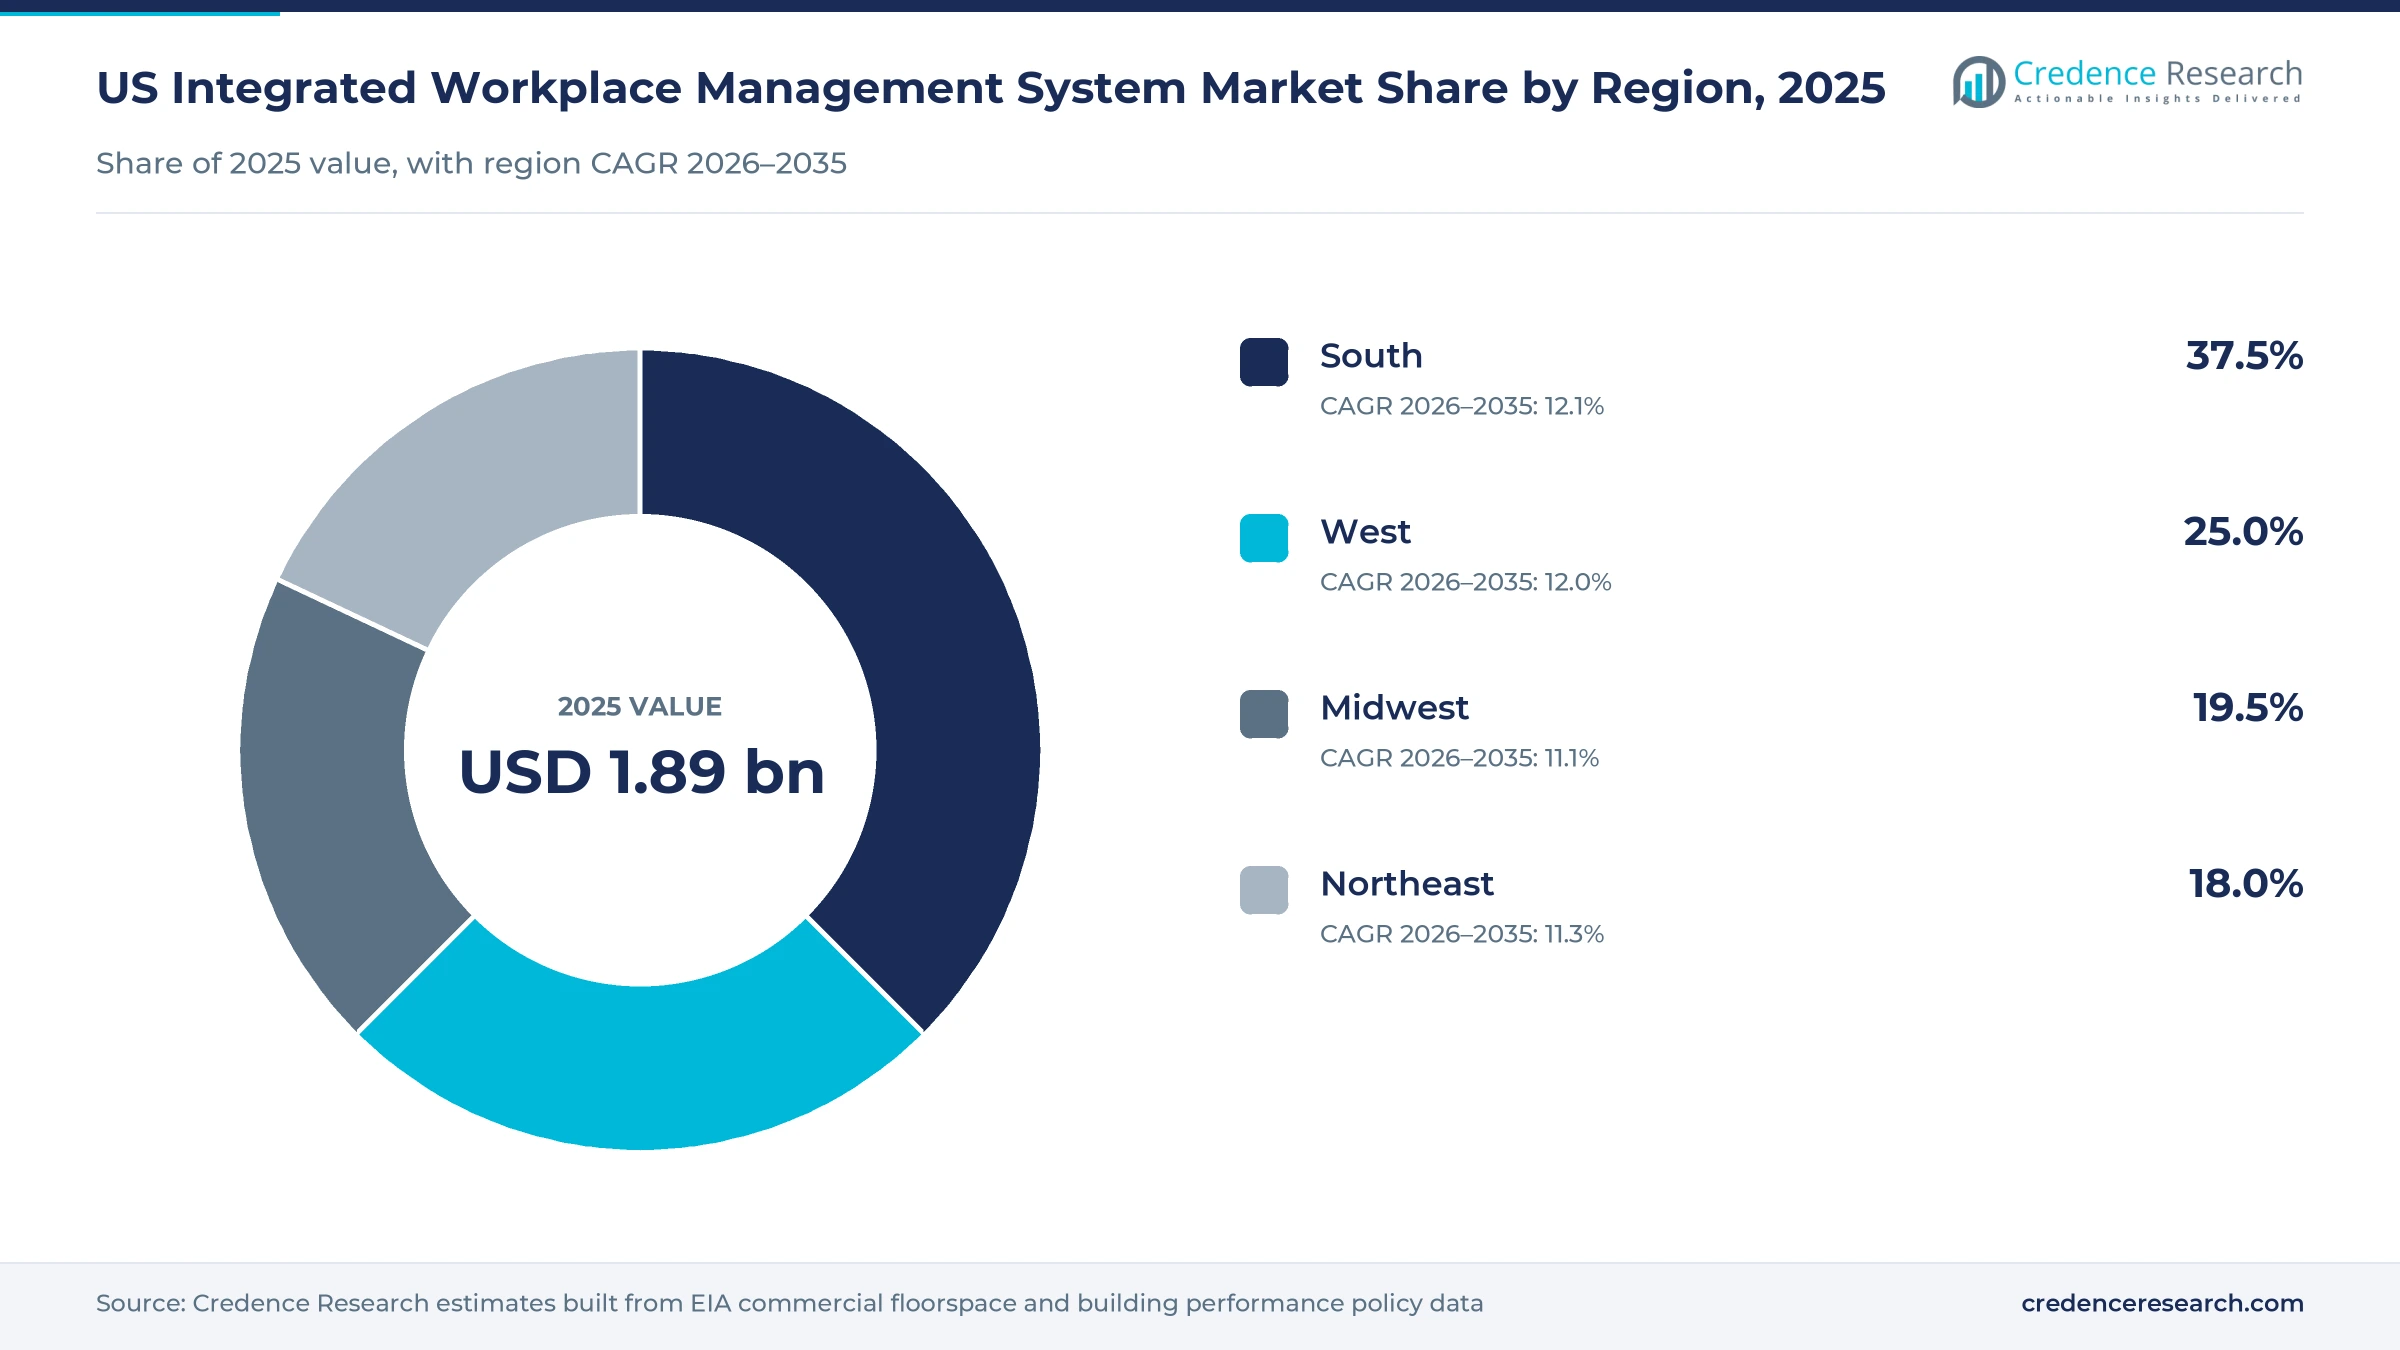
The U.S. integrated workplace management system market is split into the four Census regions, which follow commercial floorspace, corporate headquarters and the reach of building performance rules. Regional shares and growth rates are Credence Research estimates built from EIA floorspace counts, headquarters locations and state and city building policies. The South and West together held more than three-fifths of 2025 value.
| Region | Value, 2025 (USD billion) | Share, 2025 | CAGR, 2026–2035 |
|---|---|---|---|
| South | 0.71 | 37.5% | 12.1% |
| West | 0.47 | 25.0% | 12.0% |
| Midwest | 0.37 | 19.5% | 11.1% |
| Northeast | 0.34 | 18.0% | 11.3% |
The South leads on floorspace and large campuses
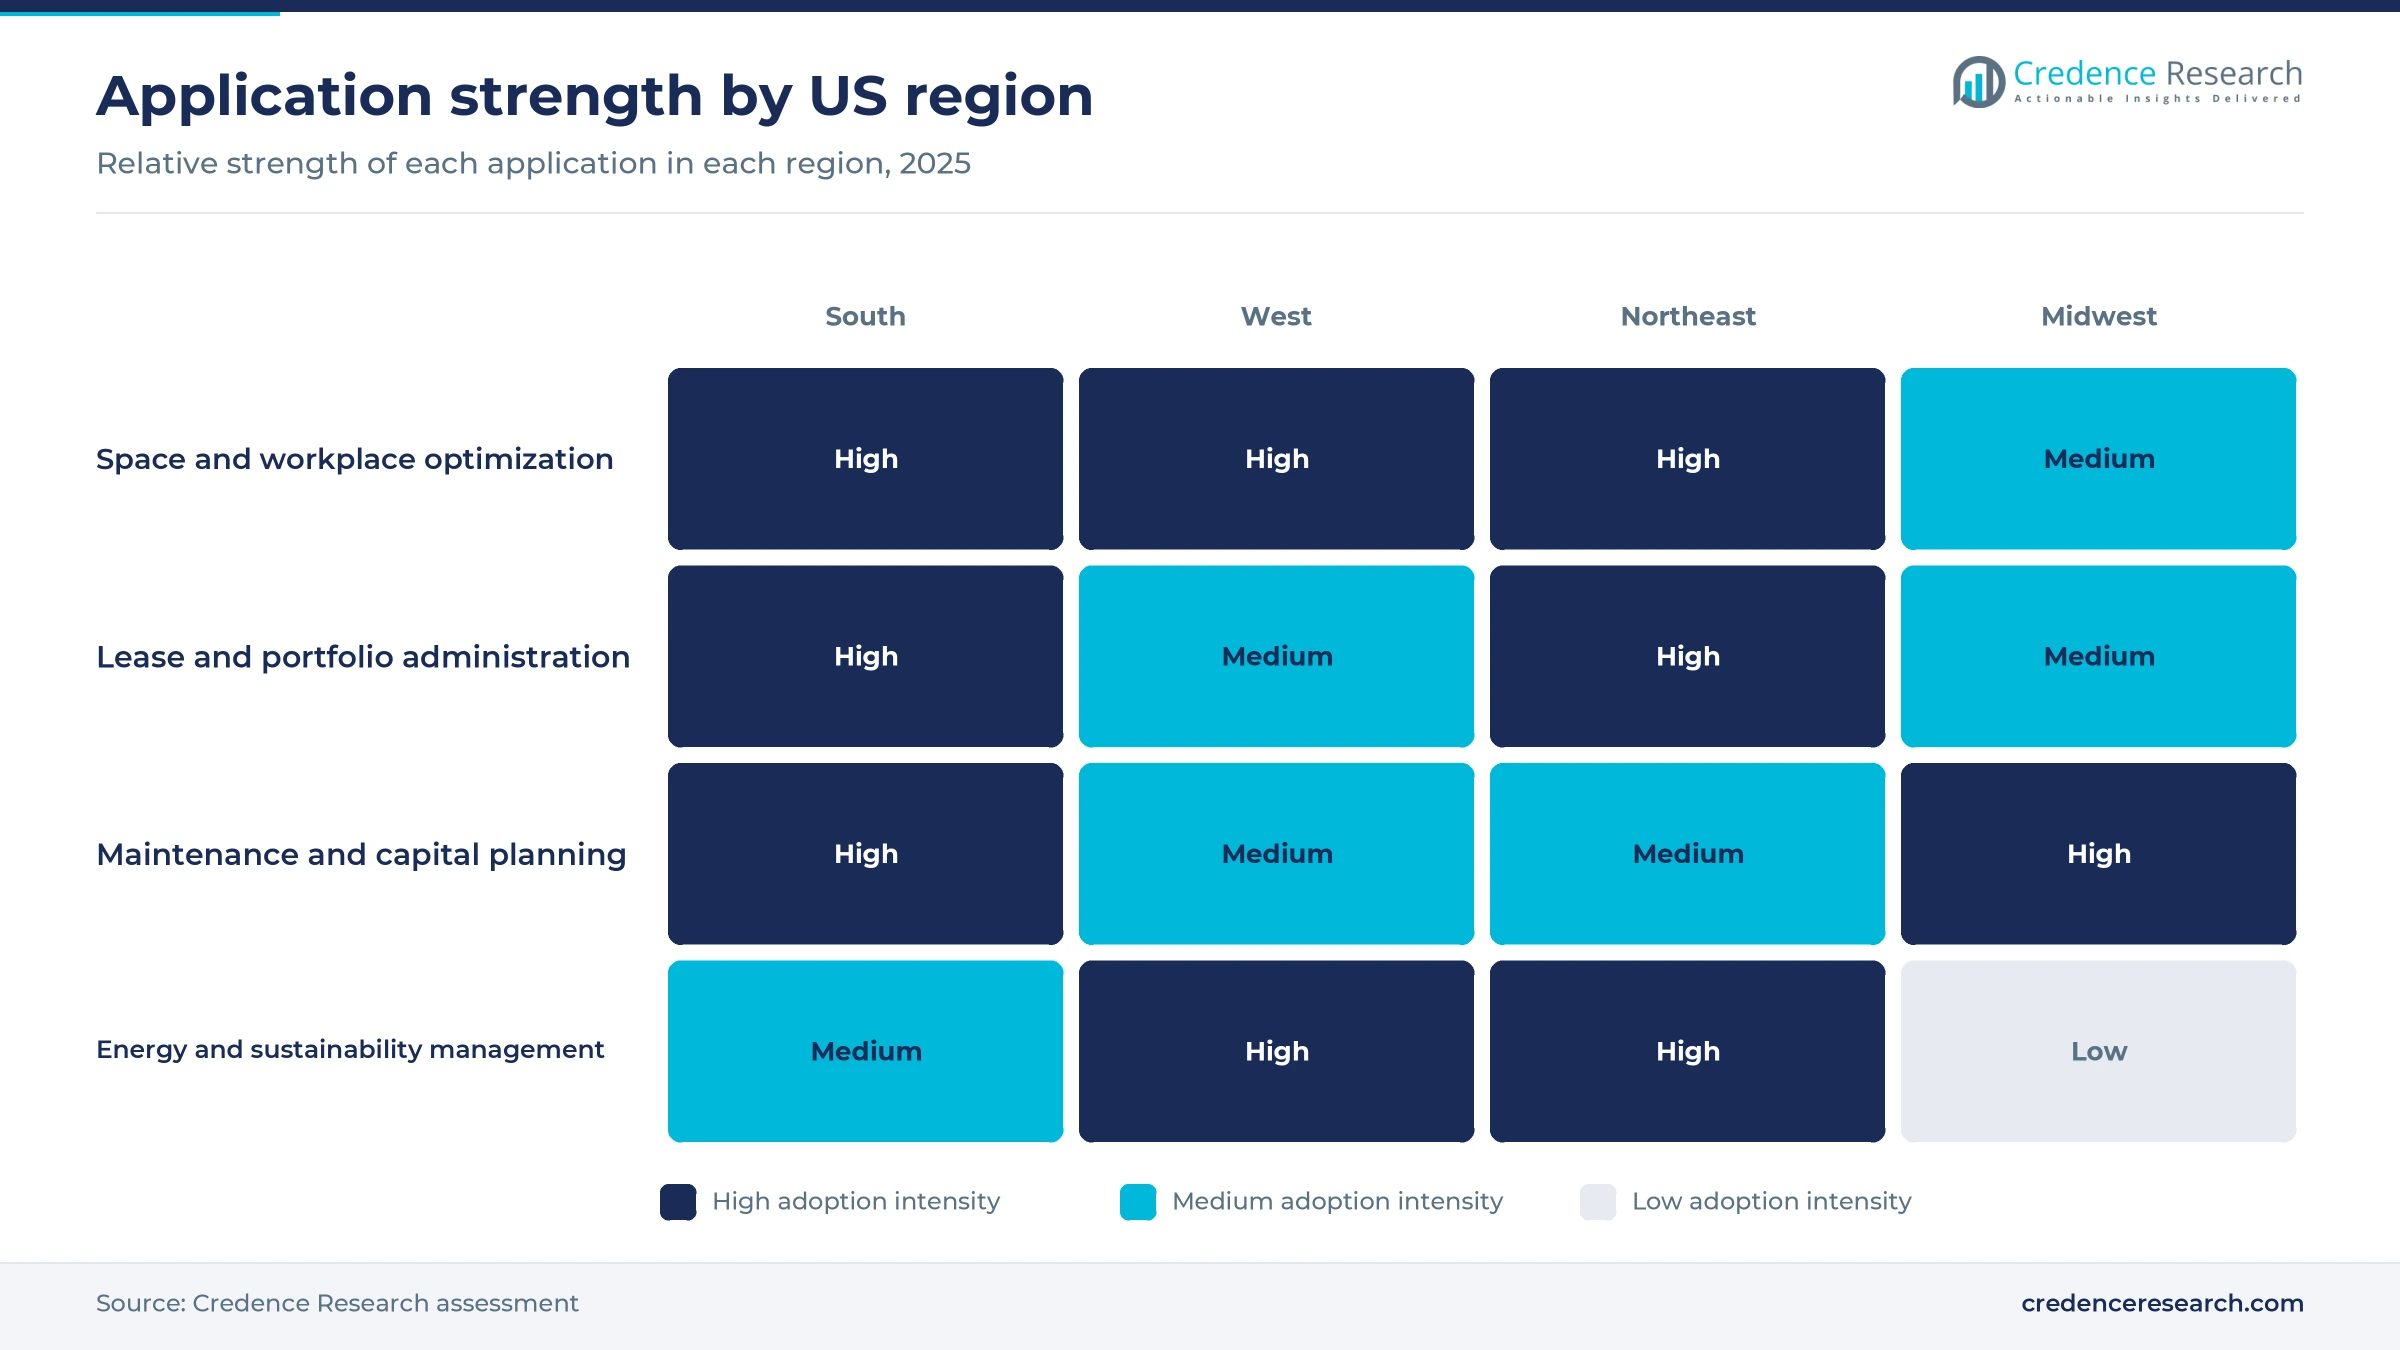
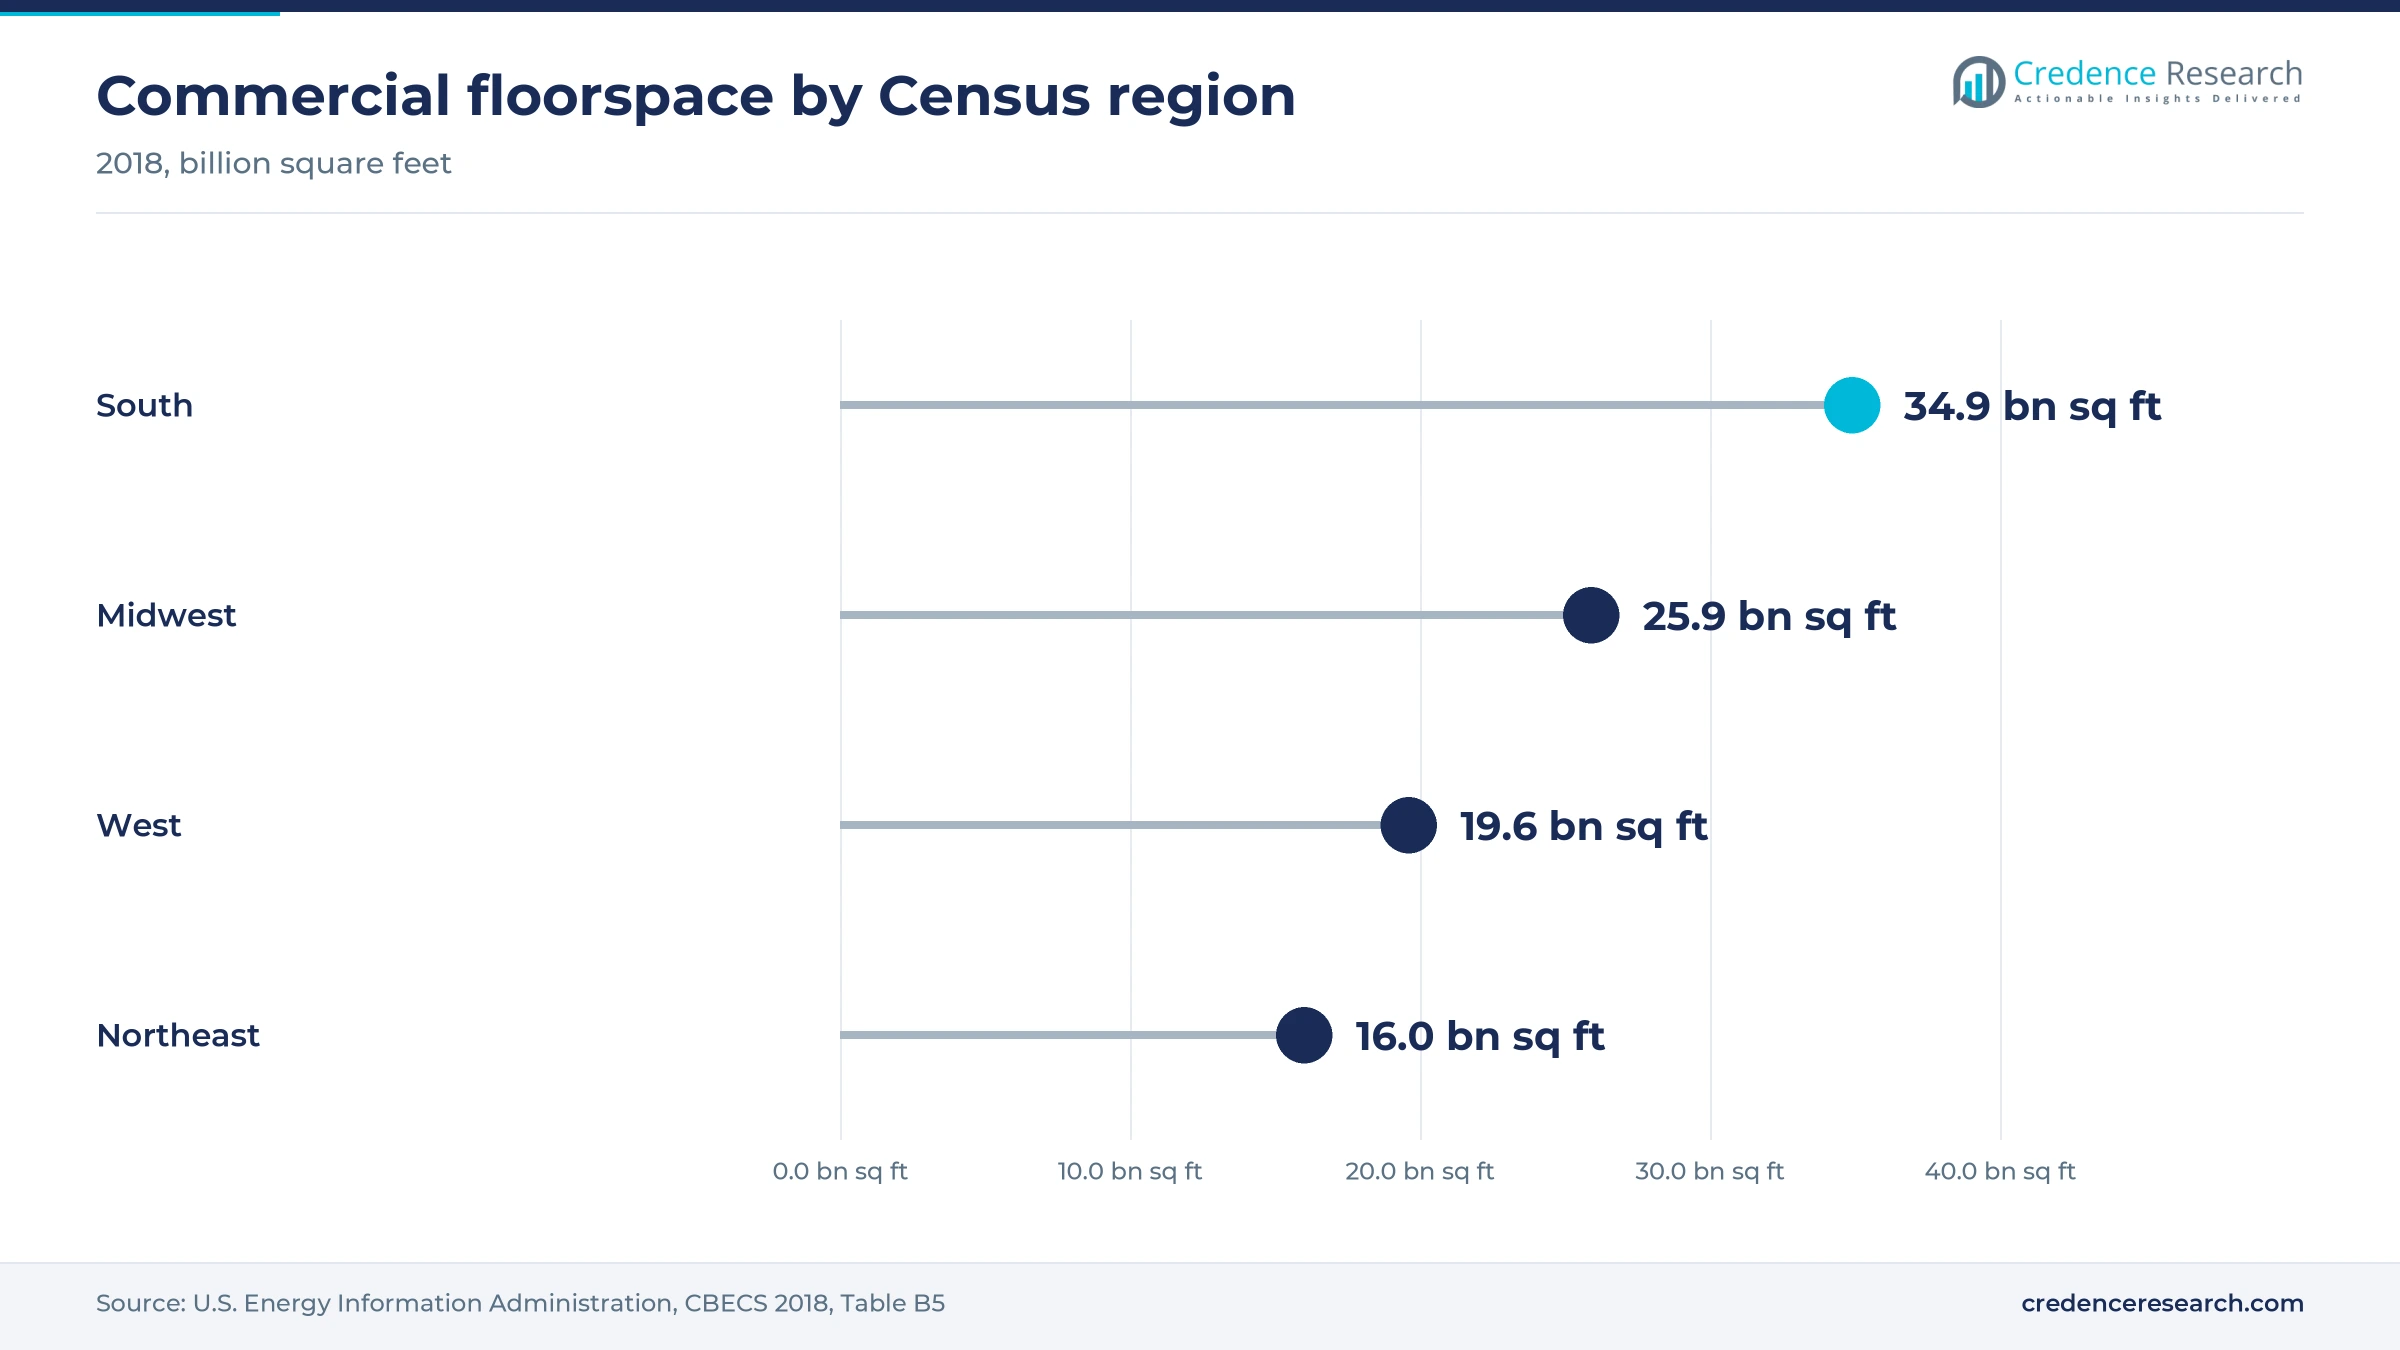
The South held 37.5% of 2025 value and grows fastest at 12.1% a year, because it has the largest stock of commercial space and continues to attract corporate relocations. The EIA counts 34.9 billion square feet of commercial floorspace in the South, about 36% of the national total and well ahead of any other region. Hospital systems, universities and state agencies in Texas, Florida and the Carolinas run large campuses that need joined space and maintenance data. New office campuses also buy cloud suites from the start.
Disclosure and building rules lift western spending
The West held 25.0% of 2025 value and grows at 12.0% a year, because technology headquarters adopted hybrid work early and state rules now require detailed emissions data. California's climate disclosure deadline and Washington's Clean Buildings standard, both discussed above, give owners firm dates. The region holds about 19.6 billion square feet of commercial floorspace, according to the EIA. Large technology campuses in California and Washington also test sensor and AI planning tools first.
The Midwest trails its floorspace share
The Midwest held 19.5% of 2025 value against about 27% of U.S. commercial floorspace in the EIA's 2018 survey, and grows at 11.1% a year, the slowest pace, because fewer Midwest cities enforce building performance standards than in the Northeast and West. Insurers, banks and health systems in Chicago, Minneapolis and Columbus still buy full suites for their office and campus estates. Maintenance and capital planning modules carry much of the regional demand.
Local Law 97 makes energy modules standard in the Northeast
The Northeast held 18.0% of 2025 value and grows at 11.3% a year, as dense office towers and strict city energy limits keep demand high despite the smallest floor area. The region holds about 16.0 billion square feet of commercial floorspace, according to the EIA. The New York City compliance filings noted above and Boston's building emissions rules make energy modules a standard requirement. Financial services firms in New York and Boston also run some of the largest lease portfolios.
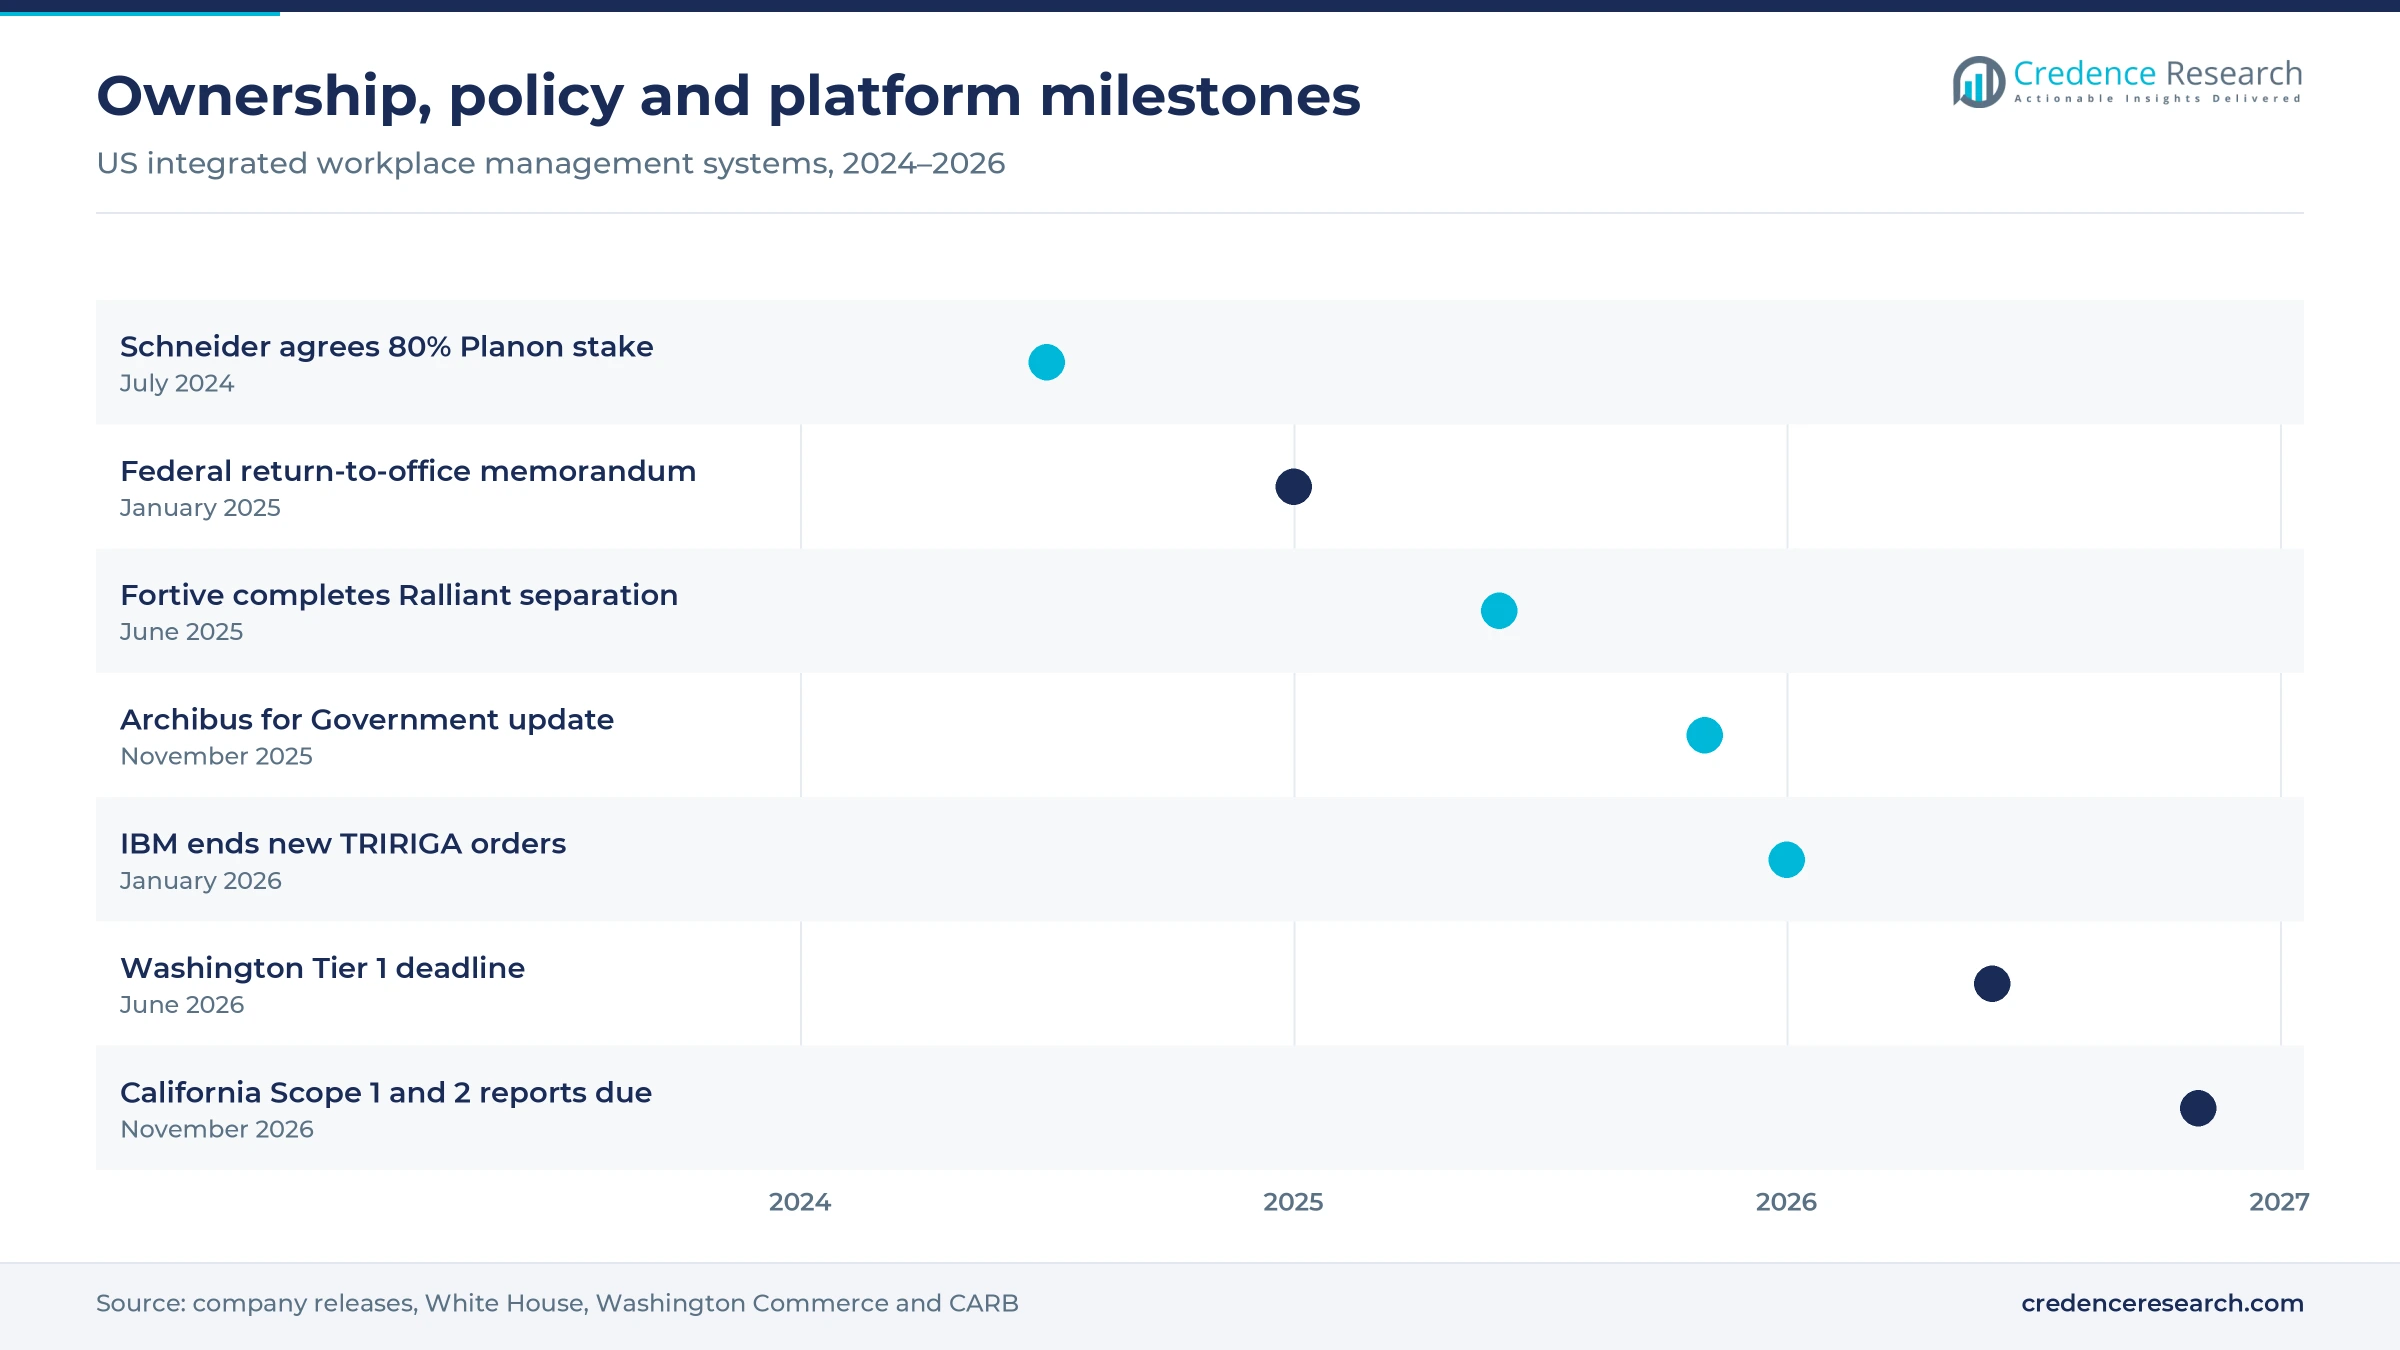
Ownership changes and platform shifts, 2024 to 2026
| Development | Status and market relevance |
|---|---|
| In July 2024, Schneider Electric signed an agreement to raise its ownership of Planon to a controlling 80% stake. | Ties Planon software to Schneider building controls |
| In June 2025, Fortive completed the Ralliant separation and kept Accruent within its Intelligent Operating Solutions segment. | Accruent stays with a focused industrial software parent |
| In November 2025, Eptura released Archibus for Government updates with new 2D and 3D building data APIs. | Targets federal and state real estate portfolios |
| In January 2026, IBM ended new orders for TRIRIGA and TRIRIGA SaaS, pointing customers to Maximo Real Estate and Facilities. | Starts a migration cycle across large U.S. portfolios |
Sensors, twins and open APIs feed a single property record
- Occupancy and badge data feeds combine sensor counts, access logs and bookings into one daily utilization figure that planners can trust for lease decisions.
- Building data APIs expose floor plans, rooms and assets to service desks, HR systems and analytics tools, so each system uses the same location codes.
- Meter and controls integration pulls energy readings from building controls into compliance filings and dashboards without manual exports.
- Digital floor plans link each room to its assets and lease terms, while digital twins let planners test moves before they sign.
- AI planning assistants suggest desk assignments, maintenance priorities and portfolio scenarios from current data.
Need a Custom Version of This Report?
Tailor the scope, geography, or segments to your exact requirements.
- Custom geography or segment scope
- Direct access to our analyst team
Building technology groups now own most leading suites
Competition in the U.S. integrated workplace management system market turns on module breadth, data integration, migration support and links to building equipment. IBM serves large enterprises and agencies with Maximo Real Estate and Facilities, the successor to TRIRIGA. Eptura combines Archibus, Serraview and its Engage booking tools across corporate and government portfolios. Planon, in which Schneider Electric agreed in July 2024 to take an 80% controlling stake, pairs its suite with building controls, while Accruent, part of Fortive, serves multi-site maintenance and lease needs. Nuvolo, owned by Trane Technologies since its 2023 acquisition, runs on the ServiceNow platform for healthcare and life sciences buyers. FM:Systems brings workplace software into the Johnson Controls OpenBlue range after Johnson Controls acquired it in 2023. MRI Software focuses on lease administration for occupiers, and ServiceNow sells Workplace Service Delivery to its IT customers.
Building technology groups and platform vendors divide the field
Supply in the U.S. integrated workplace management system market is organized in three groups. Building technology companies now own several leading suites, with Planon moving under Schneider Electric control, Nuvolo under Trane Technologies and FM:Systems under Johnson Controls. Independent specialists such as Eptura, Accruent and MRI Software compete on breadth of modules and industry templates, while IBM and ServiceNow sell workplace tools inside wider asset and service platforms. Entry barriers are high for full suites, because large buyers demand proven security, integrations and migration support. Margins sit with subscription software, while implementation partners earn lower but steady services fees.
Companies profiled and their roles in this market
| Company | Type | Role in the market |
|---|---|---|
| IBM Corporation | Enterprise platform | Maximo Real Estate and Facilities for space, lease and asset management |
| Eptura, Inc. | Workplace specialist | Archibus, Serraview and Engage suites for space, booking and maintenance |
| Planon (Schneider Electric) | Full-suite specialist | Integrated real estate and facilities suite linked to building controls |
| Accruent (Fortive Corporation) | Facilities software specialist | Maintenance, lease and space software for multi-site estates |
| Nuvolo (Trane Technologies) | Platform-based suite | Connected workplace and asset management built on ServiceNow |
| FM:Systems (Johnson Controls) | Workplace specialist | Space planning and occupancy software within the OpenBlue range |
| MRI Software LLC | Real estate software provider | Lease administration and occupier portfolio tools |
| ServiceNow, Inc. | Enterprise platform | Workplace Service Delivery for reservations, space and workplace cases |
Energy compliance will decide the next round of purchases
Credence Research's view is that the U.S. integrated workplace management system market will be shaped less by desk booking, which is now widely deployed, than by the need to hold verified space, lease and energy data in one record. Software subscriptions keep the largest share, while implementation and managed services gain from forced migrations. Energy and sustainability management grows fastest because deadlines carry fines. Healthcare and life sciences buyers grow quickly on accreditation and asset tracking needs. Suppliers that offer open data export, proven migration paths and controls integration without equipment lock-in should win most renewals.
GAO, EIA, BLS and vendor filings anchor the estimates
The report uses 2025 as the base year on a calendar basis, and market values come from the Credence Research model. That model combines Energy Information Administration floorspace data, Bureau of Labor Statistics telework data, Government Accountability Office findings, ENERGY STAR program data, state and city building performance rules, company releases, published list prices and trade press. Segment splits, regional shares and regional growth rates are Credence Research estimates built from floorspace, policy coverage and pricing data, and no interviews or surveys were used for this report.
Subscriptions and compliance modules carry growth to 2035
Spending on integrated workplace management systems in the United States is expected to reach USD 5.76 billion by 2035, an 11.75% CAGR during 2026–2035, as occupiers keep cutting unused space and more cities enforce building performance standards. Energy and sustainability management grows at 13.6% a year, the quickest pace of any application. Implementation and managed services gain as legacy platforms reach end of support, while software subscriptions stay the largest solution type. Growth would slow if office budgets fell further or deadlines slipped, while faster AI-led planning would lift results toward the upside case.
Compliance deadlines and office demand set the range of outcomes
In the base case, spending grows from the 2026 value along the central forecast as subscriptions replace licenses and energy modules spread with new city and state deadlines. The downside case assumes that weaker office demand cuts real estate budgets and that some building performance rules are delayed. The upside case adds faster migration from legacy suites and wider use of AI planning tools that pay back through lease exits.
| Scenario | CAGR, 2026–2035 | Value, 2035 | What has to hold |
|---|---|---|---|
| Downside | 10.1% | USD 5.02 billion | Office budgets shrink and building performance deadlines slip in several cities |
| Base | 11.75% | USD 5.76 billion | Subscriptions replace licenses and energy rules keep their current timetable |
| Upside | 13.2% | USD 6.49 billion | Legacy migrations speed up and AI planning tools justify lease exits |
Frequently Asked Questions
How big is the U.S. integrated workplace management system market?
Which solution type leads the market?
Which application grows fastest?
Which region holds the largest share?
What happens to IBM TRIRIGA customers?
How is workplace software priced in the United States?
Who are the main companies in this market?
How much office space do federal agencies use?
Table of Content
Chapter 1 Market Segmentation
- 1.1 Segmentation Framework
- 1.1.1 Product and Service Classification
- 1.1.2 Application and End-Use Classification
- 1.1.3 Technology and Solution Classification
- 1.1.4 Customer and Distribution Channel Classification
- 1.1.5 Geographic Segmentation
- 1.1.6 Market Segment Definitions and Boundaries
- 1.2 By Solution Type
- 1.2.1 Software subscriptions
- 1.2.2 Perpetual licenses and maintenance
- 1.2.3 Implementation and managed services
- 1.3 By Application
- 1.3.1 Space and workplace optimization
- 1.3.2 Lease and portfolio administration
- 1.3.3 Maintenance and capital planning
- 1.3.4 Energy and sustainability management
- 1.4 By End-Use Industry
- 1.4.1 Corporate offices and financial services
- 1.4.2 Healthcare and life sciences
- 1.4.3 Education and public administration
- 1.4.4 Retail and distributed operating estates
Chapter 2 Introduction
- 2.1 Report Objectives and Scope
- 2.2 Product Definition and Industry Terminology
- 2.3 Market Inclusions and Exclusions
- 2.4 Research Process
- 2.4.1 Primary Research and Expert Interviews
- 2.4.2 Secondary Research and Source Review
- 2.4.3 Top-Down and Bottom-Up Estimation
- 2.4.4 Data Triangulation and Verification
- 2.5 Market Size Measurement Basis
- 2.5.1 2025: USD 1.89 billion → 2035: USD 5.76 billion
- 2.6 Historical and Forecast Reference Periods
- 2.6.1 Historical Period: 2018-2025
- 2.6.2 Base Year: 2025
- 2.6.3 Forecast Period: 2025-2035
- 2.7 Research Assumptions and Limitations
Chapter 3 Executive Summary
- 3.1 Market Snapshot and Key Findings
- 3.2 Base-Year Market Size, 2025
- 3.3 Forecast Market Size, 2035
- 3.4 Revenue and Volume Growth Outlook
- 3.5 Key Demand and Supply Indicators
- 3.6 Leading Market Segments
- 3.7 Fastest-Growing Market Opportunities
- 3.8 Regional Performance Highlights
- 3.9 Technology and Industry Transformation
- 3.10 Competitive Landscape Summary
- 3.11 Analyst View and Strategic Implications
Chapter 4 US Integrated Workplace Management System Market Trends and Developments
- 4.1 Historical Industry Development, 2018-2025
- 4.2 Recent Market Trends and Developments
- 4.3 Demand and Customer Behavior Trends
- 4.4 Technology and Product Innovation
- 4.5 Artificial Intelligence, Automation and Digitalization
- 4.6 Local Manufacturing and Supply Chain Realignment
- 4.7 Industry Partnerships, Mergers and Acquisitions
- 4.8 Sustainability and Circular Economy Developments
- 4.9 Government and Private Sector Investment Trends
- 4.10 Emerging Business Models and Commercialization
- 4.11 Industry Developments and Announcements
Chapter 5 US Integrated Workplace Management System Market Supply and Demand Analysis
- 5.1 Demand Trend and Consumption Analysis, 2018-2025
- 5.2 Demand Forecast, 2025-2035
- 5.3 Supply Chain Structure and Procurement Trends
- 5.4 Supply-Demand Gap and Bottlenecks
- 5.5 Import Dependence and Sourcing Structure
- 5.6 Regional Supply and Demand Concentration
Chapter 6 US Integrated Workplace Management System Market Pricing Analysis
- 6.1 Pricing Structure and Measurement
- 6.2 Historical Pricing Trends, 2018-2025
- 6.3 Pricing Outlook, 2025-2035
- 6.4 Pricing by Product and Market Segment
- 6.5 Geographic Pricing Differences
- 6.6 Key Input, Energy, Labor and Logistics Costs
- 6.7 Contract Pricing and Purchasing Models
- 6.8 Pricing Sensitivity and Competitive Positioning
- 6.9 Price, Margin and Profitability Implications
Chapter 7 US Integrated Workplace Management System Market Dynamics
- 7.1 Market Growth Drivers
- 7.1.1 Demand-Side Drivers
- 7.1.2 Technology and Innovation Drivers
- 7.1.3 Infrastructure and Investment Drivers
- 7.1.4 Regulatory and Policy Drivers
- 7.2 Market Restraints
- 7.2.1 Cost and Affordability Constraints
- 7.2.2 Technology and Adoption Barriers
- 7.2.3 Supply Chain and Operational Constraints
- 7.3 Market Challenges
- 7.3.1 Competitive Pressure and Margin Erosion
- 7.3.2 Skills, Infrastructure and Implementation Gaps
- 7.4 Emerging Market Opportunities
- 7.5 Market Dynamics Impact and Time-Horizon Assessment
Chapter 8 US Integrated Workplace Management System Value Chain Analysis
- 8.1 Industry Value Chain Overview
- 8.2 Upstream Suppliers and Critical Inputs
- 8.3 Technology and Component Providers
- 8.4 Manufacturing or Service Delivery
- 8.5 Distribution, Channel Partners and Integrators
- 8.6 Downstream Applications and End Users
- 8.7 Value Addition and Profit Pools
- 8.8 Vertical Integration and Outsourcing
- 8.9 Supplier Concentration and Risk
- 8.10 Supply Chain Localization and Resilience
Chapter 9 US Integrated Workplace Management System Market Regulations and Policies
- 9.1 Relevant Laws, Standards and Compliance Frameworks
- 9.2 Product, Service, Safety and Quality Requirements
- 9.3 Government Policies, Incentives and Subsidies
- 9.4 Imports, Exports and Trade Barriers
- 9.5 Public Procurement and Local Content Requirements
- 9.6 Data Protection, AI and Cybersecurity Compliance
- 9.7 Upcoming Policy Changes and Market Implications
Chapter 10 US Integrated Workplace Management System Market Hotspots and Opportunities
- 10.1 Market Opportunity Mapping and Growth Hotspots
- 10.2 High-Growth Applications and Customer Groups
- 10.3 Underserved Markets and White-Space Opportunities
- 10.4 Emerging Technology and Product Opportunities
- 10.5 New Capacity and Investment Hotspots
- 10.6 Market Entry and Expansion Opportunities
- 10.7 Distribution and Partnership Opportunities
- 10.8 Near-Term and Long-Term Commercial Potential
- 10.9 Opportunity Attractiveness and Execution Risks
Chapter 11 US Integrated Workplace Management System Market Outlook, 2025-2035
- 11.1 Market Size and Analysis
- 11.1.1 Revenue (Market Measurement: 2025: USD 1.89 billion → 2035: USD 5.76 billion)
- 11.1.2 Historical Market Size, 2018-2025
- 11.1.3 Base-Year Market Size, 2025
- 11.2 Market Forecast, 2025-2035
- 11.2.1 Revenue Forecast to 2035
- 11.2.2 CAGR and Year-on-Year Growth
- 11.2.3 Incremental Revenue Opportunity
- 11.3 Forecast Assumptions and Scenario Analysis
- 11.3.1 Base-Case Forecast
- 11.3.2 Optimistic and Conservative Scenarios
- 11.3.3 Technology, Pricing and Policy Sensitivities
- 11.4 Market Attractiveness and Growth Outlook
Chapter 12 US Integrated Workplace Management System Market Segmentation and Outlook
- 12.1 Segmentation Summary and Market Shares, 2025
- 12.2 Largest and Fastest-Growing Segments
- 12.3 By Solution Type - Market Size and Forecast, 2025-2035
- 12.3.1 Segment Definition and Scope
- 12.3.2 Historical Market Size, 2018-2025
- 12.3.3 Revenue Forecast, 2025-2035
- 12.3.4 Base-Year Market Share, 2025
- 12.3.5 Segment CAGR and Growth Drivers
- 12.3.6 Subsegment Market Size and Forecast
- 12.3.6.1 Software subscriptions
- 12.3.6.2 Perpetual licenses and maintenance
- 12.3.6.3 Implementation and managed services
- 12.3.7 Subsegment Pricing and Adoption Trends
- 12.3.8 Leading Suppliers and Competition
- 12.3.9 Regional Demand and Opportunities
- 12.4 By Application - Market Size and Forecast, 2025-2035
- 12.4.1 Segment Definition and Scope
- 12.4.2 Historical Market Size, 2018-2025
- 12.4.3 Revenue Forecast, 2025-2035
- 12.4.4 Base-Year Market Share, 2025
- 12.4.5 Segment CAGR and Growth Drivers
- 12.4.6 Subsegment Market Size and Forecast
- 12.4.6.1 Space and workplace optimization
- 12.4.6.2 Lease and portfolio administration
- 12.4.6.3 Maintenance and capital planning
- 12.4.6.4 Energy and sustainability management
- 12.4.7 Subsegment Pricing and Adoption Trends
- 12.4.8 Leading Suppliers and Competition
- 12.4.9 Regional Demand and Opportunities
- 12.5 By End-Use Industry - Market Size and Forecast, 2025-2035
- 12.5.1 Segment Definition and Scope
- 12.5.2 Historical Market Size, 2018-2025
- 12.5.3 Revenue Forecast, 2025-2035
- 12.5.4 Base-Year Market Share, 2025
- 12.5.5 Segment CAGR and Growth Drivers
- 12.5.6 Subsegment Market Size and Forecast
- 12.5.6.1 Corporate offices and financial services
- 12.5.6.2 Healthcare and life sciences
- 12.5.6.3 Education and public administration
- 12.5.6.4 Retail and distributed operating estates
- 12.5.7 Subsegment Pricing and Adoption Trends
- 12.5.8 Leading Suppliers and Competition
- 12.5.9 Regional Demand and Opportunities
- 12.6 Segment Growth Comparison
- 12.7 Segment Attractiveness and Priority Matrix
Chapter 13 US Integrated Workplace Management System End-Use and Application Market Outlook
- 13.1 End-Use Industry and Customer Demand Structure
- 13.2 Leading Applications and Customer Groups
- 13.3 End-Use Market Size, Share and Forecast
- 13.4 Major End-Use Industry Deep Dives
- 13.4.1 Customer Requirements and Use Cases
- 13.4.2 Demand and Replacement Cycles
- 13.4.3 Technical and Regulatory Considerations
- 13.4.4 Purchasing and Procurement Models
- 13.4.5 Leading Vendors and Distribution Channels
- 13.4.6 Forecast and Commercial Opportunities
- 13.5 Emerging Applications and Cross-Segment Demand
- 13.6 End-Use Industry Investment Priorities
Chapter 14 US Integrated Workplace Management System Geographic Market Outlook, 2025-2035
- 14.1 Domestic Market Distribution and Demand Clusters
- 14.2 State- or Province-Wise Market Size and Forecast, 2025-2035
- 14.3 City and Metropolitan Market Outlook
- 14.4 Industrial, Manufacturing and Commercial Clusters
- 14.5 Geographic Concentration of Key End Users
- 14.6 Local Pricing and Purchasing Differences
- 14.7 Domestic Production Facilities and Capacity Map
- 14.8 Local Infrastructure and Project Pipeline
- 14.9 State-Level Policy and Incentive Differences
- 14.10 Subnational Investment Hotspots and Opportunities
- 14.11 Distribution and Logistics Networks
- 14.12 Domestic Competitive Footprint
Chapter 15 US Integrated Workplace Management System Technology, Innovation and Sustainability Outlook
- 15.1 Technology Landscape and Maturity
- 15.2 Product, Process and Service Innovation
- 15.3 AI, Automation and Digital Tools in the Industry
- 15.4 Technology Adoption and Performance Benchmarking
- 15.5 Innovation Pipeline and R&D Investment
- 15.6 Patent and Intellectual Property Trends
- 15.7 Energy Efficiency and Resource Management
- 15.8 Sustainability, Recycling and Circularity
- 15.9 Technology Roadmap, 2025-2035
- 15.10 Risks of Obsolescence and Technology Substitution
Chapter 16 US Integrated Workplace Management System Market Key Strategic Imperatives
- 16.1 Growth and Market Entry Priorities
- 16.2 High-Return Products and Segments
- 16.3 Pricing, Profitability and Cost Optimization
- 16.4 Technology Investment and Product Differentiation
- 16.5 Supply Chain Localization and Resilience
- 16.6 Distribution and Customer Acquisition
- 16.7 Partnership, Acquisition and Capacity Strategy
- 16.8 Regional Expansion Priorities
- 16.9 Short-, Medium- and Long-Term Actions
Chapter 17 Competition Outlook
- 17.1 Industry Competition Characteristics
- 17.2 Market Structure and Concentration
- 17.3 Market Share and Competitive Positioning, 2025
- 17.4 Company-Wise Revenue and Product Benchmarking
- 17.5 Production and Service Capacity Benchmarking
- 17.6 Technology, Pricing and Differentiation
- 17.7 Regional Footprint and Distribution Strength
- 17.8 Mergers, Acquisitions and Strategic Alliances
- 17.9 New Entrants and Competitive Threats
- 17.10 Porter's Five Forces and Industry Attractiveness
- 17.11 Competitive Outlook, 2025-2035
Chapter 18 Company Profiles
- 18.1 Company Coverage and Selection Criteria
- 18.2 IBM Corporation
- 18.2.1 Business Description
- 18.2.2 Company Ownership and Geographic Presence
- 18.2.3 Product and Service Portfolio
- 18.2.4 Manufacturing and Operating Footprint
- 18.2.5 Financial Performance and Investment
- 18.2.6 Market Share and Competitive Position
- 18.2.7 Technology and Innovation Capabilities
- 18.2.8 Strategic Alliances or Partnerships
- 18.2.9 Recent Developments
- 18.2.10 Growth Strategy and Outlook
- 18.3 Eptura, Inc.
- 18.4 Planon (Schneider Electric)
- 18.5 Accruent (Fortive Corporation)
- 18.6 Nuvolo (Trane Technologies)
- 18.7 FM:Systems (Johnson Controls)
- 18.8 MRI Software LLC
- 18.9 ServiceNow, Inc.
- 18.10 Other Relevant Market Participants
Note: Every listed company is profiled on the structure shown under the first company. The company list is preliminary and may change based on research findings, market developments, data availability and client requirements.
Chapter 19 Disclaimer
- 19.1 Research and Forecast Disclaimer
- 19.2 Data Source and Estimation Limitations
Note: The depth of individual sections depends on data availability for this market. Volume, capacity, trade and other unit-based metrics are included where applicable.

