
Scarce accelerators turn scheduling into a buying priority
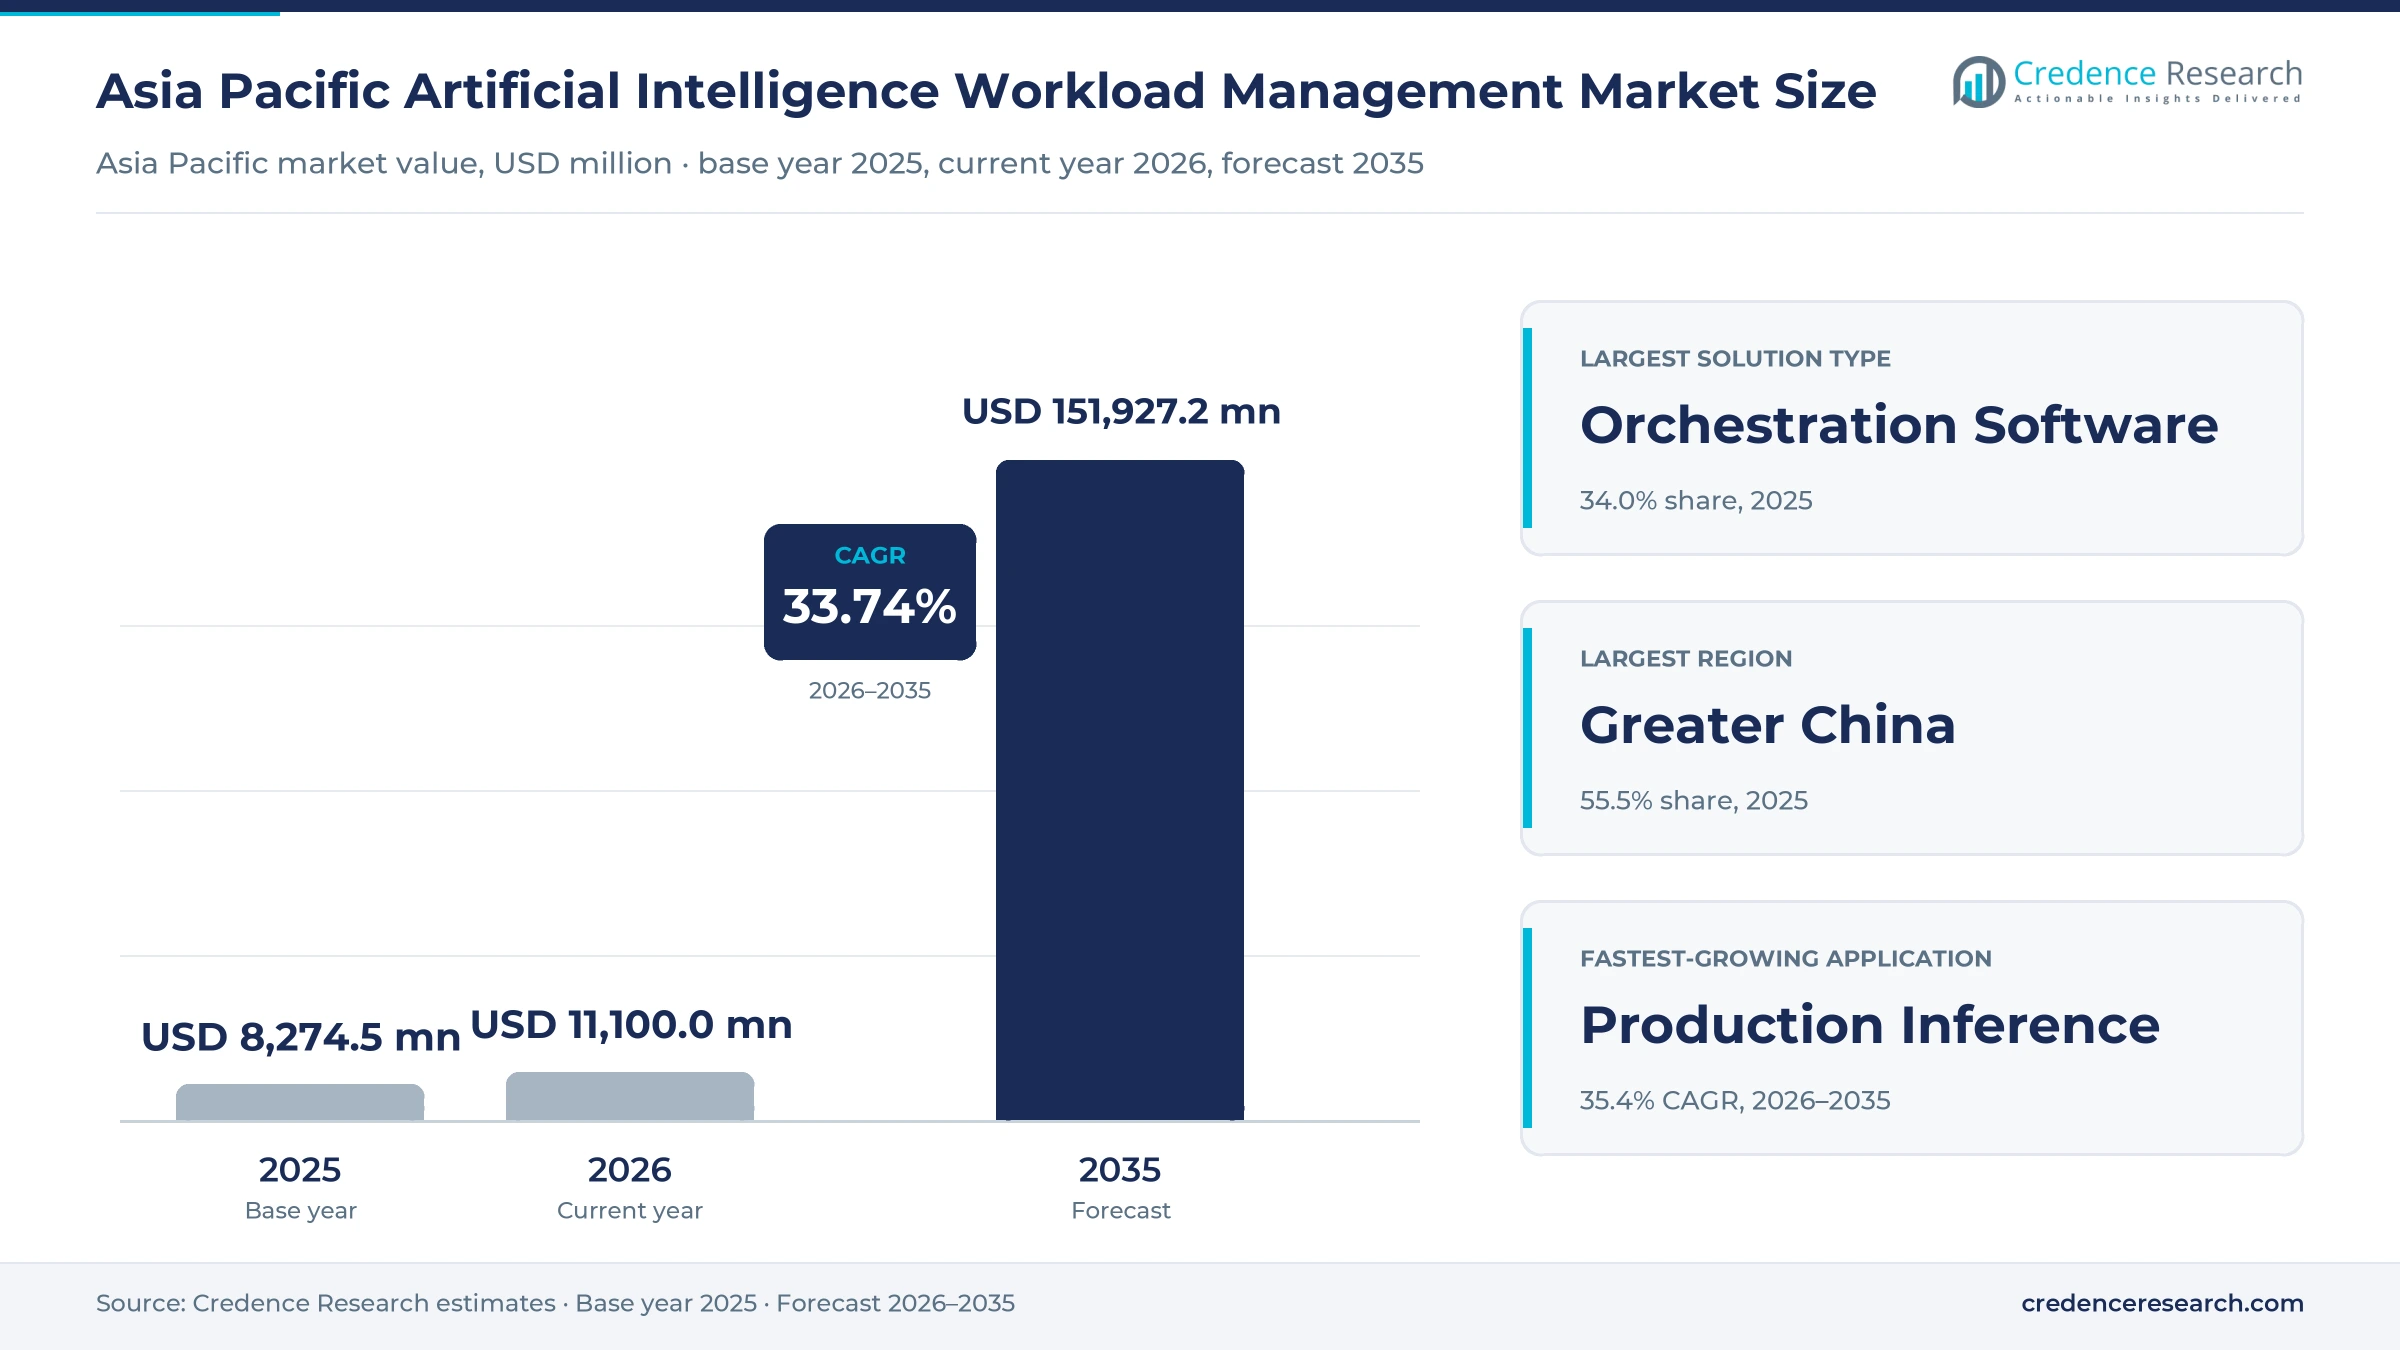
The Asia Pacific artificial intelligence workload management market was valued at USD 8.27 billion in 2025 and is projected to increase from USD 11.10 billion in 2026 to USD 151.93 billion by 2035, registering a CAGR of 33.74% during 2026–2035. Demand comes from cloud providers, national compute programs, banks, telecom operators and manufacturers that must share limited GPU and NPU capacity across training, fine-tuning and live inference. Greater China held the largest regional share, 55.5% in 2025, because Chinese platforms run the region's largest accelerator fleets and must stretch domestic chips under U.S. export rules. India is the fastest-growing region at 35.8% a year, as a government-subsidized compute portal opens shared GPU capacity to startups and researchers. A notable commercial change came in April 2025, when NVIDIA released the scheduler from its Run:ai purchase as open-source code. Buyers now judge vendors on how many workloads each accelerator carries, not only on how many accelerators they can supply.
Software and services that decide which model runs on which chip
The market counts what enterprises, cloud providers and public compute operators pay for software and services that schedule, queue, share, scale and monitor AI training, fine-tuning and inference jobs on GPU, NPU and accelerator clusters. It covers orchestration platforms, inference serving and routing tools, utilization and cost optimization software, and professional or managed workload services, sold as subscriptions, usage-based fees or contracts.
The count excludes the accelerators, servers, networking and data center power themselves, raw GPU rental charges, foundation model licenses and general-purpose IT operations tools. Value moves from chip and cloud vendors that own the control layer to integrators and local GPU clouds that package scheduling with capacity for enterprise and government buyers.
Asia Pacific Artificial Intelligence Workload Management Market Insights
- The market rises from USD 8.27 billion in 2025 to USD 151.93 billion by 2035, a 33.74% CAGR, as accelerator fleets shift from training bursts to always-on inference.
- Greater China held 55.5% of 2025 value because Chinese clouds run the largest fleets and must squeeze more work out of domestic chips.
- Orchestration Software led with 34.0% of 2025 value, since every shared GPU pool needs a scheduler before teams can use it.
- Alibaba Cloud said its Aegaeon pooling system cut the GPUs needed for a model marketplace from 1,192 to 213 in 2025, an 82% reduction in hardware for the same models.
- NVIDIA open-sourced its KAI Scheduler under Apache 2.0 on April 1, 2025, which lowers entry costs and moves competition to support and integration.
Orchestration leads while inference tools grow fastest
Orchestration leads as inference management grows fastest
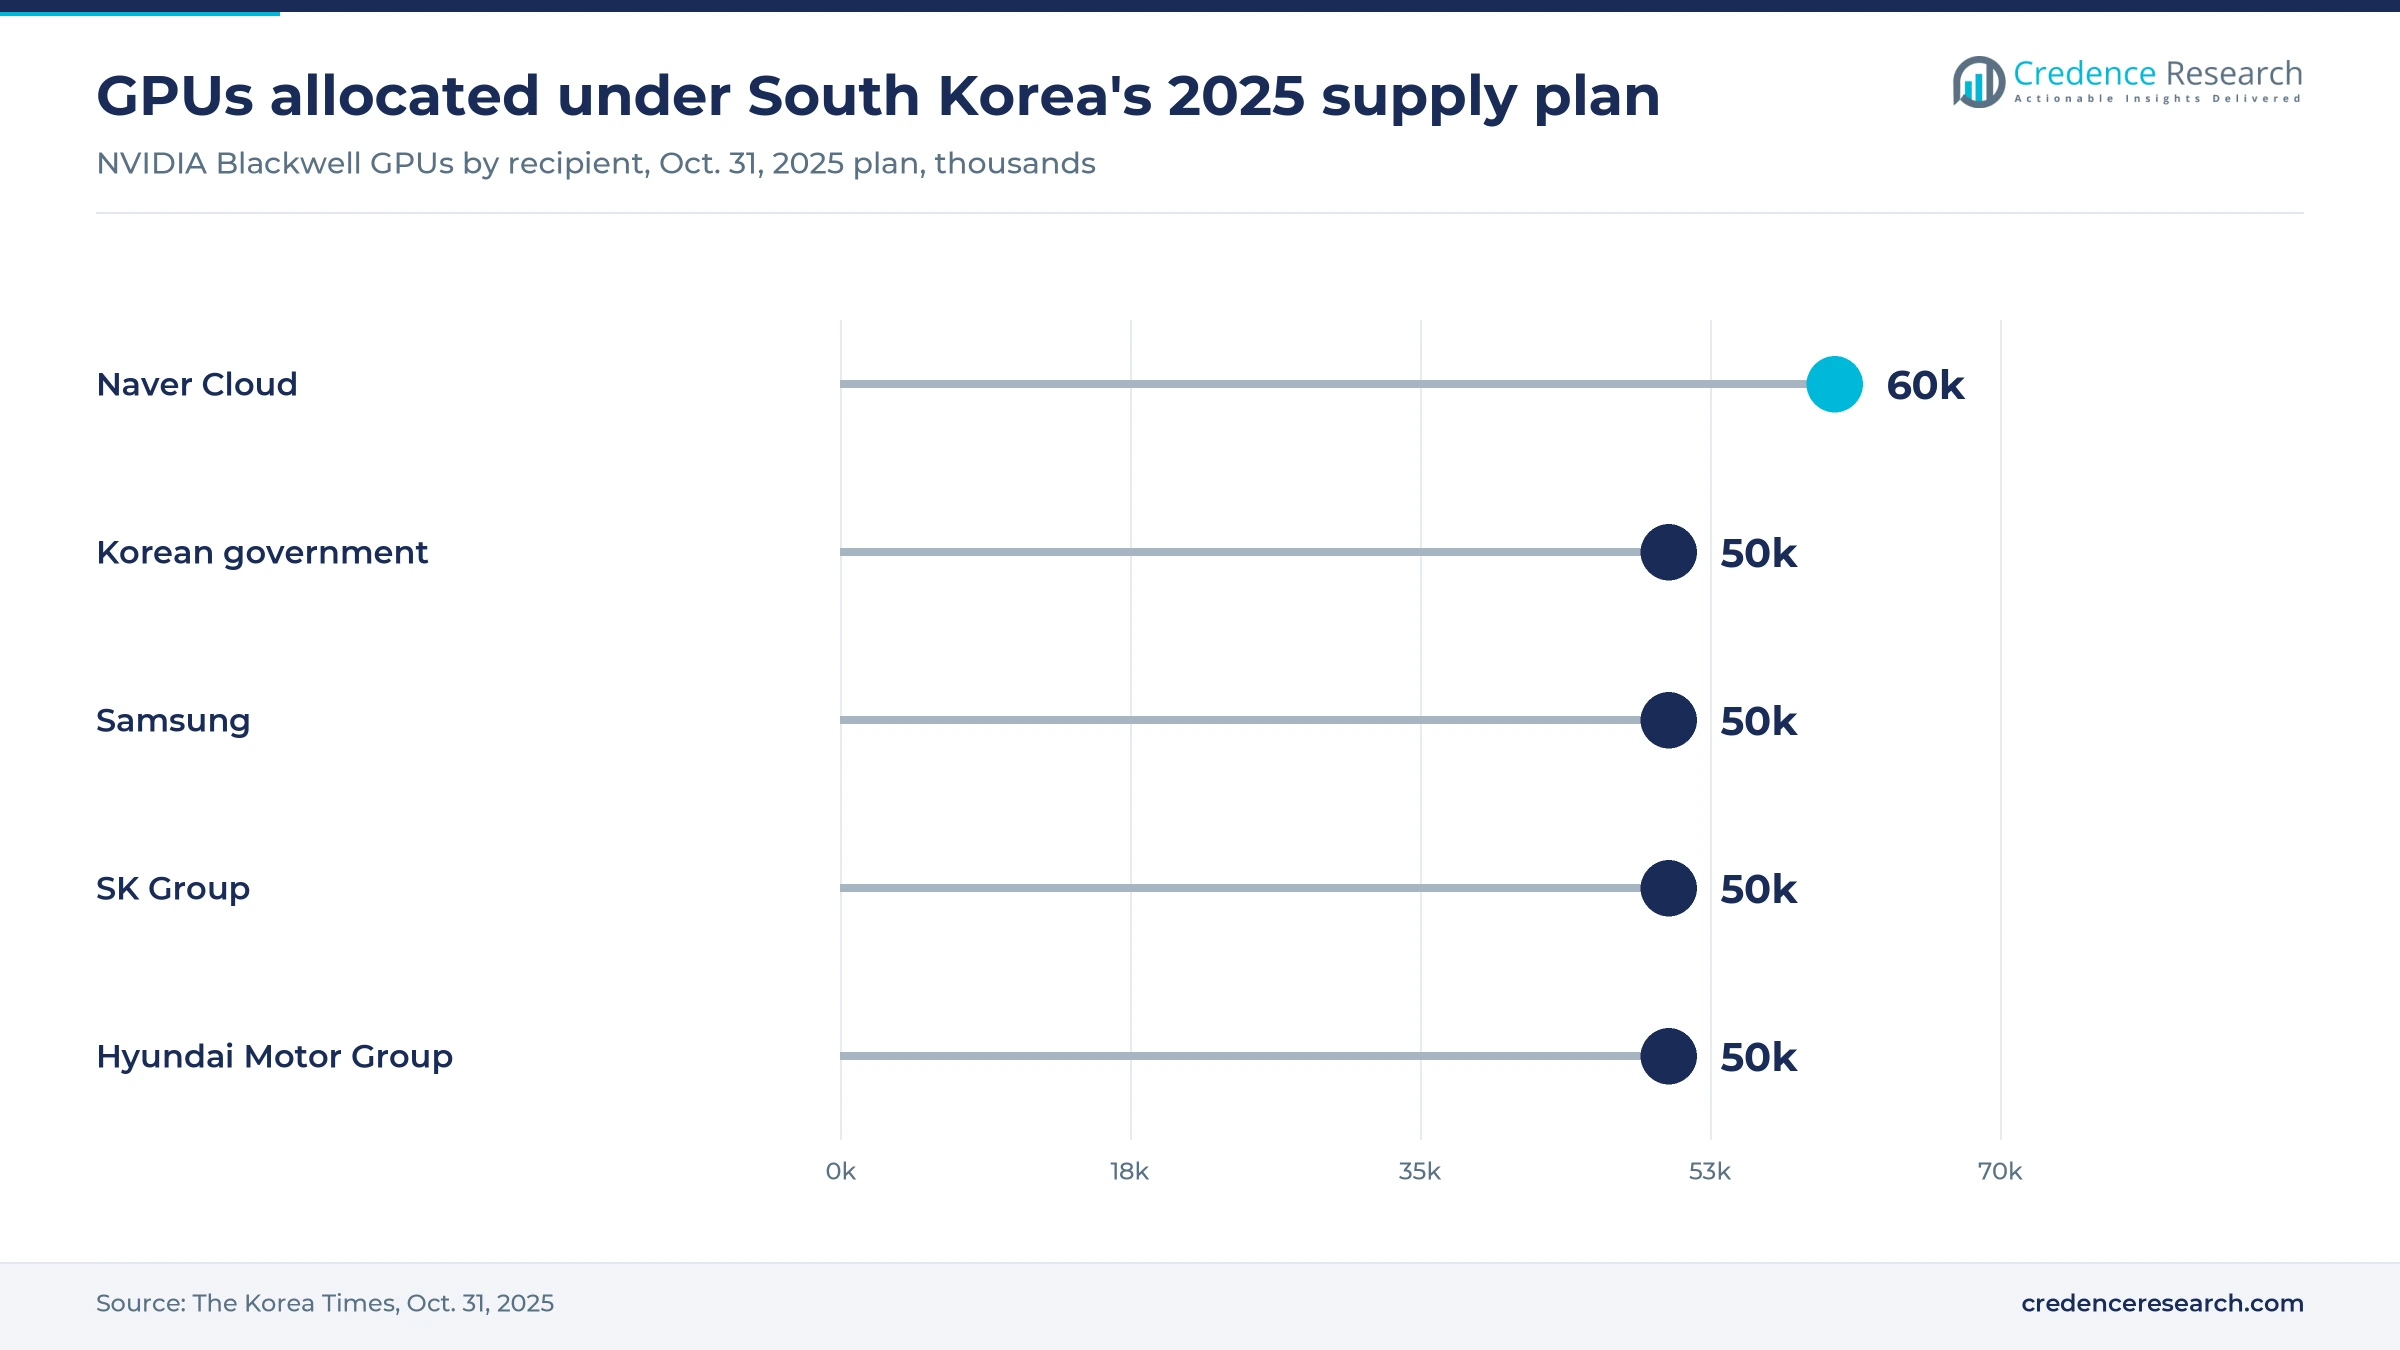
Based on solution type, the market is categorized into orchestration software, inference management software, resource optimization software and workload services. Orchestration Software led with 34.0% of 2025 value because every shared cluster needs queues, quotas and gang scheduling before multiple teams can use it, and South Korea's Oct. 31, 2025 supply plan spreads 260,000 NVIDIA GPUs across five separate recipients. Inference Management Software grows fastest at 35.1% a year as served traffic explodes, and Volcano Engine said daily token calls on its Doubao models passed 30 trillion in late September 2025. Workload services stay relevant wherever in-house platform teams are thin or new.
Public cloud leads while hybrid estates grow fastest
Based on deployment model, the market is categorized into public cloud, hybrid infrastructure and on-premises. Public Cloud led with 52.0% of 2025 value because hyperscale platforms hold most regional accelerators, and Tencent Cloud said on Sept. 16, 2025 that its heterogeneous computing platform supports all mainstream domestic chips. Hybrid Infrastructure grows fastest at 34.8% a year as governments fund domestic GPU clouds that buyers link to their own estates, with Japan approving up to 72.5 billion yen for five such plans in April 2024. On-premises clusters remain common in defense, research and sensitive public workloads.
Digital platforms lead as factories and retailers scale fastest
Based on end-use industry, the market is categorized into financial services, digital technology and telecommunications, manufacturing and retail, and public services and social sectors. Digital Technology and Telecommunications led with 41.0% of 2025 value because cloud and telecom operators run the largest multi-tenant fleets, and Naver Cloud alone will receive 60,000 GPUs under the Korean supply plan. Manufacturing and Retail grows fastest at 34.5% a year as Samsung, SK Group and Hyundai Motor Group each take 50,000 GPUs for AI factories and digital twins, according to The Korea Times. Banks follow closely as model risk rules mature across the region.
Model training leads as production inference grows fastest
Based on application, the market is categorized into model training, production inference and development and validation. Model Training led with 46.0% of 2025 value because national and corporate foundation model programs consume large reserved blocks, and the Korean government takes 50,000 GPUs for public programs that include its national AI foundation model project. Production Inference grows fastest at 35.4% a year as live traffic overtakes training runs, and Baidu moved most of its inference workloads onto a 30,000-card Kunlun P800 cluster in April 2025, Caixin reported. Development and validation work grows with fine-tuning and evaluation demand.
| Segment Group | Leading Sub-segment | Share, 2025 | Fastest-growing Sub-segment | CAGR, 2026–2035 |
|---|---|---|---|---|
| By Solution Type | Orchestration Software | 34.0% | Inference Management Software | 35.1% |
| By Deployment Model | Public Cloud | 52.0% | Hybrid Infrastructure | 34.8% |
| By End-Use Industry | Digital Technology and Telecommunications | 41.0% | Manufacturing and Retail | 34.5% |
| By Application | Model Training | 46.0% | Production Inference | 35.4% |
Per-GPU licenses meet cheap subsidized hours
Workload software is priced per accelerator, per hour of use or per contract, and the reference point is the chip vendor's own stack. NVIDIA lists AI Enterprise at USD 4,500 per GPU per year for self-managed clusters and USD 1 per GPU-hour on cloud marketplaces, on top of instance costs. Those fees look large next to Indian GPU rental, which the IT ministry put at an average of Rs 115.85 an hour in January 2025. Local clouds therefore bundle scheduling into hourly rates, while enterprises with owned clusters accept per-GPU licenses. Vendors earn the best margins on multi-year licenses and governance add-ons rather than on basic queues.
| Offer or segment | Typical price or fee | Basis |
|---|---|---|
| GPU software stack, self-managed (NVIDIA AI Enterprise) | USD 4,500 per GPU per year, USD 18,000 for five years | NVIDIA licensing guide, 2026 |
| GPU software stack, perpetual license | USD 22,500 per GPU with five years of support | NVIDIA licensing guide, 2026 |
| GPU software stack, cloud marketplace | USD 1 per GPU-hour plus cloud instance charges | NVIDIA licensing guide, 2026 |
| Shared GPU compute, India national portal bids | Rs 115.85 average and about Rs 150 high-end per GPU-hour | Ministry of Electronics and IT, via Outlook Business, January 2025 |
| On-demand GPU compute, global reference | USD 2.50 to 3.00 per GPU-hour | Ministry of Electronics and IT comparison, January 2025 |
Request a Free Sample
Fill in your details and we'll send you a free sample report.
- Sample data tables & charts
- Research methodology
Inference traffic and national GPU pools lift spending
Production inference makes model operations continuous
Production deployment turns AI workloads from occasional training jobs into continuous services that need autoscaling, routing, version control and monitoring around the clock. Baidu said its Kunlun P800 cluster reached 30,000 cards in April 2025 and that most of its inference workloads now run on it, according to Caixin. Yotta Data Services added AI endpoints powered by NVIDIA NIM microservices and a Shakti Studio inference platform to its sovereign Shakti Cloud when it joined the IndiaAI Mission in February 2025. Volcano Engine's Doubao models passed 30 trillion daily token calls in late September 2025, which shows the same shift inside Chinese platforms. Each new production model adds recurring demand for serving and observability tools, which is why Production Inference grows at 35.4% a year in the Credence Research model.
Sovereign compute programs create shared GPU estates
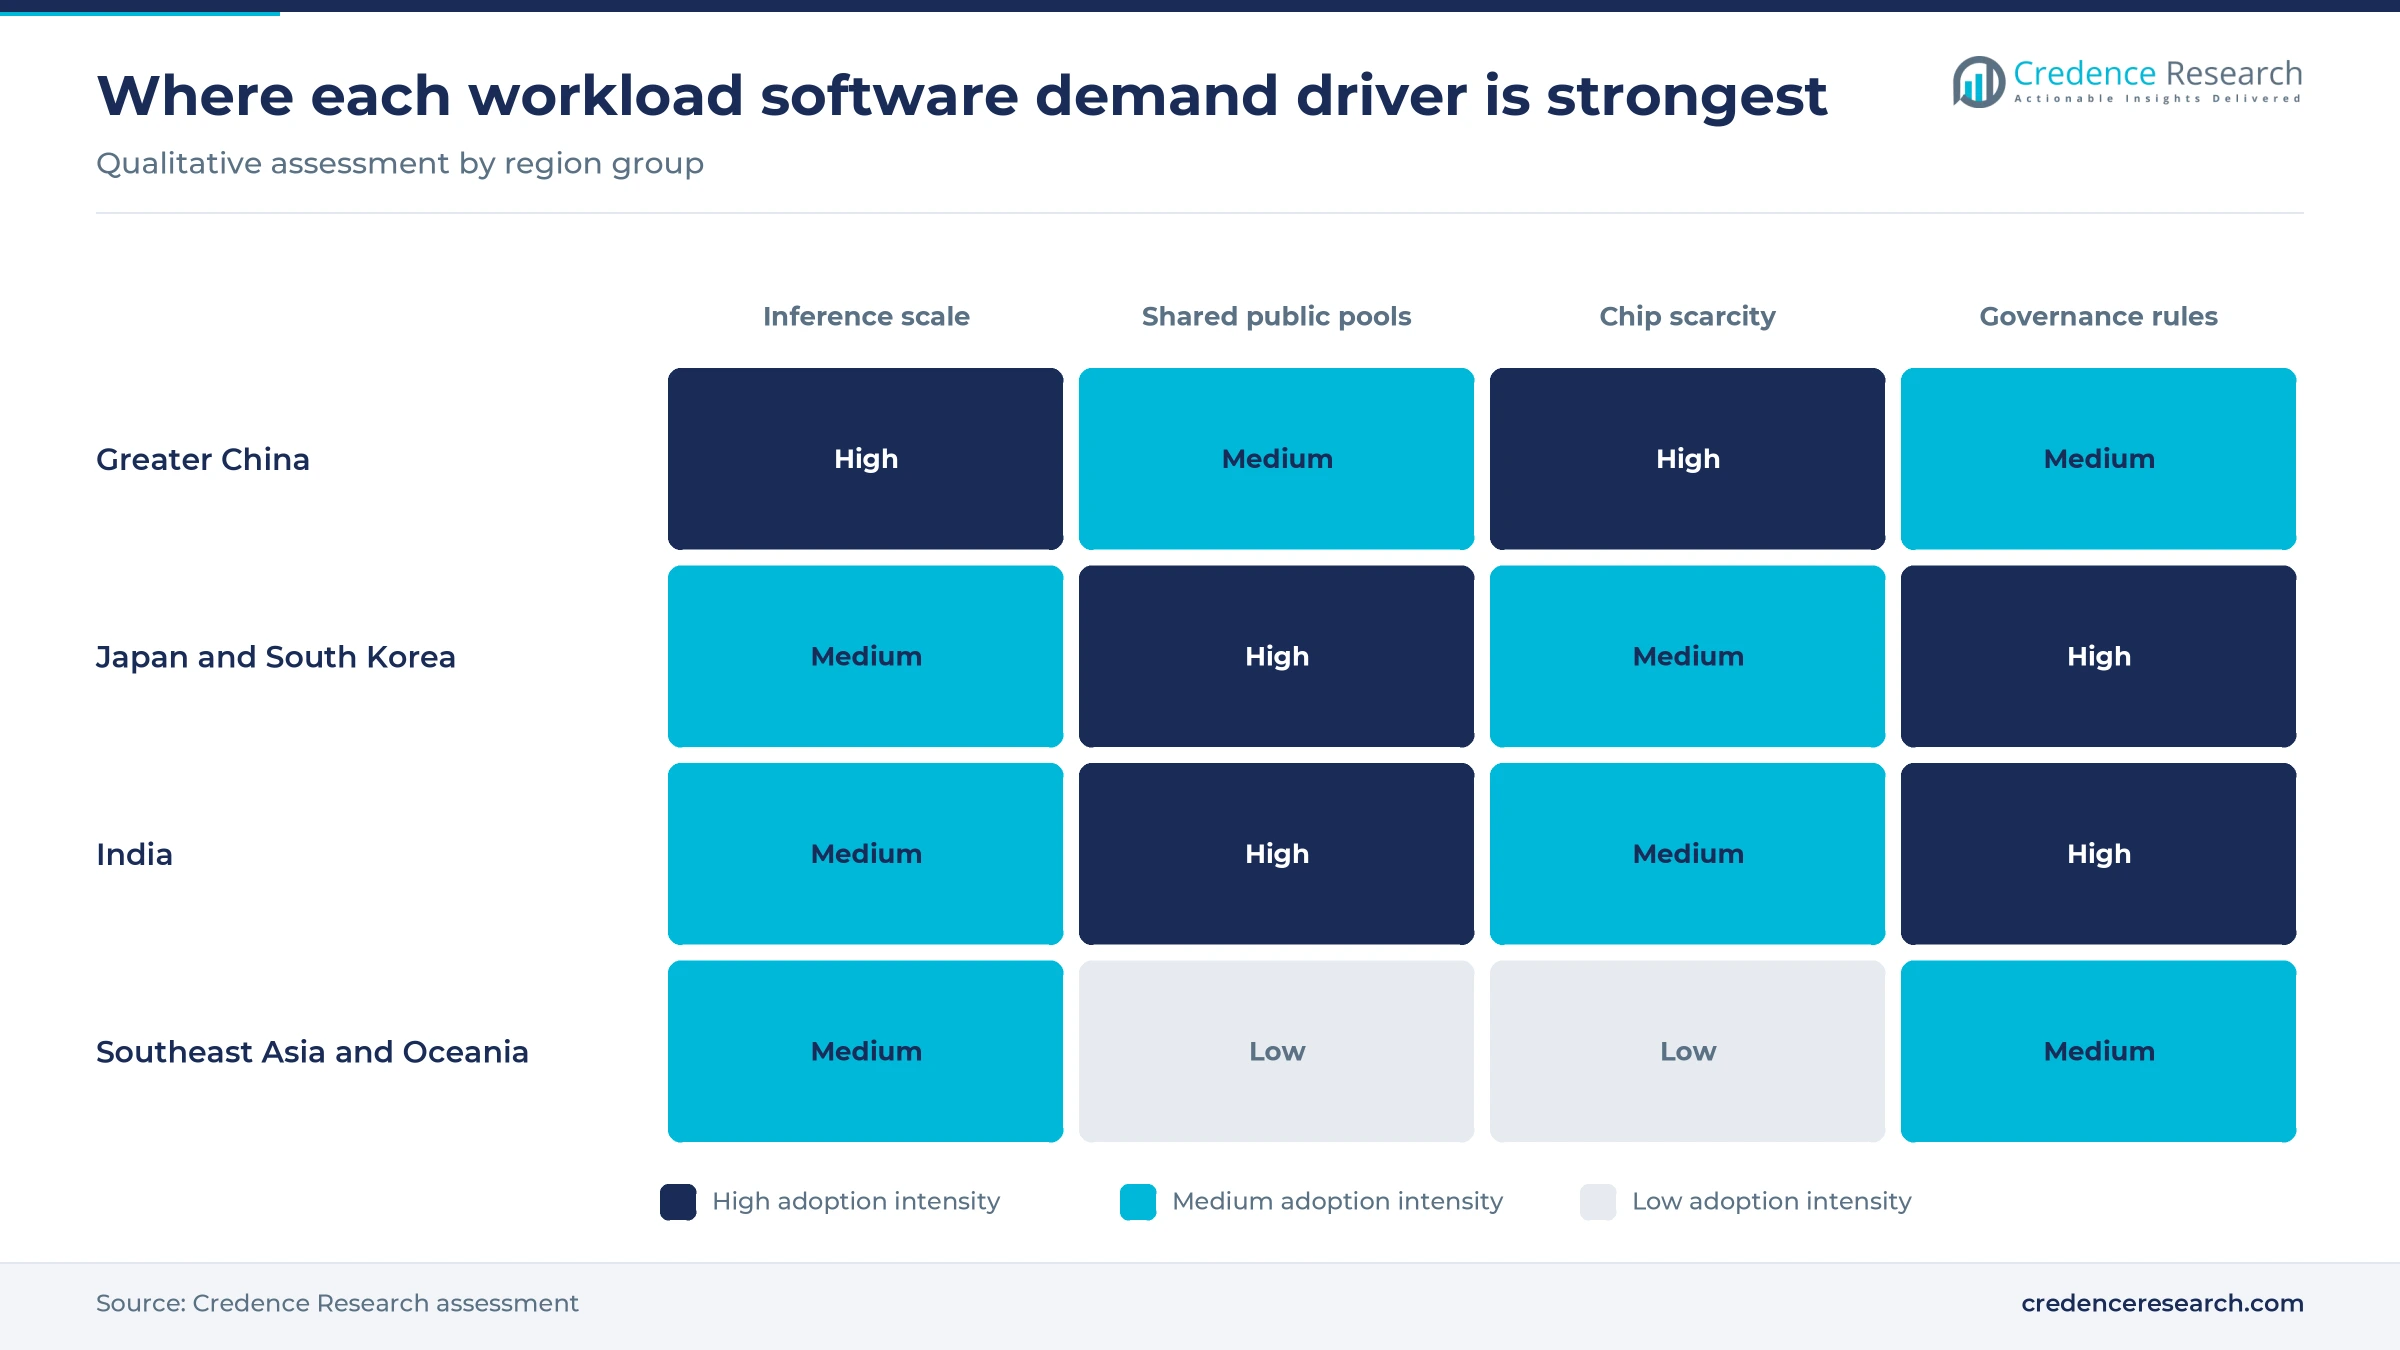
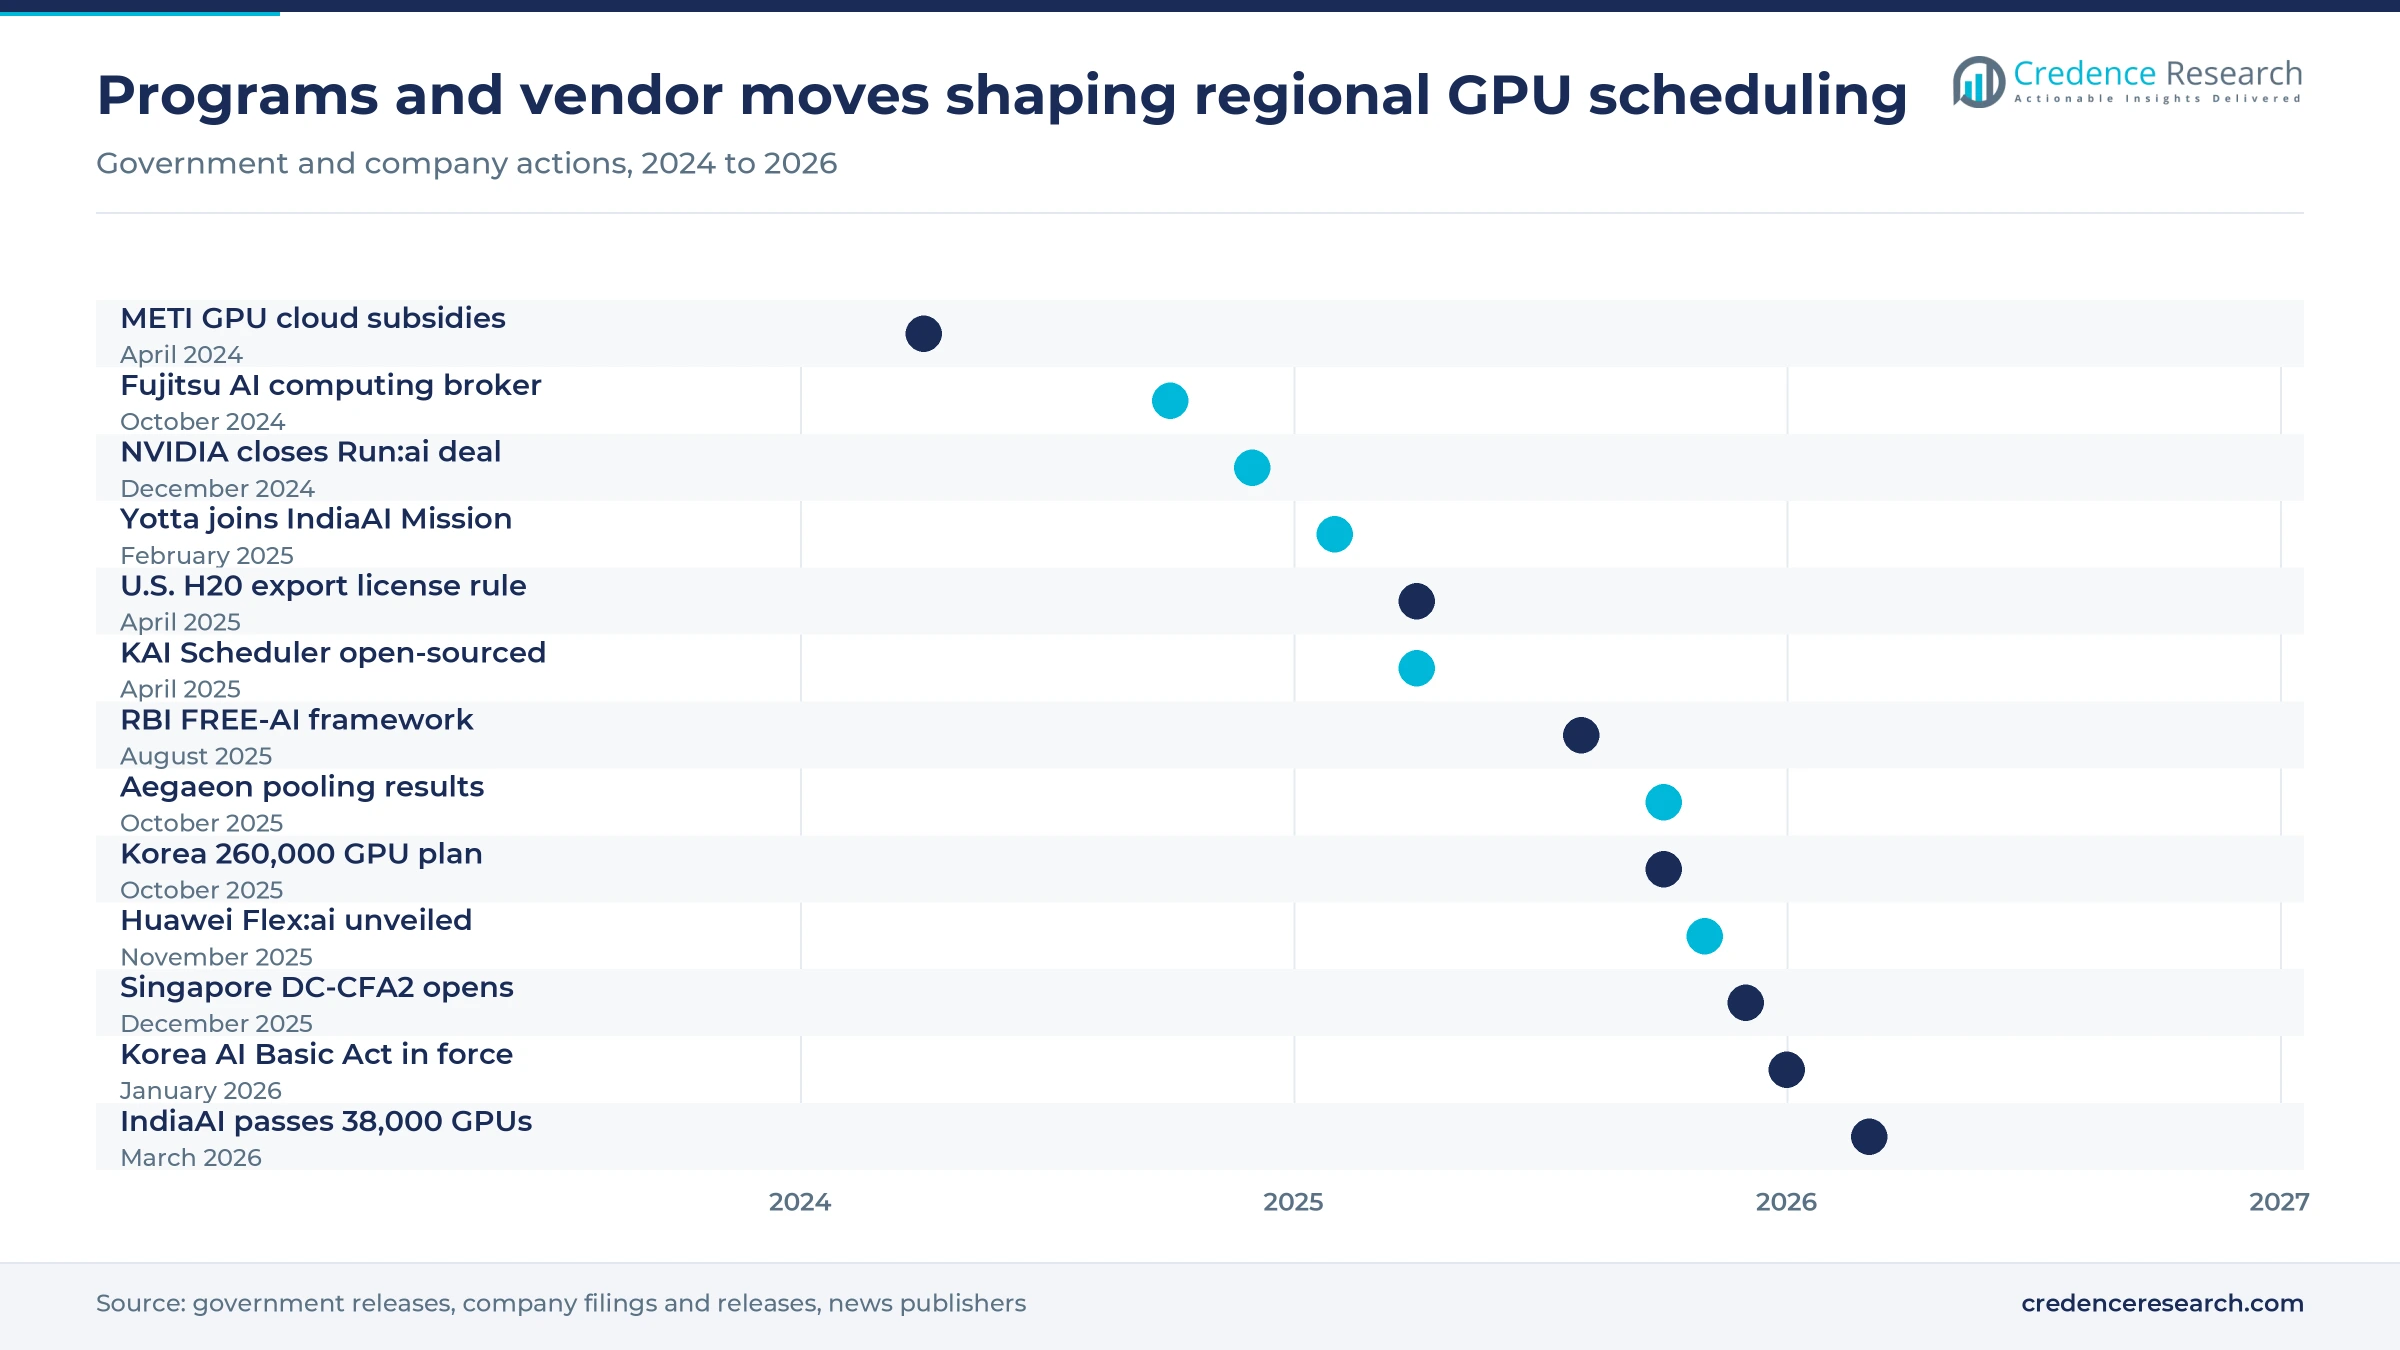
Sovereign compute access programs create large shared estates in which many tenants compete for the same accelerators, so allocation software becomes part of the public procurement. India's Ministry of Electronics and IT said on March 25, 2026 that more than 38,000 GPUs had been onboarded to the IndiaAI compute portal, funded under a Rs 10,372 crore mission. In South Korea, NVIDIA agreed to supply 260,000 Blackwell GPUs on Oct. 31, 2025, with 50,000 reserved for government programs. Japan's METI approved subsidies of up to 72.5 billion yen for five domestic GPU cloud plans in April 2024. Operators of such pools must prove fair access to auditors, which favors vendors with quota, metering and chargeback features.
Scarce chips push utilization and governance tools
Accelerator scarcity makes every idle GPU hour costly, so buyers pay for software that raises utilization and enforces who gets capacity. NVIDIA disclosed in an April 2025 filing that the U.S. government now requires a license, for the indefinite future, to export its H20 chips to China, including Hong Kong and Macau. Huawei answered with Flex:ai on Nov. 21, 2025, an orchestration tool that slices GPU and NPU cards into virtual instances, which Huawei says lifts average utilization by about 30%, Tom's Hardware reported. Fujitsu said its AI computing broker raised computational efficiency up to 2.25 times in trials when it launched on Oct. 22, 2024. Utilization gains now compete directly with buying more data center accelerators.
Hyperscale capex widens the fleets that need scheduling
Hyperscale capital spending widens the fleets that need scheduling, because each added cluster multiplies the jobs, tenants and chip types a control layer must handle. Alibaba said on Feb. 24, 2025 that its planned investment of at least RMB 380 billion over three years exceeds its total AI and cloud spending of the past decade. Baidu set targets in November 2025 for 512-card nodes in 2026 and a one-million-card Kunlun cluster by 2030, Caixin reported. China's National Data Administration put national computing capacity at 280 EFLOPS in 2024, with intelligent computing at 32% of the total. Larger fleets raise the cost of poor placement, so platform vendors spend heavily on in-house schedulers.
GPU pooling and open schedulers reshape the software layer
GPU pooling and model multiplexing are rising fast
GPU pooling is rising as the main lever for serving many models on fewer chips, and Chinese clouds lead the shift because their supply is constrained. Alibaba Cloud said its Aegaeon system cut the GPUs needed to serve tens of models in its marketplace from 1,192 to 213 during several months of testing. The same system packs up to seven models onto one GPU, for models of up to 72 billion parameters, and the work was presented at the 2025 ACM Symposium on Operating Systems Principles in Seoul. Tencent said in September 2025 that its Xingmai network can raise communication efficiency nearly tenfold in large clusters. These results show buyers that software can defer hardware purchases.
Open-source schedulers shift value toward support
Open-source schedulers are shifting value from license fees toward integration, support and managed operation, which changes how vendors price the orchestration layer. NVIDIA completed its purchase of Run:ai on Dec. 30, 2024, and said the software would be opened so that rival chipmakers could adapt it, TechCrunch reported. NVIDIA then released the KAI Scheduler under the Apache 2.0 license on April 1, 2025, with fair-share queues and links to Kubeflow, Ray and Argo. Huawei also plans to publish Flex:ai through its ModelEngine developer community. Free code lowers entry costs for regional GPU clouds, while paid editions compete on multi-cluster control, security and service levels. Integrators with Kubernetes skills gain the most from this shift.
Opportunity in governance tooling for regulated sectors
Governance tooling for regulated buyers is an opening, because new rules ask banks and high-impact AI operators to track models, data and human oversight across the life cycle. The Reserve Bank of India's FREE-AI framework of Aug. 13, 2025, set out 26 recommendations and called for shared infrastructure to widen access to data and compute. South Korea's AI Basic Act took effect on Jan. 22, 2026, requiring high-impact AI operators to keep human supervision and document safety measures, according to Cooley. The act also flags systems trained with at least 10²⁶ operations for risk plans. Workload platforms that log job lineage, access and model versions can sell into these audit needs at higher prices than plain scheduling.
Opportunity in managed operations for new GPU clouds
Managed workload services for new local GPU clouds are an opening, because many subsidized operators own hardware but lack mature scheduling teams. METI's approvals included up to 50.1 billion yen for SAKURA internet and 10.24 billion yen for KDDI. Fujitsu said SAKURA internet began a feasibility study of its AI computing broker for data centers, and TRADOM started using it in October 2024. In India, Yotta committed 9,216 GPUs, including 8,192 H100 units, to the national mission. YTL Power said in October 2025 that about 200 local startups were working to connect to the APIs of its new YTL AI Cloud in Johor. Vendors that bundle scheduling, metering and support can earn recurring fees on each of these estates.
Chip splits, power limits and cheap GPU hours hurt sellers
Split chip ecosystems raise integration costs
Split chip ecosystems raise integration costs because a scheduler must support NVIDIA GPUs alongside Ascend, Kunlun and other domestic accelerators. Tencent Cloud's adaptation of its platform to all mainstream domestic chips, noted above, shows how large that engineering task is. Huawei built Flex:ai, unveiled on Nov. 21, 2025, on Kubernetes specifically to add Ascend NPU support next to standard GPUs. Smaller vendors struggle to certify every chip and driver, so buyers in China often stay with platform-owned tools.
Power and site limits cap cluster growth
Power and site limits cap the size of new clusters, which slows the arrival of fresh capacity that workload software would manage. Singapore's Economic Development Board and IMDA opened a second data center call for application on Dec. 1, 2025, offering at least 200 MW, with more only for new green energy pathways. Operators therefore move AI capacity to Johor and other sites with land and power. Buyers face multi-site estates, which raises demand for cross-region scheduling but delays some projects.
Subsidized GPU hours squeeze software pricing
Subsidized GPU hours squeeze software pricing because buyers compare total cost per hour and expect scheduling to come bundled. India's IT minister said on Jan. 30, 2025 that a 40% subsidy would bring GPU compute below Rs 100 an hour for students, startups and researchers, Outlook Business reported. Local clouds bidding at such rates have little room to pay for separate licenses. Vendors respond with usage-based tiers and open-source cores that charge only for support.
Vendor concentration draws antitrust attention
Vendor concentration worries buyers who fear lock-in at the control layer, since one chip vendor now owns a leading scheduler. Both the European Commission and the U.S. Department of Justice examined NVIDIA's Run:ai purchase before the European Commission cleared it in December 2024, TechCrunch reported. Before the deal, Run:ai software worked only with NVIDIA products. Buyers in the region now ask for open interfaces and multi-vendor support in tenders, which lengthens sales cycles for proprietary tools.
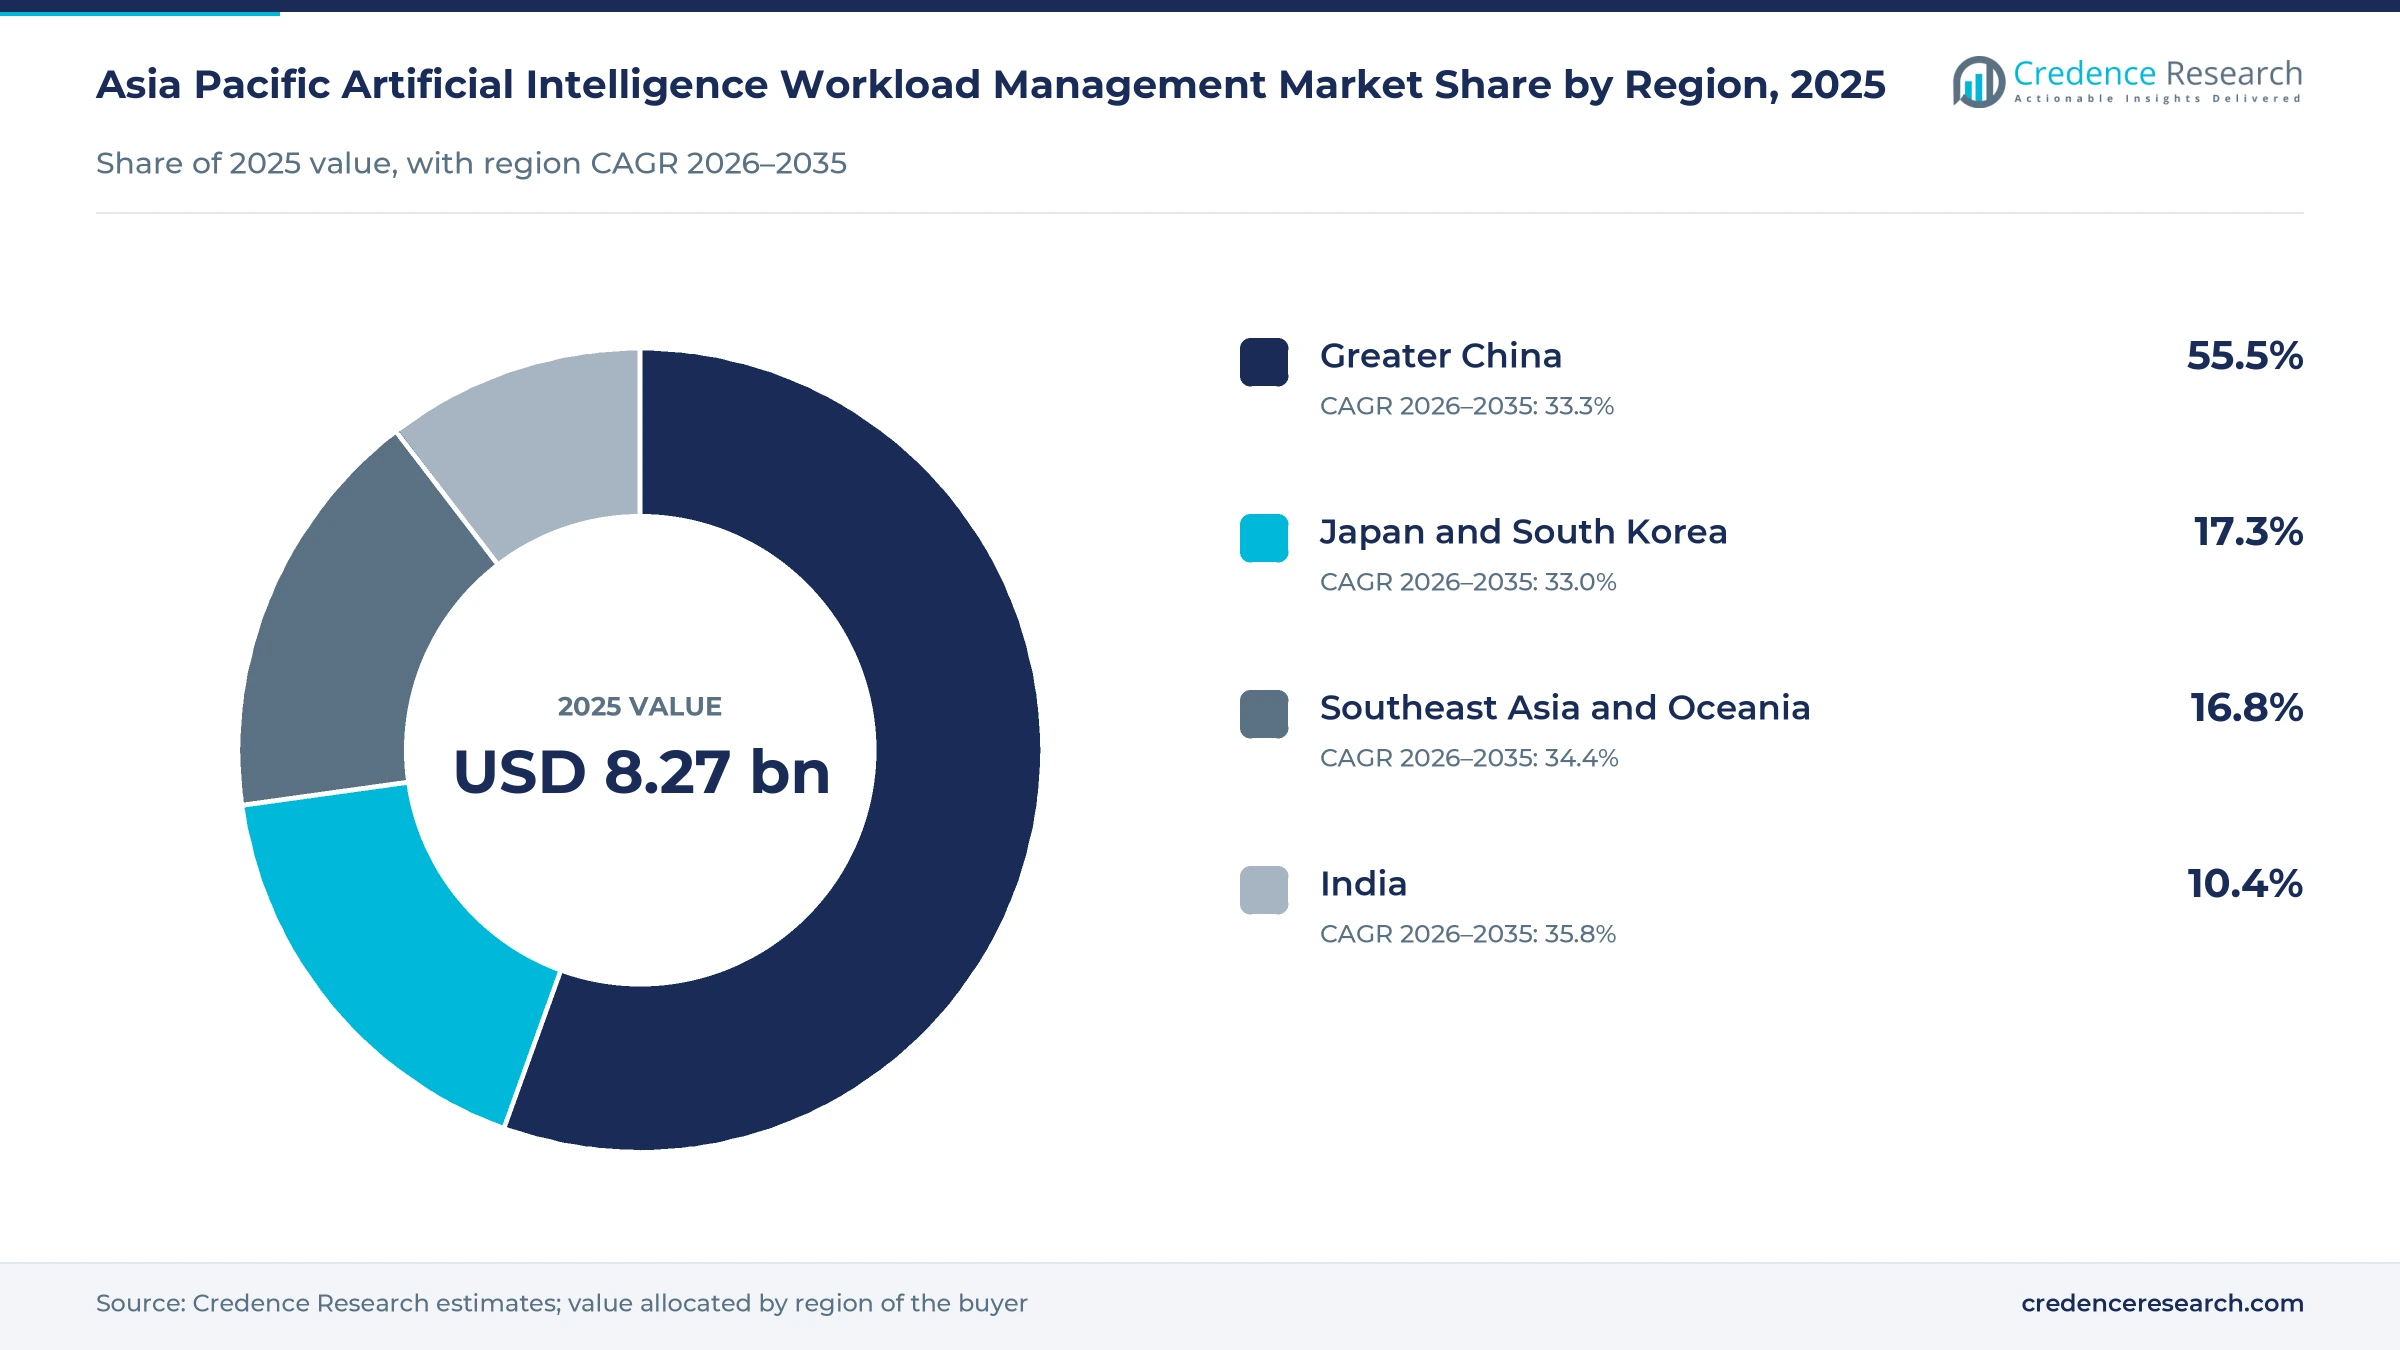
Greater China dominates as India grows fastest
| Region | Value, 2025 (USD billion) | Share, 2025 | CAGR, 2026–2035 |
|---|---|---|---|
| Greater China | 4.59 | 55.5% | 33.3% |
| Japan and South Korea | 1.43 | 17.3% | 33.0% |
| Southeast Asia and Oceania | 1.39 | 16.8% | 34.4% |
| India | 0.86 | 10.4% | 35.8% |
Greater China leads on fleet scale and domestic chips
Greater China held 55.5% of 2025 value and grows at 33.3% a year because Alibaba, Baidu, Tencent, ByteDance and Huawei run the region's largest accelerator fleets. The group spans mainland China, Hong Kong, Macau and Taiwan, and its weight rests on the 280 EFLOPS national computing base noted above. Export licensing forces these platforms to mix domestic and imported chips, which raises the value of pooling schedulers. Huawei developed Flex:ai with researchers from Shanghai Jiao Tong, Xi'an Jiaotong and Xiamen universities. Growth trails India because large platforms already build their own control layers.
Japan and South Korea build sovereign GPU clouds
Japan and South Korea held 17.3% of 2025 value and grow at 33.0% a year, the slowest pace, because large research and telecom estates are already managed. Japan's AIST built ABCI 3.0 with thousands of NVIDIA H200 GPUs and about 6 AI exaflops for national research, NVIDIA said in July 2024. Such machines join other high-performance computing systems that now queue AI training jobs. Korean demand centers on the Blackwell supply plan noted above, with Naver Cloud the largest single recipient. Subsidized domestic clouds keep spending local and favor partners of SAKURA internet, KDDI and Naver Cloud.
India grows fastest on a subsidized compute portal
India held 10.4% of 2025 value and is the fastest region at 35.8% a year, as the IndiaAI portal turns tens of thousands of GPUs into a shared national pool. Startups, researchers and model builders draw on that pool and on rented GPU capacity in India through empaneled providers such as Yotta, whose Shakti Cloud offers bare metal, clusters and serverless GPUs. Banks add governance demand after the Reserve Bank framework noted above. Low hourly rates keep license budgets thin, so growth leans on usage-based pricing and managed services.
Southeast Asia and Oceania gain from new AI campuses
Southeast Asia and Oceania held 16.8% of 2025 value and grow at 34.4% a year as new AI campuses open outside Singapore. YTL Power commissioned its first NVIDIA-powered AI data center in Kulai, Johor, in October 2025, running liquid-cooled GB200 NVL72 systems backed by a 500 MW solar plant, W.Media reported. Singapore keeps control functions and regional headquarters while capacity moves across the border. Multi-site estates across Johor, Singapore and Australia raise demand for governed, cross-border scheduling.
Schedulers changed hands and went open source
| Development | Status and market relevance |
|---|---|
| In December 2024, NVIDIA completed its acquisition of Run:ai after European Commission clearance and said the software would be opened to other chipmakers. | Completed, giving NVIDIA a leading GPU orchestration platform sold to regional clouds and enterprises. |
| In April 2025, NVIDIA disclosed that a U.S. license requirement for H20 exports to China, including Hong Kong and Macau, will apply for the indefinite future. | In force, and it pushes Chinese platforms to pool mixed domestic and imported chips. |
| In April 2025, NVIDIA released the KAI Scheduler, the core of Run:ai, as open-source software under the Apache 2.0 license. | Released, lowering entry costs for Kubernetes-based GPU clouds across the region. |
| In October 2025, Alibaba Cloud presented its Aegaeon GPU pooling system, which cut GPUs for a model marketplace from 1,192 to 213. | Tested for several months in Alibaba Cloud's model marketplace, showing the savings from inference multiplexing. |
| In November 2025, Huawei unveiled Flex:ai, an open orchestration tool that pools GPU and NPU cards across clusters. | Announced for release through the ModelEngine community, aimed at Ascend-based estates in China. |
Fractional GPUs and model swapping change cluster costs
- Fractional GPU sharing slices one accelerator into several virtual instances, so small inference jobs no longer hold a full card idle.
- Gang scheduling with fair-share queues starts distributed training only when all required GPUs are free and returns idle quota to other teams.
- Model multiplexing for inference swaps many models on and off the same GPUs in seconds, which suits long-tail model marketplaces.
- Heterogeneous chip abstraction lets one control plane schedule NVIDIA GPUs, Ascend NPUs and Kunlun chips through common Kubernetes interfaces.
Need a Custom Version of This Report?
Tailor the scope, geography, or segments to your exact requirements.
- Custom geography or segment scope
- Direct access to our analyst team
Cloud platforms and chip vendors own the control plane
Competition in Asia Pacific workload management is decided by who controls the cluster, because the owner of the hardware or the cloud account usually chooses the scheduler. NVIDIA sells Run:ai and its AI Enterprise stack into regional clouds and enterprise data centers, while Alibaba, Baidu, Tencent and Huawei use in-house pooling and orchestration to stretch constrained chip supply. Fujitsu competes with GPU broker middleware for Japanese clouds, and SAKURA internet and KDDI bundle management with subsidized capacity. NAVER Cloud and Yotta package scheduling, endpoints and support with sovereign GPU estates, competing with hosted machine learning services from global clouds. Buyers compare utilization gains, chip support, governance features and total cost per GPU-hour. Switching costs are moderate for open-source cores but high for monitoring, quota and audit data built around one platform.
Platform owners hold the control plane while specialists fill gaps
Supply in regional workload management is organized in three distinct layers. Chip and cloud platform owners such as NVIDIA, Alibaba, Huawei, Baidu and Tencent build their own schedulers and inference stacks, and they hold most of the value because the tools ship with the hardware or the cloud account. Japanese and Indian systems vendors and GPU clouds, including Fujitsu, SAKURA internet, KDDI and Yotta, add middleware and managed operation for local buyers. Integrators sit at the edge with Kubernetes and open-source skills. Barriers are high at the top layer because chip support and scale testing are costly, while margins sit in licenses and governance modules.
Companies profiled and their roles in this market
| Company | Type | Role in the market |
|---|---|---|
| Alibaba Group | Cloud platform operator | Runs Alibaba Cloud model services and the Aegaeon GPU pooling system |
| NVIDIA Corporation | Accelerator and software vendor | Sells Run:ai and AI Enterprise and open-sourced the KAI Scheduler |
| Huawei Technologies Co., Ltd. | Accelerator and cloud vendor | Offers Flex:ai orchestration for Ascend NPU and GPU clusters |
| Baidu, Inc. | Cloud platform operator | Runs its inference on in-house Kunlun chip clusters |
| Tencent Holdings Ltd. | Cloud platform operator | Runs a heterogeneous computing platform adapted to domestic chips |
| Fujitsu Limited | Systems and middleware vendor | Sells the AI computing broker for per-GPU allocation in Japan |
| SAKURA internet Inc. | Domestic GPU cloud operator | Builds METI-subsidized GPU cloud capacity in Japan |
| KDDI Corporation | Telecom and cloud operator | Builds a METI-subsidized GPU cloud service in Japan |
| NAVER Cloud Corporation | Cloud platform operator | Largest single recipient under the Korean GPU supply plan |
| Yotta Data Services Pvt. Ltd. | Sovereign GPU cloud operator | Supplies 9,216 GPUs and inference endpoints to the IndiaAI Mission |
Utilization software is now worth more than raw capacity
Credence Research's view is that workload management software, not raw capacity, will decide returns on AI infrastructure in Asia Pacific over the next decade. Chip export rules, power limits and subsidized pricing all make each accelerator hour more valuable to use well. Platform owners will keep most value in China, but national GPU pools in India, Japan and Korea open room for independent and integrator-led offers. The open-sourcing of leading schedulers moves profit toward governance, multi-cluster control and managed operation. Buyers should ask vendors for measured utilization gains on their own mix of chips before signing multi-year licenses.
Model values rest on capex, program and vendor evidence
The report uses 2025 as the base year and 2026 to 2035 as the forecast period. Market values come from the Credence Research model, and regional, solution, deployment, industry and application splits are Credence Research estimates informed by public data. Sources include government and regulator releases, company filings and press releases, vendor price lists and regional news publishers. No interviews or surveys were used to build these estimates.
Inference-heavy fleets set the pace to 2035
Credence Research expects the market to reach USD 151.93 billion by 2035 as inference traffic and shared national GPU pools keep growing across the region. India should keep the fastest pace, while Greater China remains the largest source of value because of its fleet scale. Workload management spending will move toward inference tools, hybrid estates and governance features demanded by banks and public agencies. Open-source cores will cut entry prices, so vendors will earn more from support and audit modules. A sharp fall in GPU prices is the main risk, because cheaper chips would weaken the case for paid utilization tools.
Chip supply and inference uptake set the range to 2035
The range of outcomes depends mainly on how fast production inference spreads beyond the large platforms and on whether chip supply stays tight. Tight supply raises the value of utilization software, while fast inference adoption multiplies the services that need routing and monitoring. A sharp easing of chip prices, or a shift to platform-bundled tools at zero cost, would slow paid growth.
| Scenario | CAGR, 2026–2035 | Value, 2035 | What has to hold |
|---|---|---|---|
| Downside | 29.7% | USD 115.61 billion | Chip prices fall sharply, platforms bundle scheduling free and enterprise inference stays in pilots |
| Base | 33.74% | USD 151.93 billion | Inference keeps overtaking training and national GPU pools expand on current program budgets |
| Upside | 36.7% | USD 185.52 billion | Agent workloads spread across banks and factories while accelerator supply stays tight through 2030 |
Frequently Asked Questions
How big is the Asia Pacific AI workload management market?
Which region leads the market?
Which region is growing fastest?
Which solution type holds the largest share?
Why does GPU pooling matter to buyers?
What holds the market back?
How is workload software priced in the region?
Who are the main companies in this market?
Table of Content
Chapter 1 Market Segmentation
- 1.1 Segmentation Framework
- 1.1.1 Product and Service Classification
- 1.1.2 Application and End-Use Classification
- 1.1.3 Technology and Solution Classification
- 1.1.4 Customer and Distribution Channel Classification
- 1.1.5 Geographic Segmentation
- 1.1.6 Market Segment Definitions and Boundaries
- 1.2 By Solution Type
- 1.2.1 Orchestration Software
- 1.2.2 Inference Management Software
- 1.2.3 Resource Optimization Software
- 1.2.4 Workload Services
- 1.3 By Deployment Model
- 1.3.1 Public Cloud
- 1.3.2 Hybrid Infrastructure
- 1.3.3 On-Premises
- 1.4 By End-Use Industry
- 1.4.1 Digital Technology and Telecommunications
- 1.4.2 Financial Services
- 1.4.3 Manufacturing and Retail
- 1.4.4 Public Services and Social Sectors
- 1.5 By Application
- 1.5.1 Model Training
- 1.5.2 Production Inference
- 1.5.3 Development and Validation
Chapter 2 Introduction
- 2.1 Report Objectives and Scope
- 2.2 Product Definition and Industry Terminology
- 2.3 Market Inclusions and Exclusions
- 2.4 Research Process
- 2.4.1 Primary Research and Expert Interviews
- 2.4.2 Secondary Research and Source Review
- 2.4.3 Top-Down and Bottom-Up Estimation
- 2.4.4 Data Triangulation and Verification
- 2.5 Market Size Measurement Basis
- 2.5.1 2025: USD 8.27 billion → 2035: USD 151.93 billion
- 2.6 Historical and Forecast Reference Periods
- 2.6.1 Historical Period: 2018-2025
- 2.6.2 Base Year: 2025
- 2.6.3 Forecast Period: 2025-2035
- 2.7 Research Assumptions and Limitations
Chapter 3 Executive Summary
- 3.1 Market Snapshot and Key Findings
- 3.2 Base-Year Market Size, 2025
- 3.3 Forecast Market Size, 2035
- 3.4 Revenue and Volume Growth Outlook
- 3.5 Key Demand and Supply Indicators
- 3.6 Leading Market Segments
- 3.7 Fastest-Growing Market Opportunities
- 3.8 Regional Performance Highlights
- 3.9 Technology and Industry Transformation
- 3.10 Competitive Landscape Summary
- 3.11 Analyst View and Strategic Implications
Chapter 4 Asia Pacific Artificial Intelligence Workload Management Market Trends and Developments
- 4.1 Historical Industry Development, 2018-2025
- 4.2 Recent Market Trends and Developments
- 4.3 Demand and Customer Behavior Trends
- 4.4 Technology and Product Innovation
- 4.5 Artificial Intelligence, Automation and Digitalization
- 4.6 Local Manufacturing and Supply Chain Realignment
- 4.7 Industry Partnerships, Mergers and Acquisitions
- 4.8 Sustainability and Circular Economy Developments
- 4.9 Government and Private Sector Investment Trends
- 4.10 Emerging Business Models and Commercialization
- 4.11 Industry Developments and Announcements
Chapter 5 Asia Pacific Artificial Intelligence Workload Management Market Supply and Demand Analysis
- 5.1 Demand Trend and Consumption Analysis, 2018-2025
- 5.2 Demand Forecast, 2025-2035
- 5.3 Supply Chain Structure and Procurement Trends
- 5.4 Supply-Demand Gap and Bottlenecks
- 5.5 Import Dependence and Sourcing Structure
- 5.6 Regional Supply and Demand Concentration
Chapter 6 Asia Pacific Artificial Intelligence Workload Management Market Pricing Analysis
- 6.1 Pricing Structure and Measurement
- 6.2 Historical Pricing Trends, 2018-2025
- 6.3 Pricing Outlook, 2025-2035
- 6.4 Pricing by Product and Market Segment
- 6.5 Geographic Pricing Differences
- 6.6 Key Input, Energy, Labor and Logistics Costs
- 6.7 Contract Pricing and Purchasing Models
- 6.8 Pricing Sensitivity and Competitive Positioning
- 6.9 Price, Margin and Profitability Implications
Chapter 7 Asia Pacific Artificial Intelligence Workload Management Market Dynamics
- 7.1 Market Growth Drivers
- 7.1.1 Demand-Side Drivers
- 7.1.2 Technology and Innovation Drivers
- 7.1.3 Infrastructure and Investment Drivers
- 7.1.4 Regulatory and Policy Drivers
- 7.2 Market Restraints
- 7.2.1 Cost and Affordability Constraints
- 7.2.2 Technology and Adoption Barriers
- 7.2.3 Supply Chain and Operational Constraints
- 7.3 Market Challenges
- 7.3.1 Competitive Pressure and Margin Erosion
- 7.3.2 Skills, Infrastructure and Implementation Gaps
- 7.4 Emerging Market Opportunities
- 7.5 Market Dynamics Impact and Time-Horizon Assessment
Chapter 8 Asia Pacific Artificial Intelligence Workload Management Value Chain Analysis
- 8.1 Industry Value Chain Overview
- 8.2 Upstream Suppliers and Critical Inputs
- 8.3 Technology and Component Providers
- 8.4 Manufacturing or Service Delivery
- 8.5 Distribution, Channel Partners and Integrators
- 8.6 Downstream Applications and End Users
- 8.7 Value Addition and Profit Pools
- 8.8 Vertical Integration and Outsourcing
- 8.9 Supplier Concentration and Risk
- 8.10 Supply Chain Localization and Resilience
Chapter 9 Asia Pacific Artificial Intelligence Workload Management Market Regulations and Policies
- 9.1 Relevant Laws, Standards and Compliance Frameworks
- 9.2 Product, Service, Safety and Quality Requirements
- 9.3 Government Policies, Incentives and Subsidies
- 9.4 Imports, Exports and Trade Barriers
- 9.5 Public Procurement and Local Content Requirements
- 9.6 Data Protection, AI and Cybersecurity Compliance
- 9.7 Upcoming Policy Changes and Market Implications
Chapter 10 Asia Pacific Artificial Intelligence Workload Management Market Hotspots and Opportunities
- 10.1 Market Opportunity Mapping and Growth Hotspots
- 10.2 High-Growth Applications and Customer Groups
- 10.3 Underserved Markets and White-Space Opportunities
- 10.4 Emerging Technology and Product Opportunities
- 10.5 New Capacity and Investment Hotspots
- 10.6 Market Entry and Expansion Opportunities
- 10.7 Distribution and Partnership Opportunities
- 10.8 Near-Term and Long-Term Commercial Potential
- 10.9 Opportunity Attractiveness and Execution Risks
Chapter 11 Asia Pacific Artificial Intelligence Workload Management Market Outlook, 2025-2035
- 11.1 Market Size and Analysis
- 11.1.1 Revenue (Market Measurement: 2025: USD 8.27 billion → 2035: USD 151.93 billion)
- 11.1.2 Historical Market Size, 2018-2025
- 11.1.3 Base-Year Market Size, 2025
- 11.2 Market Forecast, 2025-2035
- 11.2.1 Revenue Forecast to 2035
- 11.2.2 CAGR and Year-on-Year Growth
- 11.2.3 Incremental Revenue Opportunity
- 11.3 Forecast Assumptions and Scenario Analysis
- 11.3.1 Base-Case Forecast
- 11.3.2 Optimistic and Conservative Scenarios
- 11.3.3 Technology, Pricing and Policy Sensitivities
- 11.4 Market Attractiveness and Growth Outlook
Chapter 12 Asia Pacific Artificial Intelligence Workload Management Market Segmentation and Outlook
- 12.1 Segmentation Summary and Market Shares, 2025
- 12.2 Largest and Fastest-Growing Segments
- 12.3 By Solution Type - Market Size and Forecast, 2025-2035
- 12.3.1 Segment Definition and Scope
- 12.3.2 Historical Market Size, 2018-2025
- 12.3.3 Revenue Forecast, 2025-2035
- 12.3.4 Base-Year Market Share, 2025
- 12.3.5 Segment CAGR and Growth Drivers
- 12.3.6 Subsegment Market Size and Forecast
- 12.3.6.1 Orchestration Software
- 12.3.6.2 Inference Management Software
- 12.3.6.3 Resource Optimization Software
- 12.3.6.4 Workload Services
- 12.3.7 Subsegment Pricing and Adoption Trends
- 12.3.8 Leading Suppliers and Competition
- 12.3.9 Regional Demand and Opportunities
- 12.4 By Deployment Model - Market Size and Forecast, 2025-2035
- 12.4.1 Segment Definition and Scope
- 12.4.2 Historical Market Size, 2018-2025
- 12.4.3 Revenue Forecast, 2025-2035
- 12.4.4 Base-Year Market Share, 2025
- 12.4.5 Segment CAGR and Growth Drivers
- 12.4.6 Subsegment Market Size and Forecast
- 12.4.6.1 Public Cloud
- 12.4.6.2 Hybrid Infrastructure
- 12.4.6.3 On-Premises
- 12.4.7 Subsegment Pricing and Adoption Trends
- 12.4.8 Leading Suppliers and Competition
- 12.4.9 Regional Demand and Opportunities
- 12.5 By End-Use Industry - Market Size and Forecast, 2025-2035
- 12.5.1 Segment Definition and Scope
- 12.5.2 Historical Market Size, 2018-2025
- 12.5.3 Revenue Forecast, 2025-2035
- 12.5.4 Base-Year Market Share, 2025
- 12.5.5 Segment CAGR and Growth Drivers
- 12.5.6 Subsegment Market Size and Forecast
- 12.5.6.1 Digital Technology and Telecommunications
- 12.5.6.2 Financial Services
- 12.5.6.3 Manufacturing and Retail
- 12.5.6.4 Public Services and Social Sectors
- 12.5.7 Subsegment Pricing and Adoption Trends
- 12.5.8 Leading Suppliers and Competition
- 12.5.9 Regional Demand and Opportunities
- 12.6 By Application - Market Size and Forecast, 2025-2035
- 12.6.1 Segment Definition and Scope
- 12.6.2 Historical Market Size, 2018-2025
- 12.6.3 Revenue Forecast, 2025-2035
- 12.6.4 Base-Year Market Share, 2025
- 12.6.5 Segment CAGR and Growth Drivers
- 12.6.6 Subsegment Market Size and Forecast
- 12.6.6.1 Model Training
- 12.6.6.2 Production Inference
- 12.6.6.3 Development and Validation
- 12.6.7 Subsegment Pricing and Adoption Trends
- 12.6.8 Leading Suppliers and Competition
- 12.6.9 Regional Demand and Opportunities
- 12.7 Segment Growth Comparison
- 12.8 Segment Attractiveness and Priority Matrix
Chapter 13 Asia Pacific Artificial Intelligence Workload Management End-Use and Application Market Outlook
- 13.1 End-Use Industry and Customer Demand Structure
- 13.2 Leading Applications and Customer Groups
- 13.3 End-Use Market Size, Share and Forecast
- 13.4 Major End-Use Industry Deep Dives
- 13.4.1 Customer Requirements and Use Cases
- 13.4.2 Demand and Replacement Cycles
- 13.4.3 Technical and Regulatory Considerations
- 13.4.4 Purchasing and Procurement Models
- 13.4.5 Leading Vendors and Distribution Channels
- 13.4.6 Forecast and Commercial Opportunities
- 13.5 Emerging Applications and Cross-Segment Demand
- 13.6 End-Use Industry Investment Priorities
Chapter 14 Asia Pacific Artificial Intelligence Workload Management Geographic Market Outlook, 2025-2035
- 14.1 Regional Market Size and Country-Level Shares, 2025
- 14.2 Country Market Size Comparison, 2025
- 14.3 Country Market Forecasts, 2025-2035
- 14.4 Subregional Industrial and Demand Clusters
- 14.5 Intra-Regional Pricing and Cost Differences
- 14.6 Cross-Border Trade and Supply Networks
- 14.7 Regional Supply and Demand Balances
- 14.8 Country Opportunity Comparison and Prioritization
Note: Every listed country is covered on the structure shown under the first country.
Chapter 15 Asia Pacific Artificial Intelligence Workload Management Technology, Innovation and Sustainability Outlook
- 15.1 Technology Landscape and Maturity
- 15.2 Product, Process and Service Innovation
- 15.3 AI, Automation and Digital Tools in the Industry
- 15.4 Technology Adoption and Performance Benchmarking
- 15.5 Innovation Pipeline and R&D Investment
- 15.6 Patent and Intellectual Property Trends
- 15.7 Energy Efficiency and Resource Management
- 15.8 Sustainability, Recycling and Circularity
- 15.9 Technology Roadmap, 2025-2035
- 15.10 Risks of Obsolescence and Technology Substitution
Chapter 16 Asia Pacific Artificial Intelligence Workload Management Market Key Strategic Imperatives
- 16.1 Growth and Market Entry Priorities
- 16.2 High-Return Products and Segments
- 16.3 Pricing, Profitability and Cost Optimization
- 16.4 Technology Investment and Product Differentiation
- 16.5 Supply Chain Localization and Resilience
- 16.6 Distribution and Customer Acquisition
- 16.7 Partnership, Acquisition and Capacity Strategy
- 16.8 Regional Expansion Priorities
- 16.9 Short-, Medium- and Long-Term Actions
Chapter 17 Competition Outlook
- 17.1 Industry Competition Characteristics
- 17.2 Market Structure and Concentration
- 17.3 Market Share and Competitive Positioning, 2025
- 17.4 Company-Wise Revenue and Product Benchmarking
- 17.5 Production and Service Capacity Benchmarking
- 17.6 Technology, Pricing and Differentiation
- 17.7 Regional Footprint and Distribution Strength
- 17.8 Mergers, Acquisitions and Strategic Alliances
- 17.9 New Entrants and Competitive Threats
- 17.10 Porter's Five Forces and Industry Attractiveness
- 17.11 Competitive Outlook, 2025-2035
Chapter 18 Company Profiles
- 18.1 Company Coverage and Selection Criteria
- 18.2 Alibaba Group
- 18.2.1 Business Description
- 18.2.2 Company Ownership and Geographic Presence
- 18.2.3 Product and Service Portfolio
- 18.2.4 Manufacturing and Operating Footprint
- 18.2.5 Financial Performance and Investment
- 18.2.6 Market Share and Competitive Position
- 18.2.7 Technology and Innovation Capabilities
- 18.2.8 Strategic Alliances or Partnerships
- 18.2.9 Recent Developments
- 18.2.10 Growth Strategy and Outlook
- 18.3 NVIDIA Corporation
- 18.4 Huawei Technologies Co., Ltd.
- 18.5 Baidu, Inc.
- 18.6 Tencent Holdings Ltd.
- 18.7 Fujitsu Limited
- 18.8 SAKURA internet Inc.
- 18.9 KDDI Corporation
- 18.10 NAVER Cloud Corporation
- 18.11 Yotta Data Services Pvt. Ltd.
- 18.12 Other Relevant Market Participants
Note: Every listed company is profiled on the structure shown under the first company. The company list is preliminary and may change based on research findings, market developments, data availability and client requirements.
Chapter 19 Disclaimer
- 19.1 Research and Forecast Disclaimer
- 19.2 Data Source and Estimation Limitations
Note: The depth of individual sections depends on data availability for this market. Volume, capacity, trade and other unit-based metrics are included where applicable.

