
U.S. merchants move checkout from servers to subscriptions
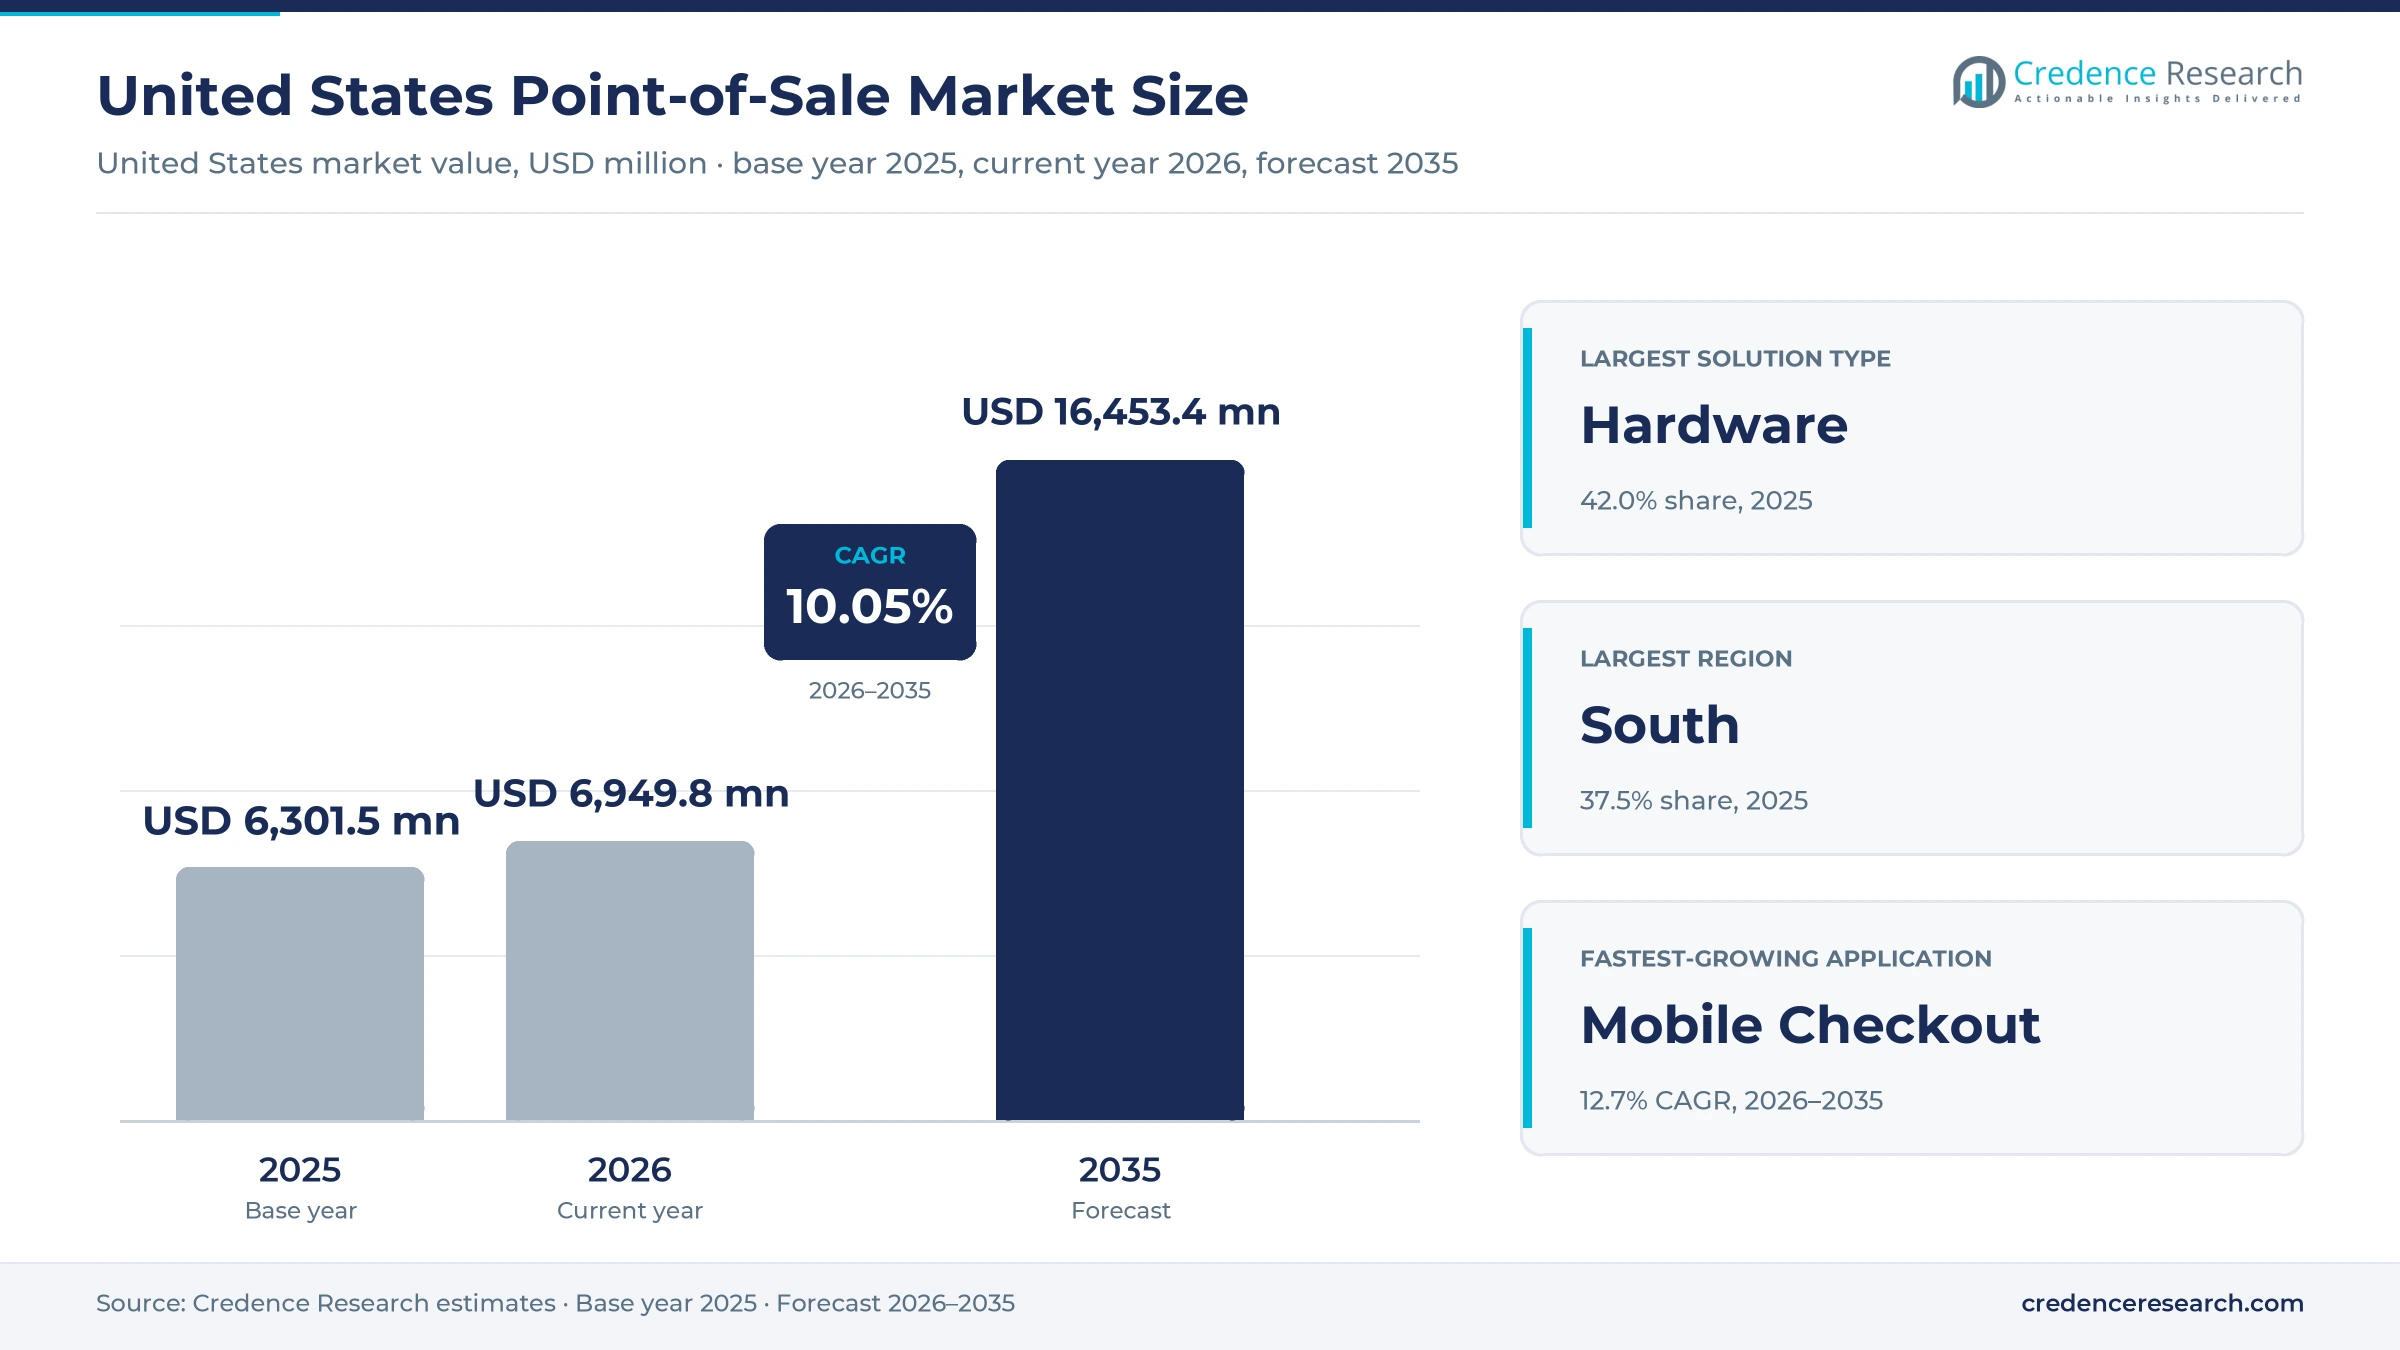
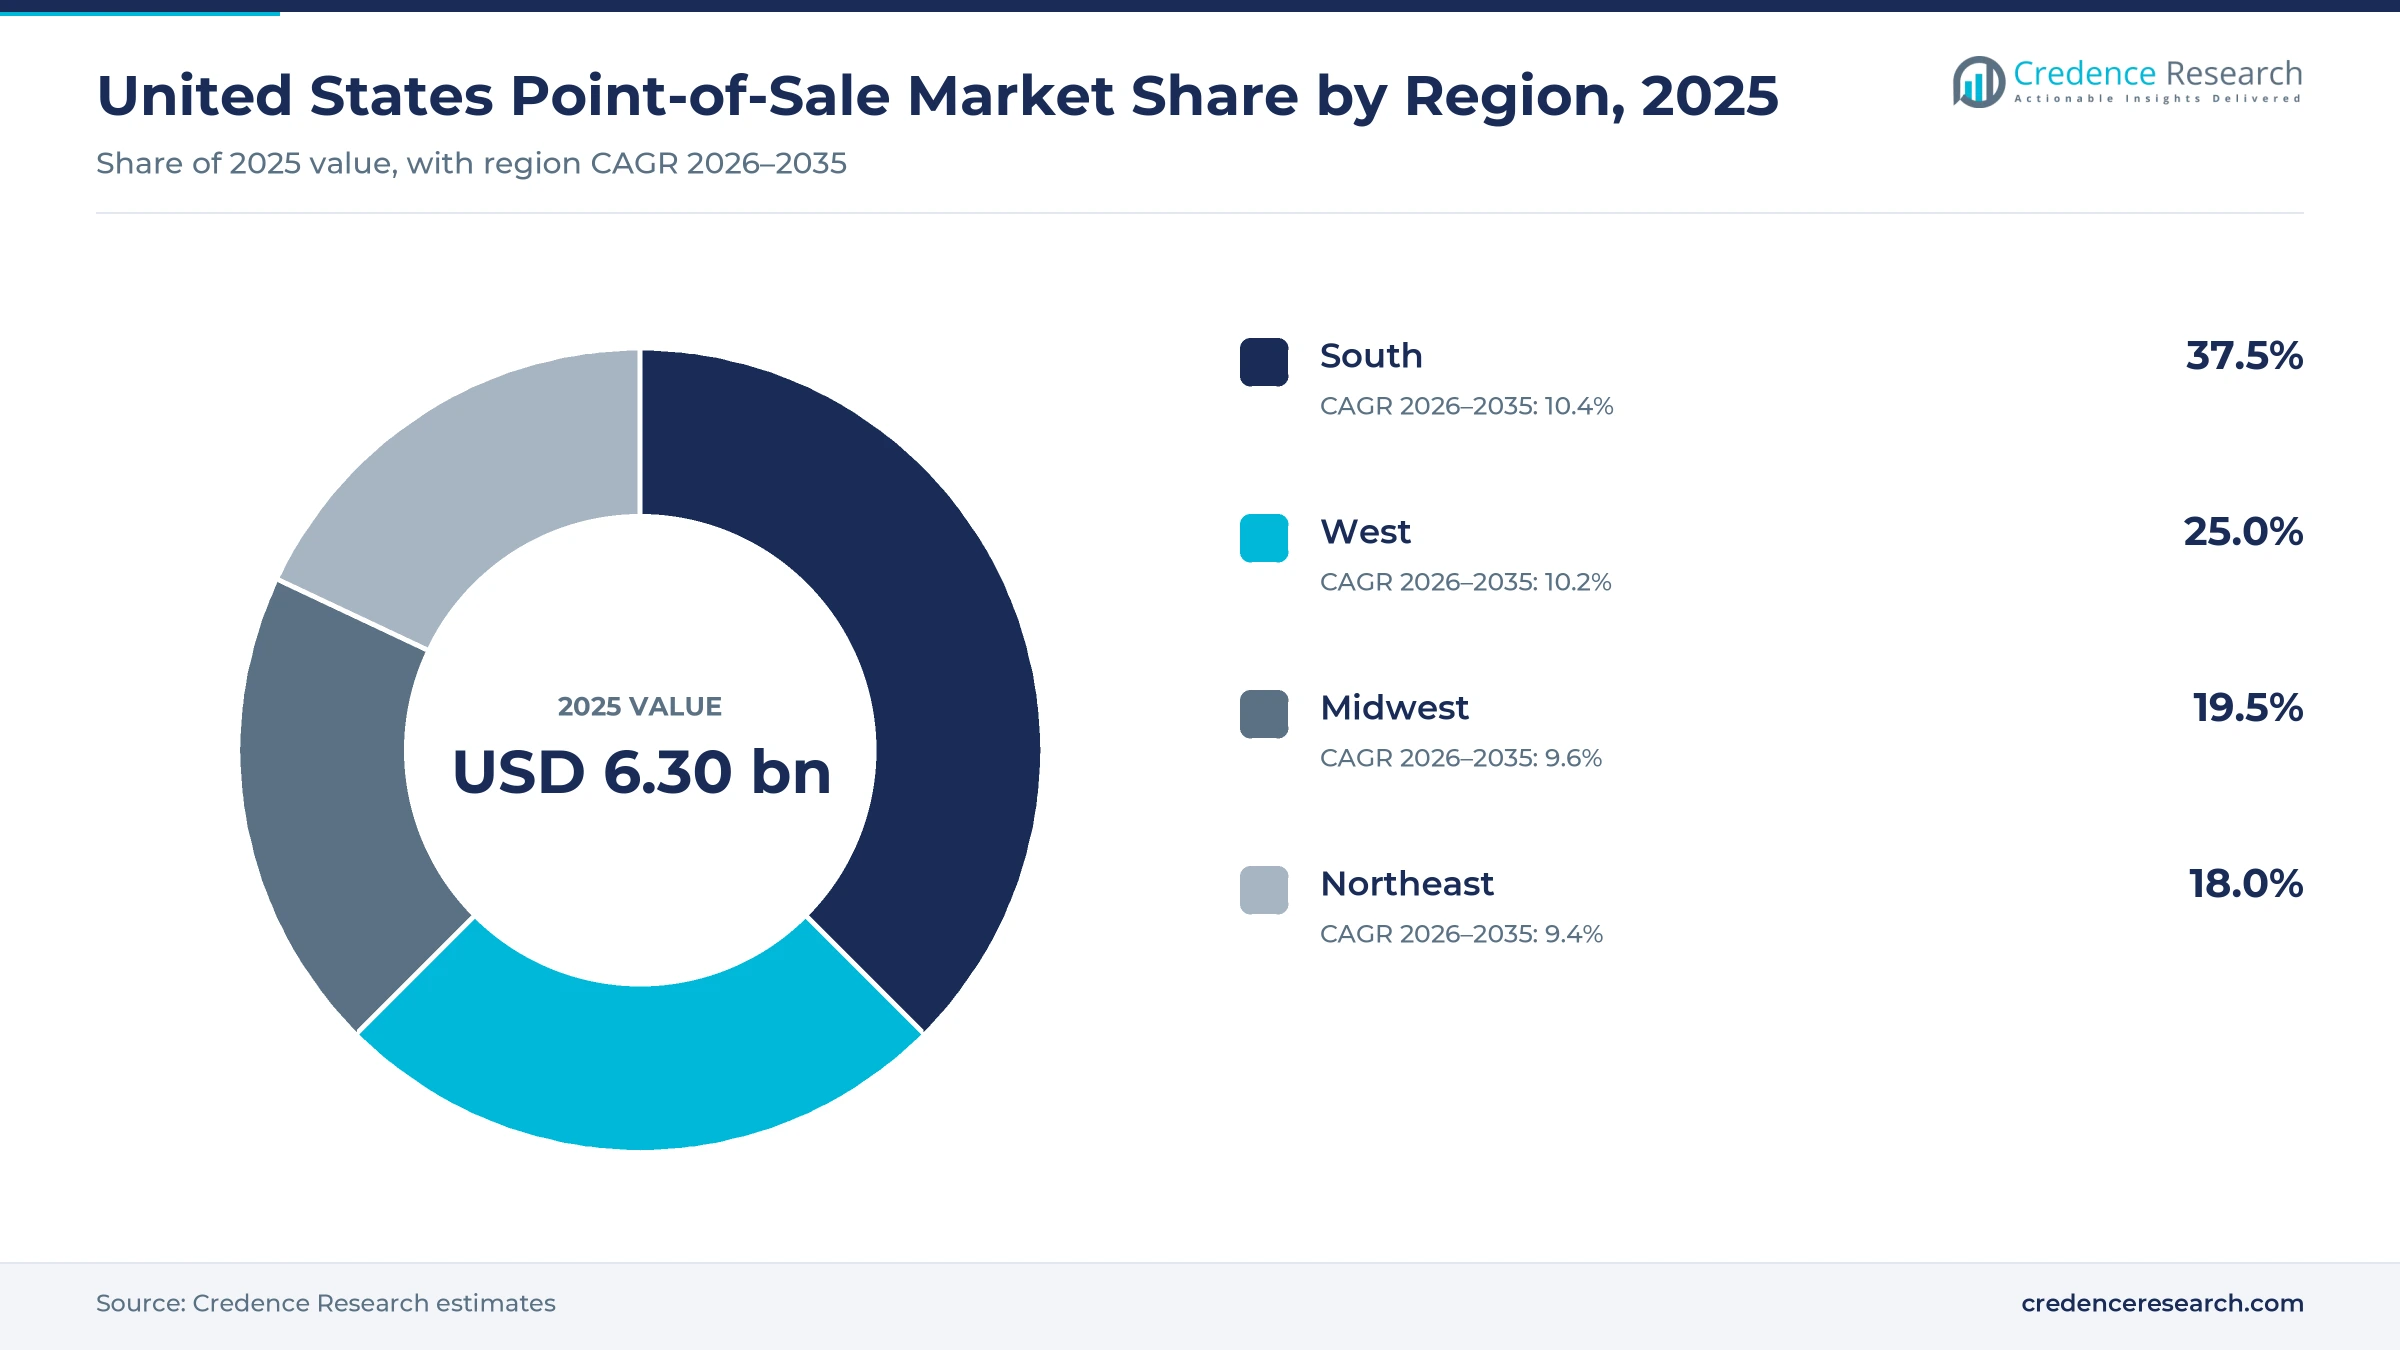
The United States point-of-sale market was valued at USD 6.30 billion in 2025 and is projected to increase from USD 6.95 billion in 2026 to USD 16.45 billion by 2035, registering a CAGR of 10.05% during 2026–2035. Spending is driven by merchants replacing server-based checkout with cloud subscriptions, by chains that standardize one platform across hundreds of sites, and by retailers that need store and online orders on the same system. The South held the largest regional share, 37.5% in 2025, and it is also the fastest-growing region at 10.4% a year as population and new store openings keep moving south. Hardware still takes the largest slice of spending, but software and services grow faster because vendors now price by location and by month. Tariff swings on imported terminals put pressure on device costs in 2025, while handhelds and phone-based checkout lowered the entry price for small merchants. Restaurant groups and hotels are the most active buyers of new platforms.
Checkout devices, their software and support make up the market
The market counts spending by U.S. merchants on checkout hardware, point-of-sale software and the services that keep both running. Hardware covers countertop terminals, handhelds, kiosks, card readers, receipt printers and kitchen screens, while software covers checkout, menu, inventory, loyalty and reporting applications sold by license or subscription. Services cover installation, integration, managed support and hardware repair contracts.
Card processing fees, payment network charges and merchant lending are outside the scope, even when the same vendor sells them in a bundle with the system. The value chain runs from terminal makers and software developers through payment processors, resellers and independent software vendors to single stores, regional groups and national chains.
United States Point-of-Sale Market Insights
- The United States point-of-sale market grows from USD 6.30 billion in 2025 to USD 16.45 billion by 2035 at a 10.05% CAGR as cloud subscriptions replace server-based checkout.
- The South held the largest regional share at 37.5% in 2025 and grows fastest, helped by population growth of 6.0% since 2020.
- Hardware led solution types with 42.0% in 2025, while Software is the fastest-growing solution type at 11.9% a year to 2035.
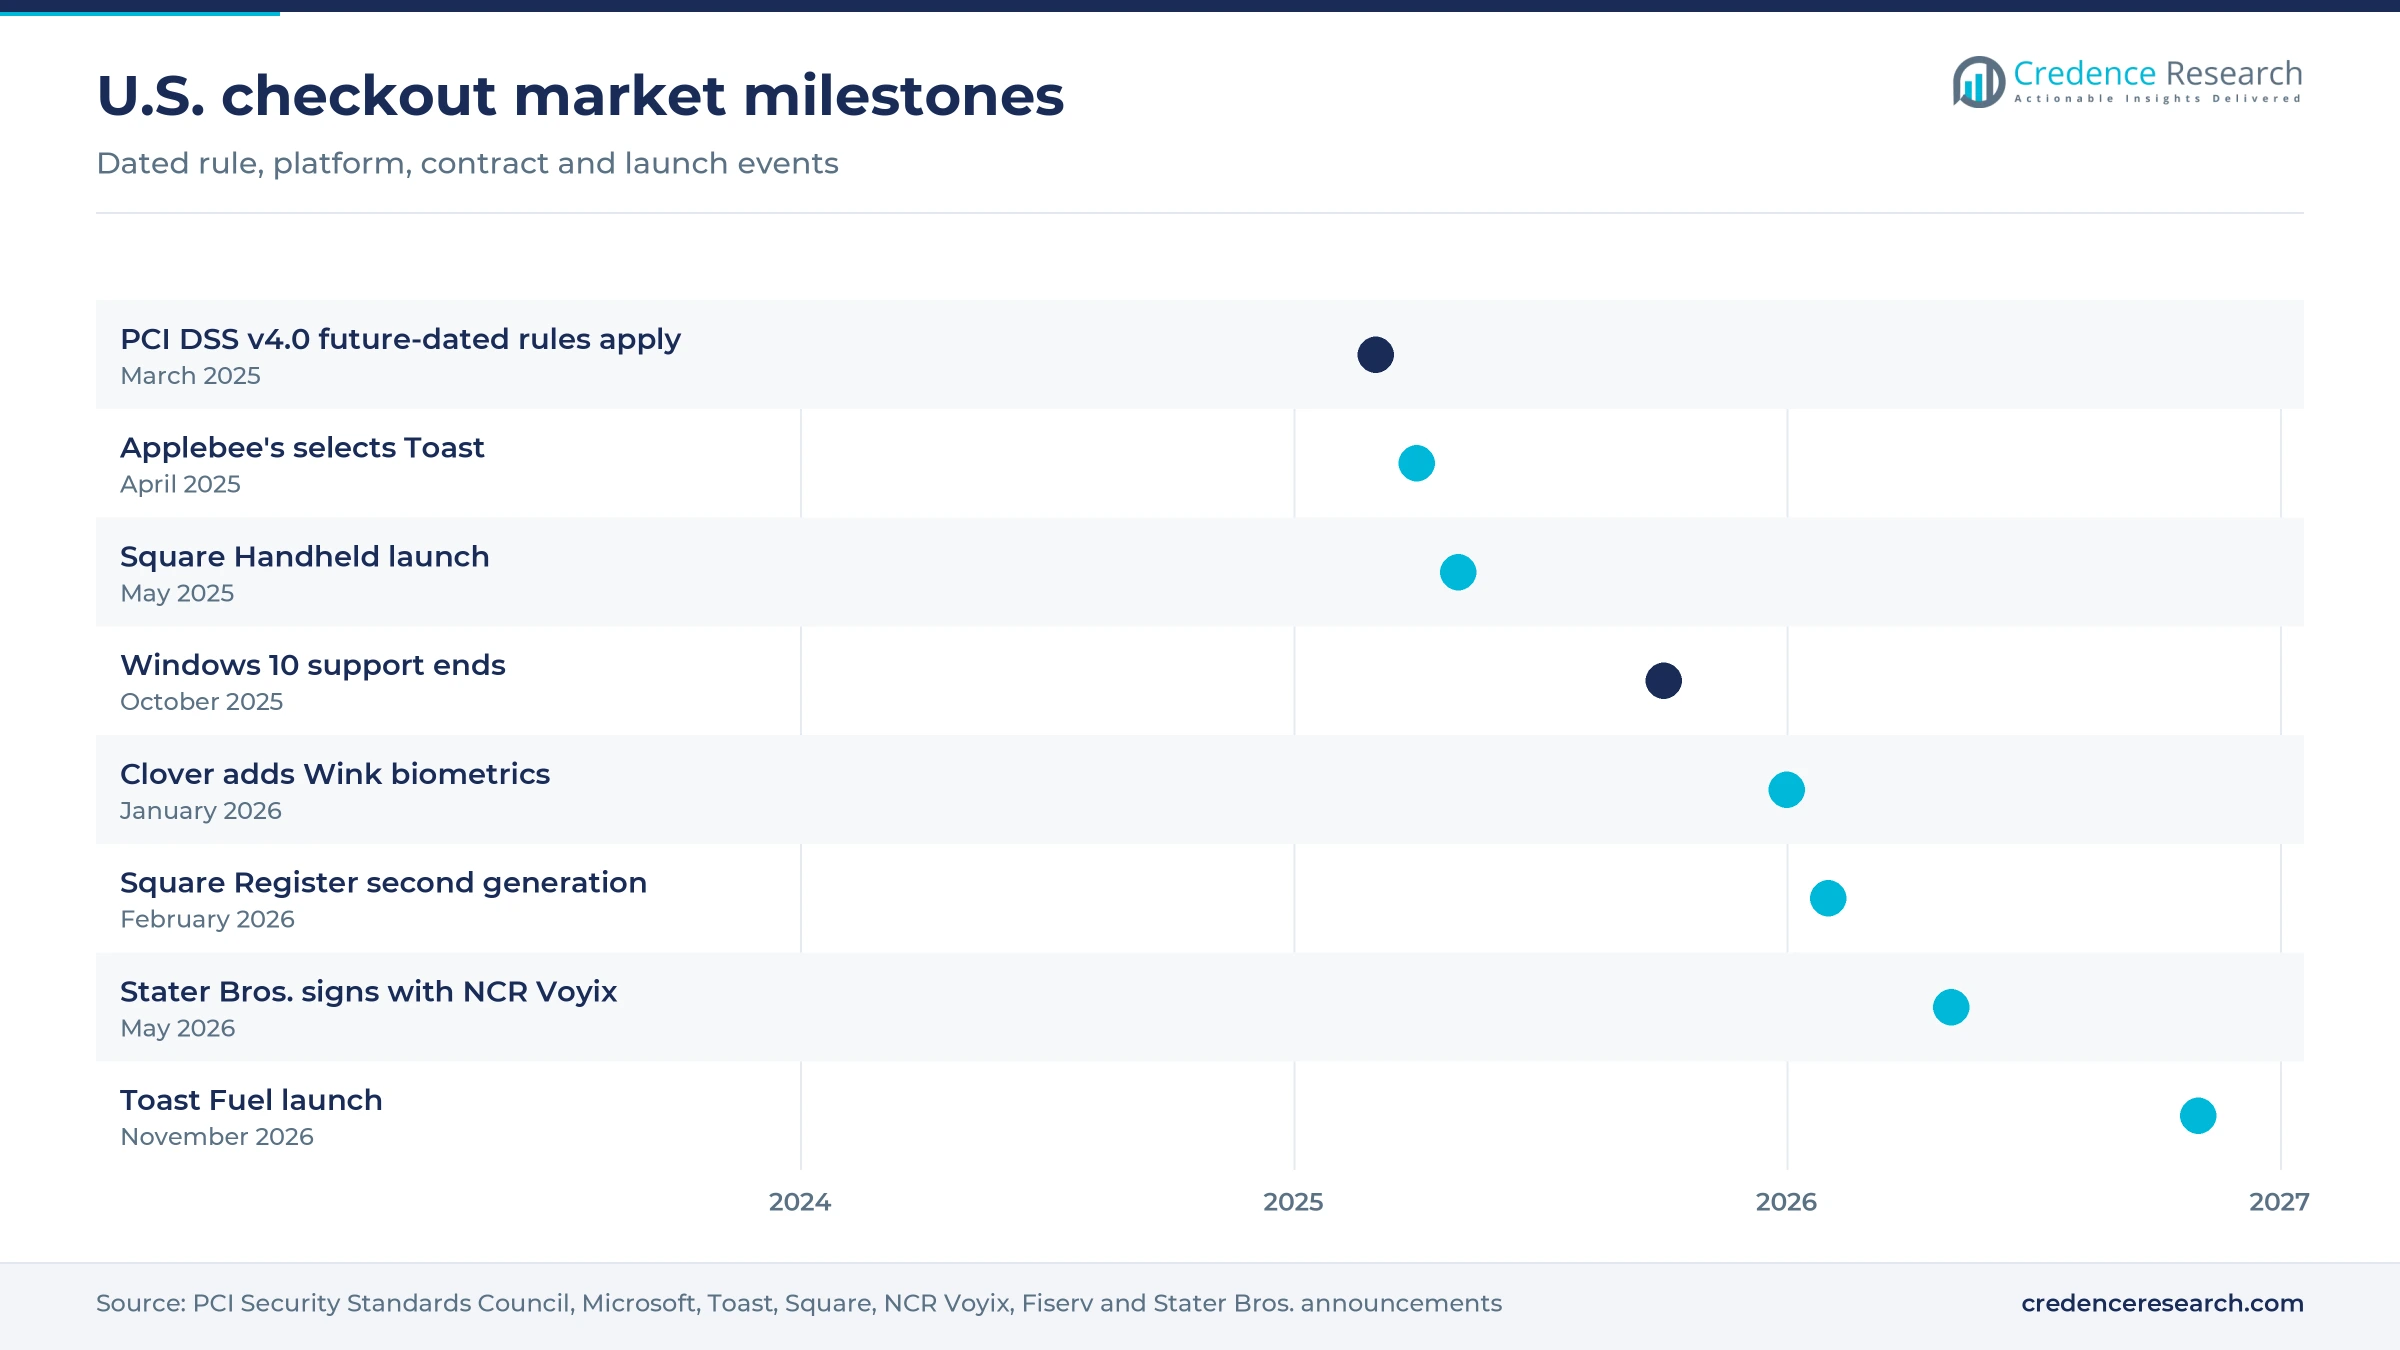
- Applebee's picked Toast in April 2025 and grocer Stater Bros. signed with NCR Voyix in May 2026, as chains move whole estates to one platform.
- Toast reached about 189,000 locations by Sept. 30, 2026, up 21% from a year earlier, as cloud vendors win share from server-based systems.
Hardware leads as cloud software and handhelds gain
Hardware holds the largest share as software scales fastest
Based on solution type, the market is categorized into hardware, software and services. Hardware led with 42.0% of 2025 value because every lane, table and counter needs a device, and Square priced its second-generation Register from $899 when it launched in February 2026. Full-service sites add handhelds and kitchen screens to each counter terminal. Software grows fastest at 11.9% a year as platforms sell add-on applications by the month, and Clover listed more than 600 developer partners worldwide in its EuroShop release of February 2026. Each added application lifts recurring spending per location without a new device.
Cloud systems lead and keep taking share from store servers
Based on deployment model, the market is categorized into cloud, hybrid and on-premises systems. Cloud led with 46.0% of 2025 value because the vendors winning the most new accounts sell browser-managed systems by subscription. Toast, a cloud-only vendor, reached about 189,000 locations across its markets on Sept. 30, 2026, up 21% from a year earlier. Cloud also grows fastest at 12.0% a year as Microsoft ended support for standard Windows 10 editions on Oct. 14, 2025, retiring many store servers. Hybrid systems keep a base in venues where an outage stops sales, which is why Shift4 built SkyTab to keep taking orders offline.
Retail leads while restaurants grow fastest
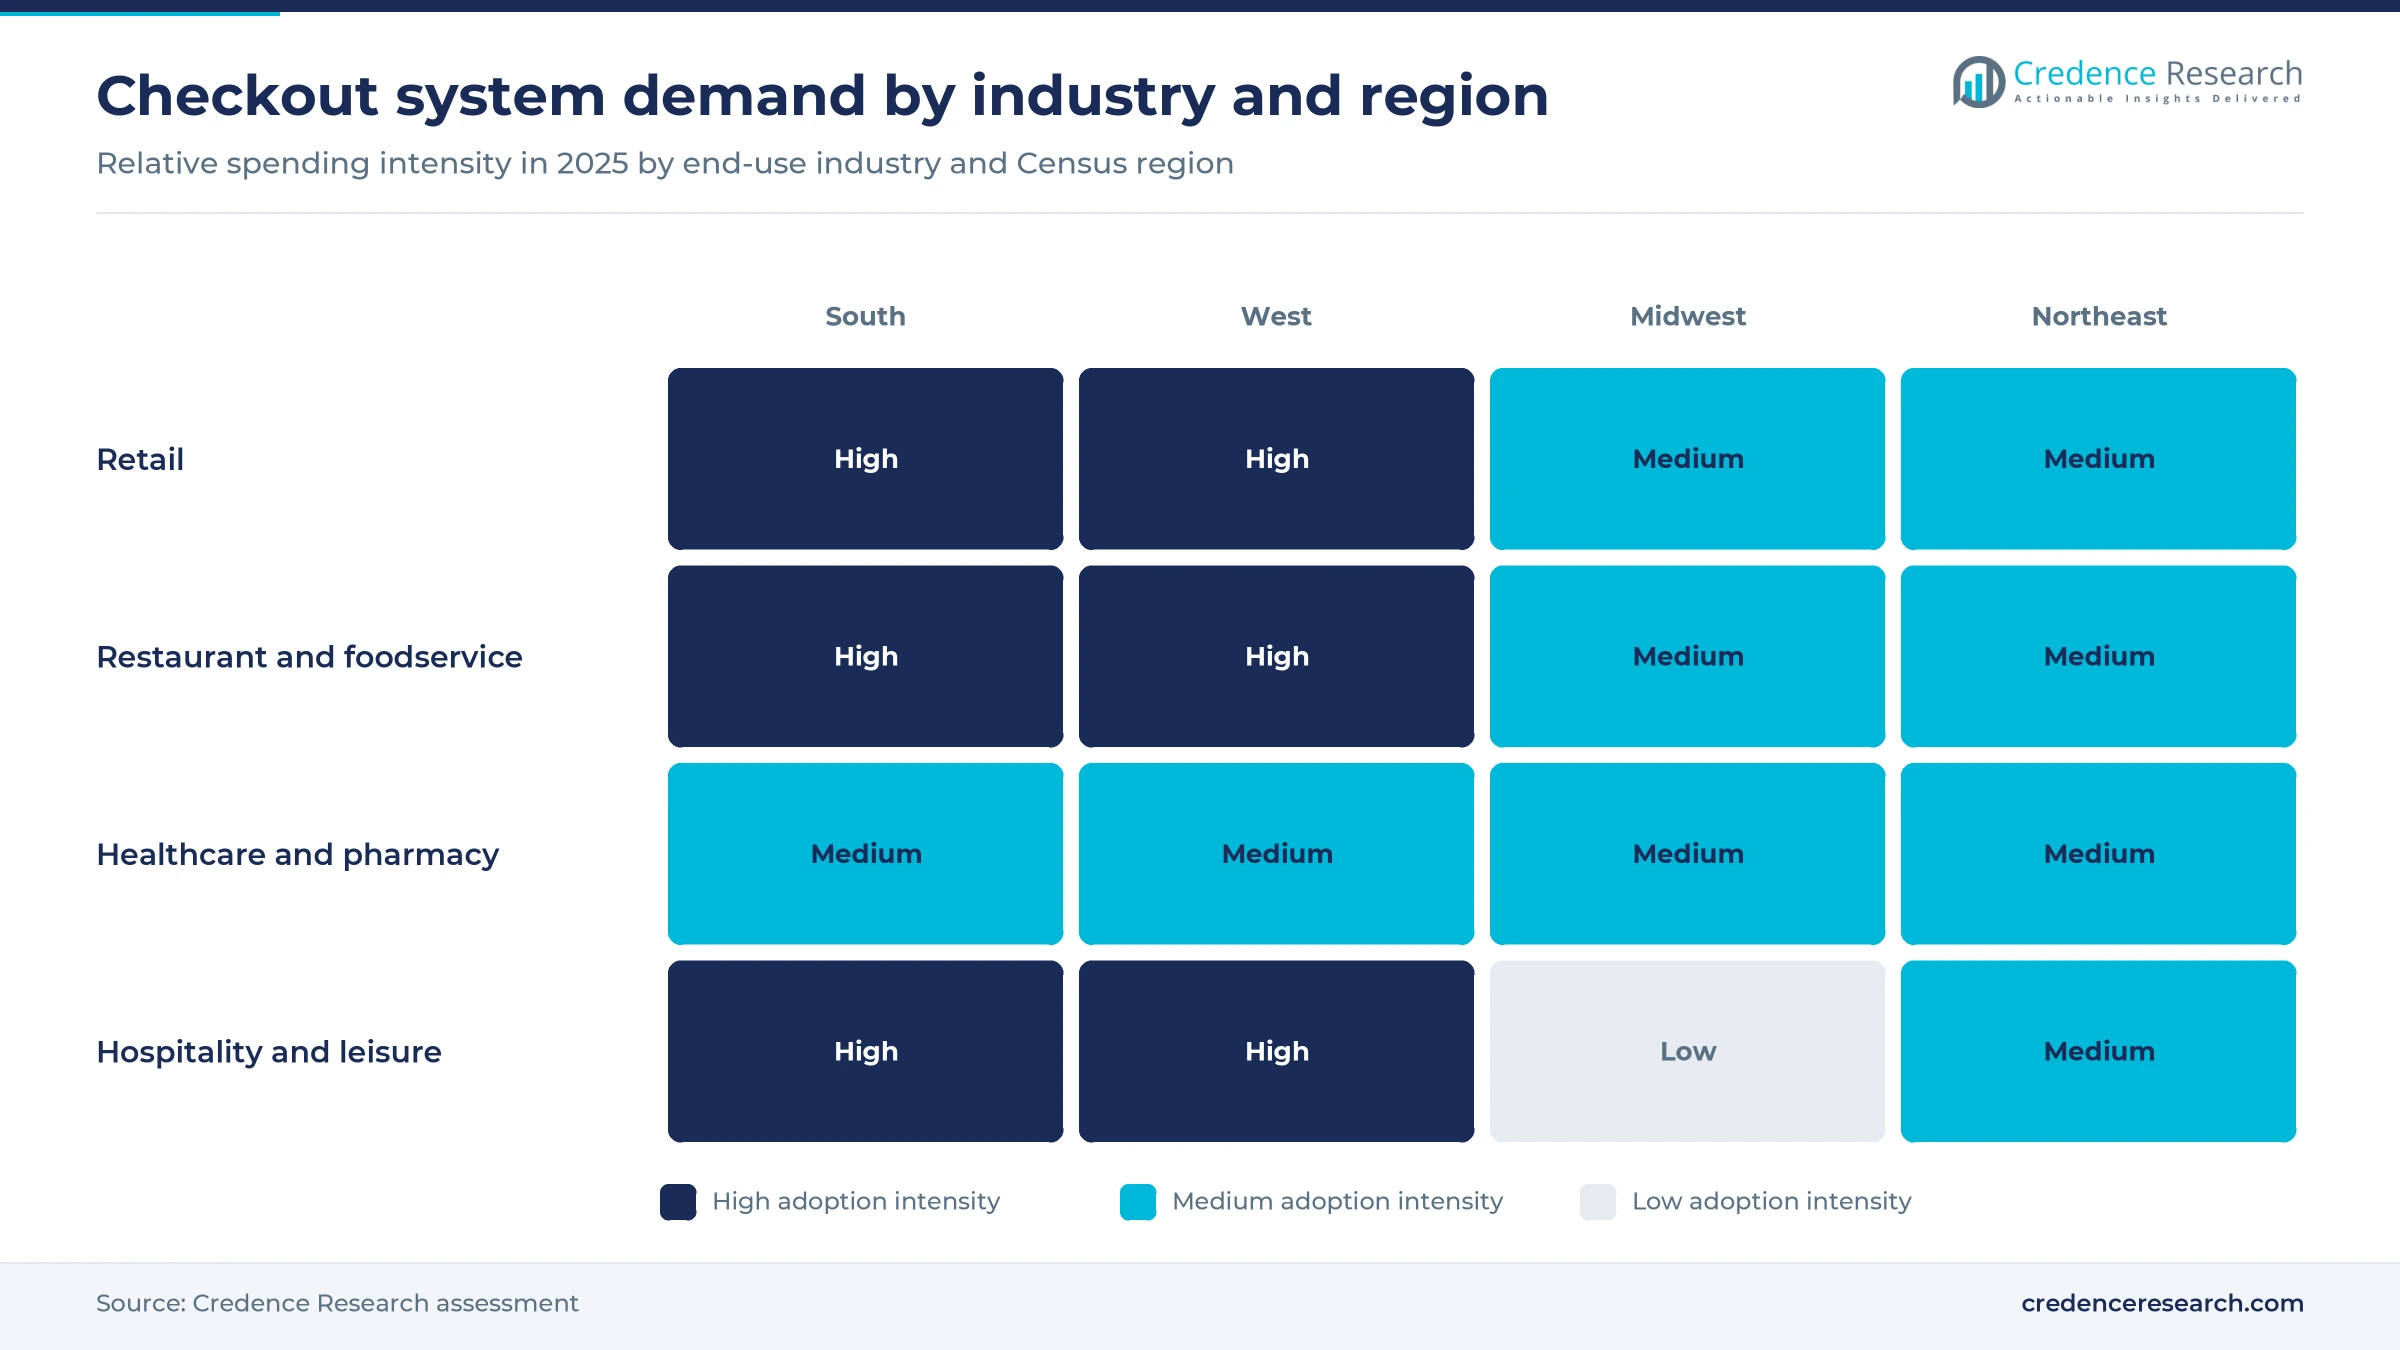
Based on end-use industry, the market is categorized into retail, restaurant and foodservice, healthcare and pharmacy, and hospitality and leisure. Retail led with 44.0% of 2025 value because store chains run many lanes per site, and most retail sales still happen in stores, as the Census e-commerce share in the drivers section shows. Pharmacies are a smaller but steady buyer, with 18,960 independent locations in July 2025, according to the NCPA. Restaurant and Foodservice grows fastest at 11.0% a year as more than 1 million U.S. outlets are expected to sell $1.55 trillion in 2026, according to the National Restaurant Association.
Fixed counters lead while mobile checkout grows fastest
Based on application, the market is categorized into fixed checkout, mobile checkout and mixed-format checkout. Fixed Checkout led with 58.0% of 2025 value because high-volume counters still run on a fixed terminal, and Square said 62% of its U.S. food and beverage sellers with $500,000 or more in yearly payment volume used a Square Register in 2025. Mobile Checkout grows fastest at 12.7% a year as Square launched its Handheld at $399 in May 2025, cutting the cost of taking orders at tables, at the curb and in store aisles. Mixed-format sites pair fixed counters with handhelds during lunch and dinner peaks.
| Segment Group | Leading Sub-segment | Share, 2025 | Fastest-growing Sub-segment | CAGR, 2026–2035 |
|---|---|---|---|---|
| By Solution Type | Hardware | 42.0% | Software | 11.9% |
| By Deployment Model | Cloud | 46.0% | Cloud | 12.0% |
| By End-Use Industry | Retail | 44.0% | Restaurant and Foodservice | 11.0% |
| By Application | Fixed Checkout | 58.0% | Mobile Checkout | 12.7% |
Monthly fees per location replace one-time licenses
U.S. point-of-sale pricing has moved from a one-time license and server purchase to a monthly fee per location, with hardware sold outright or financed and card processing bundled at a set rate. Vendors often keep software cheap or free to win card volume, then earn margin on processing and paid tiers, so the headline plan price understates what a merchant pays over a contract. Hardware is the volatile line, because the tariff swings described in the challenges section hit imported terminals first. UpMenu lists the Toast Point of Sale plan at about $69 a month, close to Square's Plus tier. Large chains negotiate enterprise contracts, which keeps their cost per site below these small-business list prices.
| Offer | Typical price or fee | Basis |
|---|---|---|
| Square for Restaurants Plus | USD 60 a month per location, plus USD 50 per location using mobile checkout | Square pricing page, November 2026 |
| Toast Point of Sale plan | About USD 69 a month | UpMenu lists, May 2026 |
| Toast Flex countertop terminal | About USD 799 to USD 1,199 | UpMenu lists, May 2026 |
| Square Register, second generation | From USD 899 | Square, February 2026 |
| Square Handheld | From USD 399 | Square, May 2025 |
Request a Free Sample
Fill in your details and we'll send you a free sample report.
- Sample data tables & charts
- Research methodology
Cloud migration and chain rollouts drive checkout demand
Cloud workflow migration retires store servers
Merchants are moving checkout, menus and back-office tasks from store servers to cloud platforms that update every site at once. NCR Voyix unveiled seven cloud applications on its Voyix Commerce Platform on Jan. 7, 2026, covering checkout, self-checkout, back office, supply chain, kitchen, loyalty and analytics. Stater Bros. agreed on May 4, 2026 to move nearly 170 of its Southern California stores to that platform, with phased deployments from 2027. The end of Windows 10 support noted in the segment section also pushed many checkout and back-office PCs into a refresh. Vendors that convert installed server bases into subscriptions before customers retender lock in recurring income for the length of each contract.
Unified store and online orders widen software scope
Retailers need one system that sees store, web and app orders, because the share of sales placed online keeps rising. Census Bureau estimates put e-commerce at 17.1% of U.S. retail sales in the second quarter of 2026, with online sales up 12.2% from a year earlier against 6.7% for total retail. The Federal Reserve's 2025 Diary of Consumer Payment Choice found that about 23% of purchases and person-to-person payments were made remotely. Consumers also used a phone for about 11 payments a month in 2024, up from 4 in 2018, according to the same survey. Platforms that tie checkout to inventory management software, online ordering and loyalty win the larger contracts.
Restaurant chains standardize on a single platform
National restaurant brands are replacing mixed systems inherited from franchisees with one platform for every site. Applebee's chose Toast on April 14, 2025 as its new checkout and kitchen display partner, covering counter terminals, Toast Go handhelds and kitchen screens in a system of 1,567 franchised and 47 company-operated restaurants. Buffalo Wild Wings renewed NCR Voyix as its platform partner on July 31, 2025 for more than 1,300 restaurants. Toast named Ruby Tuesday, Hopdoddy and Luke's Lobster among new brands in its Nov. 3, 2026 results. Each chain decision moves hundreds of sites at once, so vendors that win a brand's headquarters avoid selling restaurant by restaurant.
Labor costs push restaurants toward handhelds and kiosks
Higher labor costs make every minute saved at the counter worth more to U.S. operators. California set a $20 hourly minimum for fast-food workers at chains with more than 60 establishments nationwide from April 1, 2024, according to the state Department of Industrial Relations. The National Restaurant Association expects foodservice employment to reach 15.8 million jobs in 2026, and nearly three quarters of operators plan to hire while expecting trouble filling experienced roles. Toast launched Toast IQ Team in November 2026 with a scheduling agent, payroll and tip management built into the system. Tableside handhelds let fewer staff serve more guests, so higher wage floors shorten the payback on each device.
Tap-to-pay, AI agents and venue deals reshape checkout
Tap-to-pay checkout becomes the norm in large cities
Contactless payment has moved from novelty to default at many U.S. counters, which forces merchants to replace readers that only take chip or swipe. Visa said on its July 2025 earnings call that 75 U.S. cities had reached tap-to-pay penetration of 60% or higher, with New York City above 85% and San Francisco above 80%. The Federal Reserve diary found that credit cards accounted for 35% of payments in 2024 and debit cards 30%, while cash fell to 14%. Adults aged 18 to 24 used a phone for 45% of their payments in the same survey. Merchants that upgrade to contactless card transactions shorten queues and cut cash handling costs.
AI agents emerge inside the merchant back office
Vendors are adding AI agents that act on sales data rather than only report it, which raises the value of the software tier. NCR Voyix included Voyix Insight with conversational AI among the seven applications it showcased at NRF 2026 in New York on Jan. 11-13, 2026. Toast expanded Toast IQ Grow with search, review and offer agents built on each merchant's own data, part of more than 20 updates in its fall release. The National Restaurant Association said in February 2026 that advances in ordering, AI and data analytics are helping operators control costs. Vendors whose agents save measurable labor hours can move merchants onto higher monthly tiers.
Hotels, stadiums and venues offer a premium opening
Hotels and large venues are an opening for vendors that can run many outlets, ticketing and retail on one account. Toast became a recommended provider for Preferred Hotels & Resorts members in the United States, Canada, the United Kingdom and Ireland on May 4, 2026, a network of more than 625 properties. Shift4 powered payments at the Super Bowl at Levi's Stadium in February 2026 and added the Houston Astros and Chicago Cubs as clients, according to its first-quarter 2026 call. It is also enabling currency conversion at U.S. stadiums and hotels ahead of the World Cup. Suppliers of hotel and venue terminals earn larger contracts per site than in single-store retail.
Identity-based checkout opens age-checked sales
Biometric checkout gives venues, quick-service chains and retailers a way to speed lines and verify age without staff checks. Fiserv's Clover announced on Jan. 7, 2026 that Wink face and palm payments would run on four Clover device lines, Station Duo, Mini, Flex and Kiosk, with no hardware changes. Clover demonstrated it at NRF 2026 in New York on Jan. 11-13, 2026. The service was offered first to quick-service restaurants, sports venues and retailers, with rollout continuing through 2026. Biometric profiles sit in a token vault separate from card data, which answers a common privacy objection. Alcohol sales at stadiums are a natural first use, and vendors that bundle identity with loyalty can sell it as a premium module.
Tariffs, security rules and thin margins slow upgrades
Tariff swings raise imported terminal costs
Most checkout hardware is imported, so trade policy feeds straight into device costs. U.S. tariffs on Chinese goods rose from 10% in February 2025 to a peak of 145% in April before falling to 30% from May 14, according to Digital Transactions. The publication reported that some terminals carry gross margins of 50% to 60%, so vendors could absorb part of the shock but not all of it. Merchants face higher device prices or service fees, while vendors move assembly and lean on tablets and phones.
Card security rules add compliance work
Card security standards raised the compliance load on merchants and vendors in 2025. The PCI Security Standards Council made 51 future-dated requirements of PCI DSS v4.0 mandatory after March 31, 2025, including script controls on online payment pages. Small merchants that run their own web ordering must now monitor those pages for tampering and document the checks. Vendors that host payment pages and carry the assessment burden win these accounts, while older self-managed systems lose ground.
Thin restaurant margins delay system upgrades
Restaurant operators remain cautious about new spending because profits are thin. The National Restaurant Association reported in February 2026 that 42% of operators were not profitable the year before, and more than 9 in 10 named food, labor, insurance, energy and swipe fees as significant challenges. Operators facing those costs stretch the life of existing terminals and resist monthly software add-ons. Vendors respond with free starter plans and financed hardware, which slows their own payback.
Self-checkout pullbacks cap lane automation
Several large U.S. retailers scaled back self-service lanes after theft and customer complaints, which limits one growth path for hardware. Dollar General planned in March 2024 to remove self-checkout lanes from 300 stores most prone to shoplifting, according to Payments Dive. Target limited those lanes to 10 items or fewer that month, and Walmart removed kiosks at select stores in April 2024. Vendors must now sell staffed and assisted lanes alongside kiosks, which lowers spending per store.
South leads on population growth and new merchant sites
| Region | Value, 2025 (USD billion) | Share, 2025 | CAGR, 2026–2035 |
|---|---|---|---|
| South | 2.36 | 37.5% | 10.4% |
| West | 1.58 | 25.0% | 10.2% |
| Midwest | 1.23 | 19.5% | 9.6% |
| Northeast | 1.13 | 18.0% | 9.4% |
South holds the largest share as new sites open
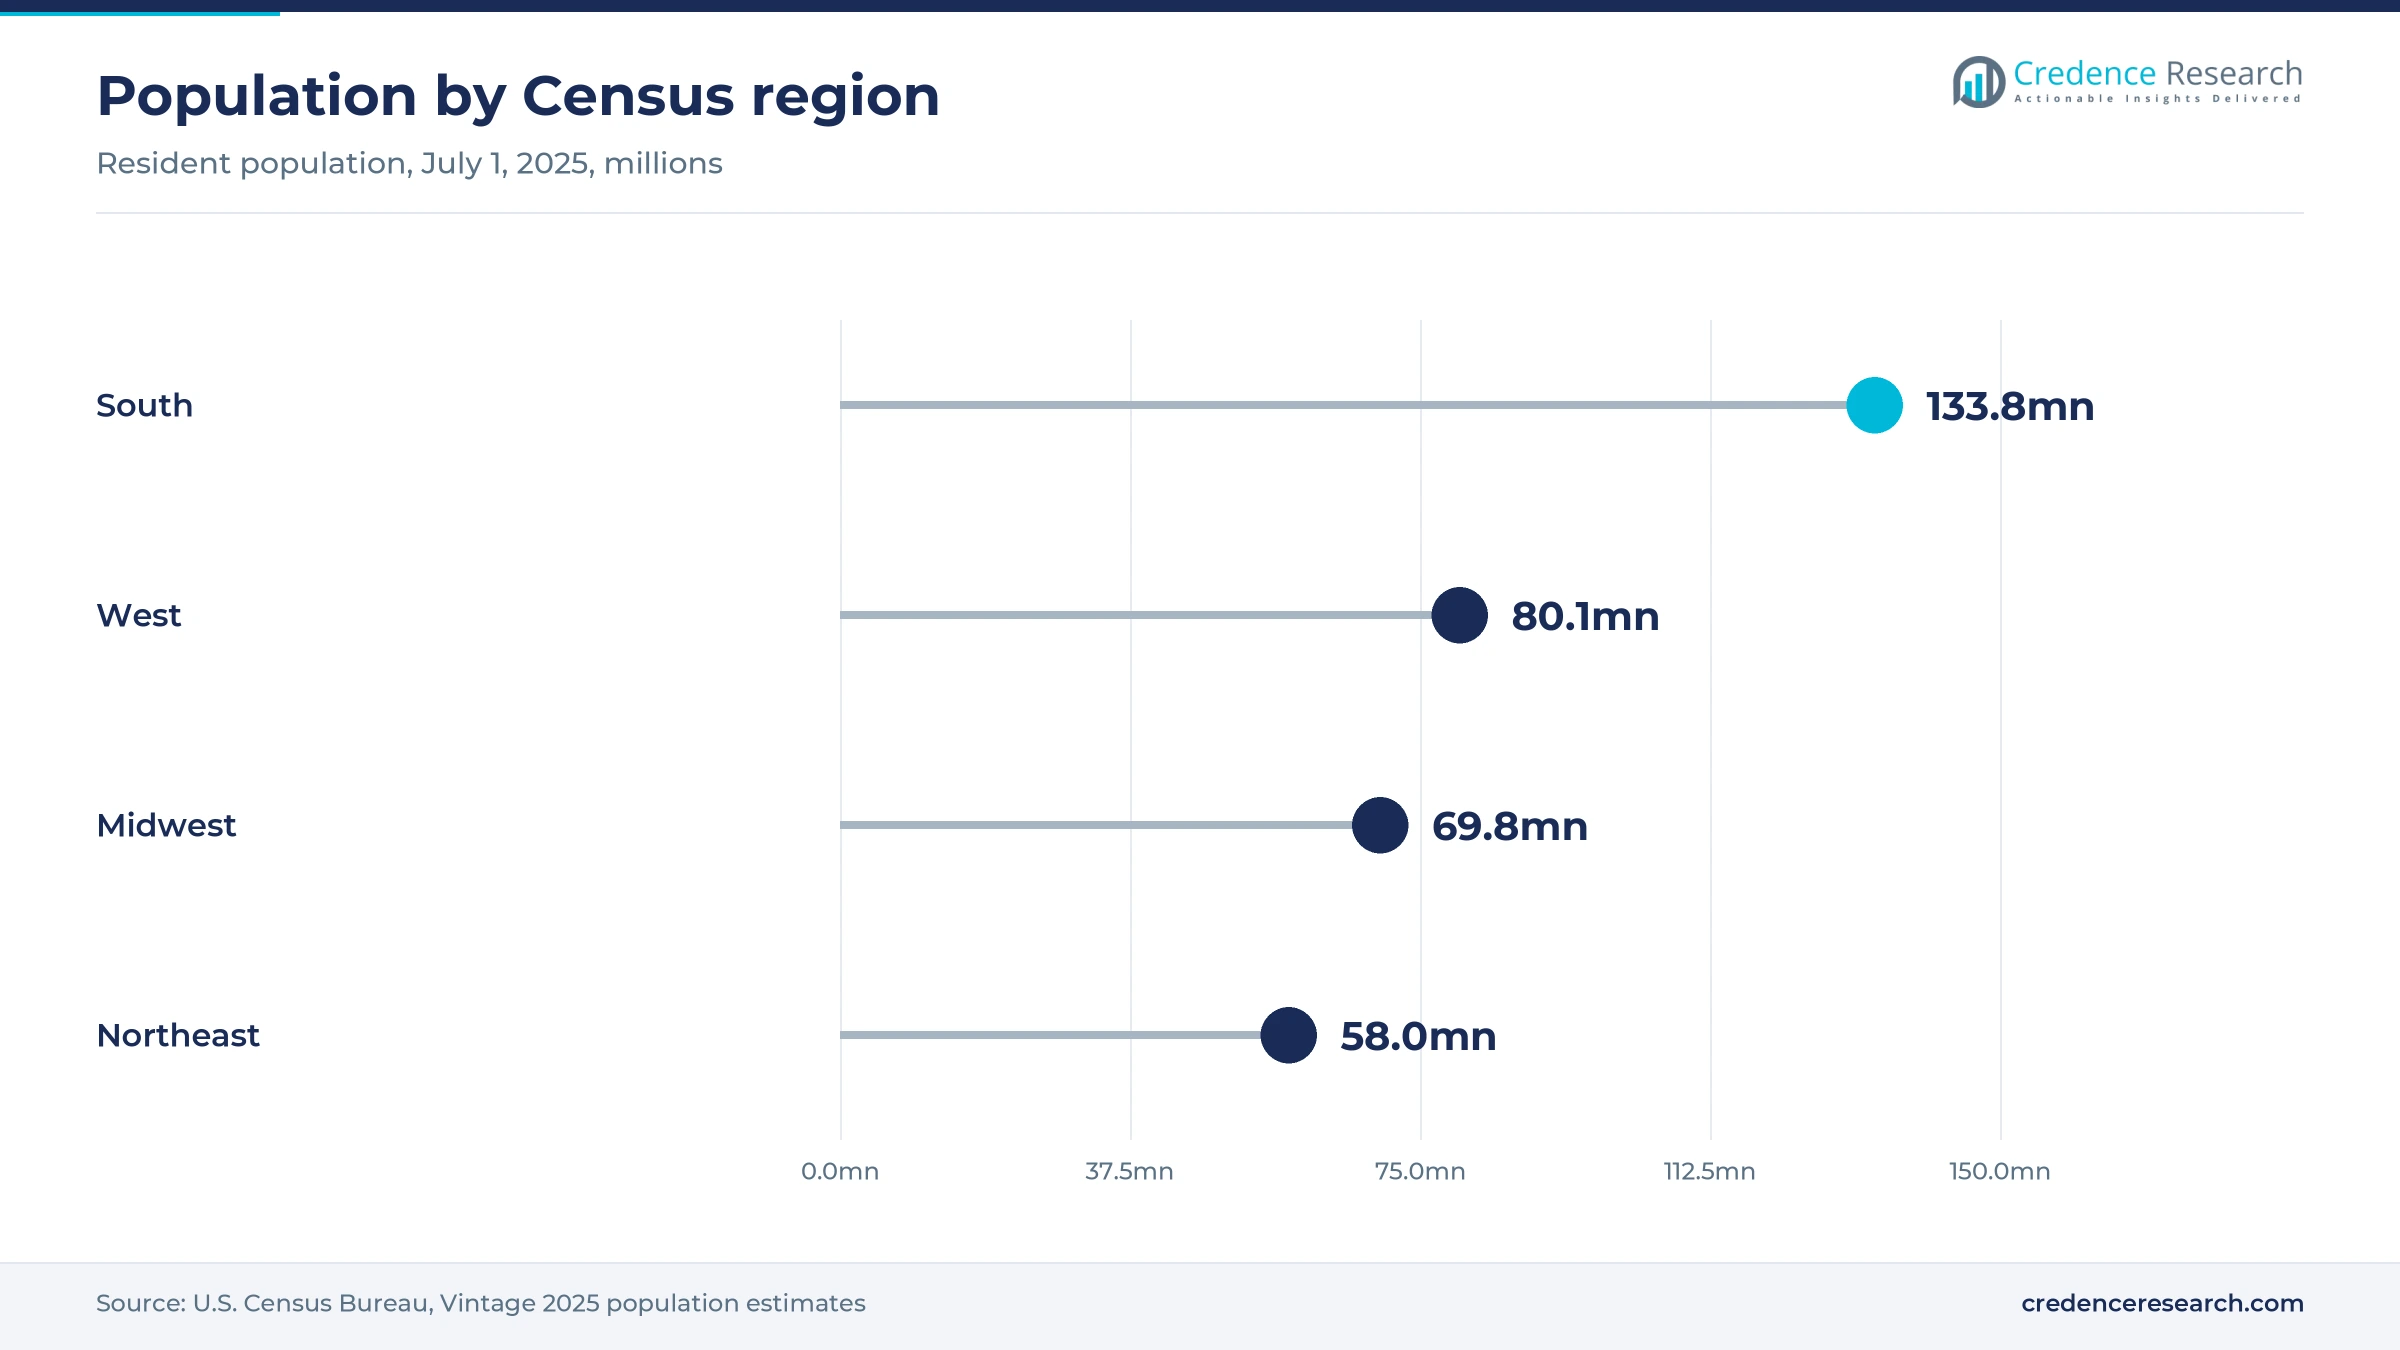
The South held 37.5% of 2025 value and grows at 10.4% a year, the fastest of the four regions. Census Bureau estimates put its population at 133.8 million in July 2025, up 6.0% since 2020, nearly twice the national rate of 3.1%. New suburbs across the region bring grocery, restaurant and pharmacy sites that buy systems from scratch rather than upgrading old ones. The South added about 7.6 million residents over that period, more than the other three regions combined, so new-site demand is concentrated here.
The West ties labor costs to faster automation
The West held 25.0% of 2025 value and grows at 10.2% a year. Its population reached 80.1 million in 2025, up 1.9% since 2020, according to the Census Bureau. California's $20 fast-food wage, noted in the drivers, makes labor-saving handhelds and kiosks pay back faster in the region's largest state. San Francisco's high tap-to-pay rate keeps merchants replacing older readers, and Stater Bros.' planned move of nearly 170 Southern California stores to the Voyix Commerce Platform, noted above, shows grocery estates in the region being re-platformed.
The Midwest relies on upgrades of existing systems
The Midwest held 19.5% of 2025 value and grows at 9.6% a year. Its population rose 1.1% from 2020 to 69.8 million in 2025, according to the Census Bureau, so most demand comes from upgrades rather than new sites. Regional grocers and restaurant groups replacing server-based systems account for much of that spending. The region added only about 763,000 residents since 2020, so vendors compete mainly for replacement cycles at existing chains.
The Northeast buys replacements in dense cities
The Northeast held 18.0% of 2025 value and grows at 9.4% a year, the slowest of the four regions. Its population of 58.0 million in 2025 was only 0.7% above the 2020 level, according to the Census Bureau. Dense cities still support high spending per site, and New York City's tap-to-pay rate is among the highest in the country. Vendors win here mainly by replacing older systems in existing stores, restaurants and hotels.
Chain contracts and new verticals define 2025 and 2026
| Development | Status and market relevance |
|---|---|
| In April 2025, Applebee's selected Toast for counter terminals, handhelds and kitchen displays across its restaurants. | Selected; nationwide rollout |
| In May 2026, grocer Stater Bros. agreed to move nearly 170 stores to Voyix POS and payments on the Voyix Commerce Platform. | Signed; phased deployments from 2027 |
| In May 2026, Fiserv expanded Clover's restaurant portfolio with Clover Reserve Powered by Tabit, a fine dining solution. | Launched; adds full-service depth |
| In May 2026, Shift4 said it was renaming its SkyTab restaurant system as Shift4 Dine. | Underway; restaurant brand reset |
| In November 2026, Toast launched Toast Fuel for independent fuel and convenience operators, covering in-store and at-pump payments. | Launched; extends Toast into convenience retail |
Cloud, android, tap-to-pay and biometrics set the stack
- Cloud-native platforms run checkout, menus and reporting from a central service, so a chain can change prices across every site in one update.
- Android-based terminals and handhelds replace Windows PCs at many counters, and their software can be upgraded remotely without new hardware.
- Tap-to-pay and wallet acceptance lets phones and cards pay by contact, and it underpins the rise of digital wallet spending at the counter.
- Biometric and AI services add identity checks, labor scheduling and marketing agents on top of the core checkout software.
Need a Custom Version of This Report?
Tailor the scope, geography, or segments to your exact requirements.
- Custom geography or segment scope
- Direct access to our analyst team
Payment-led platforms and NCR Voyix split U.S. checkout
Competition turns on who controls the payment stream at each counter. Toast concentrates on restaurants and now extends into hotels, fuel and convenience retail. Square sells one ecosystem across restaurants, retail and services, with hardware ranging from handhelds to countertop registers. Fiserv's Clover reaches merchants through bank and reseller channels and adds restaurant depth through products such as Clover Reserve. Shift4 targets hotels, stadiums and restaurants, and it is renaming SkyTab as Shift4 Dine. NCR Voyix defends the enterprise tier, where grocery and restaurant chains run complex lanes and need integration with supply chain and loyalty systems. Price competition is sharpest among small merchants, where free starter plans are common, while enterprise contracts are won on reliability, field service and migration risk.
Payment-led platforms and enterprise specialists form two tiers
The U.S. market splits into two tiers with different buyers and economics. National chains and grocers buy from enterprise specialists such as NCR Voyix, whose long integration projects and multi-year contracts create high switching costs for enterprise chains. Single-location and multi-location merchants buy from payment-led platforms such as Toast, Square, Clover and Shift4, which sell software cheaply and earn most of their margin on card processing. Barriers to entry are low for software but high for payments scale, certification and field service, which keeps the number of national vendors small. Hundreds of independent software vendors and resellers fill vertical niches on top of these platforms, but margins sit mainly with whoever processes the payments.
Companies profiled and their roles in this market
| Company | Type | Role in the market |
|---|---|---|
| NCR Voyix | Enterprise platform vendor | Unveiled cloud applications in January 2026 and signed grocer Stater Bros. in May 2026 |
| Fiserv/Clover | Payment-led platform | Added Wink biometric payments in January 2026 and Clover Reserve in May 2026 |
| Toast | Restaurant-focused cloud platform | Selected by Applebee's in April 2025 and launched Toast Fuel in November 2026 |
| Block/Square | Payment-led platform | Launched Square Handheld in May 2025 and a second-generation Register in February 2026 |
| Shift4 | Hospitality and venue platform | Renaming SkyTab as Shift4 Dine and adding major league venues in 2026 |
Software and services, not terminals, carry growth
Credence Research's view is that the U.S. market will be won on software and services rather than on terminals. Hardware still accounts for the largest share, but tariff swings and longer device lives make it the least predictable line. Cloud vendors keep adding locations by pricing per site and per month, and chain decisions such as Applebee's move hundreds of restaurants at once. The strongest positions belong to platforms that combine payments, checkout and back-office agents in one contract. Enterprise vendors that convert installed servers to subscriptions before their customers retender keep the largest accounts.
Site counts and vendor price lists anchor the estimates
The report uses 2025 as the base year and 2026 to 2035 as the forecast period. Market values come from the Credence Research model, which builds spending from the number of U.S. retail, restaurant, pharmacy and hospitality sites and typical outlays per site on hardware, software and services. Segment and regional splits are Credence Research estimates built from Census Bureau population and retail data, National Restaurant Association and NCPA industry counts, Federal Reserve payment surveys, published vendor price lists, and company announcements and filings. No interviews or primary surveys were conducted for this edition of the report.
Checkout becomes a monthly service bundled with payments
The United States point-of-sale market is expected to grow from USD 6.95 billion in 2026 to USD 16.45 billion by 2035 at a 10.05% CAGR. Software and cloud deployments will gain the most share as server-based systems reach the end of their lives. Hardware spending will move in cycles tied to tariffs, operating system changes and chain refresh programs. The South will add the most new merchant sites as its population grows. By 2035, most U.S. merchants are likely to buy checkout as a monthly service bundled with payments, with AI tools sold as paid upgrades.
Tariffs and chain migrations set the 2035 range
The range of outcomes depends on how quickly chains move installed servers to cloud platforms and on how hardware costs settle after the 2025 tariff swings. A downside case assumes renewed tariff increases and restaurant operators delaying upgrades because of thin margins. The base case assumes steady chain migrations and stable device prices. An upside case needs faster enterprise conversions, wider use of handheld and biometric checkout, and paid AI tiers that lift software spending per site.
| Scenario | CAGR, 2026–2035 | Value, 2035 | What has to hold |
|---|---|---|---|
| Downside | 8.2% | USD 14.18 billion | Tariffs rise again and restaurant operators defer system upgrades through 2029 |
| Base | 10.05% | USD 16.45 billion | Chains keep migrating to cloud platforms while device prices stay broadly stable |
| Upside | 11.6% | USD 18.59 billion | Faster enterprise conversions and paid AI tiers lift software spending per site |
Frequently Asked Questions
How big is the United States point-of-sale market?
Which solution type leads the United States point-of-sale market?
Which U.S. region leads point-of-sale spending?
Which deployment model grows fastest?
How are restaurant chains changing their checkout systems?
How did tariffs affect point-of-sale hardware?
Who are the key companies in the United States point-of-sale market?
Which security rules affect U.S. merchants buying new systems?
Table of Content
Chapter 1 Market Segmentation
- 1.1 Segmentation Framework
- 1.1.1 Product and Service Classification
- 1.1.2 Application and End-Use Classification
- 1.1.3 Technology and Solution Classification
- 1.1.4 Customer and Distribution Channel Classification
- 1.1.5 Geographic Segmentation
- 1.1.6 Market Segment Definitions and Boundaries
- 1.2 By Solution Type
- 1.2.1 Hardware
- 1.2.2 Software
- 1.2.3 Services
- 1.3 By Deployment Model
- 1.3.1 Cloud
- 1.3.2 Hybrid
- 1.3.3 On-Premises
- 1.4 By End-Use Industry
- 1.4.1 Retail
- 1.4.2 Restaurant and Foodservice
- 1.4.3 Healthcare and Pharmacy
- 1.4.4 Hospitality and Leisure
- 1.5 By Application
- 1.5.1 Fixed Checkout
- 1.5.2 Mobile Checkout
- 1.5.3 Mixed-Format Checkout
Chapter 2 Introduction
- 2.1 Report Objectives and Scope
- 2.2 Product Definition and Industry Terminology
- 2.3 Market Inclusions and Exclusions
- 2.4 Research Process
- 2.4.1 Primary Research and Expert Interviews
- 2.4.2 Secondary Research and Source Review
- 2.4.3 Top-Down and Bottom-Up Estimation
- 2.4.4 Data Triangulation and Verification
- 2.5 Market Size Measurement Basis
- 2.5.1 2025: USD 6.30 billion → 2035: USD 16.45 billion
- 2.6 Historical and Forecast Reference Periods
- 2.6.1 Historical Period: 2018-2025
- 2.6.2 Base Year: 2025
- 2.6.3 Forecast Period: 2025-2035
- 2.7 Research Assumptions and Limitations
Chapter 3 Executive Summary
- 3.1 Market Snapshot and Key Findings
- 3.2 Base-Year Market Size, 2025
- 3.3 Forecast Market Size, 2035
- 3.4 Revenue and Volume Growth Outlook
- 3.5 Key Demand and Supply Indicators
- 3.6 Leading Market Segments
- 3.7 Fastest-Growing Market Opportunities
- 3.8 Regional Performance Highlights
- 3.9 Technology and Industry Transformation
- 3.10 Competitive Landscape Summary
- 3.11 Analyst View and Strategic Implications
Chapter 4 United States Point-of-Sale Market Trends and Developments
- 4.1 Historical Industry Development, 2018-2025
- 4.2 Recent Market Trends and Developments
- 4.3 Demand and Customer Behavior Trends
- 4.4 Technology and Product Innovation
- 4.5 Artificial Intelligence, Automation and Digitalization
- 4.6 Local Manufacturing and Supply Chain Realignment
- 4.7 Industry Partnerships, Mergers and Acquisitions
- 4.8 Sustainability and Circular Economy Developments
- 4.9 Government and Private Sector Investment Trends
- 4.10 Emerging Business Models and Commercialization
- 4.11 Industry Developments and Announcements
Chapter 5 United States Point-of-Sale Market Supply and Demand Analysis
- 5.1 Demand Trend and Consumption Analysis, 2018-2025
- 5.2 Demand Forecast, 2025-2035
- 5.3 Supply Chain Structure and Procurement Trends
- 5.4 Supply-Demand Gap and Bottlenecks
- 5.5 Import Dependence and Sourcing Structure
- 5.6 Regional Supply and Demand Concentration
Chapter 6 United States Point-of-Sale Market Pricing Analysis
- 6.1 Pricing Structure and Measurement
- 6.2 Historical Pricing Trends, 2018-2025
- 6.3 Pricing Outlook, 2025-2035
- 6.4 Pricing by Product and Market Segment
- 6.5 Geographic Pricing Differences
- 6.6 Key Input, Energy, Labor and Logistics Costs
- 6.7 Contract Pricing and Purchasing Models
- 6.8 Pricing Sensitivity and Competitive Positioning
- 6.9 Price, Margin and Profitability Implications
Chapter 7 United States Point-of-Sale Market Dynamics
- 7.1 Market Growth Drivers
- 7.1.1 Demand-Side Drivers
- 7.1.2 Technology and Innovation Drivers
- 7.1.3 Infrastructure and Investment Drivers
- 7.1.4 Regulatory and Policy Drivers
- 7.2 Market Restraints
- 7.2.1 Cost and Affordability Constraints
- 7.2.2 Technology and Adoption Barriers
- 7.2.3 Supply Chain and Operational Constraints
- 7.3 Market Challenges
- 7.3.1 Competitive Pressure and Margin Erosion
- 7.3.2 Skills, Infrastructure and Implementation Gaps
- 7.4 Emerging Market Opportunities
- 7.5 Market Dynamics Impact and Time-Horizon Assessment
Chapter 8 United States Point-of-Sale Value Chain Analysis
- 8.1 Industry Value Chain Overview
- 8.2 Upstream Suppliers and Critical Inputs
- 8.3 Technology and Component Providers
- 8.4 Manufacturing or Service Delivery
- 8.5 Distribution, Channel Partners and Integrators
- 8.6 Downstream Applications and End Users
- 8.7 Value Addition and Profit Pools
- 8.8 Vertical Integration and Outsourcing
- 8.9 Supplier Concentration and Risk
- 8.10 Supply Chain Localization and Resilience
Chapter 9 United States Point-of-Sale Market Regulations and Policies
- 9.1 Relevant Laws, Standards and Compliance Frameworks
- 9.2 Product, Service, Safety and Quality Requirements
- 9.3 Government Policies, Incentives and Subsidies
- 9.4 Imports, Exports and Trade Barriers
- 9.5 Public Procurement and Local Content Requirements
- 9.6 Data Protection, AI and Cybersecurity Compliance
- 9.7 Upcoming Policy Changes and Market Implications
Chapter 10 United States Point-of-Sale Market Hotspots and Opportunities
- 10.1 Market Opportunity Mapping and Growth Hotspots
- 10.2 High-Growth Applications and Customer Groups
- 10.3 Underserved Markets and White-Space Opportunities
- 10.4 Emerging Technology and Product Opportunities
- 10.5 New Capacity and Investment Hotspots
- 10.6 Market Entry and Expansion Opportunities
- 10.7 Distribution and Partnership Opportunities
- 10.8 Near-Term and Long-Term Commercial Potential
- 10.9 Opportunity Attractiveness and Execution Risks
Chapter 11 United States Point-of-Sale Market Outlook, 2025-2035
- 11.1 Market Size and Analysis
- 11.1.1 Revenue (Market Measurement: 2025: USD 6.30 billion → 2035: USD 16.45 billion)
- 11.1.2 Historical Market Size, 2018-2025
- 11.1.3 Base-Year Market Size, 2025
- 11.2 Market Forecast, 2025-2035
- 11.2.1 Revenue Forecast to 2035
- 11.2.2 CAGR and Year-on-Year Growth
- 11.2.3 Incremental Revenue Opportunity
- 11.3 Forecast Assumptions and Scenario Analysis
- 11.3.1 Base-Case Forecast
- 11.3.2 Optimistic and Conservative Scenarios
- 11.3.3 Technology, Pricing and Policy Sensitivities
- 11.4 Market Attractiveness and Growth Outlook
Chapter 12 United States Point-of-Sale Market Segmentation and Outlook
- 12.1 Segmentation Summary and Market Shares, 2025
- 12.2 Largest and Fastest-Growing Segments
- 12.3 By Solution Type - Market Size and Forecast, 2025-2035
- 12.3.1 Segment Definition and Scope
- 12.3.2 Historical Market Size, 2018-2025
- 12.3.3 Revenue Forecast, 2025-2035
- 12.3.4 Base-Year Market Share, 2025
- 12.3.5 Segment CAGR and Growth Drivers
- 12.3.6 Subsegment Market Size and Forecast
- 12.3.6.1 Hardware
- 12.3.6.2 Software
- 12.3.6.3 Services
- 12.3.7 Subsegment Pricing and Adoption Trends
- 12.3.8 Leading Suppliers and Competition
- 12.3.9 Regional Demand and Opportunities
- 12.4 By Deployment Model - Market Size and Forecast, 2025-2035
- 12.4.1 Segment Definition and Scope
- 12.4.2 Historical Market Size, 2018-2025
- 12.4.3 Revenue Forecast, 2025-2035
- 12.4.4 Base-Year Market Share, 2025
- 12.4.5 Segment CAGR and Growth Drivers
- 12.4.6 Subsegment Market Size and Forecast
- 12.4.6.1 Cloud
- 12.4.6.2 Hybrid
- 12.4.6.3 On-Premises
- 12.4.7 Subsegment Pricing and Adoption Trends
- 12.4.8 Leading Suppliers and Competition
- 12.4.9 Regional Demand and Opportunities
- 12.5 By End-Use Industry - Market Size and Forecast, 2025-2035
- 12.5.1 Segment Definition and Scope
- 12.5.2 Historical Market Size, 2018-2025
- 12.5.3 Revenue Forecast, 2025-2035
- 12.5.4 Base-Year Market Share, 2025
- 12.5.5 Segment CAGR and Growth Drivers
- 12.5.6 Subsegment Market Size and Forecast
- 12.5.6.1 Retail
- 12.5.6.2 Restaurant and Foodservice
- 12.5.6.3 Healthcare and Pharmacy
- 12.5.6.4 Hospitality and Leisure
- 12.5.7 Subsegment Pricing and Adoption Trends
- 12.5.8 Leading Suppliers and Competition
- 12.5.9 Regional Demand and Opportunities
- 12.6 By Application - Market Size and Forecast, 2025-2035
- 12.6.1 Segment Definition and Scope
- 12.6.2 Historical Market Size, 2018-2025
- 12.6.3 Revenue Forecast, 2025-2035
- 12.6.4 Base-Year Market Share, 2025
- 12.6.5 Segment CAGR and Growth Drivers
- 12.6.6 Subsegment Market Size and Forecast
- 12.6.6.1 Fixed Checkout
- 12.6.6.2 Mobile Checkout
- 12.6.6.3 Mixed-Format Checkout
- 12.6.7 Subsegment Pricing and Adoption Trends
- 12.6.8 Leading Suppliers and Competition
- 12.6.9 Regional Demand and Opportunities
- 12.7 Segment Growth Comparison
- 12.8 Segment Attractiveness and Priority Matrix
Chapter 13 United States Point-of-Sale End-Use and Application Market Outlook
- 13.1 End-Use Industry and Customer Demand Structure
- 13.2 Leading Applications and Customer Groups
- 13.3 End-Use Market Size, Share and Forecast
- 13.4 Major End-Use Industry Deep Dives
- 13.4.1 Customer Requirements and Use Cases
- 13.4.2 Demand and Replacement Cycles
- 13.4.3 Technical and Regulatory Considerations
- 13.4.4 Purchasing and Procurement Models
- 13.4.5 Leading Vendors and Distribution Channels
- 13.4.6 Forecast and Commercial Opportunities
- 13.5 Emerging Applications and Cross-Segment Demand
- 13.6 End-Use Industry Investment Priorities
Chapter 14 United States Point-of-Sale Geographic Market Outlook, 2025-2035
- 14.1 Domestic Market Distribution and Demand Clusters
- 14.2 State- or Province-Wise Market Size and Forecast, 2025-2035
- 14.3 City and Metropolitan Market Outlook
- 14.4 Industrial, Manufacturing and Commercial Clusters
- 14.5 Geographic Concentration of Key End Users
- 14.6 Local Pricing and Purchasing Differences
- 14.7 Domestic Production Facilities and Capacity Map
- 14.8 Local Infrastructure and Project Pipeline
- 14.9 State-Level Policy and Incentive Differences
- 14.10 Subnational Investment Hotspots and Opportunities
- 14.11 Distribution and Logistics Networks
- 14.12 Domestic Competitive Footprint
Chapter 15 United States Point-of-Sale Technology, Innovation and Sustainability Outlook
- 15.1 Technology Landscape and Maturity
- 15.2 Product, Process and Service Innovation
- 15.3 AI, Automation and Digital Tools in the Industry
- 15.4 Technology Adoption and Performance Benchmarking
- 15.5 Innovation Pipeline and R&D Investment
- 15.6 Patent and Intellectual Property Trends
- 15.7 Energy Efficiency and Resource Management
- 15.8 Sustainability, Recycling and Circularity
- 15.9 Technology Roadmap, 2025-2035
- 15.10 Risks of Obsolescence and Technology Substitution
Chapter 16 United States Point-of-Sale Market Key Strategic Imperatives
- 16.1 Growth and Market Entry Priorities
- 16.2 High-Return Products and Segments
- 16.3 Pricing, Profitability and Cost Optimization
- 16.4 Technology Investment and Product Differentiation
- 16.5 Supply Chain Localization and Resilience
- 16.6 Distribution and Customer Acquisition
- 16.7 Partnership, Acquisition and Capacity Strategy
- 16.8 Regional Expansion Priorities
- 16.9 Short-, Medium- and Long-Term Actions
Chapter 17 Competition Outlook
- 17.1 Industry Competition Characteristics
- 17.2 Market Structure and Concentration
- 17.3 Market Share and Competitive Positioning, 2025
- 17.4 Company-Wise Revenue and Product Benchmarking
- 17.5 Production and Service Capacity Benchmarking
- 17.6 Technology, Pricing and Differentiation
- 17.7 Regional Footprint and Distribution Strength
- 17.8 Mergers, Acquisitions and Strategic Alliances
- 17.9 New Entrants and Competitive Threats
- 17.10 Porter's Five Forces and Industry Attractiveness
- 17.11 Competitive Outlook, 2025-2035
Chapter 18 Company Profiles
- 18.1 Company Coverage and Selection Criteria
- 18.2 NCR Voyix
- 18.2.1 Business Description
- 18.2.2 Company Ownership and Geographic Presence
- 18.2.3 Product and Service Portfolio
- 18.2.4 Manufacturing and Operating Footprint
- 18.2.5 Financial Performance and Investment
- 18.2.6 Market Share and Competitive Position
- 18.2.7 Technology and Innovation Capabilities
- 18.2.8 Strategic Alliances or Partnerships
- 18.2.9 Recent Developments
- 18.2.10 Growth Strategy and Outlook
- 18.3 Fiserv/Clover
- 18.4 Toast
- 18.5 Block/Square
- 18.6 Shift4
- 18.7 Other Relevant Market Participants
Note: Every listed company is profiled on the structure shown under the first company. The company list is preliminary and may change based on research findings, market developments, data availability and client requirements.
Chapter 19 Disclaimer
- 19.1 Research and Forecast Disclaimer
- 19.2 Data Source and Estimation Limitations
Note: The depth of individual sections depends on data availability for this market. Volume, capacity, trade and other unit-based metrics are included where applicable.

