
Disclosure and AI rules turn GRC into a daily workflow
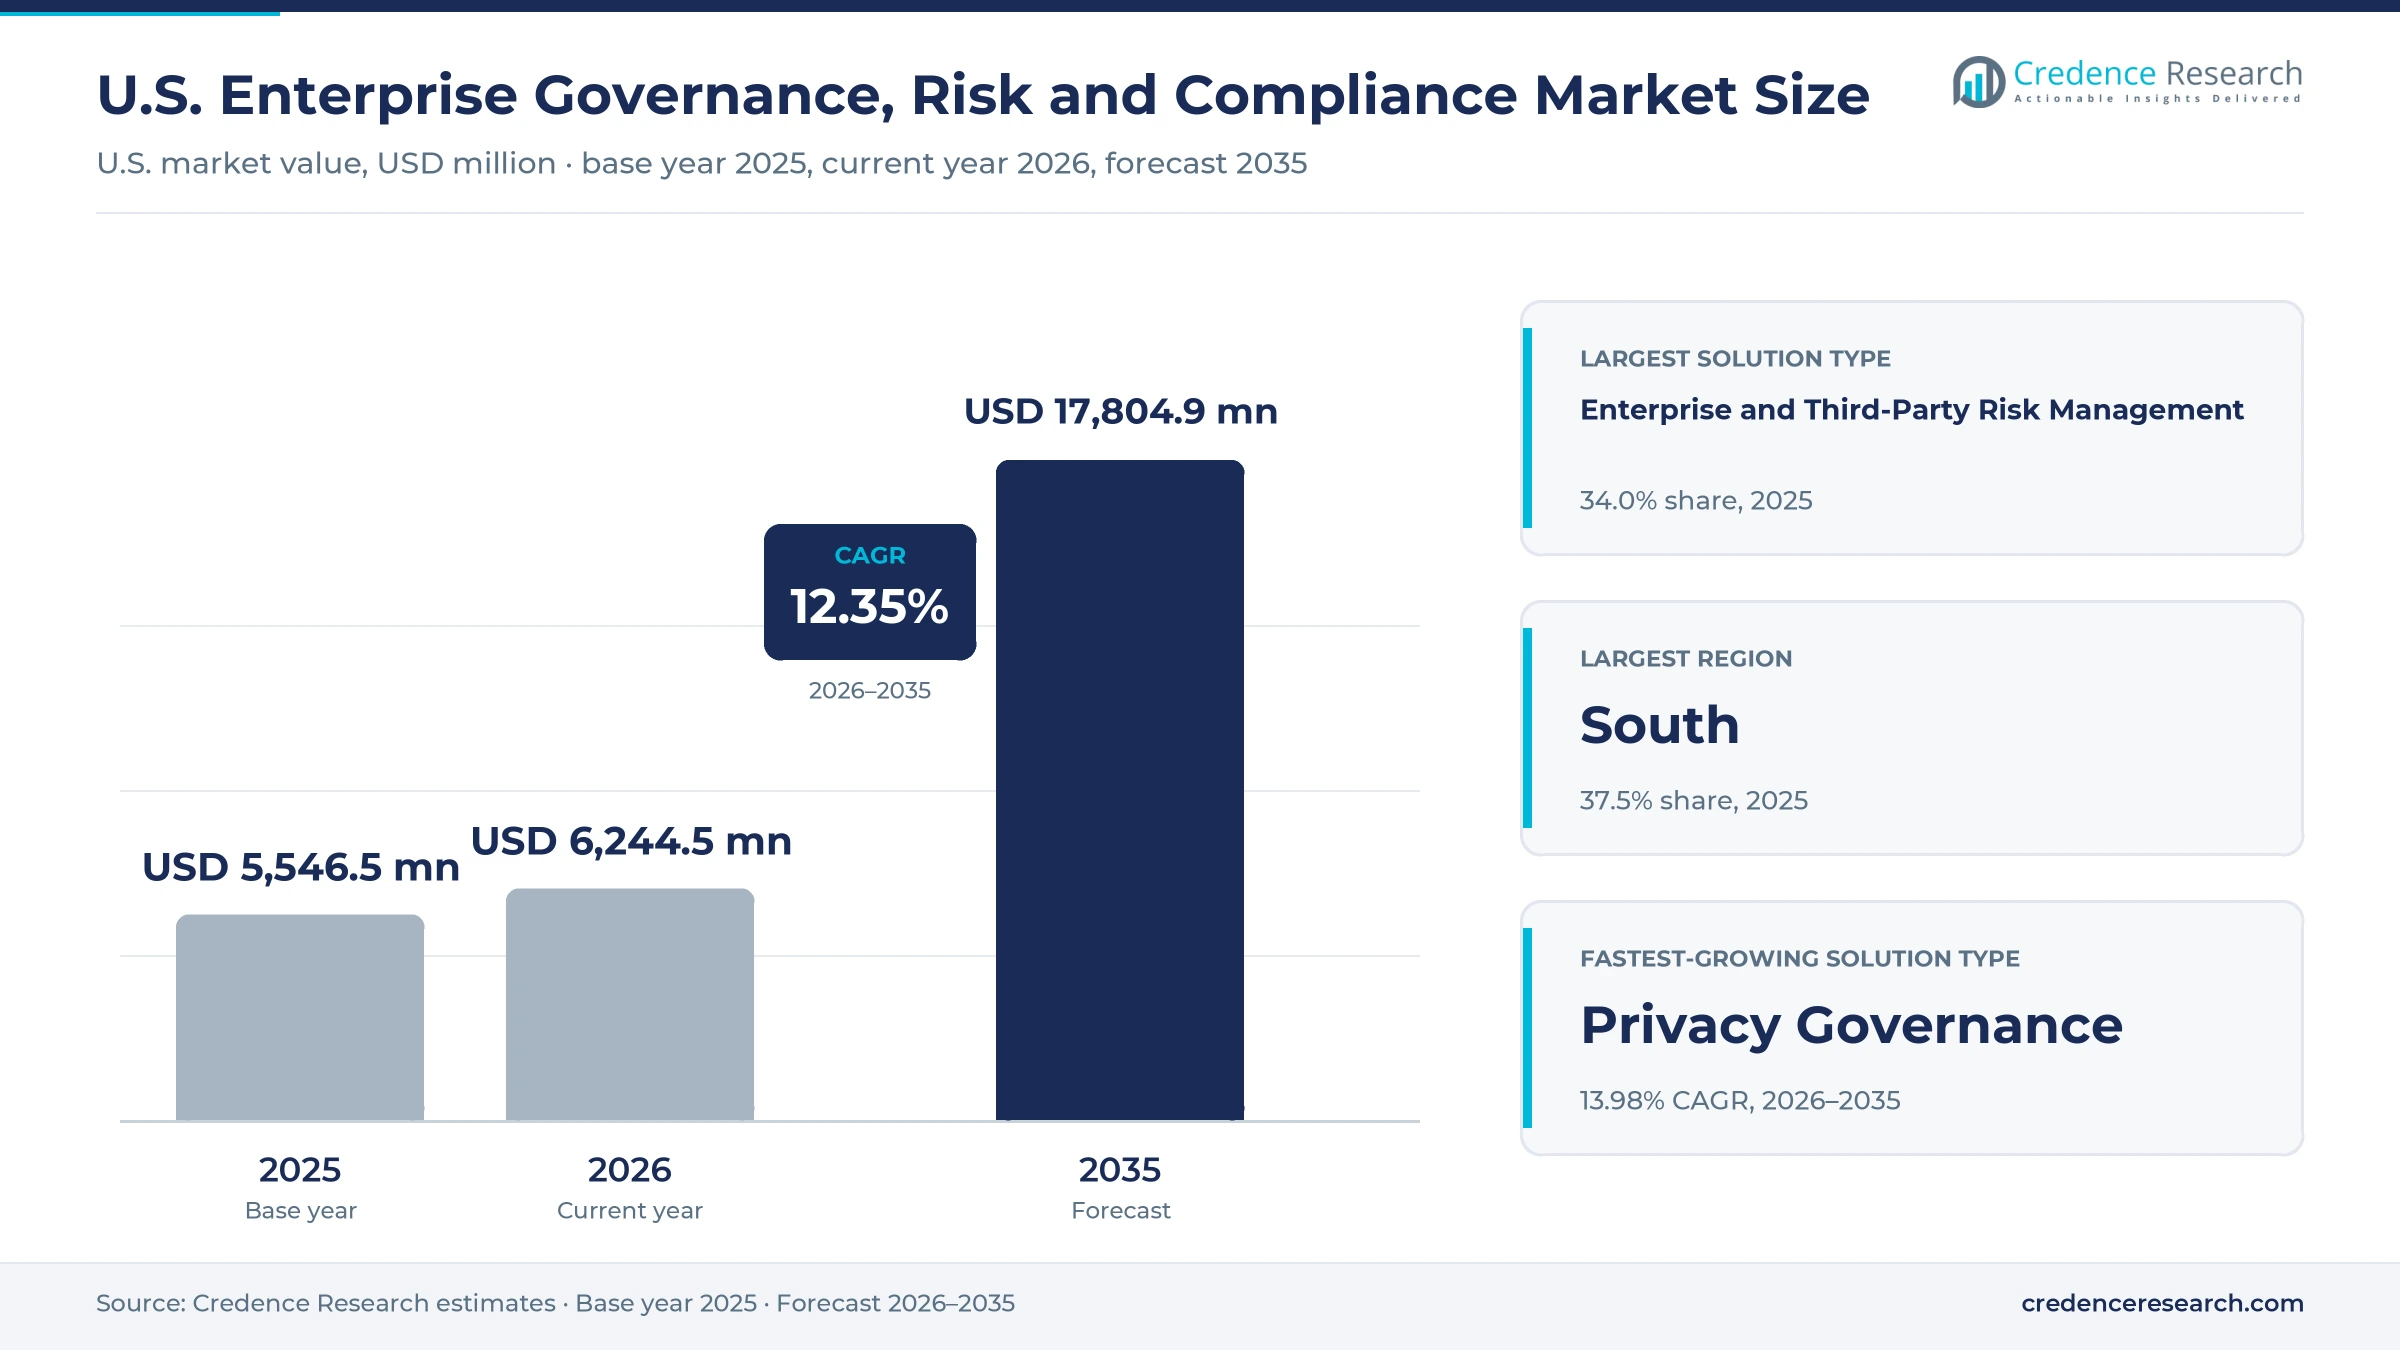
The U.S. enterprise governance, risk and compliance market was valued at USD 5.55 billion in 2025 and is projected to increase from USD 6.24 billion in 2026 to USD 17.80 billion by 2035, registering a CAGR of 12.35% during 2026–2035. Demand comes from banks, insurers, health systems, technology firms and public agencies that must document risks, controls and incidents for regulators and boards. The South held the largest regional share, 37.5% in 2025, and it is also the fastest-growing region at 12.83% a year. Disclosure duties set the pace, because the SEC cybersecurity rule has required Form 8-K incident reports since Dec. 18, 2023, and New York expanded its Part 500 controls on Nov. 1, 2025. AI rules add a second layer of work, as Texas HB 149 took effect on Jan. 1, 2026, and California automated decisionmaking duties begin on Jan. 1, 2027. Vendors are responding with AI agents that draft assessments and collect evidence inside cloud platforms.
What does enterprise GRC spending cover in the U.S.?
The market counts spending on software and services that help U.S. organizations manage enterprise and third-party risk, compliance and policy programs, audit and internal controls, and privacy governance. Buyers purchase cloud subscriptions, on-premises licenses and hybrid deployments, together with implementation work and managed programs, through direct enterprise sales, partners and cloud marketplaces.
The estimate excludes general security tools such as firewalls and endpoint protection, external audit fees, legal advice and internal compliance staff salaries. It also excludes ERP and HR systems unless a GRC module is priced separately, although control content and evidence collection that run inside those systems are counted.
U.S. Enterprise Governance, Risk and Compliance Market Insights
- The market grows from USD 5.55 billion in 2025 to USD 17.80 billion by 2035, a 12.35% CAGR, as AI, privacy and incident rules turn GRC into a daily workflow.
- The South held 37.5% of 2025 value, supported by 133.8 million residents, Texas AI rules and defense supplier mandates.
- Enterprise and third-party risk management held 34.0% of 2025 value, anchored by joint bank regulator guidance issued in June 2023.
- The SEC cybersecurity disclosure rule took effect on Dec. 18, 2023, linking risk registers and incident reviews to public filings.
- AuditBoard agreed to acquire AI governance specialist FairNow in October 2025, then renamed itself Optro in March 2026 to stress agentic AI for audit teams.
Third-party risk leads as privacy governance grows fastest
Why does enterprise and third-party risk management lead?
Based on solution type, the market is categorized into enterprise and third-party risk management, compliance and policy management, audit and internal controls management, and privacy governance. Enterprise and Third-Party Risk Management led with 34.0% of 2025 value because the Federal Reserve, FDIC and OCC issued joint third-party guidance on June 6, 2023, covering five stages from planning to termination of each vendor relationship. SEC Regulation S-P amendments also require service providers to report breaches to covered firms within 72 hours. Privacy Governance grows fastest at 13.98% a year as the IAPP counted 19 states with comprehensive privacy laws by October 2025.
Why does software hold most component spending?
Based on component, the market is categorized into software, professional services and managed services. Software led with 62.0% of 2025 value because buyers license platforms for risk registers, controls and evidence, and Workiva reported 6,624 customers on Dec. 31, 2025, a net gain of 319 in one year with 97% gross retention. Managed Services grow fastest at 13.94% a year as HHS estimated that its proposed HIPAA Security Rule update would cost regulated entities about USD 9 billion in the first year, which pushes smaller providers to outsource asset inventories, testing and recovery planning.
How do large enterprises and mid-market buyers divide demand?
Based on customer type, the market is categorized into large enterprises, mid-market enterprises and small businesses. Large Enterprises led with 58.0% of 2025 value because listed companies carry SEC incident disclosure duties, and Optro said in March 2026 that more than half of the Fortune 500 use its platform. NAVEX serves 13,000 organizations, including 75% of Fortune 100 and Fortune 500 companies, according to SecurityBrief in July 2026. Mid-Market Enterprises grow fastest at 13.41% a year as CMMC contract clauses took effect on Nov. 10, 2025, reaching thousands of defense suppliers.
Why do financial firms lead and health care grow fastest?
Based on end-use industry, the market is categorized into banking, financial services and insurance, healthcare and life sciences, technology and IT, and cross-sector enterprises and public agencies. Banking, Financial Services and Insurance led with 36.0% of 2025 value because expanded New York Part 500 rules on multi-factor authentication and asset management took effect on Nov. 1, 2025, and larger SEC-registered firms had to meet amended Regulation S-P by Dec. 3, 2025. Healthcare and Life Sciences grows fastest at 13.44% a year as UnitedHealth Group raised the Change Healthcare breach count to 190 million people in January 2025.
| Segment Group | Leading Sub-segment | Share, 2025 | Fastest-growing Sub-segment | CAGR, 2026–2035 |
|---|---|---|---|---|
| By Solution Type | Enterprise and Third-Party Risk Management | 34.0% | Privacy Governance | 13.98% |
| By Component | Software | 62.0% | Managed Services | 13.94% |
| By Customer Type | Large Enterprises | 58.0% | Mid-Market Enterprises | 13.41% |
| By End-Use Industry | Banking, Financial Services and Insurance | 36.0% | Healthcare and Life Sciences | 13.44% |
Request a Free Sample
Fill in your details and we'll send you a free sample report.
- Sample data tables & charts
- Research methodology
Incident rules, AI laws and cloud entry lift spending
Incident disclosure rules tie risk records to filings
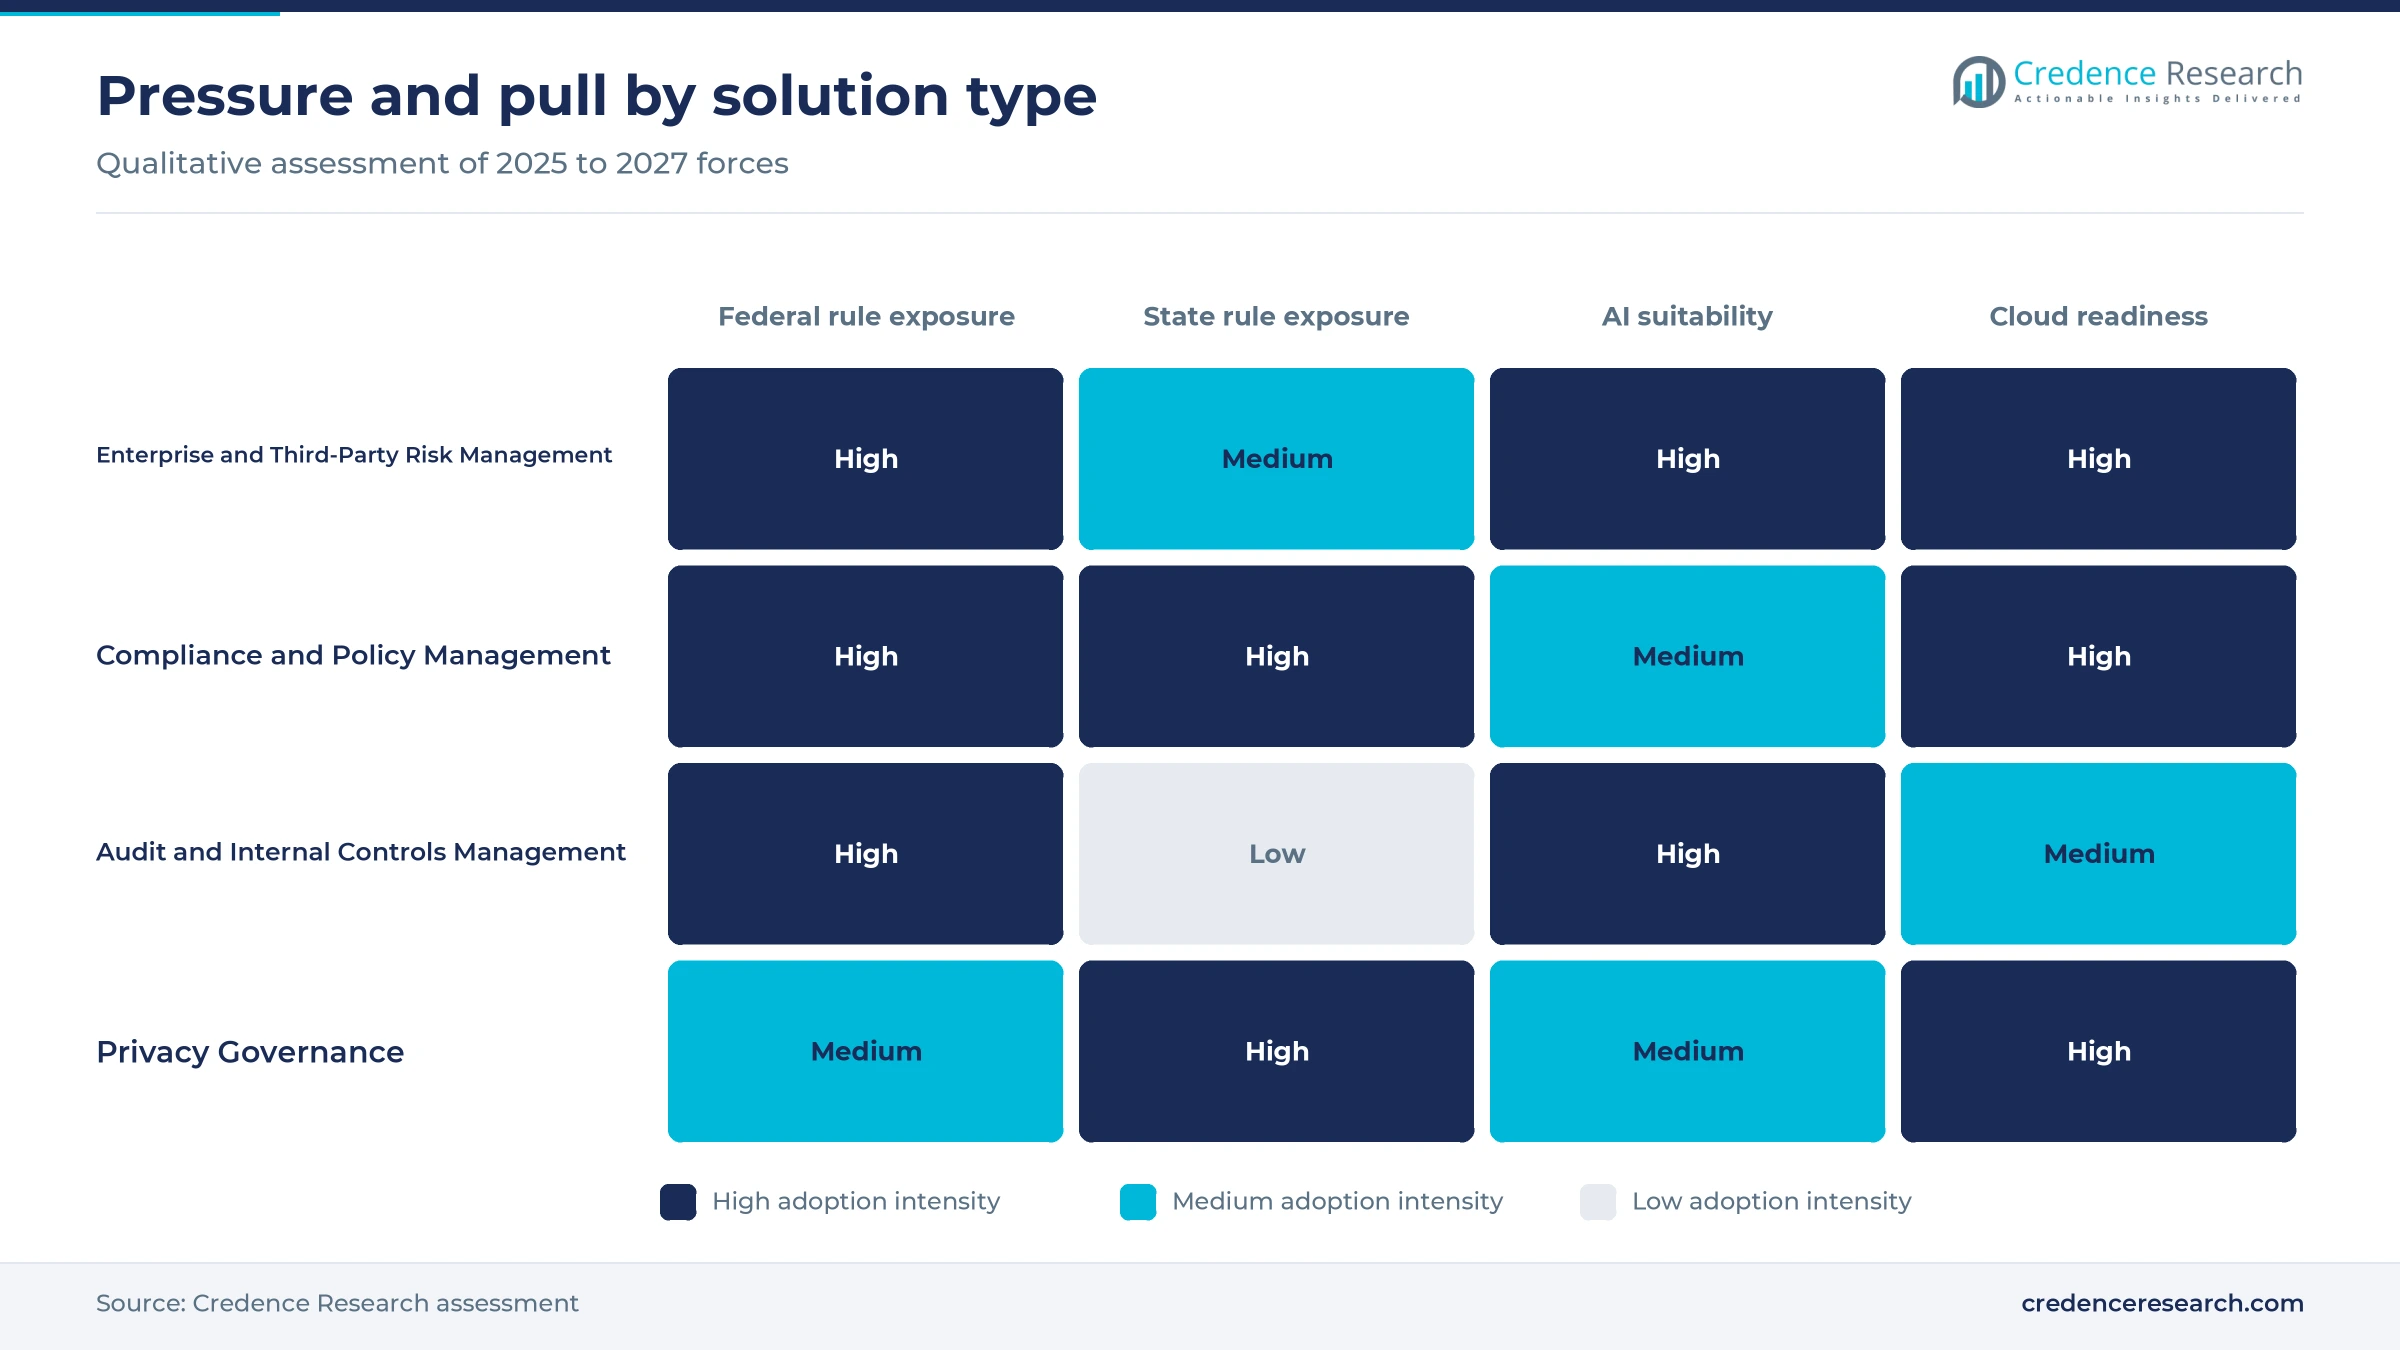
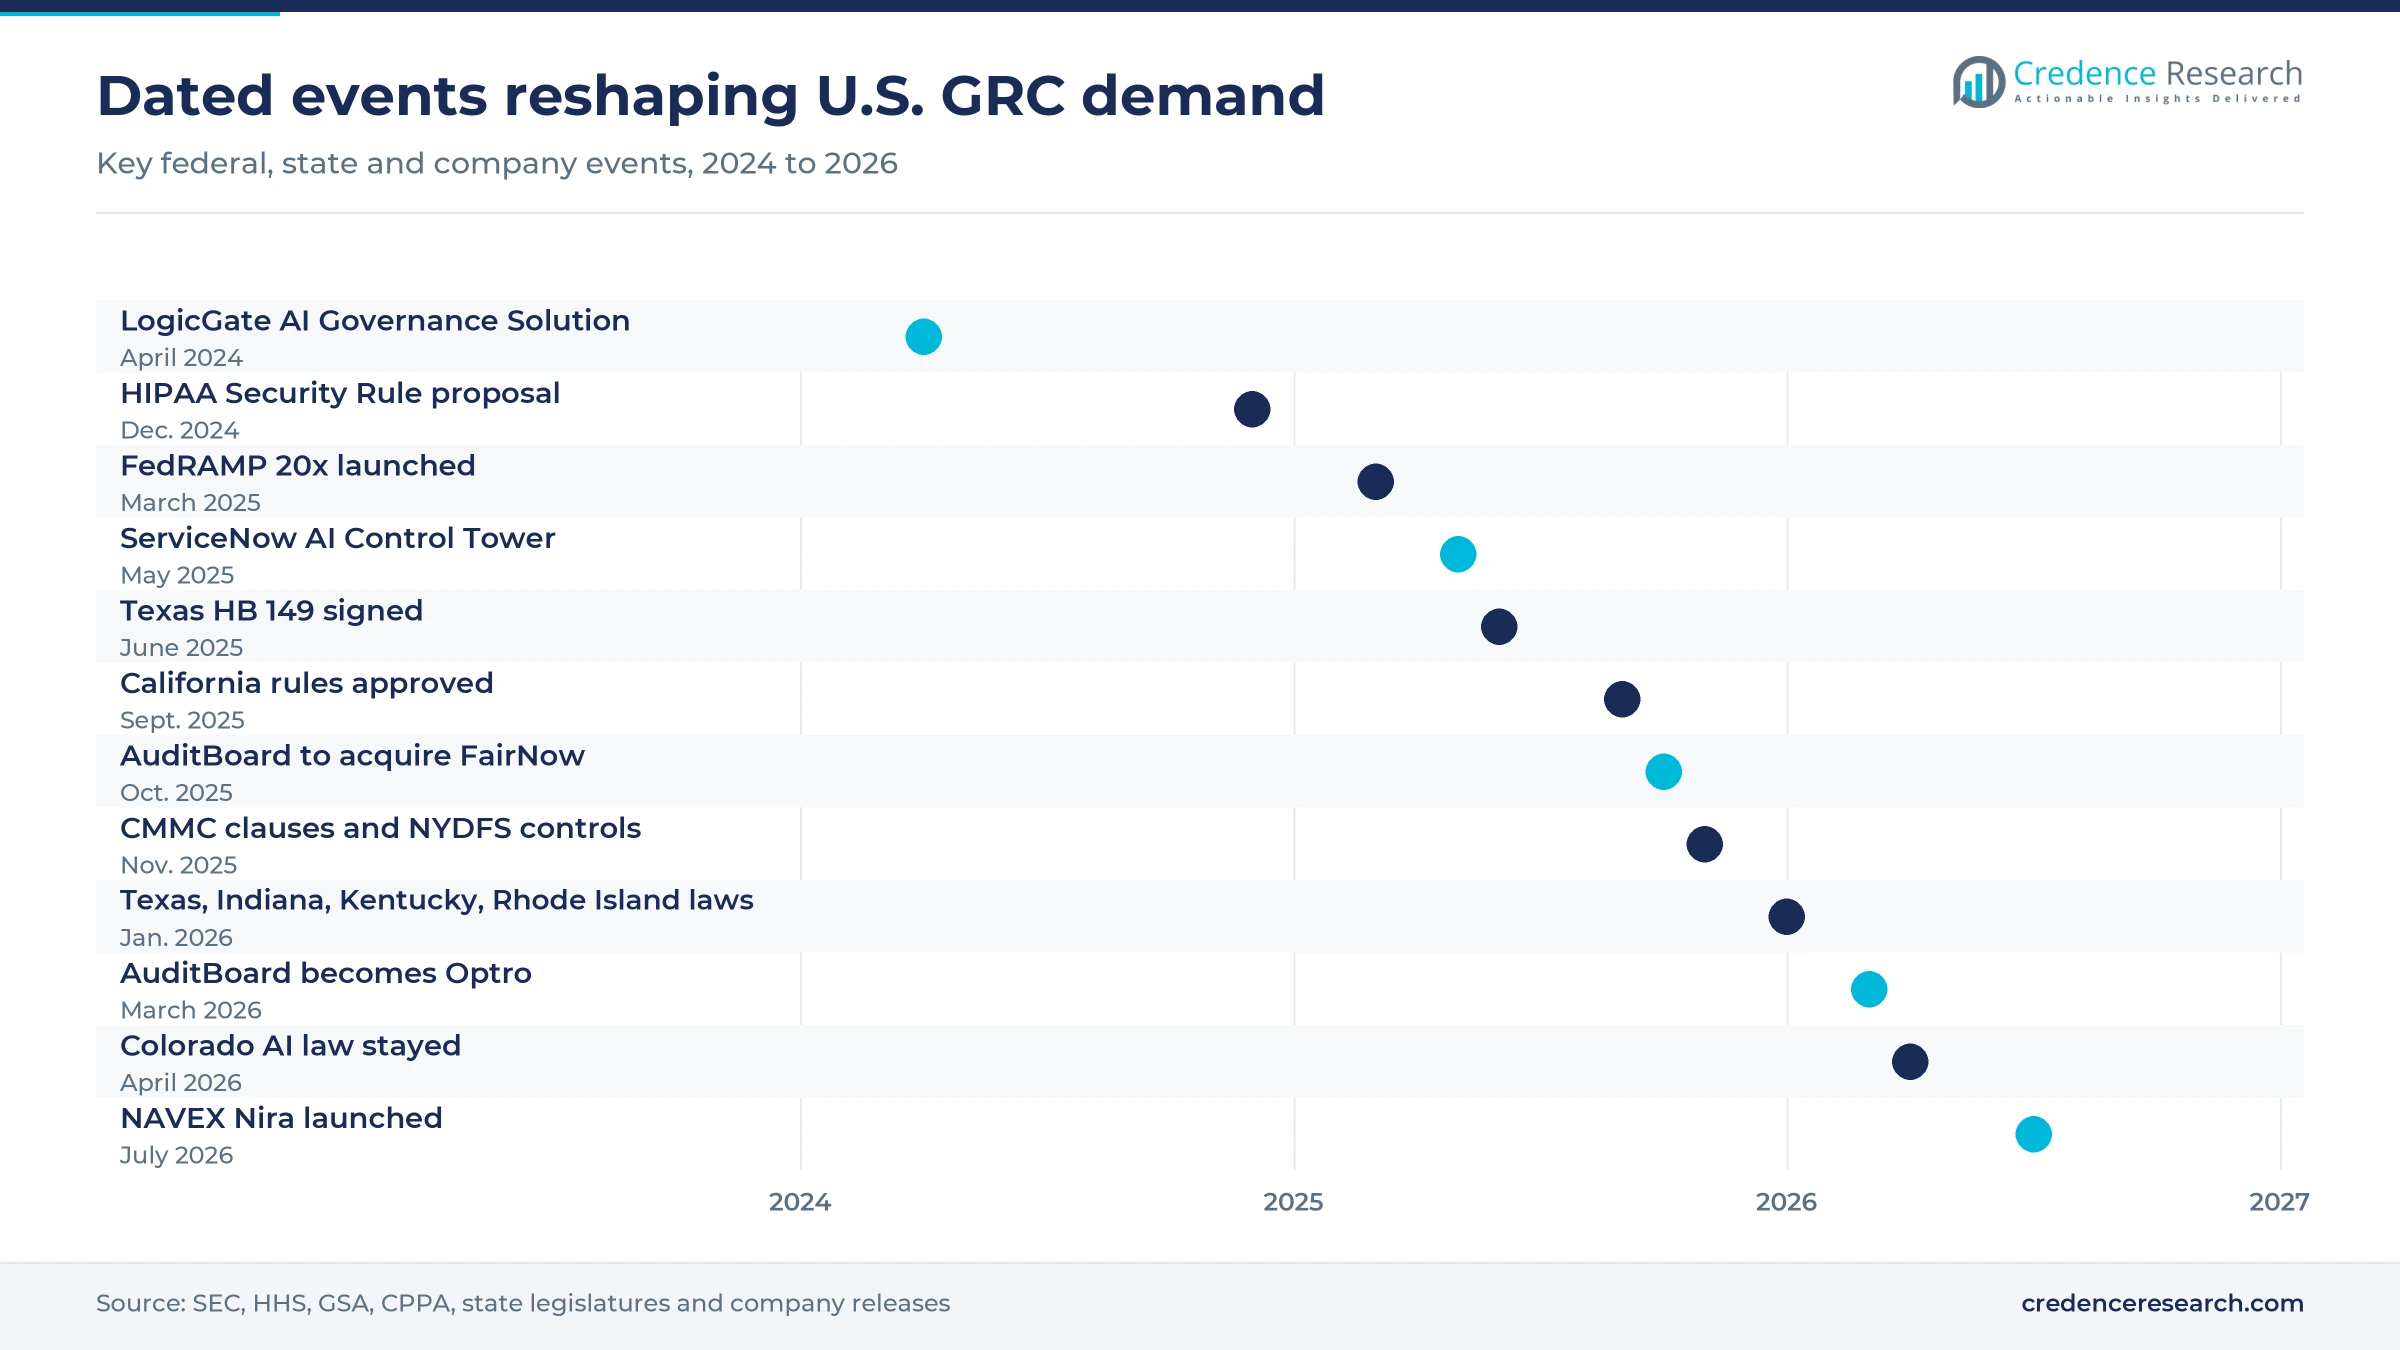
Incident accountability rules now link risk registers, control tests and board reporting to public filings, which moves GRC software from audit teams into legal and finance workflows. The SEC cybersecurity disclosure rule took effect on Dec. 18, 2023, and the Society for Corporate Governance counted 80 Form 8-K incident filings through Jan. 19, 2025, with 51% filed under Item 1.05. Board Cybersecurity tracked 64 disclosed incidents in 2023, 55 in 2024 and 32 in 2025, so materiality reviews now run as repeatable workflows. The Justice Department also updated its Evaluation of Corporate Compliance Programs on Sept. 23, 2024, asking whether companies assess technology risks and use data analytics in compliance. As a result, Enterprise and Third-Party Risk Management holds 34.0% of 2025 value in the Credence Research estimate.
AI laws require governed and controlled automation
AI laws are turning model inventories and impact assessments into audited records, which creates a new GRC module for most large buyers. Texas signed HB 149 on June 22, 2025, effective Jan. 1, 2026, with fines of up to USD 200,000 per uncurable violation and a safe harbor for firms that follow the NIST AI Risk Management Framework. California regulators finalized rules on Sept. 23, 2025 that start risk assessment duties on Jan. 1, 2026, and automated decisionmaking duties on Jan. 1, 2027. AuditBoard agreed on Oct. 22, 2025, to acquire FairNow, citing its finding that fewer than 30% of leaders felt ready for AI governance requirements. OneTrust also reported a 37% rise in time spent managing AI risk in September 2025.
Cloud migration opens mid-market and agency demand
Cloud migration lowers the cost of entry for mid-market buyers and agencies, because hosted platforms replace custom servers, consultants and spreadsheets. GSA launched FedRAMP 20x on March 24, 2025, aiming to authorize most cloud offerings in weeks instead of years, which widens public agency access to hosted GRC tools. SAP is replacing GRC 12.0 with SAP GRC for HANA 1.0, with ramp-up from the second quarter of 2026 and general availability targeted for the fourth quarter, according to SAPinsider. Workiva added a net 319 customers in 2025 to reach 6,624, showing steady growth beyond the largest filers. Lower entry costs also support GRC demand in the West, which grows at 12.43% a year in the Credence Research model.
Defense and health security rules widen control mandates
Federal security mandates are widening the set of organizations that must document controls, which pulls in buyers that never owned GRC software. The CMMC contract rule was published on Sept. 10, 2025, and took effect on Nov. 10, 2025, with a three-year phase-in for defense contracts. The Defense Department has estimated that about 80,000 suppliers will need third-party Level 2 assessments out of about 220,000 companies in the defense industrial base, MeriTalk reported. In health care, HHS proposed a HIPAA Security Rule overhaul on Dec. 27, 2024, requiring asset inventories, multi-factor authentication and encryption at about USD 9 billion in first-year cost. These rules raise demand for identity access platforms and control evidence that feed GRC records.
AI agents and unified intake reshape GRC platforms
Shift to agentic AI inside GRC platforms
GRC vendors are shifting from dashboards to AI agents that draft assessments, collect evidence and flag issues, which changes what buyers evaluate. ServiceNow launched AI Control Tower on May 6, 2025, at Knowledge 2025 as a central hub to oversee its own and third-party AI agents, models and workflows. MetricStream adopted an AI-first strategy on May 13, 2025, using agentic AI to capture data, run assessments and suggest actions for more than 1 million GRC professionals. NAVEX launched its Nira agent on July 8, 2026, starting with analytics on compliance program data. AuditBoard became Optro on March 9, 2026, describing an agentic system of action for audit, risk and compliance teams.
Rise of unified privacy and third-party intake
Privacy and vendor reviews are merging into one automated intake, as the same project now triggers privacy, security and AI assessments. OneTrust announced a Third-Party Risk Agent and a Privacy Agent on Sept. 9, 2025, converting project documents into structured privacy impact responses for its more than 14,000 customers. IBM introduced combined watsonx.governance and Guardium AI Security software on June 18, 2025, validating compliance across 12 frameworks such as ISO 42001. LogicGate packaged an AI Governance Solution on its Risk Cloud platform in April 2024, including a third-party AI questionnaire based on SIG Lite. This shift lifts data privacy software spending, and Privacy Governance grows at 13.98% a year.
Opening in healthcare control evidence and recovery
Health care offers a clear opening, because breach scale and proposed rules now demand documented controls at hospitals, payers and suppliers. UnitedHealth Group said in January 2025 that the Change Healthcare attack affected about 190 million people, Infosecurity Magazine reported. HHS also proposed requiring a technology asset inventory and network map updated every 12 months, plus recovery of critical systems within 72 hours. HHS estimated recurring costs of about USD 6 billion a year after the first year, which favors shared platforms and managed services over manual programs. Vendors that link healthcare cyber security tools with policy and audit records can capture this work, and Healthcare and Life Sciences grows at 13.44% a year in the Credence Research model.
Opening in mid-market and defense supplier programs
Mid-market and defense supplier programs form a second opening, since many of these firms still manage controls in spreadsheets. The CMMC phase-in that began on Nov. 10, 2025, will reach more contracts over three years, and the Defense Department estimated that about 140,000 companies need only Level 1 self-assessments. SEC Regulation S-P amendments gave smaller covered entities until June 3, 2026, to adopt incident response programs and service provider oversight. California phases its cybersecurity audit certifications by business size, with the smallest firms due by April 1, 2030. Packaged cloud editions sold through partners suit these buyers, and Mid-Market Enterprises grow at 13.41% a year in the Credence Research estimate.
Shifting AI rules and privacy patchwork slow buyers
Does the shifting state AI rulebook delay purchases?
Shifting state AI rules make buyers hesitate, because the target can change before a program is finished. Colorado delayed its AI Act to June 30, 2026, then a federal magistrate judge stayed enforcement on April 27, 2026, after xAI sued, according to Proskauer. Lawmakers passed SB 26-189 on May 9, 2026, and sent it to Governor Polis, which would replace the high-risk AI framework with rules on automated decision-making technology. Buyers therefore postpone AI governance modules or run short pilots until the duties settle.
How does the state privacy patchwork raise configuration costs?
State privacy laws differ on thresholds, rights and assessment duties, which multiplies the rule sets that vendors and buyers must maintain. The IAPP counted 19 states with comprehensive privacy laws in October 2025, and the laws of Indiana, Kentucky and Rhode Island took effect on Jan. 1, 2026. California adds separate risk assessment attestations due by April 1, 2028. Each change requires new mapping, testing and reporting work, which raises costs for mid-market buyers with small compliance teams.
Will ERP platform migrations absorb GRC budgets?
Platform migrations absorb budgets that could fund new GRC modules, because control rules must be rebuilt and tested. SAP is replacing GRC 12.0 with SAP GRC for HANA 1.0, with general availability targeted for the fourth quarter of 2026, according to SAPinsider. Firms that delay could carry access control weaknesses into new ERP systems, the same article warned. Integration work across ERP, HR and ticketing systems therefore lengthens projects and delays the point at which automation cuts audit hours.
Can declining incident filings weaken budget urgency?
Falling public incident counts can weaken the case for new spending, because boards see fewer headline disclosures. Board Cybersecurity counted 32 incidents first disclosed on Form 8-K in 2025, down from 64 in 2023 and 55 in 2024. Item 1.05 filings also fell from 72% to 34% of incident filings after SEC staff guidance in May and June 2024, the Society for Corporate Governance reported. Vendors therefore must prove savings in audit hours and faster reviews rather than relying on disclosure fear.
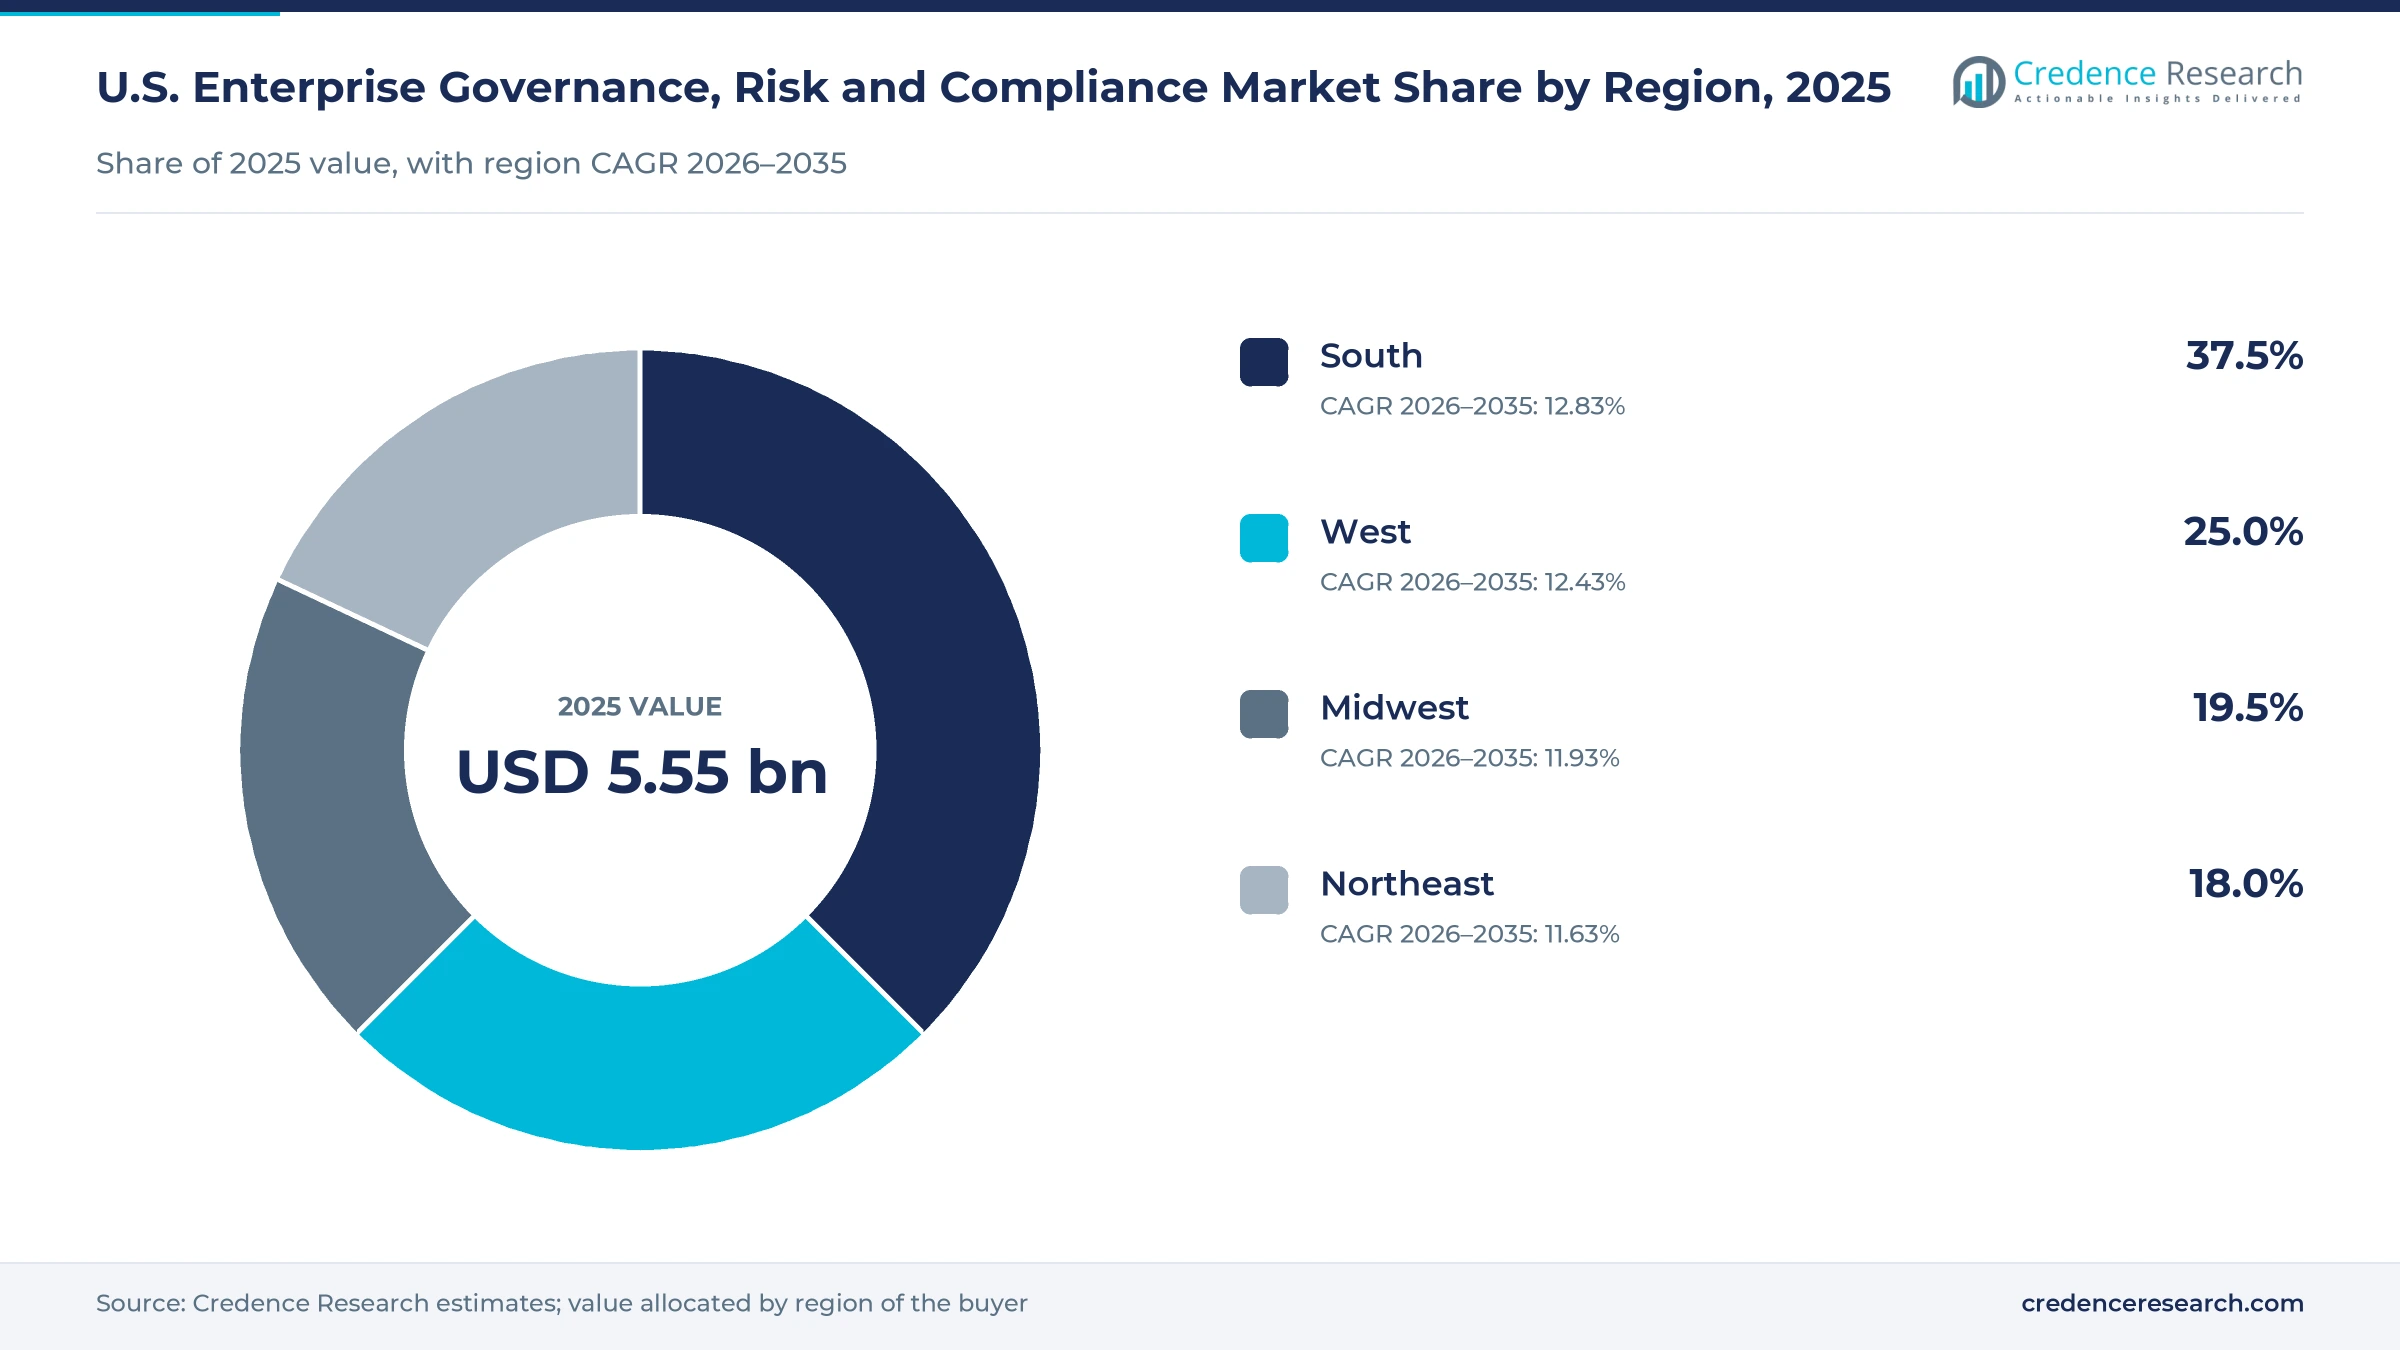
The South leads on population, defense and new state laws
| Region | Value, 2025 (USD billion) | Share, 2025 | CAGR, 2026–2035 |
|---|---|---|---|
| South | 2.08 | 37.5% | 12.83% |
| West | 1.39 | 25.0% | 12.43% |
| Midwest | 1.08 | 19.5% | 11.93% |
| Northeast | 1.00 | 18.0% | 11.63% |
Texas AI rules and population growth lift the South
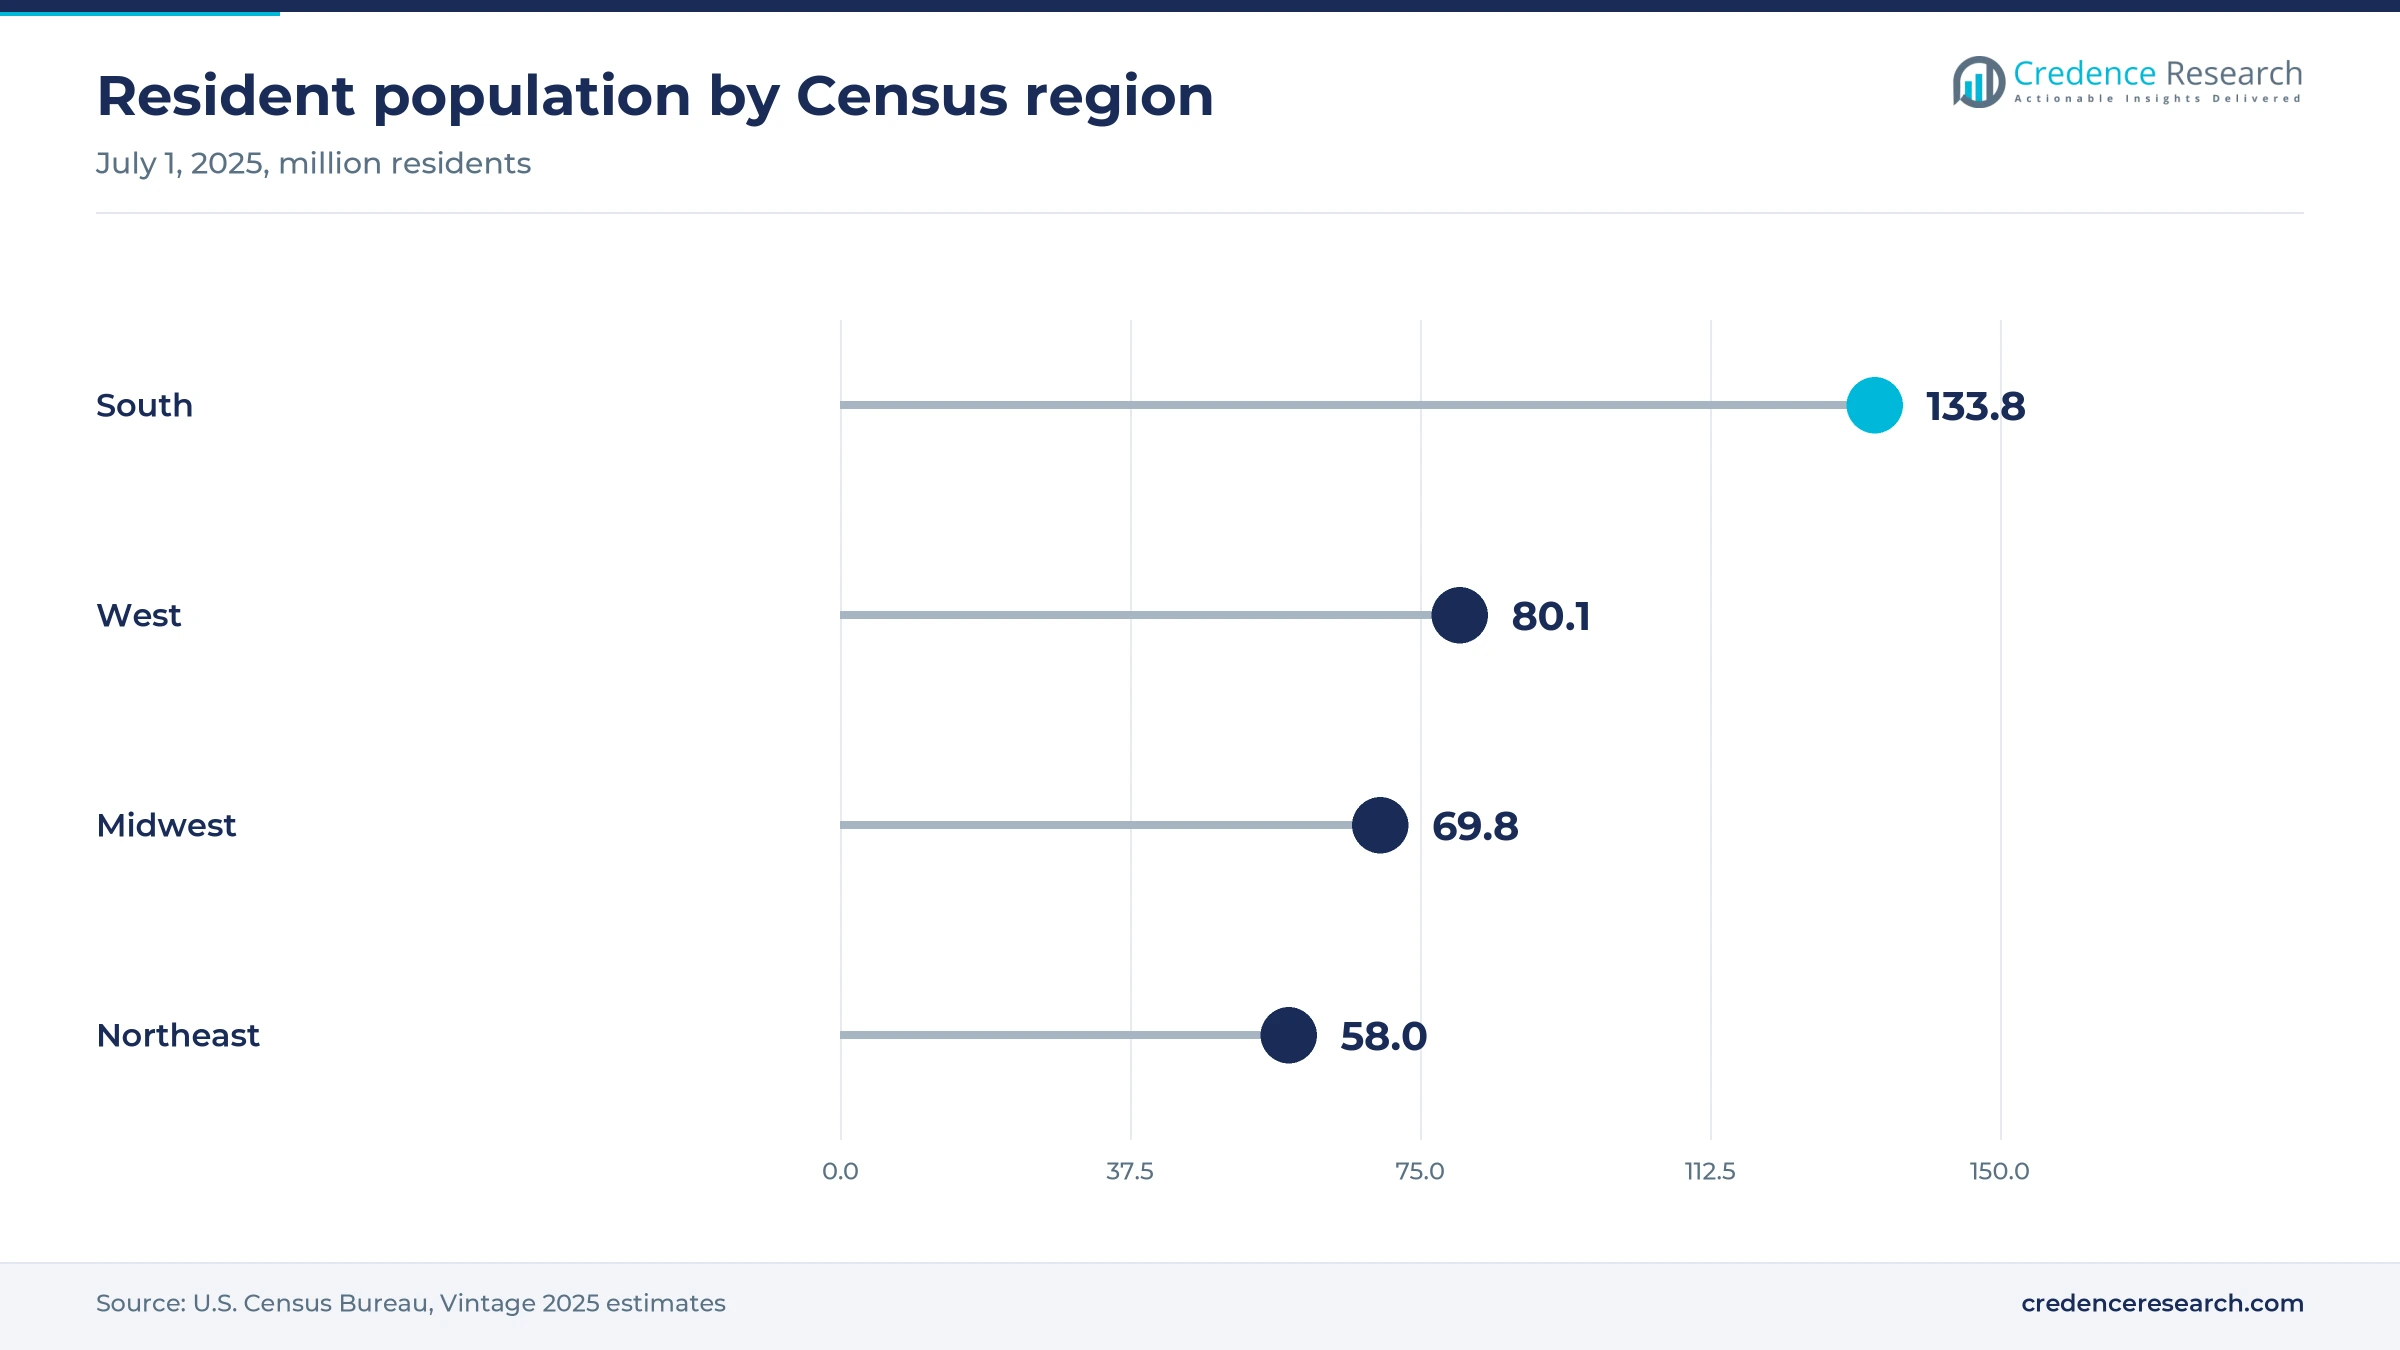
The South held 37.5% of 2025 value and grows at 12.83% a year, the fastest pace among the four regions. Census Bureau estimates put the South at 133.8 million residents on July 1, 2025, after 6.0% growth since April 2020, nearly double the national rate. Texas adds AI duties under HB 149 from Jan. 1, 2026, and the Kentucky privacy law took effect the same day. Defense suppliers in the region also face CMMC clauses from Nov. 10, 2025.
The West is shaped by California privacy and audit rules
The West held 25.0% of 2025 value and grows at 12.43% a year, helped by broad California privacy and audit rules. California Privacy Protection Agency regulations took effect on Jan. 1, 2026, with risk assessment attestations due by April 1, 2028. The Colorado AI law remains in flux after the April 2026 court stay. The West had 80.1 million residents in 2025, and Optro announced its new identity at an Institute of Internal Auditors conference in Las Vegas in March 2026.
The Midwest adds Indiana privacy duties
The Midwest held 19.5% of 2025 value and grows at 11.93% a year, slightly below the national pace. The Indiana comprehensive privacy law took effect on Jan. 1, 2026, adding a new rule set for manufacturers, insurers and health systems in the region. LogicGate announced its AI Governance Solution from Chicago in April 2024. The Midwest had 69.8 million residents in July 2025, up 1.1% since April 2020, according to the Census Bureau, which limits growth in new buyer counts.
The Northeast relies on New York financial buyers
The Northeast held 18.0% of 2025 value and grows at 11.63% a year, the slowest rate among the four regions. Expanded New York Part 500 rules on multi-factor authentication and IT asset management took effect on Nov. 1, 2025, for banks and insurers regulated by NYDFS. The Rhode Island privacy law also took effect on Jan. 1, 2026. Population growth was the weakest, at 0.7% from April 2020 to July 2025, which keeps demand tied to upgrades by existing financial buyers.
Acquisitions, rebrands and AI agents mark 2025 and 2026
| Development | Status and market relevance |
|---|---|
| In May 2025, ServiceNow launched AI Control Tower at Knowledge 2025 to govern its own and third-party AI agents, models and workflows. | Generally available; extends risk oversight to AI |
| In October 2025, AuditBoard agreed to acquire FairNow, adding an AI registry, risk assessments and automated AI compliance. | Announced; expands AI governance features |
| In November 2025, CMMC contract clauses took effect for defense prime contractors and subcontractors under a three-year phase-in. | In effect; widens supplier control duties |
| In March 2026, AuditBoard became Optro, positioning its platform as an agentic system for audit, risk and compliance. | Rebranded; more than half of the Fortune 500 use it |
| In July 2026, NAVEX launched Nira, an AI agent in NAVEX One that starts with analytics on compliance program data. | Launched; serves 13,000 organizations |
AI agents, registries and cloud approvals change GRC
- AI agents draft assessments, collect evidence and suggest actions, as MetricStream described in May 2025 and NAVEX introduced with Nira in July 2026.
- AI registries record models and use cases with risk scores, the role FairNow brings to Optro and Databricks Unity Catalog syncing brings to OneTrust.
- Cloud authorization under FedRAMP 20x aims to approve most cloud offerings in weeks, widening agency access to hosted GRC platforms.
- SAP GRC for HANA 1.0 brings AI-assisted rule creation through Joule for S/4HANA customers, with maintenance confirmed through 2040.
Need a Custom Version of This Report?
Tailor the scope, geography, or segments to your exact requirements.
- Custom geography or segment scope
- Direct access to our analyst team
Vendors compete on AI agents and regulatory content
Competition in U.S. enterprise GRC centers on AI agents, regulatory content and the ability to run privacy, vendor and audit work on one platform. ServiceNow embeds risk management in its workflow platform and added AI Control Tower in May 2025. OneTrust serves more than 14,000 customers and added third-party risk and privacy agents in September 2025. NAVEX serves 13,000 organizations and launched Nira in July 2026. Optro, formerly AuditBoard, bought FairNow for AI governance and says more than half of the Fortune 500 use it. Workiva links reporting with controls for 6,624 customers, while IBM pairs watsonx.governance with Guardium AI Security. MetricStream, SAP and LogicGate compete on AI-first suites, ERP controls and configurable cloud apps, and buyers often compare suites with standalone audit management software.
How do the leading vendors position their offers?
| Company | Type | Role in the market |
|---|---|---|
| ServiceNow | Workflow platform | AI Control Tower launched May 2025 to govern AI agents, models and workflows |
| OneTrust | Privacy and third-party platform | More than 14,000 customers; Third-Party Risk Agent and Privacy Agent in September 2025 |
| NAVEX | Ethics and compliance platform | Serves 13,000 organizations; Nira AI agent launched July 2026 |
| Optro (formerly AuditBoard) | Audit, risk and compliance platform | Agreed to acquire FairNow in October 2025; rebranded March 2026 |
| Workiva | Reporting and controls platform | 6,624 customers at Dec. 31, 2025, with 97% gross retention |
| IBM | AI governance software | watsonx.governance with Guardium AI Security covering 12 frameworks, June 2025 |
| MetricStream | Integrated GRC suite | AI-first strategy and new CEO announced May 2025 |
| SAP | ERP-embedded GRC | SAP GRC for HANA 1.0 ramp-up from the second quarter of 2026 |
| LogicGate | Configurable cloud GRC | AI Governance Solution on Risk Cloud launched April 2024 |
Governed automation decides vendor selection to 2030
Credence Research's view is that governed automation will decide U.S. enterprise GRC vendor selection to 2030. Buyers want AI agents that cut evidence collection time, yet Texas, California and Colorado rules require documented oversight of the same AI. Vendors that pair AI registries with audit trails, as Optro did by buying FairNow, are better placed than those selling agents alone. Mid-market buyers and health care providers will add the most new accounts, while large financial firms keep the largest share and replace older on-premises tools with cloud platforms.
How U.S. GRC spending was modeled
The report uses 2025 as the base year and 2035 as the forecast year, with market values taken from the Credence Research model. Solution type, component, customer type, industry and regional splits are Credence Research estimates informed by public data and are not reported statistics. Sources include SEC, HHS, GSA and Census Bureau releases, state regulator announcements, law firm and trade press summaries of new rules, and company press releases and filings. No interviews or surveys were conducted for this edition, so segment shares should be read as modeled ranges.
AI duties and mid-market cloud demand drive growth to 2035
From USD 6.24 billion in 2026, the market is expected to reach USD 17.80 billion by 2035 as AI, privacy and incident rules widen the work that must be documented. California automated decisionmaking duties from Jan. 1, 2027, and cybersecurity audit certifications from 2028 set the near-term pace. Privacy governance and managed services grow fastest, while the South keeps the largest regional share. U.S. enterprise GRC spending therefore depends on clear state AI rules, cloud adoption by mid-market firms and proof that AI agents cut audit hours without weakening control.
Frequently Asked Questions
How big is the U.S. enterprise governance, risk and compliance market?
Which solution type holds the largest share?
Which region leads and which grows fastest?
How does the SEC cybersecurity rule affect GRC demand?
Which AI laws shape U.S. GRC purchases?
Why does health care grow fastest among industries?
How does CMMC affect mid-market demand?
Who are the leading companies?
Table of Content
Chapter 1 Market Segmentation
- 1.1 Segmentation Framework
- 1.1.1 Product and Service Classification
- 1.1.2 Application and End-Use Classification
- 1.1.3 Technology and Solution Classification
- 1.1.4 Customer and Distribution Channel Classification
- 1.1.5 Geographic Segmentation
- 1.1.6 Market Segment Definitions and Boundaries
- 1.2 By Solution Type
- 1.2.1 Enterprise and Third-Party Risk Management
- 1.2.2 Compliance and Policy Management
- 1.2.3 Audit and Internal Controls Management
- 1.2.4 Privacy Governance
- 1.3 By Component
- 1.3.1 Software
- 1.3.2 Professional Services
- 1.3.3 Managed Services
- 1.4 By Customer Type
- 1.4.1 Large Enterprises
- 1.4.2 Mid-Market Enterprises
- 1.4.3 Small Businesses
- 1.5 By End-Use Industry
- 1.5.1 Banking, Financial Services and Insurance
- 1.5.2 Healthcare and Life Sciences
- 1.5.3 Technology and IT
- 1.5.4 Cross-Sector Enterprises and Public Agencies
Chapter 2 Introduction
- 2.1 Report Objectives and Scope
- 2.2 Product Definition and Industry Terminology
- 2.3 Market Inclusions and Exclusions
- 2.4 Research Process
- 2.4.1 Primary Research and Expert Interviews
- 2.4.2 Secondary Research and Source Review
- 2.4.3 Top-Down and Bottom-Up Estimation
- 2.4.4 Data Triangulation and Verification
- 2.5 Market Size Measurement Basis
- 2.5.1 2025: USD 5.55 billion → 2035: USD 17.80 billion
- 2.6 Historical and Forecast Reference Periods
- 2.6.1 Historical Period: 2018-2025
- 2.6.2 Base Year: 2025
- 2.6.3 Forecast Period: 2025-2035
- 2.7 Research Assumptions and Limitations
Chapter 3 Executive Summary
- 3.1 Market Snapshot and Key Findings
- 3.2 Base-Year Market Size, 2025
- 3.3 Forecast Market Size, 2035
- 3.4 Revenue and Volume Growth Outlook
- 3.5 Key Demand and Supply Indicators
- 3.6 Leading Market Segments
- 3.7 Fastest-Growing Market Opportunities
- 3.8 Regional Performance Highlights
- 3.9 Technology and Industry Transformation
- 3.10 Competitive Landscape Summary
- 3.11 Analyst View and Strategic Implications
Chapter 4 U.S. Enterprise Governance, Risk and Compliance Market Trends and Developments
- 4.1 Historical Industry Development, 2018-2025
- 4.2 Recent Market Trends and Developments
- 4.3 Demand and Customer Behavior Trends
- 4.4 Technology and Product Innovation
- 4.5 Artificial Intelligence, Automation and Digitalization
- 4.6 Local Manufacturing and Supply Chain Realignment
- 4.7 Industry Partnerships, Mergers and Acquisitions
- 4.8 Sustainability and Circular Economy Developments
- 4.9 Government and Private Sector Investment Trends
- 4.10 Emerging Business Models and Commercialization
- 4.11 Industry Developments and Announcements
Chapter 5 U.S. Enterprise Governance, Risk and Compliance Market Supply and Demand Analysis
- 5.1 Demand Trend and Consumption Analysis, 2018-2025
- 5.2 Demand Forecast, 2025-2035
- 5.3 Supply Chain Structure and Procurement Trends
- 5.4 Supply-Demand Gap and Bottlenecks
- 5.5 Import Dependence and Sourcing Structure
- 5.6 Regional Supply and Demand Concentration
Chapter 6 U.S. Enterprise Governance, Risk and Compliance Market Pricing Analysis
- 6.1 Pricing Structure and Measurement
- 6.2 Historical Pricing Trends, 2018-2025
- 6.3 Pricing Outlook, 2025-2035
- 6.4 Pricing by Product and Market Segment
- 6.5 Geographic Pricing Differences
- 6.6 Key Input, Energy, Labor and Logistics Costs
- 6.7 Contract Pricing and Purchasing Models
- 6.8 Pricing Sensitivity and Competitive Positioning
- 6.9 Price, Margin and Profitability Implications
Chapter 7 U.S. Enterprise Governance, Risk and Compliance Market Dynamics
- 7.1 Market Growth Drivers
- 7.1.1 Demand-Side Drivers
- 7.1.2 Technology and Innovation Drivers
- 7.1.3 Infrastructure and Investment Drivers
- 7.1.4 Regulatory and Policy Drivers
- 7.2 Market Restraints
- 7.2.1 Cost and Affordability Constraints
- 7.2.2 Technology and Adoption Barriers
- 7.2.3 Supply Chain and Operational Constraints
- 7.3 Market Challenges
- 7.3.1 Competitive Pressure and Margin Erosion
- 7.3.2 Skills, Infrastructure and Implementation Gaps
- 7.4 Emerging Market Opportunities
- 7.5 Market Dynamics Impact and Time-Horizon Assessment
Chapter 8 U.S. Enterprise Governance, Risk and Compliance Value Chain Analysis
- 8.1 Industry Value Chain Overview
- 8.2 Upstream Suppliers and Critical Inputs
- 8.3 Technology and Component Providers
- 8.4 Manufacturing or Service Delivery
- 8.5 Distribution, Channel Partners and Integrators
- 8.6 Downstream Applications and End Users
- 8.7 Value Addition and Profit Pools
- 8.8 Vertical Integration and Outsourcing
- 8.9 Supplier Concentration and Risk
- 8.10 Supply Chain Localization and Resilience
Chapter 9 U.S. Enterprise Governance, Risk and Compliance Market Regulations and Policies
- 9.1 Relevant Laws, Standards and Compliance Frameworks
- 9.2 Product, Service, Safety and Quality Requirements
- 9.3 Government Policies, Incentives and Subsidies
- 9.4 Imports, Exports and Trade Barriers
- 9.5 Public Procurement and Local Content Requirements
- 9.6 Data Protection, AI and Cybersecurity Compliance
- 9.7 Upcoming Policy Changes and Market Implications
Chapter 10 U.S. Enterprise Governance, Risk and Compliance Market Hotspots and Opportunities
- 10.1 Market Opportunity Mapping and Growth Hotspots
- 10.2 High-Growth Applications and Customer Groups
- 10.3 Underserved Markets and White-Space Opportunities
- 10.4 Emerging Technology and Product Opportunities
- 10.5 New Capacity and Investment Hotspots
- 10.6 Market Entry and Expansion Opportunities
- 10.7 Distribution and Partnership Opportunities
- 10.8 Near-Term and Long-Term Commercial Potential
- 10.9 Opportunity Attractiveness and Execution Risks
Chapter 11 U.S. Enterprise Governance, Risk and Compliance Market Outlook, 2025-2035
- 11.1 Market Size and Analysis
- 11.1.1 Revenue (Market Measurement: 2025: USD 5.55 billion → 2035: USD 17.80 billion)
- 11.1.2 Historical Market Size, 2018-2025
- 11.1.3 Base-Year Market Size, 2025
- 11.2 Market Forecast, 2025-2035
- 11.2.1 Revenue Forecast to 2035
- 11.2.2 CAGR and Year-on-Year Growth
- 11.2.3 Incremental Revenue Opportunity
- 11.3 Forecast Assumptions and Scenario Analysis
- 11.3.1 Base-Case Forecast
- 11.3.2 Optimistic and Conservative Scenarios
- 11.3.3 Technology, Pricing and Policy Sensitivities
- 11.4 Market Attractiveness and Growth Outlook
Chapter 12 U.S. Enterprise Governance, Risk and Compliance Market Segmentation and Outlook
- 12.1 Segmentation Summary and Market Shares, 2025
- 12.2 Largest and Fastest-Growing Segments
- 12.3 By Solution Type - Market Size and Forecast, 2025-2035
- 12.3.1 Segment Definition and Scope
- 12.3.2 Historical Market Size, 2018-2025
- 12.3.3 Revenue Forecast, 2025-2035
- 12.3.4 Base-Year Market Share, 2025
- 12.3.5 Segment CAGR and Growth Drivers
- 12.3.6 Subsegment Market Size and Forecast
- 12.3.6.1 Enterprise and Third-Party Risk Management
- 12.3.6.2 Compliance and Policy Management
- 12.3.6.3 Audit and Internal Controls Management
- 12.3.6.4 Privacy Governance
- 12.3.7 Subsegment Pricing and Adoption Trends
- 12.3.8 Leading Suppliers and Competition
- 12.3.9 Regional Demand and Opportunities
- 12.4 By Component - Market Size and Forecast, 2025-2035
- 12.4.1 Segment Definition and Scope
- 12.4.2 Historical Market Size, 2018-2025
- 12.4.3 Revenue Forecast, 2025-2035
- 12.4.4 Base-Year Market Share, 2025
- 12.4.5 Segment CAGR and Growth Drivers
- 12.4.6 Subsegment Market Size and Forecast
- 12.4.6.1 Software
- 12.4.6.2 Professional Services
- 12.4.6.3 Managed Services
- 12.4.7 Subsegment Pricing and Adoption Trends
- 12.4.8 Leading Suppliers and Competition
- 12.4.9 Regional Demand and Opportunities
- 12.5 By Customer Type - Market Size and Forecast, 2025-2035
- 12.5.1 Segment Definition and Scope
- 12.5.2 Historical Market Size, 2018-2025
- 12.5.3 Revenue Forecast, 2025-2035
- 12.5.4 Base-Year Market Share, 2025
- 12.5.5 Segment CAGR and Growth Drivers
- 12.5.6 Subsegment Market Size and Forecast
- 12.5.6.1 Large Enterprises
- 12.5.6.2 Mid-Market Enterprises
- 12.5.6.3 Small Businesses
- 12.5.7 Subsegment Pricing and Adoption Trends
- 12.5.8 Leading Suppliers and Competition
- 12.5.9 Regional Demand and Opportunities
- 12.6 By End-Use Industry - Market Size and Forecast, 2025-2035
- 12.6.1 Segment Definition and Scope
- 12.6.2 Historical Market Size, 2018-2025
- 12.6.3 Revenue Forecast, 2025-2035
- 12.6.4 Base-Year Market Share, 2025
- 12.6.5 Segment CAGR and Growth Drivers
- 12.6.6 Subsegment Market Size and Forecast
- 12.6.6.1 Banking, Financial Services and Insurance
- 12.6.6.2 Healthcare and Life Sciences
- 12.6.6.3 Technology and IT
- 12.6.6.4 Cross-Sector Enterprises and Public Agencies
- 12.6.7 Subsegment Pricing and Adoption Trends
- 12.6.8 Leading Suppliers and Competition
- 12.6.9 Regional Demand and Opportunities
- 12.7 Segment Growth Comparison
- 12.8 Segment Attractiveness and Priority Matrix
Chapter 13 U.S. Enterprise Governance, Risk and Compliance End-Use and Application Market Outlook
- 13.1 End-Use Industry and Customer Demand Structure
- 13.2 Leading Applications and Customer Groups
- 13.3 End-Use Market Size, Share and Forecast
- 13.4 Major End-Use Industry Deep Dives
- 13.4.1 Customer Requirements and Use Cases
- 13.4.2 Demand and Replacement Cycles
- 13.4.3 Technical and Regulatory Considerations
- 13.4.4 Purchasing and Procurement Models
- 13.4.5 Leading Vendors and Distribution Channels
- 13.4.6 Forecast and Commercial Opportunities
- 13.5 Emerging Applications and Cross-Segment Demand
- 13.6 End-Use Industry Investment Priorities
Chapter 14 U.S. Enterprise Governance, Risk and Compliance Geographic Market Outlook, 2025-2035
- 14.1 Domestic Market Distribution and Demand Clusters
- 14.2 State- or Province-Wise Market Size and Forecast, 2025-2035
- 14.3 City and Metropolitan Market Outlook
- 14.4 Industrial, Manufacturing and Commercial Clusters
- 14.5 Geographic Concentration of Key End Users
- 14.6 Local Pricing and Purchasing Differences
- 14.7 Domestic Production Facilities and Capacity Map
- 14.8 Local Infrastructure and Project Pipeline
- 14.9 State-Level Policy and Incentive Differences
- 14.10 Subnational Investment Hotspots and Opportunities
- 14.11 Distribution and Logistics Networks
- 14.12 Domestic Competitive Footprint
Chapter 15 U.S. Enterprise Governance, Risk and Compliance Technology, Innovation and Sustainability Outlook
- 15.1 Technology Landscape and Maturity
- 15.2 Product, Process and Service Innovation
- 15.3 AI, Automation and Digital Tools in the Industry
- 15.4 Technology Adoption and Performance Benchmarking
- 15.5 Innovation Pipeline and R&D Investment
- 15.6 Patent and Intellectual Property Trends
- 15.7 Energy Efficiency and Resource Management
- 15.8 Sustainability, Recycling and Circularity
- 15.9 Technology Roadmap, 2025-2035
- 15.10 Risks of Obsolescence and Technology Substitution
Chapter 16 U.S. Enterprise Governance, Risk and Compliance Market Key Strategic Imperatives
- 16.1 Growth and Market Entry Priorities
- 16.2 High-Return Products and Segments
- 16.3 Pricing, Profitability and Cost Optimization
- 16.4 Technology Investment and Product Differentiation
- 16.5 Supply Chain Localization and Resilience
- 16.6 Distribution and Customer Acquisition
- 16.7 Partnership, Acquisition and Capacity Strategy
- 16.8 Regional Expansion Priorities
- 16.9 Short-, Medium- and Long-Term Actions
Chapter 17 Competition Outlook
- 17.1 Industry Competition Characteristics
- 17.2 Market Structure and Concentration
- 17.3 Market Share and Competitive Positioning, 2025
- 17.4 Company-Wise Revenue and Product Benchmarking
- 17.5 Production and Service Capacity Benchmarking
- 17.6 Technology, Pricing and Differentiation
- 17.7 Regional Footprint and Distribution Strength
- 17.8 Mergers, Acquisitions and Strategic Alliances
- 17.9 New Entrants and Competitive Threats
- 17.10 Porter's Five Forces and Industry Attractiveness
- 17.11 Competitive Outlook, 2025-2035
Chapter 18 Company Profiles
- 18.1 Company Coverage and Selection Criteria
- 18.2 ServiceNow
- 18.2.1 Business Description
- 18.2.2 Company Ownership and Geographic Presence
- 18.2.3 Product and Service Portfolio
- 18.2.4 Manufacturing and Operating Footprint
- 18.2.5 Financial Performance and Investment
- 18.2.6 Market Share and Competitive Position
- 18.2.7 Technology and Innovation Capabilities
- 18.2.8 Strategic Alliances or Partnerships
- 18.2.9 Recent Developments
- 18.2.10 Growth Strategy and Outlook
- 18.3 OneTrust
- 18.4 NAVEX
- 18.5 Optro (formerly AuditBoard)
- 18.6 Workiva
- 18.7 IBM
- 18.8 MetricStream
- 18.9 SAP
- 18.10 Oracle
- 18.11 LogicGate
- 18.12 Other Relevant Market Participants
Note: Every listed company is profiled on the structure shown under the first company. The company list is preliminary and may change based on research findings, market developments, data availability and client requirements.
Chapter 19 Disclaimer
- 19.1 Research and Forecast Disclaimer
- 19.2 Data Source and Estimation Limitations
Note: The depth of individual sections depends on data availability for this market. Volume, capacity, trade and other unit-based metrics are included where applicable.

